phmsa pipeline enforcement - central arkansas · pdf file•dec 11, 2012: rupture of a...
TRANSCRIPT

U.S. Department of Transportation Pipeline and Hazardous Materials Safety Administration
NACE Central Area Conference
August 28, 2013 William Lowry, PE
Community Assistance and Technical Services Mgr, Southwest Region
USDOT/PHMSA
1
PHMSA Pipeline Safety Program Update

U.S. Department of Transportation Pipeline and Hazardous Materials Safety Administration
Today’s Agenda
• Underlying Principles
• Data
• Enforcement Statistics
• Incident/Accident Response
• Look Ahead
2

U.S. Department of Transportation Pipeline and Hazardous Materials Safety Administration
What PHMSA Regulates
Pipeline Miles by System Types –as-of 4/11/2013 System Type Miles % Total # Operators
Hazardous Liquid 182,613 7% 381 Gas Transmission 304,873 12% 923 Gas Gathering 19,872 1% 320 Gas Distribution
Mains -- Services --
2,114,990 80% 1318 1,233,249 46%
881,741 34% Total 2,622,348
Liquefied Natural Gas 129 Plants 200 Tanks 80 Operators
HL Breakout Tanks 6448 Tanks 93 Operators
3

U.S. Department of Transportation Pipeline and Hazardous Materials Safety Administration
Gas Transmission : 304,558 miles Hazardous Liquids : 182,524 miles
- 4 - 4
U.S. Department of Transportation Pipeline and Hazardous Materials Safety Administration
Underlying Principles
• It is the responsibility of pipeline operators to understand and manage the risks associated with their pipelines
• PHMSA’s primary role is to establish minimum safety standards (defined in the regulations by required risk control practices) and to verify that the operators perform to these standards
• PHMSA also strives to impact operator performance beyond mere compliance with the regulations
5

U.S. Department of Transportation Pipeline and Hazardous Materials Safety Administration
Categories of Incident Reports All Reported – everything operators report
Serious – fatality or injury requiring in-patient hospitalization, but Fire First excluded. Fire First are gas distribution incidents with a cause of “Other Outside Force Damage” and sub-cause of “Nearby Industrial, Man-made, or Other Fire/Explosion”
Significant include any of the following, but Fire First excluded: 1. Fatality or injury requiring in-patient hospitalization 2. $50,000 or more in total costs, measured in 1984 dollars 3. Highly volatile liquid (HVL) releases of 5 barrels or more 4. Non-HVL liquid releases of 50 barrels or more 5. Liquid releases resulting in an unintentional fire or explosion
6

U.S. Department of Transportation Pipeline and Hazardous Materials Safety Administration
Serious Incidents Downward Trend Continues in 2012
Serious Incident – fatality or injury requiring in-patient hospitalization 7

U.S. Department of Transportation Pipeline and Hazardous Materials Safety Administration
Significant Incidents Downward Turn in 2012
Significant incidents include any of the following: 1. Fatality or injury requiring in-patient hospitalization; 2. $50,000 or more in total costs, measured in 1984 dollars 3. Highly volatile liquid (HVL) releases of 5 barrels or more; 4. Non-HVL liquid releases of 50 barrels or more; and 5. Liquid releases resulting in an unintentional fire or explosion
8

U.S. Department of Transportation Pipeline and Hazardous Materials Safety Administration
2012 Hazardous Liquid Incidents
9
Top Causes for All Reported & Significant Categories
• Material/ Weld/Equip Failure
• Corrosion
• Incorrect Operation
9

U.S. Department of Transportation Pipeline and Hazardous Materials Safety Administration
2012 Gas Transmission Incidents
10
Top Causes for All Reported & Significant categories
• Material/Weld/ Equip Failure
• Corrosion
10

U.S. Department of Transportation Pipeline and Hazardous Materials Safety Administration
2012 Gas Distribution Incidents
Top Causes for all incident categories: • Other Outside
Force Damage • Excavation
Damage • Other
11
11

U.S. Department of Transportation Pipeline and Hazardous Materials Safety Administration
Significant Accident Breakdown Total by Type (Fatalities)
Total for All Types1
Hazardous Liquid
Gas Transmission
Gas Distribution
2010 259 (19) 121 (1) 79 (10) 54 (8) 2011 284 (12) 139 (1) 83 (0) 60(11) 2012 244 (10) 129 (3) 62 (0) 49 (7)
3 Year Average
(2010-2012) 262 (14) 130 (2) 75 (3) 54 (9)
5 Year Average
(2008-2012) 268 (12) 124 (2) 74 (2) 62 (8)
10 Year Average
(2003-2012) 281 (15) 122 (2) 77 (2) 73 (11)
12 1 includes gas gathering (zero fatality) - excludes “fire first” incidents; data as of 03/29/2013

U.S. Department of Transportation Pipeline and Hazardous Materials Safety Administration
Context Measures
0.0
0.2
0.4
0.6
0.8
1.0
1.2
1.4
1986 1990 1994 1998 2002 2006 2010
Index (1988 = 1)
Calendar Year
Pipeline Safety with Context Measures (1988-2012)
Nat. GasConsumption
PetroleumProductConsumption
PipelineMileage
U.S. population
Spills withenvironmentalconsequences
Incidentsw/death ormajor injury
Data Sources: Energy Information Administration, Census Bureau, PHMSA Annual Report Data, PHMSA Incident Data - as of April 1, 2013
13
U.S. Department of Transportation Pipeline and Hazardous Materials Safety Administration
Enforcement Statistics
14
U.S. Department of Transportation Pipeline and Hazardous Materials Safety Administration
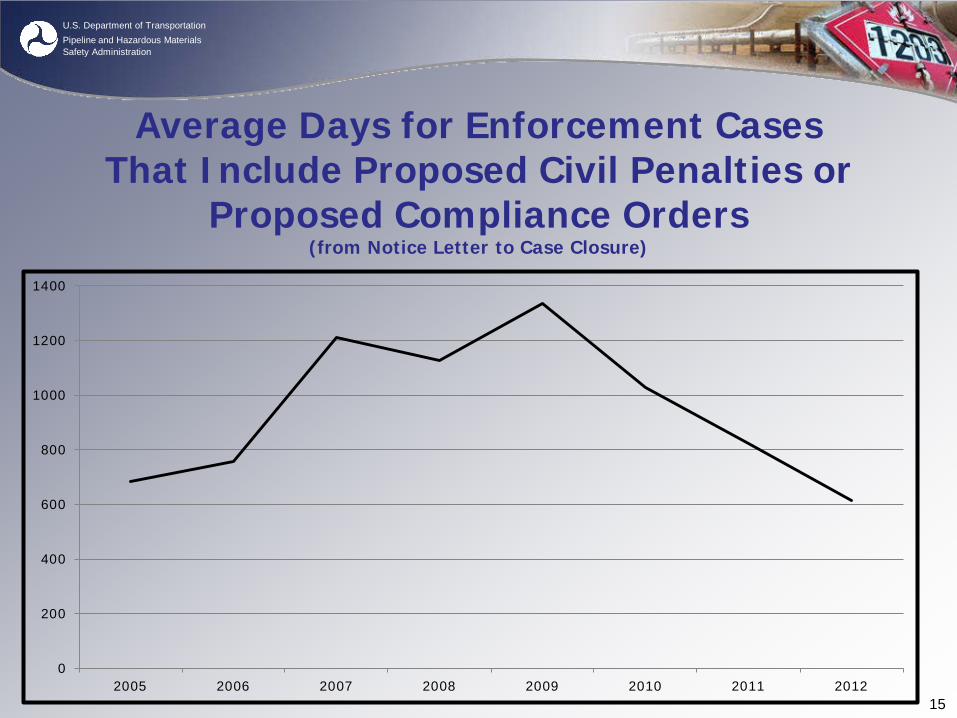
Average Days for Enforcement Cases That Include Proposed Civil Penalties or
Proposed Compliance Orders (from Notice Letter to Case Closure)
0
200
400
600
800
1000
1200
1400
2005 2006 2007 2008 2009 2010 2011 201215

U.S. Department of Transportation Pipeline and Hazardous Materials Safety Administration
PHMSA Enforcement Actions
Year Enforcement Orders Issued
2000 7 2001 41 2002 58 2003 93 2004 78 2005 92 2006 104 2007 37 2008 52 2009 112 2010 109 2011 120 2012 116
16

U.S. Department of Transportation Pipeline and Hazardous Materials Safety Administration
Civil Penalties Proposed
$0
$1
$2
$3
$4
$5
$6
$7
$8
$9
$10
2000 2001 2002 2003 2004 2005 2006 2007 2008 2009 2010 2011 2012
Civ
il P
enal
ties
in M
illio
ns
17

U.S. Department of Transportation Pipeline and Hazardous Materials Safety Administration
Most Cited Corrosion Regulations Both Gas and Hazardous Liquid Pipelines
(2002 – Present)
Parts 192 and 195 Citation
Total Number of Individual
Items
Notices of Probable Violation
Notices of Amendment
Warning Items
195.571 Adequacy of Cathodic Protection 56 20 26 10
195.589(c) Maintain Records 53 17 13 23
195.573(e) External Corrosion Corrective Action 49 30 13 6
192.465(d) External Corrosion Remedial Action 42 24 3 15
192.465(a) External Corrosion Annual Testing 39 14 4 21
192.463(a) Cathodic Protection 35 9 14 12
192.491(c) Corrosion Control Test Records 34 16 4 14
195.573(c) External Corrosion Rectifiers 32 12 6 14
195.573(a)(1) Required Testing for Cathodic Protection 31 21 1 9
195.579(a) Internal Corrosion 30 14 11 5 18

U.S. Department of Transportation Pipeline and Hazardous Materials Safety Administration
Corrosion Related Major Enforcement Actions in 2012
• $1,000,000 penalty assessed for an individual violation linked an accident involving a release of crude oil.
The violation resulted from operators failure to properly consider corrosion and cracking assessments it had performed, and its failure to integrate the information from these assessments to properly ensure pipeline integrity
19
U.S. Department of Transportation Pipeline and Hazardous Materials Safety Administration
Corrosion Related Major Enforcement Actions in 2012
• $92,300 penalty assessed against operator for four corrosion related violations that were discovered during a multi-state inspection: atmospheric corrosion monitoring, rectifier inspections, pipe to soil potentials, and timely remediation of identified deficiencies
• $40,000 penalty assessed against operator for a violation for its failure to monitor separately protected short sections; specifically steel drips ( for low pressure system water collection)
20

U.S. Department of Transportation Pipeline and Hazardous Materials Safety Administration
Incident/Accident Response
21

U.S. Department of Transportation Pipeline and Hazardous Materials Safety Administration
Incident/Accident Response • National Response Center reporting
• Information Loop (timely, accurate information critical) – Reports and briefings for government leadership
– Congressional, media
• Action Loop – Incident response and investigation
– Enforcement action
• Interagency coordination: NTSB, EPA, USCG, IG, DOJ
22

U.S. Department of Transportation Pipeline and Hazardous Materials Safety Administration
Pipeline Accidents • Marshall, Michigan (Federally Regulated)
– Major Crude Oil Spill Dramatically Impacted Several Communities in Michigan
• San Bruno, California (State Regulated) – Major tragedy – Unimaginable Proportions
• Allentown, Pennsylvania (State Regulated) – Cast Iron, low pressure
• Excavation Damage Fatalities (State Regulated) – Texas, North Dakota, Georgia – to name a few
• Yellowstone River (Federally Regulated) – Significant Oil Spill near Billings, MT
• Bison Pipeline (Federally Regulated) – Newly constructed natural gas pipeline
23

U.S. Department of Transportation Pipeline and Hazardous Materials Safety Administration
Recent High Profile Incidents • Chevron; Salt Lake City, Utah (Interstate)
– Crude oil and refined products – Multiple accidents: 6/10, 12/10, 3/13
• Sissonville, West Virginia (Interstate) – Impact to major interstate highway; questions on HCA
determination – Led to Congressional oversight hearing – NTSB investigation
• Mayflower, Arkansas (Interstate) – Canadian heavy crude – Investigation underway
24

U.S. Department of Transportation Pipeline and Hazardous Materials Safety Administration
Chevron; Salt Lake City, Utah • 8-inch – diesel fuel
• Corrosion along pipe seam with overall general corrosion
• ERW pipe seam had low toughness
25

U.S. Department of Transportation Pipeline and Hazardous Materials Safety Administration
Sissonville, WV Pipeline Incident • Dec 11, 2012: Rupture of a 20,” X-60 gas transmission pipeline
(1967 vintage)

U.S. Department of Transportation Pipeline and Hazardous Materials Safety Administration
Sissonville Pipeline Incident
• No injuries or fatalities (thankfully)
• 3 homes destroyed, others damaged
• Interstate 77 damaged and temporarily closed
• 3 pipelines in vicinity – 20”, 26” and 30”
• PHMSA issued Corrective Action Order
• NTSB investigated cause
27

U.S. Department of Transportation Pipeline and Hazardous Materials Safety Administration
Mayflower, AR Pipeline Accident
• March 29, 2012: 20” crude oil pipeline ruptured in Mayflower, Arkansas
• ~ 5,000 bbls of crude spilled
• Pipeline carrying Canadian crude oil (Wabusca) from Patoka, Illinois to Nederland, Texas
• Pipeline installed - 1947/1948.
28

U.S. Department of Transportation Pipeline and Hazardous Materials Safety Administration
Mayflower Pipeline Incident
• Pipeline flow reversal project was completed in 2006
• Line from Patoka, IL to Nederland, TX has been shut in pending the results of the investigation
• Considerable media attention
29
U.S. Department of Transportation Pipeline and Hazardous Materials Safety Administration
Incidents like these and others in past years helped to form the
focus of
PHMSA’s 2013 Agenda…
30

U.S. Department of Transportation Pipeline and Hazardous Materials Safety Administration
PSA of 2011 - Mandates • 42 Mandates in Pipeline Safety, Regulatory Certainty, and Job
Creation Act (PSA) of 2011
• Includes 9 required studies (Leak Detection, Cover over Buried Pipelines, R&D, Diluted Bitumen, Cast Iron, Damage Prevention, Expansion of IMP, Gathering Lines,…)
• Other topics include: – MAOP Records Verification,
– Tests to Confirm Material Strength of Previously Untested GT in HCAs
– 1 hour Notification of Incidents,
– Automatic/Remote Shut-off Valves
31

U.S. Department of Transportation Pipeline and Hazardous Materials Safety Administration
NTSB Recommendations • 27 NTSB recommendations:
– ERW Pipe Seam Study/Implementation – Emergency Response Information Sharing
• Operator Sharing Plan Information • 911 Notification (Operator and 911 info exchange)
– ASVs/RCVs – Removal of Grandfather Clause for Gas Transmission – ILI Piggable Gas Transmission Pipelines – Pressure testing of Gas Transmission (w/ spike test)
32

U.S. Department of Transportation Pipeline and Hazardous Materials Safety Administration
Nominal Pipe Size data as of 7-1-2013 from Part H
33

U.S. Department of Transportation Pipeline and Hazardous Materials Safety Administration
Specified Minimum Yield Strength data as of 7-1-2013 from Part K
34 34

U.S. Department of Transportation Pipeline and Hazardous Materials Safety Administration
Decade Installed data as of 7-1-2013 from Part J
35

U.S. Department of Transportation Pipeline and Hazardous Materials Safety Administration
PSA of 2011, §23 – MAOP Mandate
• Verify records for Class Locations 3 & 4 and HCAs
• Reconfirm MAOP for pipe with incomplete records
– 5,401 miles with Incomplete Records in Class 3 & 4 and HCAs
• Strength test all untested pipe in HCAs operating at > 30% SMYS
– 3,220 HCA miles with Pressure Test < 1.1 MAOP
Gas Transmission 2012 Annual Report data as-of 7-1-2013 36
U.S. Department of Transportation Pipeline and Hazardous Materials Safety Administration
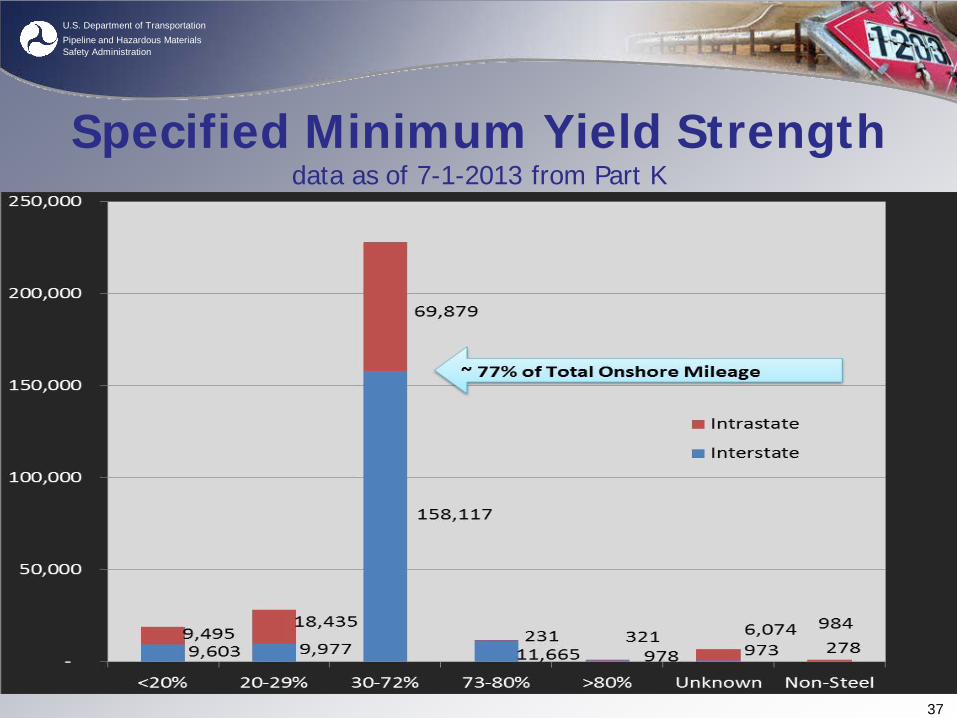
Specified Minimum Yield Strength data as of 7-1-2013 from Part K
37

U.S. Department of Transportation Pipeline and Hazardous Materials Safety Administration
NTSB Recommendation P-11-14 • Eliminate Grandfather clause and require hydrotest with a spike
test for all pre-1970 pipe
– 55,120 miles Grandfathered miles reported 192.619(c) (22,717) and 192.619(a)(3) (32,403)
– 93,817 miles with Pressure Test < 1.1 times MAOP
– 20,272 miles with Stress Level > 72% SMYS or Unknown. Except for Special Permit/Alt MAOP pipelines, PHMSA expects this mileage is Grandfathered.
• PHMSA expects that Grandfather miles and Pressure Test < 1.1 MAOP are actually close to same #
• Somewhere between 55 and 94 thousand miles
Gas Transmission 2012 Annual Report data as-of 7-1-2013 38

U.S. Department of Transportation Pipeline and Hazardous Materials Safety Administration
Pressure Test Range
Pressure Test Range Total Miles % Total
PT ˂ 1.1 MAOP or no PT 93,817 31%
1.25 MAOP > PT ≥ 1.1 MAOP 19,131 6%
PT ≥ 1.25 MAOP 187,628 62%
Gas Transmission 2012 Annual Report data, Part R, as-of 7-1-2013 39

U.S. Department of Transportation Pipeline and Hazardous Materials Safety Administration
Pressure Test < 1.1 MAOP data as of 7-1-2013 from Part R
40

U.S. Department of Transportation Pipeline and Hazardous Materials Safety Administration
Operating Stress Levels over 72% SMYS & Unknown
% SMYS Interstate Intrastate Total
> 72 to 80 11,665 231 11,895
> 80 978 321 1,299
Unknown 973 6,074 7,038
Miles operating between 72 and 80% SMYS are either Grandfathered, Special Permit, or Alternative MAOP under 619(d)
Miles with Unknown SMYS are Grandfathered
Gas Transmission 2012 Annual Report data, Part K, as-of 7-1-2013 41

U.S. Department of Transportation Pipeline and Hazardous Materials Safety Administration
Data Summary by HCA and Class Location
data as of 7-1-2013 from Part Q
Location Total GT Miles
% in HCA GT HCA Miles
Non-HCA Miles
Class 1 237,756 0.7 1,660 236,096
Class 2 30,210 4.7 1,412 28,798
Class 3 32,613 48.6 15,854 16,759
Class 4 962 78.2 752 209
Total 301,540 19,678 281,862
42

U.S. Department of Transportation Pipeline and Hazardous Materials Safety Administration
NTSB Recommendation P-11-15
Manufacturing & Construction Defects Considered Stable Only for Pipe with Pressure Test ≥ 1.25 times MAOP
• 3,220 GT HCA Miles with Pressure Test < 1.25 MAOP
– 1,483 miles ILI Able
– 1,737 miles ILI Not Able
Gas Transmission 2012 Annual Report data as-of 7-1-2013 43

U.S. Department of Transportation Pipeline and Hazardous Materials Safety Administration
Pressure Test < 1.25 MAOP data as of 7-1-2013 from Part R
- 44 -
44

U.S. Department of Transportation Pipeline and Hazardous Materials Safety Administration
NTSB Recommendation P-11-17
Configure all lines to accommodate smart pigs, with priority given to older lines
• ILI Piggable 60% of Total
• 118,947 miles ILI Not Able 40% of Total
• 69,579 miles Diameter ≤ 8-inch 23% of Total
• 44,600 miles Diameter ≤ 6-inch 15% of Total
• ???? miles ILI Not Able due to system configuration
Gas Transmission 2012 Annual Report data as-of 7-1-2013 45

U.S. Department of Transportation Pipeline and Hazardous Materials Safety Administration
ILI Able vs Not Able Part R Total Miles ILI Able ILI Not Able
Class 1 - HCA 1,658 1,380 278 - non-HCA 234,851 146,035 88,816Class 2 - HCA 1,409 1,152 257 - non-HCA 28,978 15,073 13,905Class 3- HCA 15,850 10,469 5,381 - non-HCA 16,751 6,924 9,827Class 4 - HCA 752 366 386 - non-HCA 209 112 97TOTAL 300,458 181,511 118,947
Gas Transmission 2012 Annual Report data as-of 7-1-2013 46

U.S. Department of Transportation Pipeline and Hazardous Materials Safety Administration
Integrity Verification Process
47

U.S. Department of Transportation Pipeline and Hazardous Materials Safety Administration
Integrity Verification Process
• GOAL:
Establish a comprehensive program to effectively
address Congressional Mandates and NTSB
Recommendations.
48
U.S. Department of Transportation Pipeline and Hazardous Materials Safety Administration
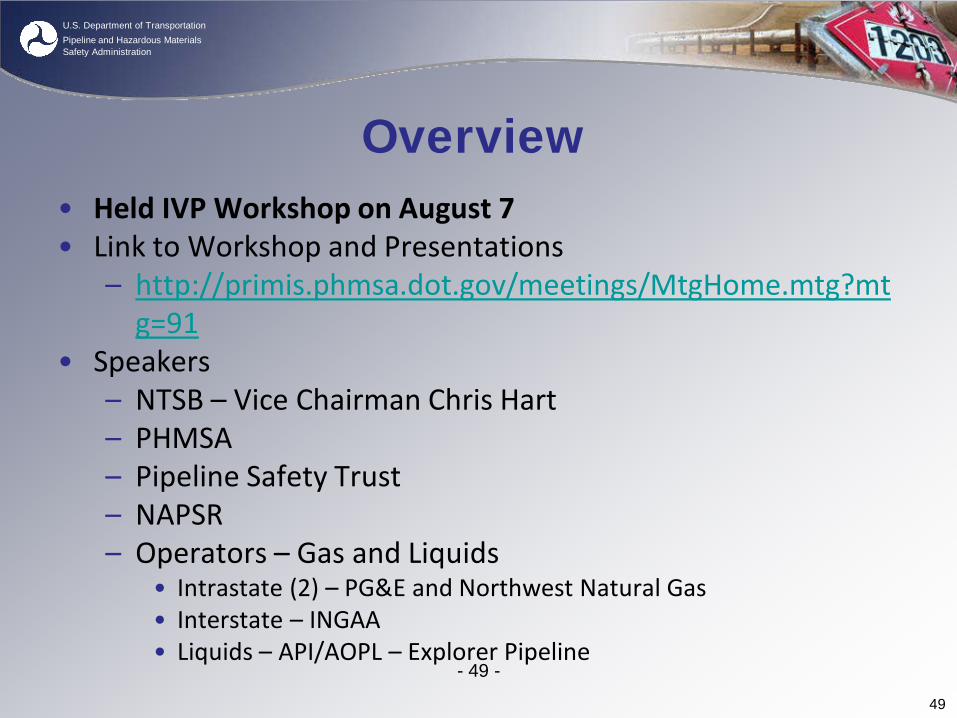
Overview • Held IVP Workshop on August 7 • Link to Workshop and Presentations
– http://primis.phmsa.dot.gov/meetings/MtgHome.mtg?mtg=91
• Speakers – NTSB – Vice Chairman Chris Hart – PHMSA – Pipeline Safety Trust – NAPSR – Operators – Gas and Liquids
• Intrastate (2) – PG&E and Northwest Natural Gas • Interstate – INGAA • Liquids – API/AOPL – Explorer Pipeline
- 49 -
49

U.S. Department of Transportation Pipeline and Hazardous Materials Safety Administration
Integrity Verification
Process (IVP) Chart
Based upon
Congressional Mandates and NTSB Recommendations
50

U.S. Department of Transportation Pipeline and Hazardous Materials Safety Administration
Basic Principles of IVP Approach
• IVP is based on 4 principles
1. Apply to higher risk locations
– High Consequence Areas (HCAs) and Moderate Consequence Areas (MCAs)
2. Screen segments for categories of concern (e.g., “Grandfathered” segments)
3. Assure adequate material and documentation
4. Perform assessments to establish MAOP
51
U.S. Department of Transportation Pipeline and Hazardous Materials Safety Administration
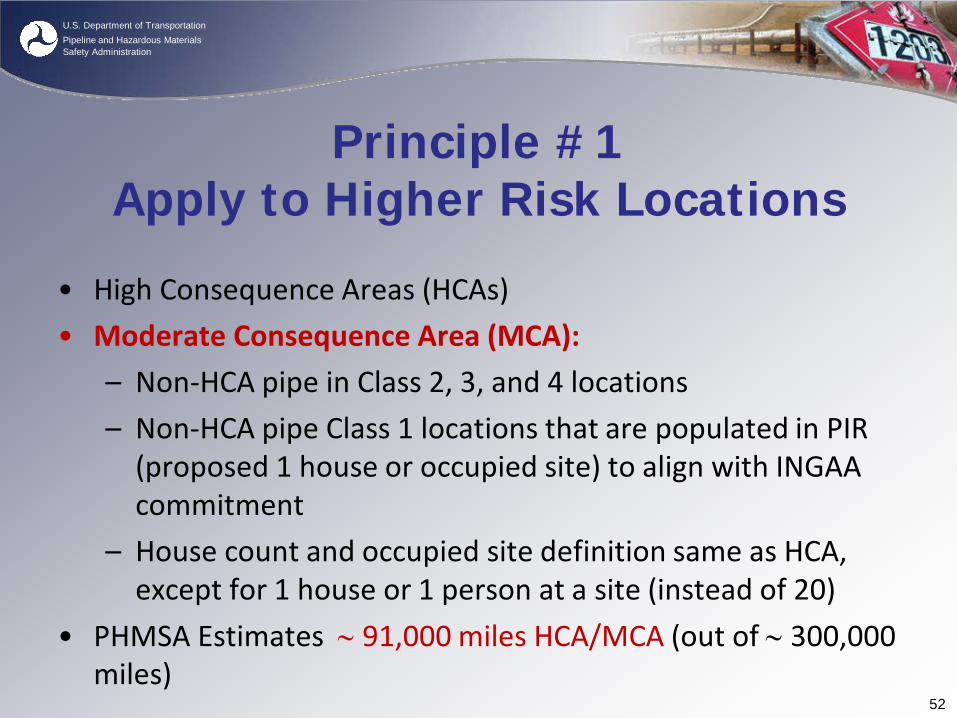
Principle #1 Apply to Higher Risk Locations
• High Consequence Areas (HCAs) • Moderate Consequence Area (MCA):
– Non-HCA pipe in Class 2, 3, and 4 locations – Non-HCA pipe Class 1 locations that are populated in PIR
(proposed 1 house or occupied site) to align with INGAA commitment
– House count and occupied site definition same as HCA, except for 1 house or 1 person at a site (instead of 20)
• PHMSA Estimates ∼ 91,000 miles HCA/MCA (out of ∼ 300,000 miles)
52

U.S. Department of Transportation Pipeline and Hazardous Materials Safety Administration
HCAs and Est. MCA Mileage • Scope of Proposed IVP Process Estimated to Apply to:
– Total Estimated HCA + MCA Mileage = ∼ 91,000 miles
PHMSA estimates approximately 33,000 miles of GT pipe (approximately 11% of total GT mileage) would meet screening criteria & require IVP assessment to establish MAOP – IVP Process Steps 1 – 12 based upon 2012 Annual Report Data.
Total HCA Non-HCA MCA Class 1 237,756 1,660 236,096 (est.) 25,394
Class 2 30,210 1,412 28,798 28,798
Class 3 32,613 15,854 16,759 16,759
Class 4 962 752 209 209
Total 301,540 19,678 281,862 (est.) 71,160
53

U.S. Department of Transportation Pipeline and Hazardous Materials Safety Administration
Principle #2 Screen for Categories of Concern
• Apply process to pipeline segments with:
– Grandfathered Pipe • Based upon 5-year highest actual operating pressure of segment prior to
July 1, 1970
– Operating pressures over 72% SMYS • pre-Code – Grandfathered Pipe
– Lack of Records to Substantiate MAOP
– Lack of Adequate Pressure Test
– History of Failures Attributable to M&C Defects 54

U.S. Department of Transportation Pipeline and Hazardous Materials Safety Administration
Principle #3 Know & Document Pipe Material
• If Missing or Inadequate Validated Traceable Material Documentation, then Establish Material Properties by an approved process:
– Cut out and Test Pipe Samples (Code approved process)
– In Situ Non-Destructive Testing (if validated and Code approved)
– Field verification of code stamp for components such as valves, flanges, and fabrications
– Other verifications 55

U.S. Department of Transportation Pipeline and Hazardous Materials Safety Administration
Principle #4 Assessments to Establish MAOP
• Allow Operator to Select Best Option to Establish MAOP
• Candidate IVP Options for Establishing MAOP
– Subpart J Test with Spike Test
– Derate pressure
– Engineering Critical Assessment
– Replace
– Other options PHMSA should consider?
56

U.S. Department of Transportation Pipeline and Hazardous Materials Safety Administration
Draft - Process Steps • 21 Step Process
– Grandfather Clause and MAOP Review – Process Steps 1 – 4
– Integrity Review – Process Steps 5 – 8
– Low Stress Review – Process Steps 9 – 12
– Material Documentation Review – Process Steps 13 – 15
– Assessment and Analysis Review – Process Steps 16 – 20
– Implementation – Process Step 21
– Deadlines for Implementation 57

U.S. Department of Transportation Pipeline and Hazardous Materials Safety Administration
Specific Guidelines & Criteria
• IVP Chart is high level concept • Details and specifications under development
– Will use knowledge from workshop and comments on web site to develop details
– Details to Develop: • Spike pressure test specs (pressure, hold time, etc.) • De-rate criteria (amount of MAOP reduction) • ILI program requirements and specifications • Material verification specs (# of cutouts, etc.)
58

U.S. Department of Transportation Pipeline and Hazardous Materials Safety Administration
• Implementation Timeframe
– Multi-Year Effort
– Graduated timeframes with priority to:
• Legacy (LF-ERW /Seam Issue) pipe segments
• HCAs
• High Stress segments
• Proposed deadlines under development
Target Completion Timeframes
59

U.S. Department of Transportation Pipeline and Hazardous Materials Safety Administration
A Look Ahead - Inspections
• Inspections:
– Data driven, risk informed inspection process
– Review integrity management implementation
– Review records confirming MAOP/MOP
– Construction quality
• Oil spill response program drill participation
60

U.S. Department of Transportation Pipeline and Hazardous Materials Safety Administration
A Look Ahead - Programs • Setting Our Own Course
– IMP 1.0 – good progress, but plenty of work undone • Records and data gaps, incomplete knowledge of “environment”
around pipe, interacting threats, etc.
– IMP 2.0 – warm up to multi-day workshops Fall 2013 • Leak detection, valves, metrics, missing Safety Management
Systems elements: employee involvement; near miss/voluntary reporting; audits; contractor alignment, flow down, and oversight, etc.
– Stronger State Programs – including enforcement – Advocating Innovative Rate Recovery in States – Continued focus on construction issues
61

U.S. Department of Transportation Pipeline and Hazardous Materials Safety Administration
A Look Ahead - Challenges • Unrealistic Expectations and Inadequate Resources
– The Congress Gives Work, But Not Much Help
• Potential Backlash Against Performance Based Regulation
• Workforce Development – Finding/Creating a Diverse and Qualified Workforce in a Competitive Labor Market
• Slow pace of Technology Innovation Needed for More Efficient/Effective Detection, Characterization, and Mitigation
• Inability to Be All Things to All Parties While Maintaining a Steady and Progressive Course Forward
62

U.S. Department of Transportation Pipeline and Hazardous Materials Safety Administration
Resources • PHMSA web sites:
– http://primis.phmsa.dot.gov/comm/ • Includes damage prevention initiatives, info on grants,
incident information and more – resource links based on audience
– http://www.phmsa.dot.gov/pipeline • Includes PHMSA-wide, HazMat and Pipeline
information, forms, regulatory actions, etc.
– Sites are linked
63

U.S. Department of Transportation Pipeline and Hazardous Materials Safety Administration
Thank you!
64

U.S. Department of Transportation Pipeline and Hazardous Materials Safety Administration
NACE Central Area Conference
August 28, 2013
William Lowry, PE Community Assistance and Technical Services (CATS) Office of Pipeline Safety
USDOT/PHMSA Southwest Region
713.272.2845
65