phoenix, az flare gas recovery for algal protein...
TRANSCRIPT
FlareGasRecoveryforAlgalProteinProduction
C.M.Beal1,F.T.Davidson2,M.E.Webber2,J.C.Quinn3
1 B&DEngineeringandConsultingLLC,7419StateHwy789,Lander,WY2 TheUniversityofTexasatAustin,1UniversityStation,Austin,TX
3 ColoradoStateUniversity,1Isotopedrive,FortCollins,CO
1
Phoenix,Az
Acknowledgements• Financialsupportprovidedby– U.S.DepartmentofEnergy(DE-EP0000011)– AlfredP.SloanFoundation,andtheCynthiaandGeorgeMitchellFoundation
– ColoradoStateUniversity• Specialthanksto:– DannaQuinn– BarbandFred
2
Outline
• FlareGas&Algae• GeneralOverviewofMethods– EnergyReturnonInvestment– LifeCycleAssessment– ModeledScenarios
• Results– Potential– Comparisontoliterature
• FutureDirection
3
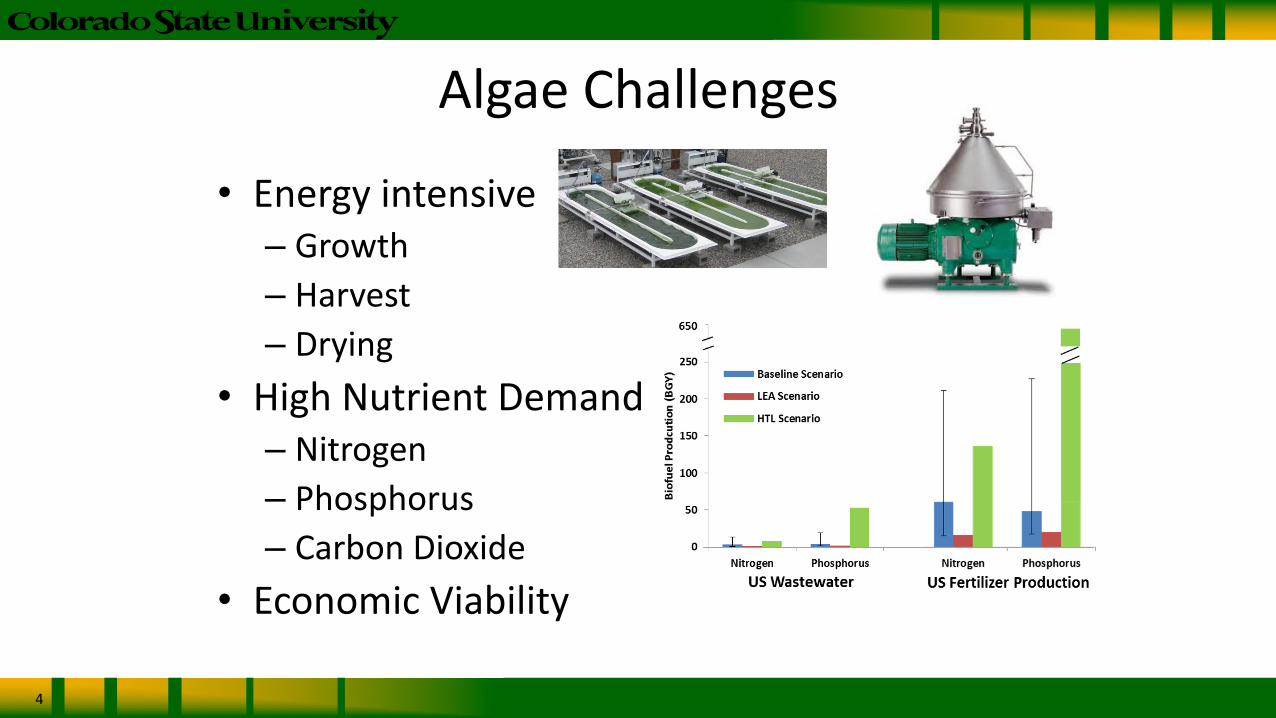
AlgaeChallenges
• Energyintensive– Growth– Harvest– Drying
• HighNutrientDemand– Nitrogen– Phosphorus– CarbonDioxide
• EconomicViability
4
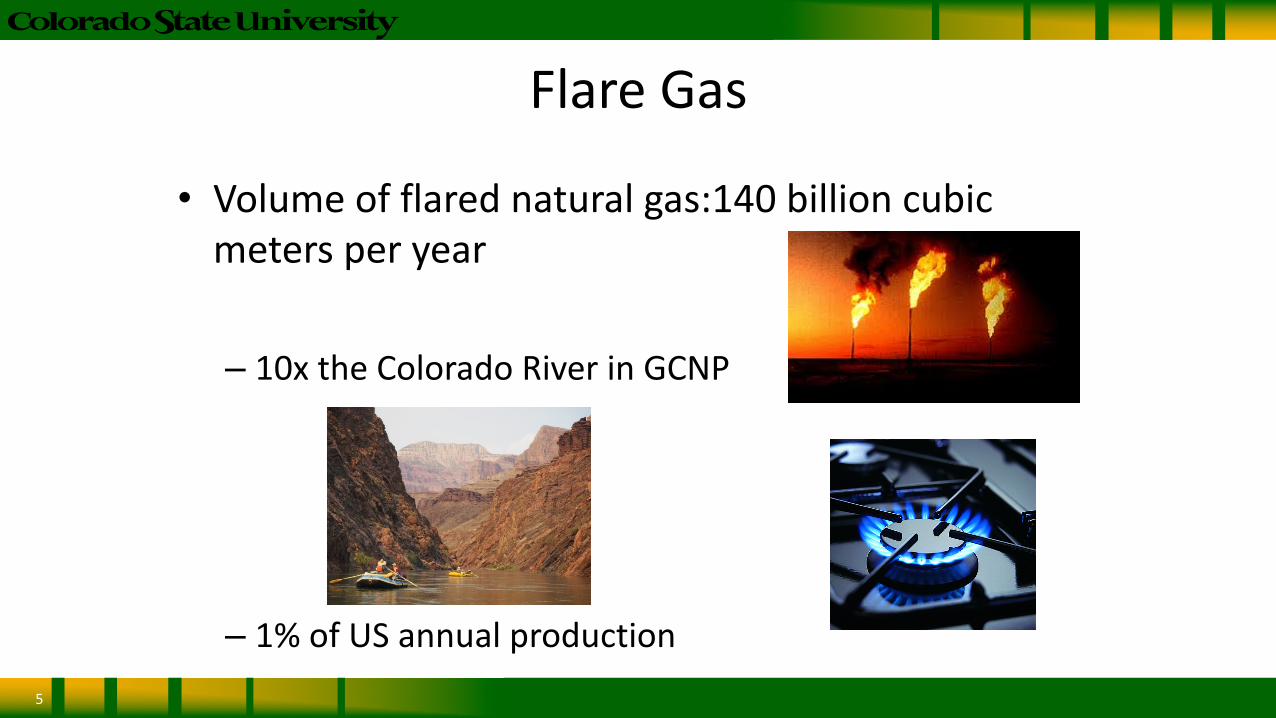
FlareGas
5
• Volumeofflarednaturalgas:140billioncubicmetersperyear
– 10xtheColoradoRiverinGCNP
– 1%ofUSannualproduction
GlobalChallenges
6
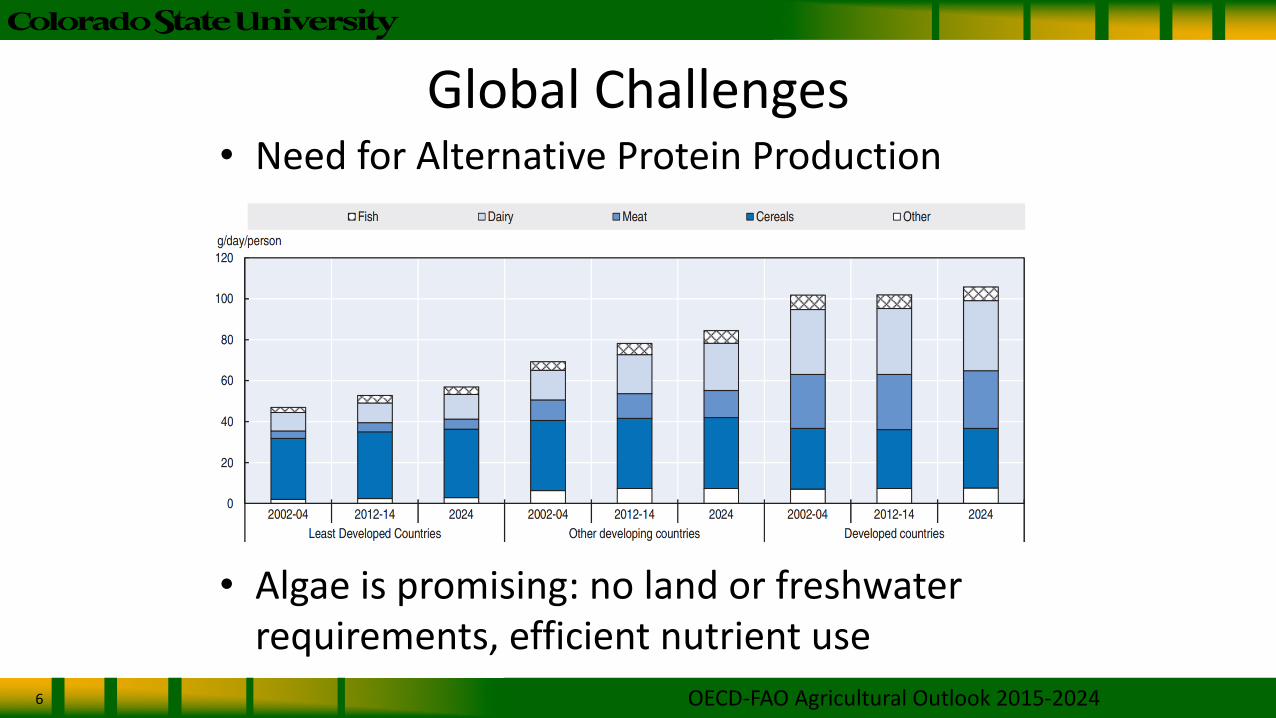
• NeedforAlternativeProteinProduction
• Algaeispromising:nolandorfreshwaterrequirements,efficientnutrientuse
OECD-FAOAgriculturalOutlook2015-2024
FlareGas+AlgaeSynergy
Couplingflaregasandalgaecan:1) Generatesecond-generationbiofuels2) Produceproteinforagrowingpopulation3) Increaseomega-3production4) Eliminateenvironmentaldamageofflaring
Productionrequiresnoarableland,freshwater,externalN,orexternalCO2.
7
Outline
• FlareGas&Algae• GeneralOverviewofMethods– EnergyReturnonInvestment– LifeCycleAssessment– ModeledScenarios
• Results– Potential– Comparisontoliterature
• FutureDirection
8

Methods
9
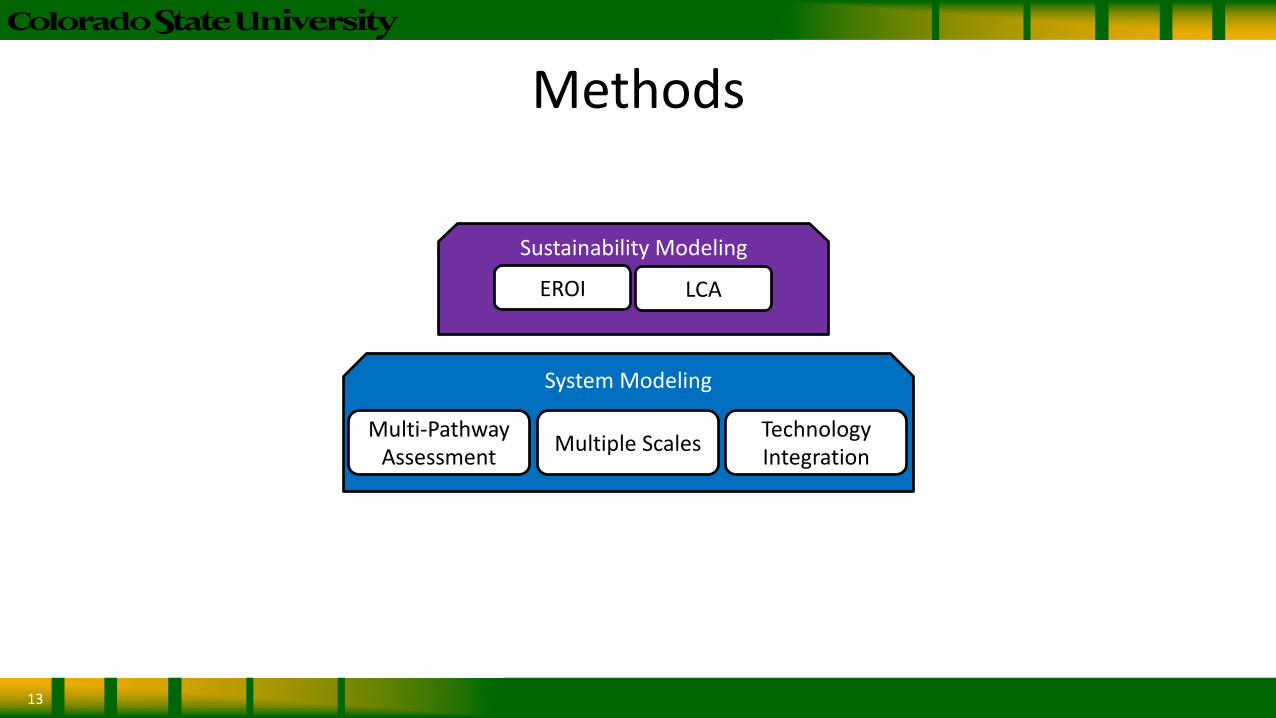
SystemModeling
SustainabilityModeling
Multi-PathwayAssessment MultipleScales
EROI LCA
TechnologyIntegration

SystemModel:Simplified
CHP
AlgaeProductRecovery
AmmoniaProduction
Harvest
SystemBoundary
FlareGas
Protein&
Biocrude
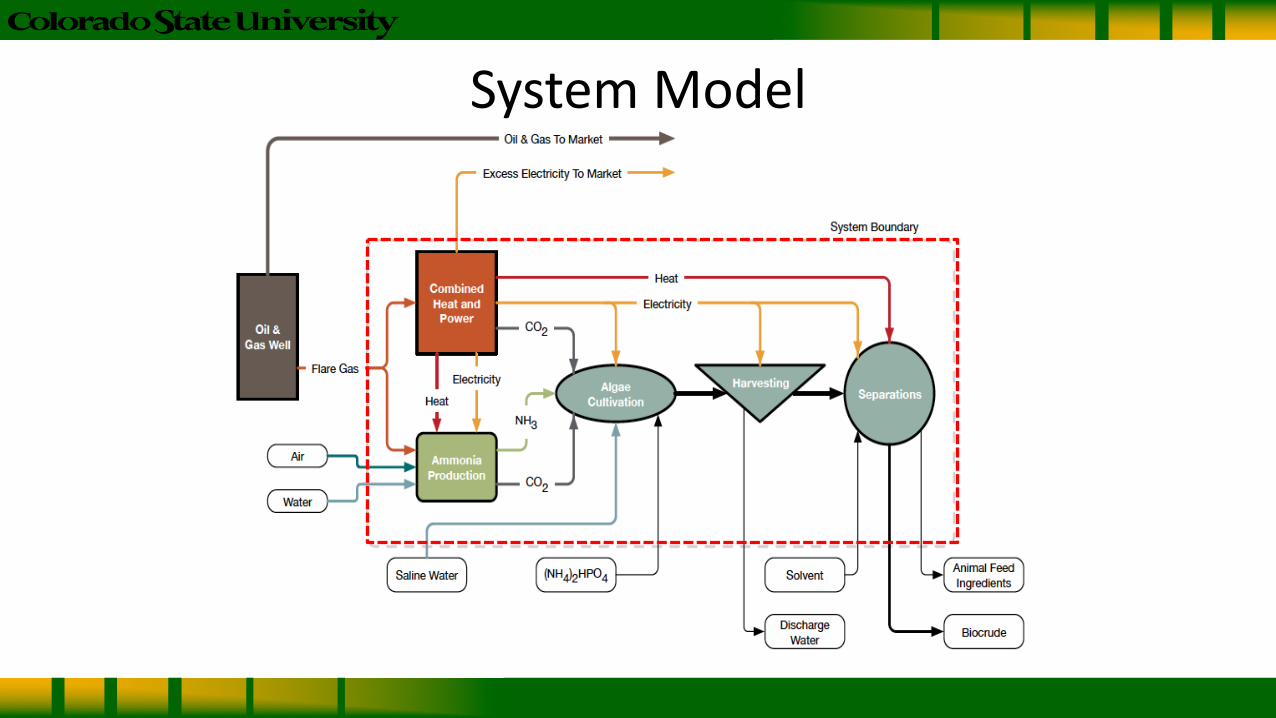
SystemModel
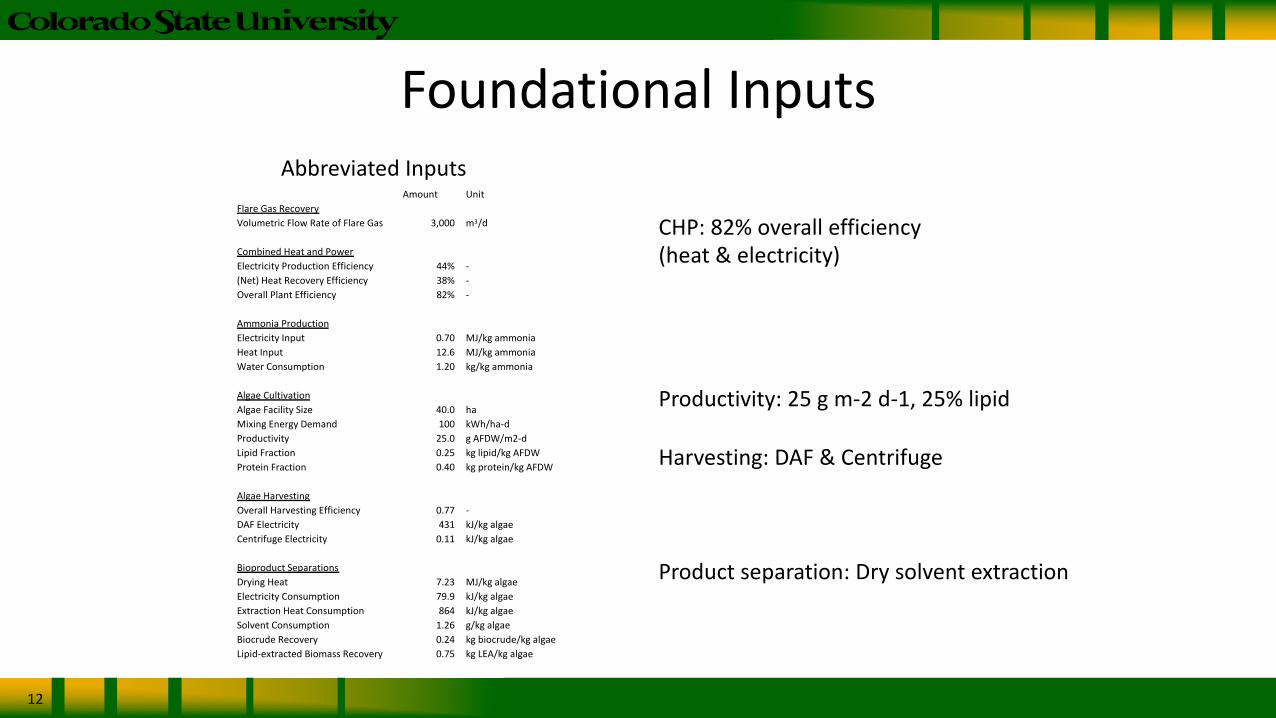
FoundationalInputs
12
Amount UnitFlareGasRecoveryVolumetricFlowRateofFlareGas 3,000 m3/d
CombinedHeatandPowerElectricityProductionEfficiency 44% -(Net)HeatRecoveryEfficiency 38% -OverallPlantEfficiency 82% -
AmmoniaProductionElectricityInput 0.70 MJ/kgammoniaHeatInput 12.6 MJ/kgammoniaWaterConsumption 1.20 kg/kgammonia
AlgaeCultivationAlgaeFacilitySize 40.0 haMixingEnergyDemand 100 kWh/ha-dProductivity 25.0 gAFDW/m2-dLipidFraction 0.25 kglipid/kgAFDWProteinFraction 0.40 kgprotein/kgAFDW
AlgaeHarvestingOverallHarvestingEfficiency 0.77 -DAFElectricity 431 kJ/kgalgaeCentrifugeElectricity 0.11 kJ/kgalgae
BioproductSeparationsDryingHeat 7.23 MJ/kgalgaeElectricityConsumption 79.9 kJ/kgalgaeExtractionHeatConsumption 864 kJ/kgalgaeSolventConsumption 1.26 g/kgalgaeBiocrudeRecovery 0.24 kgbiocrude/kgalgaeLipid-extractedBiomassRecovery 0.75 kgLEA/kgalgae
CHP:82%overallefficiency(heat&electricity)
Productivity:25gm-2d-1,25%lipid
Harvesting:DAF&Centrifuge
Productseparation:Drysolventextraction
AbbreviatedInputs
Methods
13
SystemModeling
SustainabilityModeling
Multi-PathwayAssessment MultipleScales
EROI LCA
TechnologyIntegration
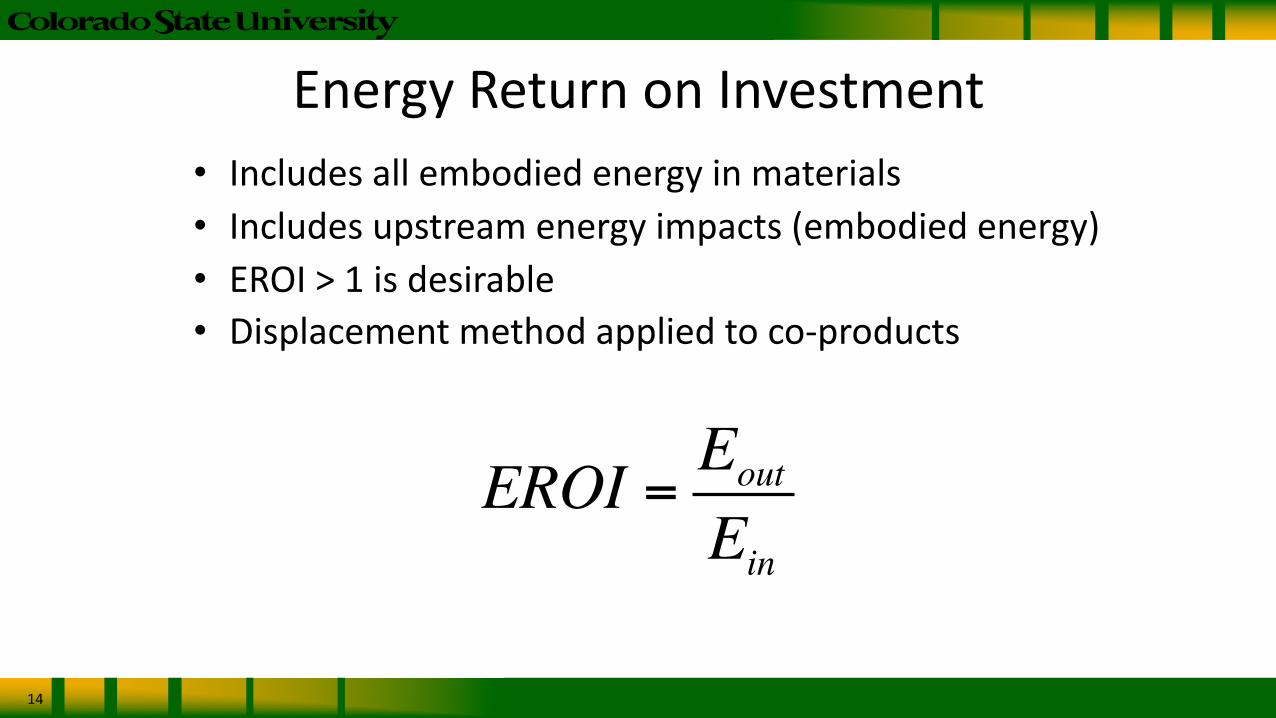
EnergyReturnonInvestment
14
• Includesallembodiedenergyinmaterials• Includesupstreamenergyimpacts(embodiedenergy)• EROI>1isdesirable• Displacementmethodappliedtoco-products
EROI = Eout
Ein
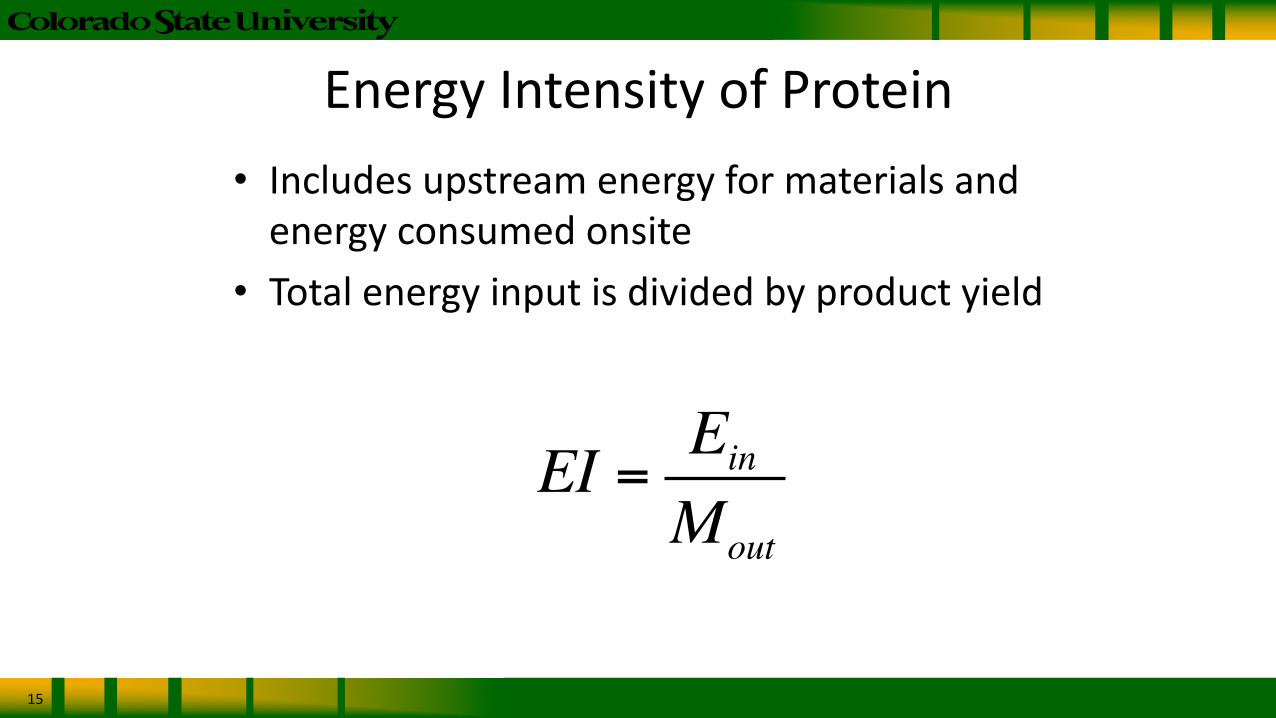
EnergyIntensityofProtein
15
• Includesupstreamenergyformaterialsandenergyconsumedonsite
• Totalenergyinputisdividedbyproductyield
EI = Ein
Mout
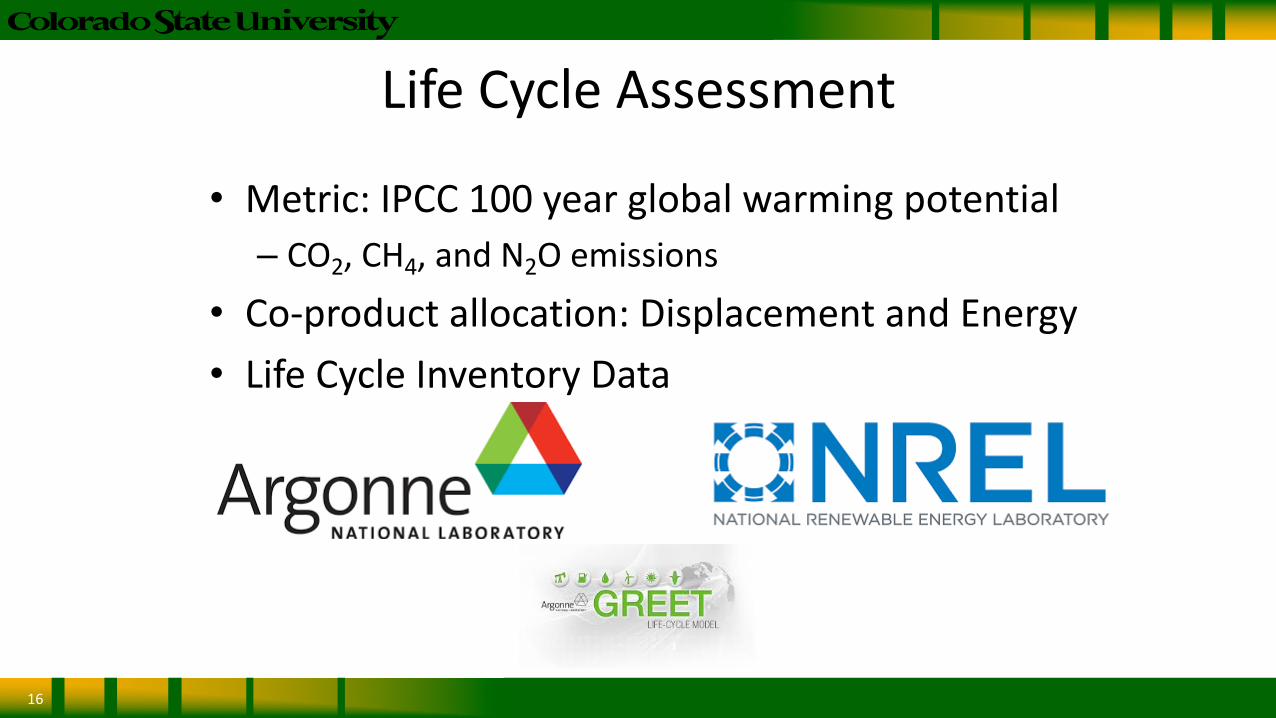
LifeCycleAssessment
• Metric:IPCC100yearglobalwarmingpotential– CO2,CH4,andN2Oemissions
• Co-productallocation:DisplacementandEnergy• LifeCycleInventoryData
16
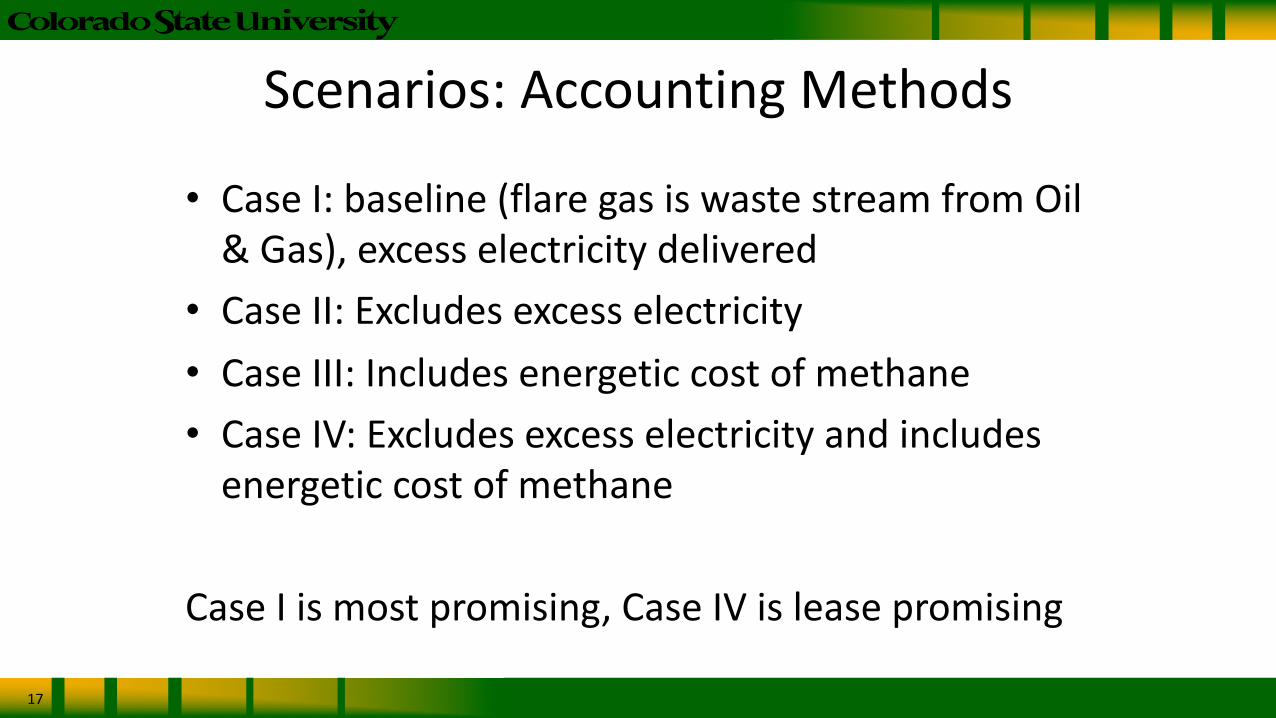
Scenarios:AccountingMethods
• CaseI:baseline(flaregasiswastestreamfromOil&Gas),excesselectricitydelivered
• CaseII:Excludesexcesselectricity• CaseIII:Includesenergeticcostofmethane• CaseIV:Excludesexcesselectricityandincludesenergeticcostofmethane
CaseIismostpromising,CaseIVisleasepromising
17

Outline
• FlareGas&Algae• GeneralOverviewofMethods– EnergyReturnonInvestment– LifeCycleAssessment– ModeledScenarios
• Results– Potential– Comparisontoliterature
• FutureDirection
18
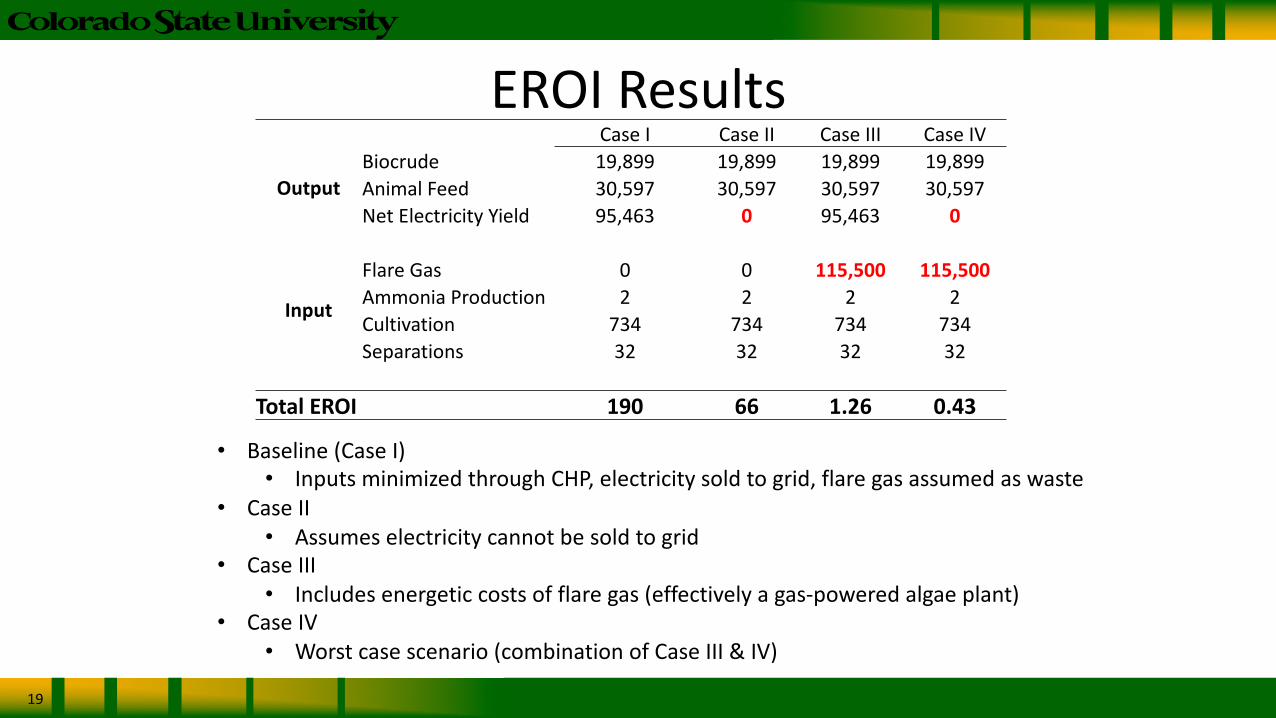
EROIResults
19
• Baseline(CaseI)• InputsminimizedthroughCHP,electricitysoldtogrid,flaregasassumedaswaste
• CaseII• Assumeselectricitycannotbesoldtogrid
• CaseIII• Includesenergeticcostsofflaregas(effectivelyagas-poweredalgaeplant)
• CaseIV• Worstcasescenario(combinationofCaseIII&IV)
CaseI CaseII CaseIII CaseIV
OutputBiocrude 19,899 19,899 19,899 19,899AnimalFeed 30,597 30,597 30,597 30,597NetElectricityYield 95,463 0 95,463 0
Input
FlareGas 0 0 115,500 115,500AmmoniaProduction 2 2 2 2Cultivation 734 734 734 734Separations 32 32 32 32
TotalEROI 190 66 1.26 0.43
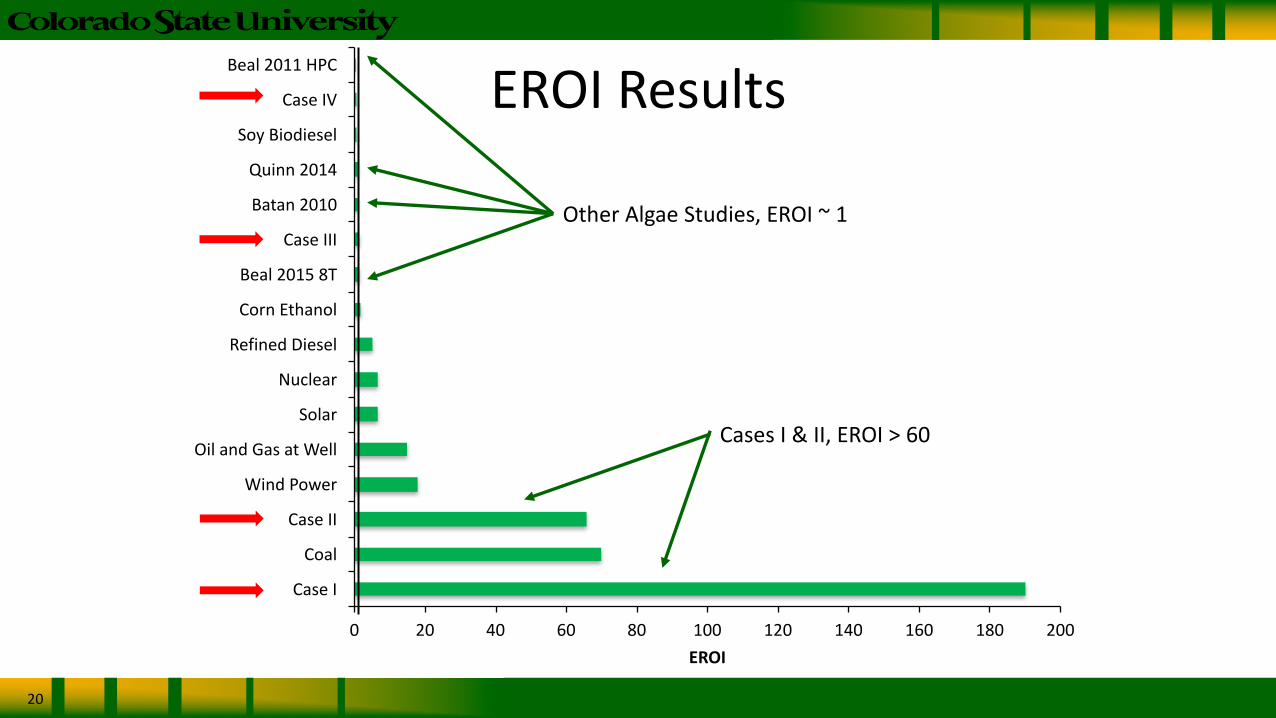
0 20 40 60 80 100 120 140 160 180 200
CaseI
Coal
CaseII
WindPower
OilandGasatWell
Solar
Nuclear
RefinedDiesel
CornEthanol
Beal20158T
CaseIII
Batan2010
Quinn2014
SoyBiodiesel
CaseIV
Beal2011HPC
EROI
EROIResults
20
OtherAlgaeStudies,EROI~1
CasesI&II,EROI>60
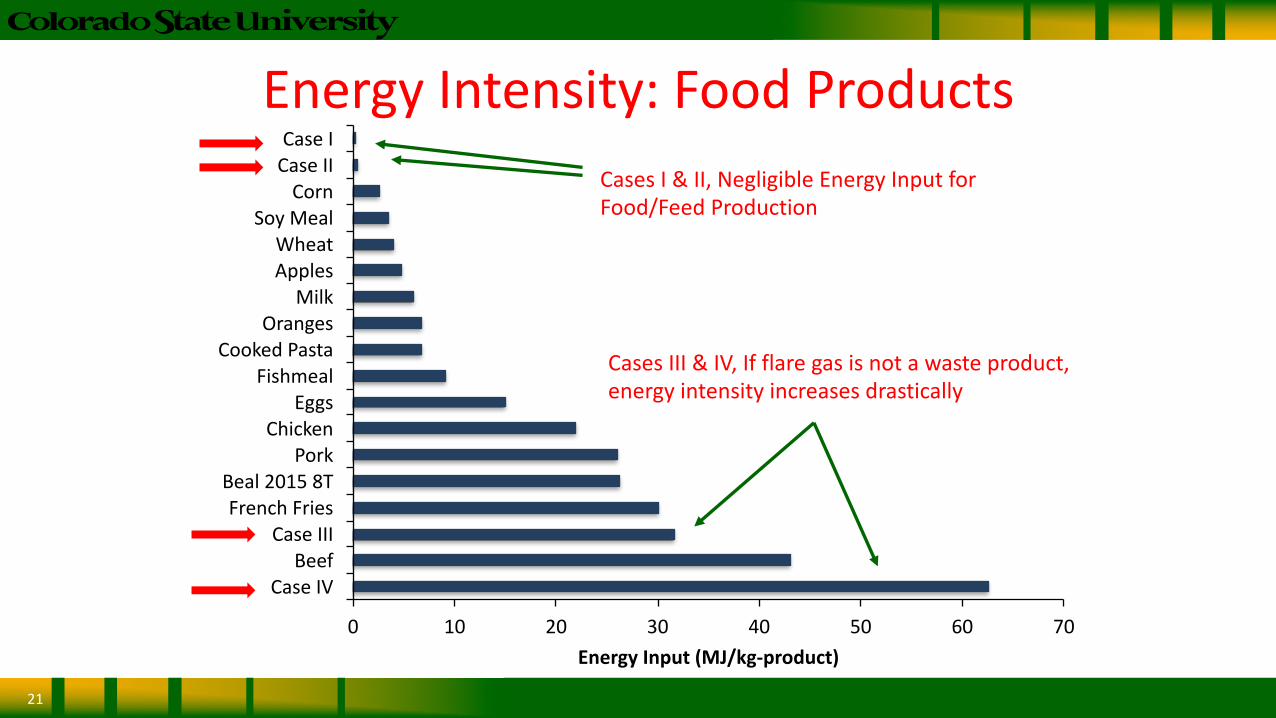
EnergyIntensity:FoodProducts
21
0 10 20 30 40 50 60 70
CaseICaseIICorn
SoyMealWheatApplesMilk
OrangesCookedPasta
FishmealEggs
ChickenPork
Beal20158TFrenchFries
CaseIIIBeef
CaseIV
EnergyInput(MJ/kg-product)
CasesI&II,NegligibleEnergyInputforFood/FeedProduction
CasesIII&IV,Ifflaregasisnotawasteproduct,energyintensityincreasesdrastically
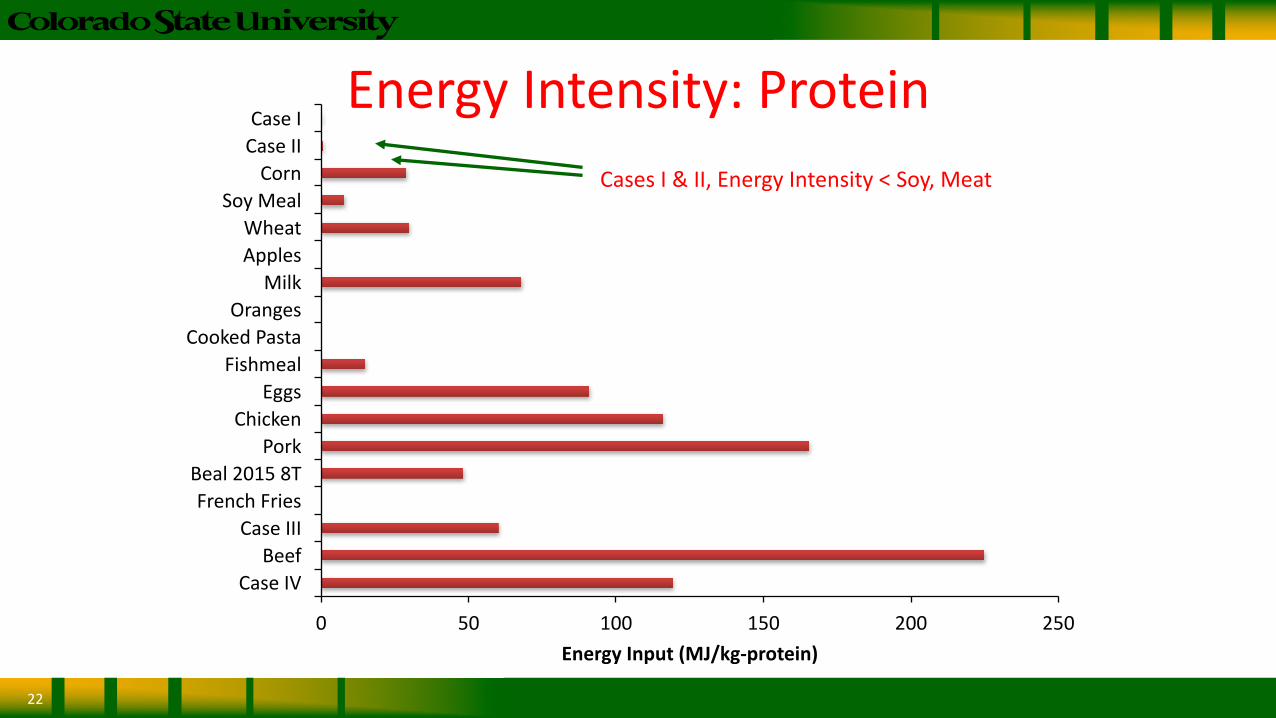
EnergyIntensity:Protein
22
0 50 100 150 200 250
CaseICaseIICorn
SoyMealWheatApplesMilk
OrangesCookedPasta
FishmealEggs
ChickenPork
Beal20158TFrenchFries
CaseIIIBeef
CaseIV
EnergyInput(MJ/kg-protein)
CasesI&II,EnergyIntensity<Soy,Meat
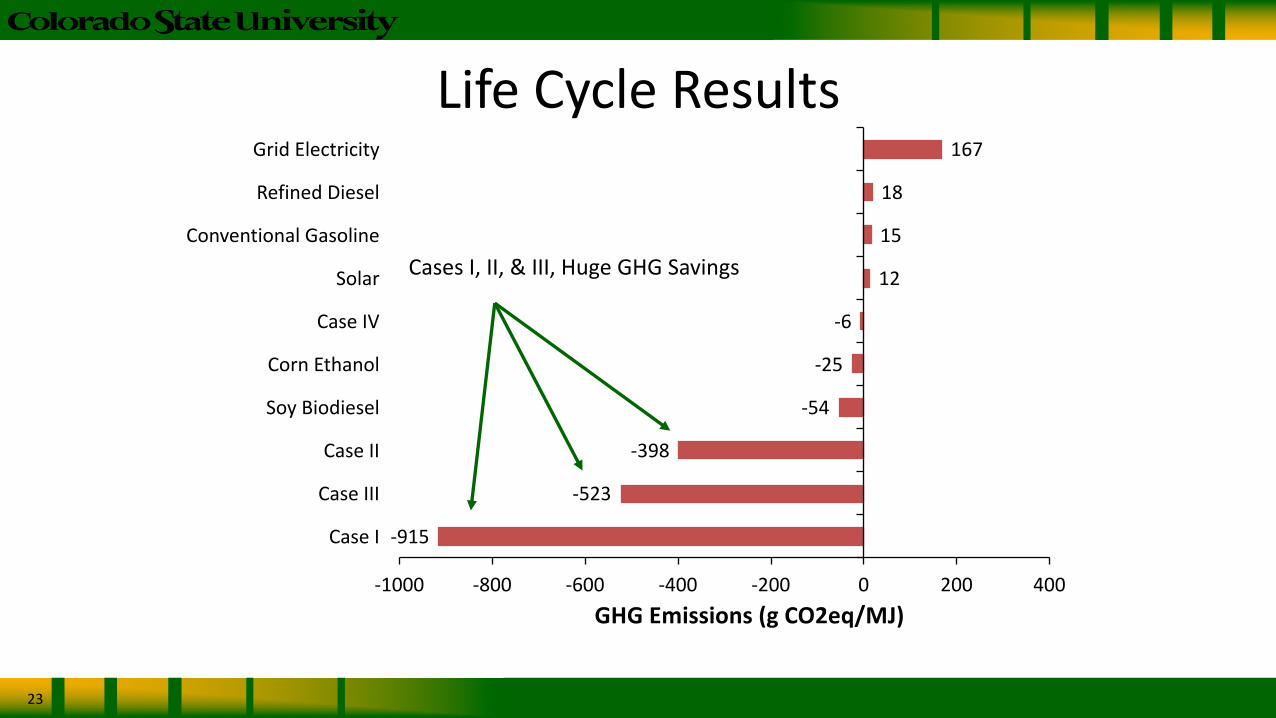
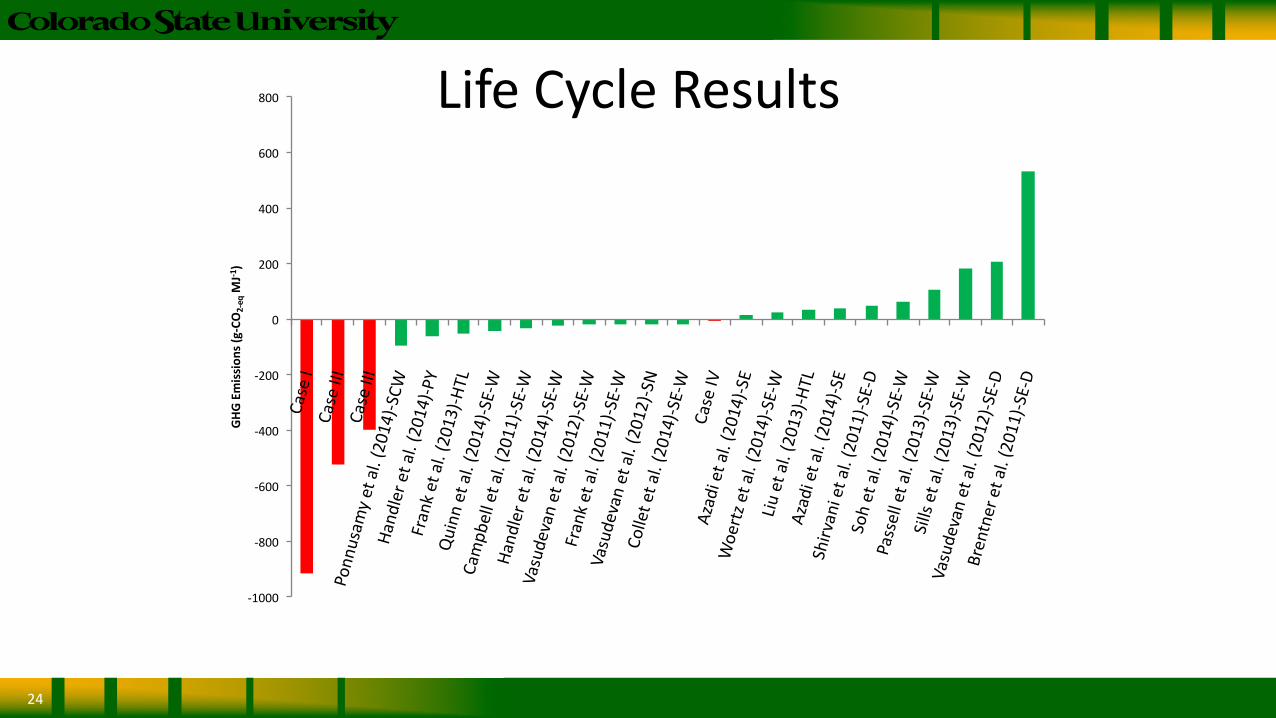
LifeCycleResults
23
-915
-523
-398
-54
-25
-6
12
15
18
167
-1000 -800 -600 -400 -200 0 200 400
CaseI
CaseIII
CaseII
SoyBiodiesel
CornEthanol
CaseIV
Solar
ConventionalGasoline
RefinedDiesel
GridElectricity
GHGEmissions(gCO2eq/MJ)
CasesI,II,&III,HugeGHGSavings
LifeCycleResults
24
-1000
-800
-600
-400
-200
0
200
400
600
800
GHGEm
issions(g-CO2-eqMJ-1)
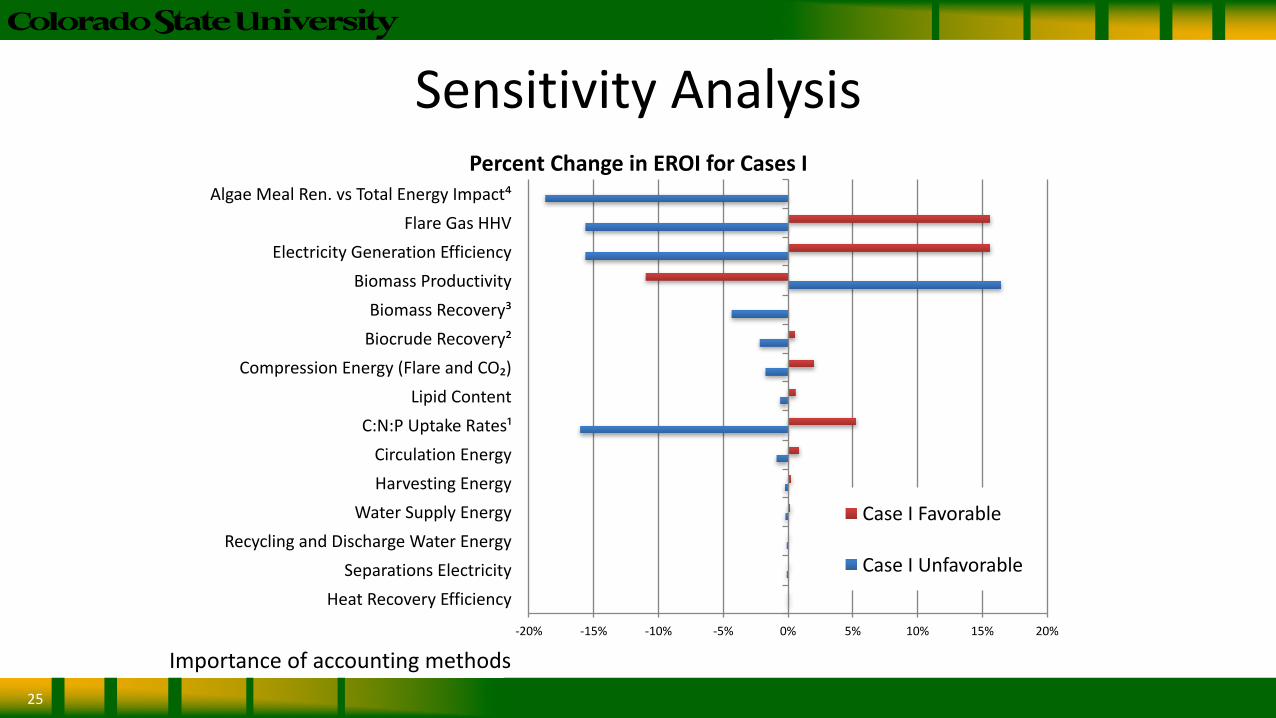
SensitivityAnalysis
25
-20% -15% -10% -5% 0% 5% 10% 15% 20%
HeatRecoveryEfficiencySeparationsElectricity
RecyclingandDischargeWaterEnergyWaterSupplyEnergy
HarvestingEnergyCirculationEnergy
C:N:PUptakeRates¹LipidContent
CompressionEnergy(FlareandCO₂)BiocrudeRecovery²BiomassRecovery³
BiomassProductivityElectricityGenerationEfficiency
FlareGasHHVAlgaeMealRen.vsTotalEnergyImpact⁴
PercentChangeinEROIforCasesI
CaseIFavorable
CaseIUnfavorable
Importanceofaccountingmethods
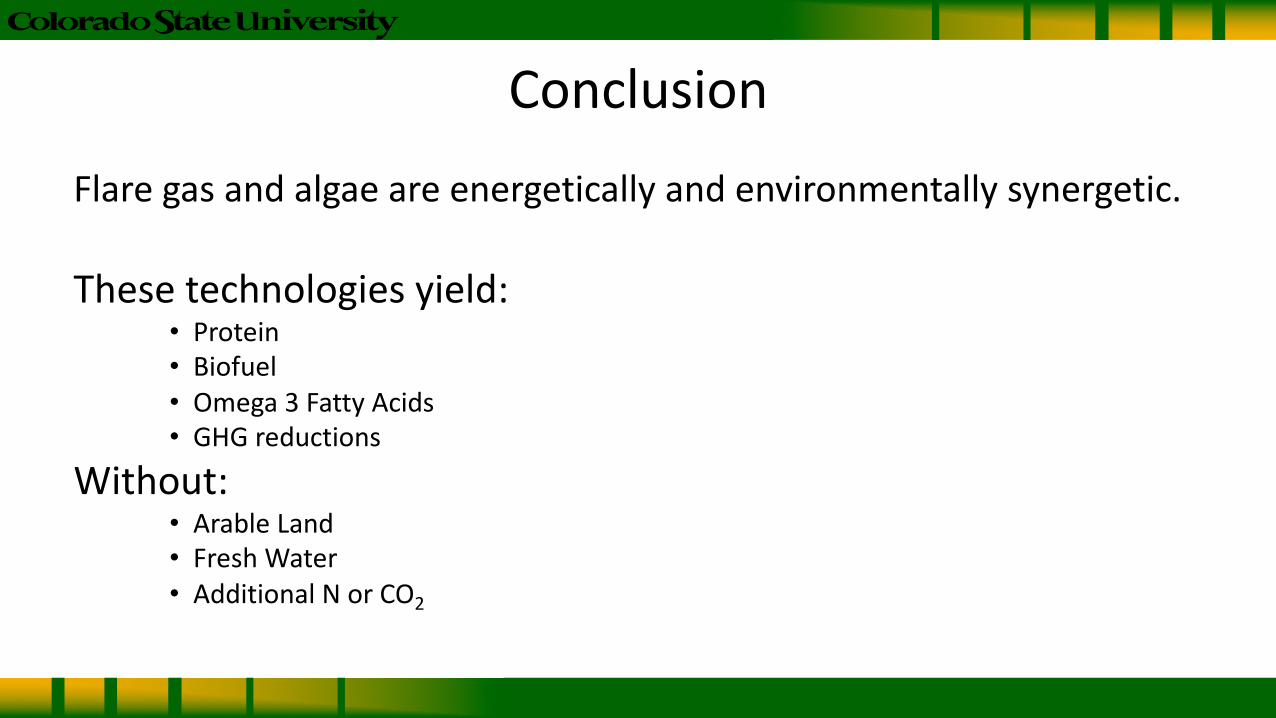
ConclusionFlaregasandalgaeareenergeticallyandenvironmentallysynergetic.
Thesetechnologiesyield:• Protein• Biofuel• Omega3FattyAcids• GHGreductions
Without:• ArableLand• FreshWater• AdditionalNorCO2

FutureWork
• DevelopmentofafullTEA
• GISsitidentification
• Potentialforglobaldeployment– Addressenergyandproteindemands