phorbol esters stimulate macropinocytosis and solute flow ... · phorbol esters stimulate...
TRANSCRIPT
Phorbol esters stimulate macropinocytosis and solute flow through
macrophages
JOEL A. SWANSON
Department of Anatomy and Cellular Biology, Harvard Medical School, 220 Longioood Avenue, Boston, MA 02115, USA
Summary
The morphology and kinetics of pinocytosis bybone marrow-derived macrophages were studied todetermine how stimulation by phorbol esters in-creases net solute accumulation. Application ofphorbol myristate acetate (PMA) increased both theabundance of macropinosomes and the rate ofsolute flow through the endocytic compartment.The large pinosomes originated as ruffles at the cellmargins that folded back on themselves, internaliz-ing extracellular medium and solutes. I examinedhow stimulation affects the kinetics of pinocyticinflux, accumulation, and subsequent efflux of thefluorescent dye Lucifer Yellow (LY) in macro-phages. Both the accumulation of LY and its sub-sequent efflux were temperature-dependent anddirectly proportional to the concentration of LY inthe extracellular medium. Macrophages incubatedin PMA and LY for 2 h accumulated four to six timesmore LY than did macrophages in LY alone. If afterpinocytosis the macrophages were washed and
reincubated in unlabeled medium for a lh chaseperiod, some of the internalized LY was regurgi-tated from the cells. Inclusion of PMA in the chasemedium increased efflux of LY. In contrast, asmaller percentage of LY was regurgitated frommacrophages 'which were both loaded and chasedin the presence of PMA. This indicates thatalthough efflux is increased by PMA, influx in-creases more, and therefore more of the LY enter-ing by pinocytosis is retained within the cell. Isuggest that macropinocytosis increases the sizedifference between pinosomes and efflux vesicles,and that that difference increases greatly bothsolute accumulation and membrane flow throughthe endocytic compartment.
Key words: pinocytosis, macrophage, phorbol ester, LuciferYellow.
Introduction
Macrophages are capable of continuous internalization ofplasma membrane by pinocytosis. Stereological measure-ments indicate that they internalize the equivalent oftheir cell surface area once every 33 min (Steinman et al.1976), yet they maintain a flattened morphology with ahigh cell surface to volume ratio. After endocytosis,membrane receptors and some fluid solute probes ofpinocytosis return to the cell surface, indicating thatinternalized membrane is recycled. Despite such partialrecycling, however, solute probes accumulate insidemacrophages linearly for many hours, indicating thatmuch of the fluid volume entering the cell does notrecycle. How does the macrophage maintain steady staterates of solute accumulation without internalizing moremembrane than it recycles?
Treatment of macrophages with the tumor-promotingphorbol ester phorbol myristate acetate (PMA) stimu-lates pinocytosis. Within several minutes of addition ofPMA, macrophage accumulation of the fluid phase soluteprobes horseradish peroxidase or Lucifer Yellow (LY)
Journal of Cell Science 94, 135-142 (1989)Printed in Great Britain © The Company of Biologists Limited 1989
increases several fold (Phaire-Washington et al. 1980;Swanson e? al. 1985). Increased accumulation is continu-ous for many hours, and occurs without any noticeableloss,of cell surface area. Indeed, surface area appears toincrease during the first hour of stimulation (Phaire-Washington et al. 1980). Examination of the kinetics ofstimulation in thioglycollate-elicited murine peritonealmacrophages revealed that PMA stimulated both the rateof influx and the net intracellular retention of LY(Swanson et al. 1985). It was proposed that PMAincreased the efficiency of pinosome-lysosome fusion,possibly via the extension of lysosomes into more periph-eral regions of cytoplasm (Swanson et al. 1987).
The present work considers constitutive and stimu-lated pinocytosis in light of their effect, or lack of effect,on cell shape. It was prompted first by the observationthat in bone marrow-derived macrophages PMA in-creases LY accumulation without noticeable redistri-bution of lysosomes. Using time-lapse video microscopyand measurement of the kinetics of LY pinocytosis, Ireport that PMA stimulates macropinocytosis and in-creases the net rate of flow through the endocytic
135
compartment. Accumulation is increased not by inhibit-ing efflux, but by a differential increase of both influx andefflux. I propose a model to explain how rates ofconstitutive and stimulated pinocytosis could be sus-tained without net redistribution of plasma membraneinto the cell.
Materials and methods
CellsBone marrow-derived macrophages were obtained by themethod of Celada etal. (1984), with some modifications.Female mice (ICR, Trudeau Inst., Saranac Lake, NY, USA orC3H/HeJ, Jackson Lab., Bar Harbor, ME, USA) were killedby cervical dislocation and their femurs removed. The ends ofthe bones were clipped off, then the bone marrow was extrudedusing a 26 g needle and a syringe containing cold Dulbecco'sModified Eagle's Medium plus 10% heat-inactivated fetalbovine serum (DME-10F). The reticular matrix was agitatedgently to loosen cells, then removed by low speed centrifugation(500 revs min"1 for 1 min). The suspension of cells was thenwashed by centrifugation and resuspended in complete bonemarrow medium (DME plus 30% L-cell-conditioned medium+20% HiFBS). 5X10⁶ bone-marrow cells in 25 ml of bonemarrow medium were plated into 100 mm diameter Lab-Tekpetri dishes, then incubated for six days at 37°C in a 5 % CO2incubator. Three days after plating, each dish received 10 ml ofbone marrow medium. On day six, adherent macrophages wereharvested by first washing the plates with ice-cold divalentcation-free phosphate-buffered saline (PD: 137mM-NaCl,3mM-KCl, 7mM-phosphate buffer, pH7-4), leaving dishes15 min on ice, then washing the macrophages off the dishes witha gentle stream of cold PD. These suspended bone marrow-derived macrophages (BMM) were plated either onto coverslipsfor microscopic observation, or into 16 mm diameter wells of a24-well culture dish (Costar). For most experiments cells wereplated at 3x 10⁵ cells per well. After allowing 30 min at 37°C forthe suspended cells to adhere to the dish, PD was replaced with0-5 ml of DME-10F, and the cultures were left overnight at37°C and 5% COZ. Experiments were performed with thesecells within the next two days. Greater than 95 % of these cellswere macrophages, as judged by their ability to phagocytoseopsonized sheep red blood cells. Nearly all the data shown herewas obtained using the ICR mice. C3H/HeJ mice, which areinsensitive to bacterial lipopolysaccharide (Vogel etal. 1981),were used to confirm the essential observations reported here.
MicroscopySuspended, day six BMM were plated at low density onto25 mm diameter circular no. 1 coverslips placed into 35 mmtissue culture dishes. They were studied within the next twodays. For time-lapse microscopy, coverslips were put intoSykes-Moore chambers, which were then mounted into atemperature-controlled stage (Extech Instr.) on a Zeiss invertedmicroscope and held at 36°C. The Sykes-Moore chamber wasperfused with PBS containing 10% heat-inactivated fetal bov-ine serum (PBS-10F), with or without phorbol myristateacetate (PMA, Sigma Chem. Co., St Louis, USA) at60ngml~'. Phase microscope images were collected via a X100objective lens (NA 1.25) and a Dage NC-66X video cameramounted onto the microscope. A Panasonic optical discrecorder (TQ 2025F) provided a time-lapse record of events,speeded up x36.
For fluorescence microscopic observation of pinosomes,BMM on coverslips were preincubated for 60 min in
PBS-10F±PMA, then incubated for 60s in 1-Smgml"1
Lucifer Yellow CH (LY; potassium salt, Molecular Probes,Eugene, OR, USA), rinsed in PBS, and fixed for 30min in aparaformaldehyde fixative (McLean and Nakane, 1974). Speci-mens were mounted in glycerol and observed in a ZeissPhotomicroscope III equipped for epi-illumination of fluor-escent specimens (Lucifer Yellow filter set) and for 35 mmphotography (Tmax 400 film).
To quantify pinocytic vesicles, macrophages on coverslipswere preincubated 90min in PBS-10F±PMA (37°C) thenwere placed into fixative containing 2-5% glutaraldehyde inPBS, plus 4-5 % sucrose, and fixed for 45 min at room tempera-ture (21 °C). Fixed preparations were washed with severalchanges of PBS, then mounted in glycerol for microscopicstudy. Photomicrographs were taken using Pan X film, andwere enlarged to a final magnification of X1800. For everymacrophage whose entire profile was visible in a print, all of itsphase-bright vesicles were measured and recorded.
Quantitation of LY pinocytosisPinocytosis of LY was quantified by allowing BMM in 24-welldishes to incubate in PBS-10F containing LY, then washingaway extracellular dye, lysing the cells, and measuring thefluorescence of the lysate. Typically, 3x 10⁵ BMM per well wereincubated in PBS-10F on ice for 30-45 minutes. ColdPBS-10F was then replaced by 0-35 ml of a cold solution of LYdissolved in PBS-10F at O-SmgrnP1, ± 3 0 n g m r ' PMA(48 nM). The culture dish was then either maintained on ice, orwarmed to 37°C for 2h. For time course experiments, disheswere not chilled before adding the drinks, but were insteadmaintained at 37°C throughout. Drinks were added such thatall incubations ended at the same instant.
To terminate LY pinocytosis, dishes were drained, thenimmersed in 11 of ice-cold PD with 1 rngml"' bovine serumalbumin. Dishes were washed by repeated immersion anddrainage, then were transferred to a second 11 beaker of ice-coldPD. Dishes were rinsed for 5 min in this second beaker beforepassing through a third and final liter of cold PD. They weredrained and aspirated dry, then were either reincubated inPBS-10F (chase period, see below), or were lysed in 0-50 ml of0 1 % Triton X-100. Wells with Triton were incubated 60 minat 37°C before analyzing LY fluorescence or protein content. Inthe pulse-chase experiments, washed dishes of LY-loaded cellswere reincubated for 60 min in 0-45 ml PBS-10F. Here, too,solutions were added cold, then dishes were either warmed to37°C or maintained on ice for the chase period. Following thischase, cells were washed in 2x11 of ice-cold PD, drained andlysed in Triton as described above.
Pinocytosed LY was measured by combining 0-40 ml of lysatewith 0-75 ml of 0 1 % Triton X-100 and 100 ^ ml"1 bovineserum albumin, then reading the fluorescence in an SLM-Aminco 500C spectrofluorometer. Specimens were excited at430 nm (4nm bandpass) and measured at 540 nm (4nm band-pass). Protein was measured using a modified version of thebicinchoninic acid (Pierce Chem. Co., Rockford, IL, USA)method (Smith et al. 1985): for each sample 50^1 of lysate wascombined with 1 ml of working reagent. The protein standardcurve was made using bovine serum albumin. By this method, Idetermined that there are 180 ^g protein per 106 BMM.
To determine whether pinocytosed LY was degraded to anon-fluorescent form, a pulse-chase experiment was performedin which both cells and chase medium were analyzed forfluorescence. Adherent BMM were incubated in 0-5mgml~'LY for 2h at 37°C, then were washed and reincubated in PBS(37°C) forO, 1, 2, or 3 h. At the end of each chase period, PBSwas removed and saved as 'medium', and 0 5 ml Triton X-100(0-1%) was added to each well. Fluorescence of the lysate
136 J. A. Swanson
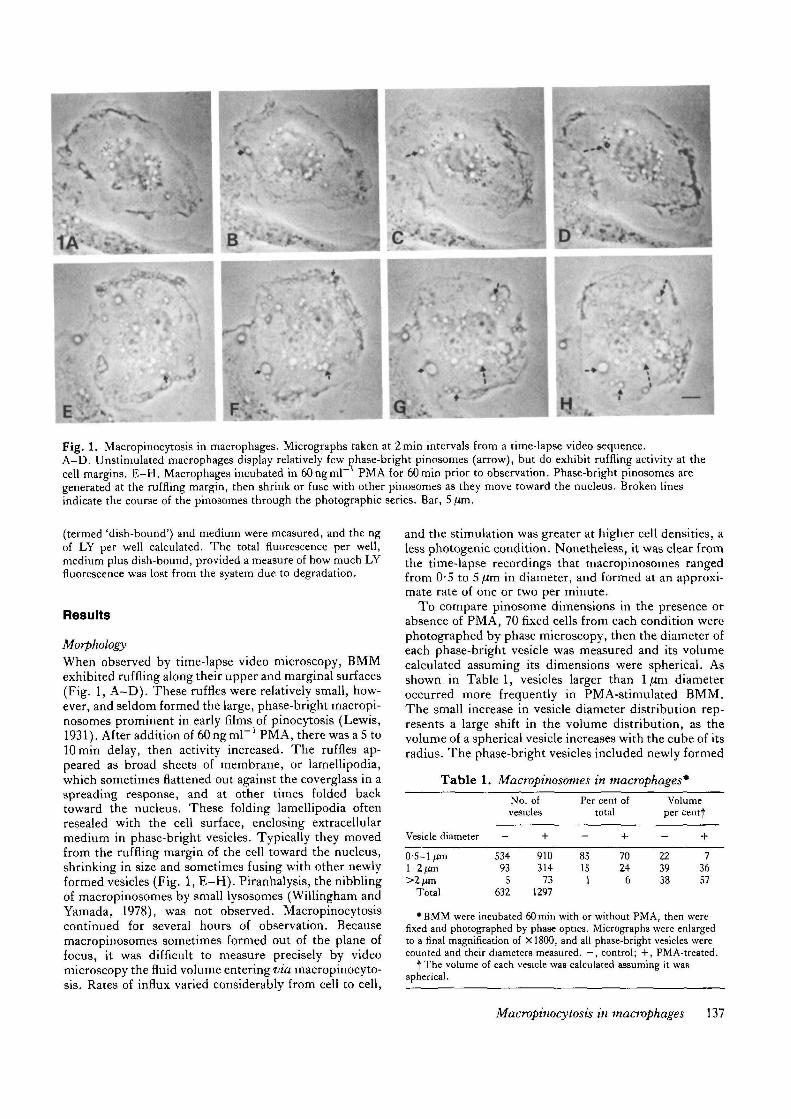
Fig. 1. Macropinocytosis in macrophages. Micrographs taken at 2min intervals from a time-lapse video sequence.A—D. Unstimulated macrophages display relatively few phase-bright pinosomes (arrow), but do exhibit ruffling activity at thecell margins. E-H. Macrophages incubated in 60ngml~ PMA for 60min prior to observation. Phase-bright pinosomes aregenerated at the ruffling margin, then shrink or fuse with other pinosomes as they move toward the nucleus. Broken linesindicate the course of the pinosomes through the photographic series. Bar, 5 jim.
(termed 'dish-bound') and medium were measured, and the ngof LY per well calculated. The total fluorescence per well,medium plus dish-bound, provided a measure of how much LYfluorescence was lost from the system due to degradation.
Results
Morphology
When observed by time-lapse video microscopy, BMMexhibited ruffling along their upper and marginal surfaces(Fig. 1, A-D) . These ruffles were relatively small, how-ever, and seldom formed the large, phase-bright macropi-nosomes prominent in early films of pinocytosis (Lewis,1931). After addition of 60 ng ml" ' PMA, there was a 5 tolOmin delay, then activity increased. The ruffles ap-peared as broad sheets of membrane, or lamellipodia,which sometimes flattened out against the coverglass in aspreading response, and at other times folded backtoward the nucleus. These folding lamellipodia oftenresealed with the cell surface, enclosing extracellularmedium in phase-bright vesicles. Typically they movedfrom the ruffling margin of the cell toward the nucleus,shrinking in size and sometimes fusing with other newlyformed vesicles (Fig. 1, E-H) . Piranhalysis, the nibblingof macropinosomes by small lysosomes (Willingham andYamada, 1978), was not observed. Macropinocytosiscontinued for several hours of observation. Becausemacropinosomes sometimes formed out of the plane offocus, it was difficult to measure precisely by videomicroscopy the fluid volume entering via macropinocyto-ais. Rates of influx varied considerably from cell to cell,
and the stimulation was greater at higher cell densities, aless photogenic condition. Nonetheless, it was clear fromthe time-lapse recordings that macropinosomes rangedfrom 0-5 to 5 [im in diameter, and formed at an approxi-mate rate of one or two per minute.
To compare pinosome dimensions in the presence orabsence of PMA, 70 fixed cells from each condition werephotographed by phase microscopy, then the diameter ofeach phase-bright vesicle was measured and its volumecalculated assuming its dimensions were spherical. Asshown in Table 1, vesicles larger than 1 ftm diameteroccurred more frequently in PMA-stimulated BMM.The small increase in vesicle diameter distribution rep-resents a large shift in the volume distribution, as thevolume of a spherical vesicle increases with the cube of itsradius. The phase-bright vesicles included newly formed
Table 1. Macropinosomes in macrophages*
Vesicle diameter
0-5-1 /an1-2 /jm>2/im
Total
No. ofvesicles
-
53493
5632
+91031473
1297
Pe
-
8515
1
r centtotal
of
+7024
6
Volumeper cenff
-
223938
+7
3657
•BMM were incubated 60min with or without PMA, then werefixed and photographed by phase optics. Micrographs were enlargedto a final magnification of X1800, and all phase-bright vesicles werecounted and their diameters measured. —, control; +, PMA-treated.
•fThe volume of each vesicle was calculated assuming it wasspherical.
Macropinocytosis in macrophages 137
macropinosomes and those which had shrunken sincetheir formation. The images therefore represented thesteady state dimensions of macropinosomes and theirderivatives. From the data used to generate Table 1, Idetermined that control macrophages contained1-50 ±2-50 vesicles larger than 1 fim diameter per cell(n = 72), and that PMA-stimulated macrophages con-tained 5-68 ±5-77 large vesicles per cell (n = 69). Thisdifference was significant (/*< 0001, two-sampledStudent's t-test for independent samples with unequalvariance).
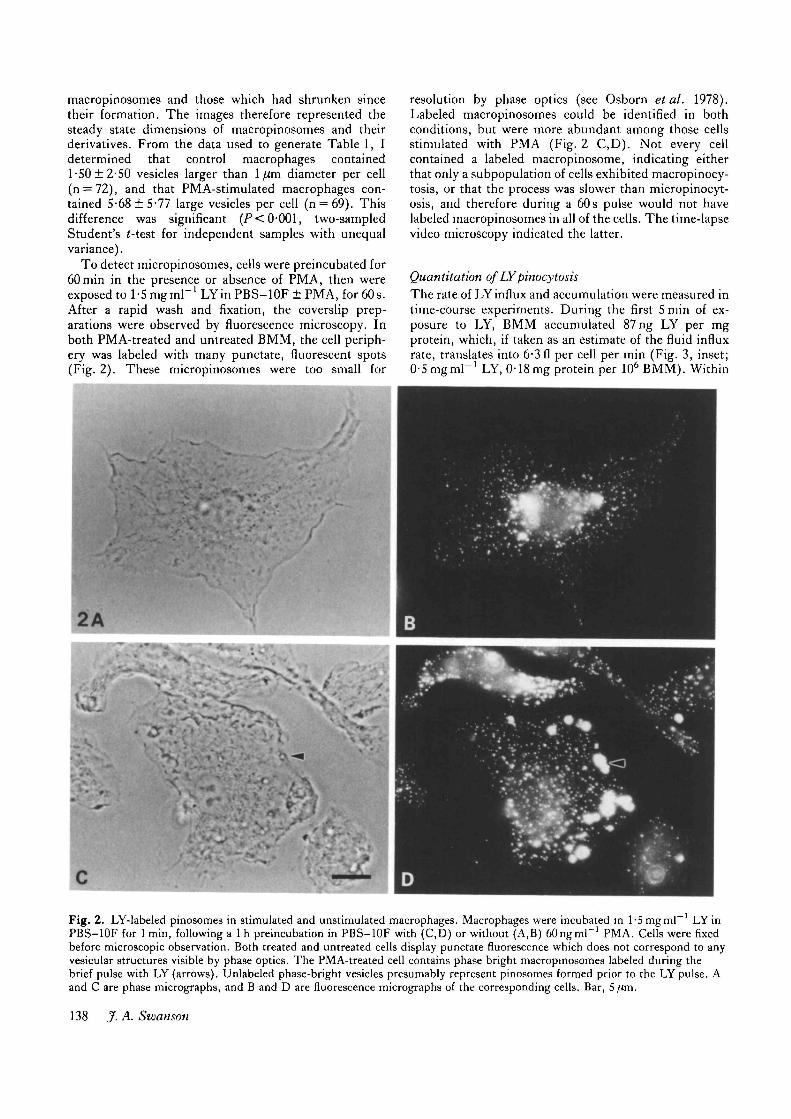
To detect micropinosomes, celb were preincubated for60min in the presence or absence of PMA, then wereexposed to l-Smgrnl"1 LYin PBS-10F ± PMA, for 60s.After a rapid wash and fixation, the coverslip prep-arations were observed by fluorescence microscopy. Inboth PMA-treated and untreated BMM, the cell periph-ery was labeled with many punctate, fluorescent spots(Fig. 2). These micropinosomes were too small for
resolution by phase optics (see Osborn etal. 1978).Labeled macropinosomes could be identified in bothconditions, but were more abundant among those cellsstimulated with PMA (Fig. 2 C,D). Not every cellcontained a labeled macropinosome, indicating eitherthat only a subpopulation of cells exhibited macropinocy-tosis, or that the process was slower than micropinocyt-osis, and therefore during a 60s pulse would not havelabeled macropinosomes in all of the cells. The time-lapsevideo microscopy indicated the latter.
Quantitation of LYpinocytosisThe rate of LY influx and accumulation were measured intime-course experiments. During the first 5 min of ex-posure to LY, BMM accumulated 87 ng LY per mgprotein, which, if taken as an estimate of the fluid influxrate, translates into 6-3 fl per cell per min (Fig. 3, inset;0-Smgml"1 LY, 0-18mg protein per 106 BMM). Within
Fig. 2. LY-labeled pinosomes in stimulated and unstimulated macrophages. Macrophages were incubated in 1-Smgml ' LYinPBS-10F for 1 min, following a 1 h preincubation in PBS-10F with (C,D) or without (A,B) oOngmP1 PMA. Cells were fixedbefore microscopic observation. Both treated and untreated cells display punctate fluorescence which does not correspond to anyvesicular structures visible by phase optics. The PMA-treated cell contains phase bright macropinosomes labeled during thebrief pulse with LY (arrows). Unlabeled phase-bright vesicles presumably represent pinosomes formed prior to the LY pulse. Aand C are phase micrographs, and B and D are fluorescence micrographs of the corresponding cells. Bar, 5 fan.
138 jf. A. Swanson
4000
60 90 120Time (min)
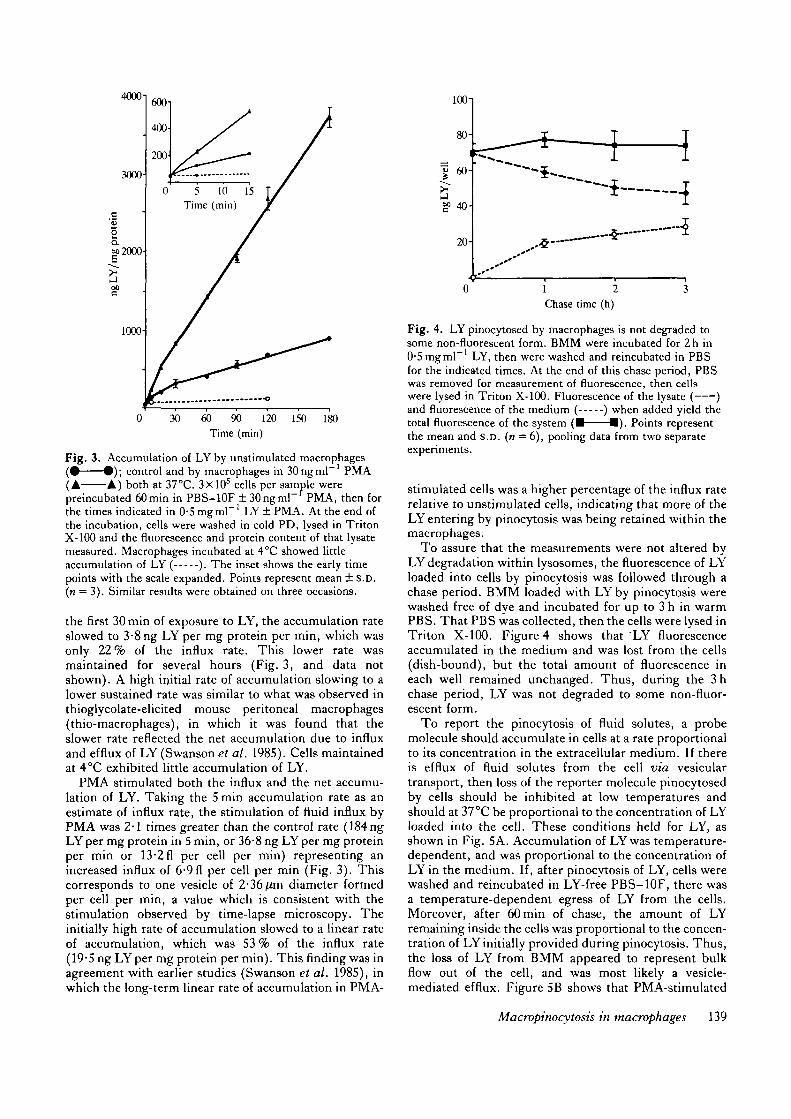
Fig. 3. Accumulation of LY by unstimulated macrophages( • • ) ; control and by macrophages in 30ngml~ PMA(A A) both at 37°C. 3X10⁵ cells per sample werepreincubated 60min in PBS-10F ± 30ngml~f PMA, then forthe times indicated in 0-5 mgml"1 LY ± PMA. At the end ofthe incubation, cells were washed in cold PD, lysed in TritonX-100 and the fluorescence and protein content of that lysatemeasured. Macrophages incubated at 4°C showed littleaccumulation of LY ( ). The inset shows the early timepoints with the scale expanded. Points represent mean ± S.D.(n = 3). Similar results were obtained on three occasions.
the first 30 min of exposure to LY, the accumulation rateslowed to 3-8 ng LY per mg protein per min, which wasonly 22% of the influx rate. This lower rate wasmaintained for several hours (Fig. 3, and data notshown). A high initial rate of accumulation slowing to alower sustained rate was similar to what was observed inthioglycolate-elicited mouse peritoneal macrophages(thio-macrophages), in which it was found that theslower rate reflected the net accumulation due to influxand efflux of LY (Swanson et al. 1985). Cells maintainedat 4°C exhibited little accumulation of LY.
PMA stimulated both the influx and the net accumu-lation of LY. Taking the 5 min accumulation rate as anestimate of influx rate, the stimulation of fluid influx byPMA was 2-1 times greater than the control rate (184ngLYper mg protein in 5 min, or 36-8 ng LYper mg proteinper min or 13-2 fl per cell per min) representing anincreased influx of 6-9fl per cell per min (Fig. 3). Thiscorresponds to one vesicle of 2-36/im diameter formedper cell per min, a value which is consistent with thestimulation observed by time-lapse microscopy. Theinitially high rate of accumulation slowed to a linear rateof accumulation, which was 53 % of the influx rate(19-5 ng LYper mg protein per min). This finding was inagreement with earlier studies (Swanson et al. 1985), inwhich the long-term linear rate of accumulation in PMA-
0 1 2 3Chase time (h)
Fig. 4. LY pinocytosed by macrophages is not degraded tosome non-fluorescent form. BMM were incubated for 2h in0-5 mgml"1 LY, then were washed and reincubated in PBSfor the indicated times. At the end of this chase period, PBSwas removed for measurement of fluorescence, then cellswere lysed in Triton X-100. Fluorescence of the lysate ( )and fluorescence of the medium ( ) when added yield thetotal fluorescence of the system ( • • ) . Points representthe mean and S.D. (n = 6), pooling data from two separateexperiments.
stimulated cells was a higher percentage of the influx raterelative to unstimulated cells, indicating that more of theLY entering by pinocytosis was being retained within themacrophages.
To assure that the measurements were not altered byLY degradation within lysosomes, the fluorescence of LYloaded into cells by pinocytosis was followed through achase period. BMM loaded with LYby pinocytosis werewashed free of dye and incubated for up to 3 h in warmPBS. That PBS was collected, then the cells were lysed inTriton X-100. Figure 4 shows that LY fluorescenceaccumulated in the medium and was lost from the cells(dish-bound), but the total amount of fluorescence ineach well remained unchanged. Thus, during the 3hchase period, LY was not degraded to some non-fluor-escent form.
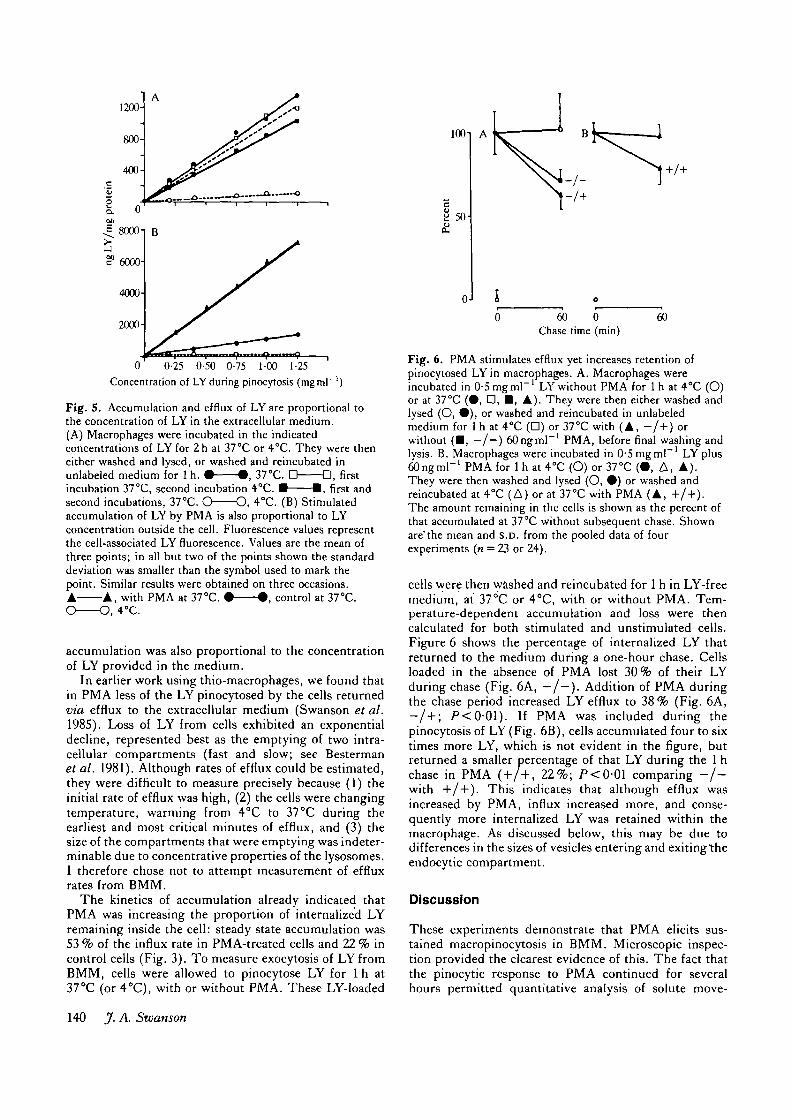
To report the pinocytosis of fluid solutes, a probemolecule should accumulate in cells at a rate proportionalto its concentration in the extracellular medium. If thereis efflux of fluid solutes from the cell via vesiculartransport, then loss of the reporter molecule pinocytosedby cells should be inhibited at low temperatures andshould at 37 °C be proportional to the concentration of LYloaded into the cell. These conditions held for LY, asshown in Fig. 5A. Accumulation of LYwas temperature-dependent, and was proportional to the concentration ofLY in the medium. If, after pinocytosis of LY, cells werewashed and reincubated in LY-free PBS-10F, there wasa temperature-dependent egress of LY from the cells.Moreover, after 60 min of chase, the amount of LYremaining inside the cells was proportional to the concen-tration of LY initially provided during pinocytosis. Thus,the loss of LY from BMM appeared to represent bulkflow out of the cell, and was most likely a vesicle-mediated efflux. Figure 5B shows that PMA-stimulated
Macrvpinocytosis in macrophages 139
1200-
0 0-25 0-50 0-75 1-00 1-25Concentration of LY during pinocytosis (mgmP 1 )
Fig . 5 . Accumulation and efflux of LY are proportional tothe concentration of LY in the extracellular medium.(A) Macrophages were incubated in the indicatedconcentrations of LY for 2 h at 37°C or 4°C. They were theneither washed and lysed, or washed and reincubated inunlabeled medium for 1 h. • • , 37°C. D D , firstincubation 37°C, second incubation 4°C. • 1 , first andsecond incubations, 37°C. O O , 4°C. (B) Stimulatedaccumulation of LY by PMA is also proportional to LYconcentration outside the cell. Fluorescence values representthe cell-associated LY fluorescence. Values are the mean ofthree points; in all bu t two of the points shown the standarddeviation was smaller than the symbol used to mark thepoint. Similar results were obtained on three occasions.A A , with P M A at 37°C. • • , control at 37°C.
accumulation was also proportional to the concentrationof LY provided in the medium.
In earlier work using thio-macrophages, we found thatin PMA less of the LY pinocytosed by the cells returnedvia efflux to the extracellular medium (Swanson et al.1985). Loss of LY from cells exhibited an exponentialdecline, represented best as the emptying of two intra-cellular compartments (fast and slow; see Bestermanet al. 1981). Although rates of efflux could be estimated,they were difficult to measure precisely because (1) theinitial rate of efflux was high, (2) the cells were changingtemperature, warming from 4°C to 37°C during theearliest and most critical minutes of efflux, and (3) thesize of the compartments that were emptying was indeter-minable due to concentrative properties of the lysosomes.I therefore chose not to attempt measurement of effluxrates from BMM.
The kinetics of accumulation already indicated thatPMA was increasing the proportion of internalized LYremaining inside the cell: steady state accumulation was53 % of the influx rate in PMA-treated cells and 22 % incontrol cells (Fig. 3). To measure exocytosis of LYfromBMM, cells were allowed to pinocytose LY for 1 h at37°C (or 4°C), with or without PMA. These LY-loaded
IOOT
c§ 50-
60 0Chase time (min)
60
Fig. 6. PMA stimulates efflux yet increases retention ofpinocytosed LY in macrophages. A. Macrophages wereincubated in O-SmgrnP1 LY without PMA for 1 h at 4°C (O)or at 37°C (•, D, • , A). They were then either washed andlysed (O, • ) , or washed and reincubated in unlabeledmedium for 1 h at 4°C (D) or 37°C with (A, - / + ) orwithout (• , —/—) oOngmP1 PMA, before final washing andlysis. B. Macrophages were incubated in 0-5mgml~' LY plusoOngmr1 PMA for 1 h at 4°C (O) or 37°C (•, A, A).They were then washed and lysed (O, • ) or washed andreincubated at 4°C (A) or at 37°C with PMA (A, + /+) .The amount remaining in the cells is shown as the percent ofthat accumulated at 37°C without subsequent chase. Shownare'the mean and s.D. from the pooled data of fourexperiments (n = 23 or 24).
cells were then washed and reincubated for 1 h in LY-freemedium, at 37°C or 4°C, with or without PMA. Tem-perature-dependent accumulation and loss were thencalculated for both stimulated and unstimulated cells.Figure 6 shows the percentage of internalized LY thatreturned to the medium during a one-hour chase. Cellsloaded in the absence of PMA lost 30% of their LYduring chase (Fig. 6A, —/—). Addition of PMA duringthe chase period increased LY efflux to 38% (Fig. 6A,- / + ; /»< 001). If PMA was included during thepinocytosis of LY (Fig. 6B), cells accumulated four to sixtimes more LY, which is not evident in the figure, butreturned a smaller percentage of that LY during the 1 hchase in PMA ( + / + , 22%; P<0-01 comparing - / -with + / + ). This indicates that although efflux wasincreased by PMA, influx increased more, and conse-quently more internalized LY was retained within themacrophage. As discussed below, this may be due todifferences in the sizes of vesicles entering and exiting theendocytic compartment.
Discussion
These experiments demonstrate that PMA elicits sus-tained macropinocytosis in BMM. Microscopic inspec-tion provided the clearest evidence of this. The fact thatthe pinocytic response to PMA continued for severalhours permitted quantitative analysis of solute move-
140 jf. A. Swanson
LYd,/d<. s,/se \,/\c Accumulation
curve
1 1 1
2 4 8
16 64
Time
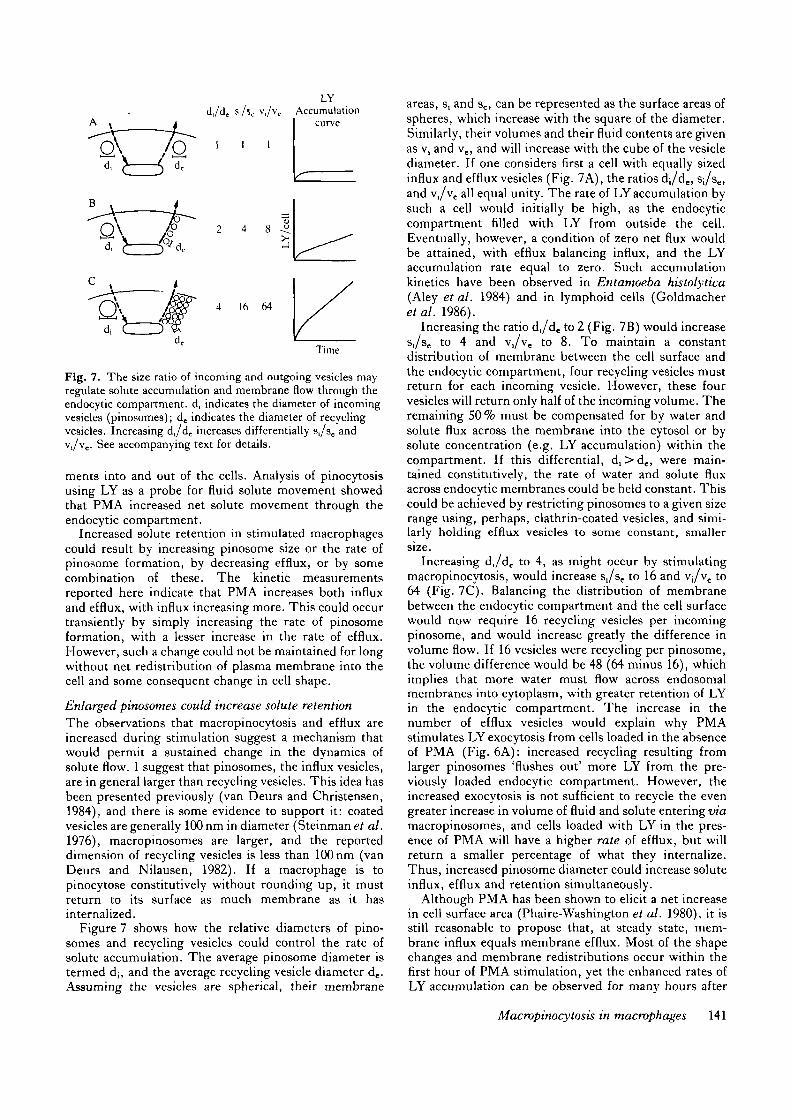
Fig. 7. The size ratio of incoming and outgoing vesicles mayregulate solute accumulation and membrane flow through theendocytic compartment, d, indicates the diameter of incomingvesicles (pinosomes); de indicates the diameter of recyclingvesicles. Increasing d,/de increases differentially s,/se andv,/ve. See accompanying text for details.
merits into and out of the cells. Analysis of pinocytosisusing LY as a probe for fluid solute movement showedthat PMA increased net solute movement through theendocytic compartment.
Increased solute retention in stimulated macrophagescould result by increasing pinosome size or the rate ofpinosome formation, by decreasing efflux, or by somecombination of these. The kinetic measurementsreported here indicate that PMA increases both influxand efflux, with influx increasing more. This could occurtransiently by simply increasing the rate of pinosomeformation, with a lesser increase in the rate of efflux.However, such a change could not be maintained for longwithout net redistribution of plasma membrane into thecell and some consequent change in cell shape.
Enlarged pinosomes could increase solute retentionThe observations that macropinocytosis and efflux areincreased during stimulation suggest a mechanism thatwould permit a sustained change in the dynamics ofsolute flow. I suggest that pinosomes, the influx vesicles,are in general larger than recycling vesicles. This idea hasbeen presented previously (van Deurs and Christensen,1984), and there is some evidence to support it: coatedvesicles are generally 100 nm in diameter (Steinman et al.1976), macropinosomes are larger, and the reporteddimension of recycling vesicles is less than 100 nm (vanDeurs and Nilausen, 1982). If a macrophage is topinocytose constitutively without rounding up, it mustreturn to its surface as much membrane as it hasinternalized.
Figure 7 shows how the relative diameters of pino-somes and recycling vesicles could control the rate ofsolute accumulation. The average pinosome diameter istermed d;, and the average recycling vesicle diameter de.Assuming the vesicles are spherical, their membrane
areas, s, and se, can be represented as the surface areas ofspheres, which increase with the square of the diameter.Similarly, their volumes and their fluid contents are givenas v, and ve, and will increase with the cube of the vesiclediameter. If one considers first a cell with equally sizedinflux and efflux vesicles (Fig. 7A), the ratios dj/de, S|/se,and v,/ve all equal unity. The rate of LY accumulation bysuch a cell would initially be high, as the endocyticcompartment filled with LY from outside the cell.Eventually, however, a condition of zero net flux wouldbe attained, with efflux balancing influx, and the LYaccumulation rate equal to zero. Such accumulationkinetics have been observed in Entamoeba histolytica(Aley et al. 1984) and in lymphoid cells (Goldmacheretal. 1986).
Increasing the ratio d,/de to 2 (Fig. 7B) would increases,/se to 4 and v,/ve to 8. To maintain a constantdistribution of membrane between the cell surface andthe endocytic compartment, four recycling vesicles mustreturn for each incoming vesicle. However, these fourvesicles will return only half of the incoming volume. Theremaining 50% must be compensated for by water andsolute flux across the membrane into the cytosol or bysolute concentration (e.g. LY accumulation) within thecompartment. If this differential, d!>de, were main-tained constitutively, the rate of water and solute fluxacross endocytic membranes could be held constant. Thiscould be achieved by restricting pinosomes to a given sizerange using, perhaps, clathrin-coated vesicles, and simi-larly holding efflux vesicles to some constant, smallersize.
Increasing d^d,. to 4, as might occur by stimulatingmacropinocytosis, would increase s,/^ to 16 and v;/ve to64 (Fig. 7C). Balancing the distribution of membranebetween the endocytic compartment and the cell surfacewould now require 16 recycling vesicles per incomingpinosome, and would increase greatly the difference involume flow. If 16 vesicles were recycling per pinosome,the volume difference would be 48 (64 minus 16), whichimplies that more water must flow across endosomalmembranes into cytoplasm, with greater retention of LYin the endocytic compartment. The increase in thenumber of efflux vesicles would explain why PMAstimulates LY exocytosis from cells loaded in the absenceof PMA (Fig. 6A): increased recycling resulting fromlarger pinosomes 'flushes out' more LY from the pre-viously loaded endocytic compartment. However, theincreased exocytosis is not sufficient to recycle the evengreater increase in volume of fluid and solute entering viamacropinosomes, and cells loaded with LY in the pres-ence of PMA will have a higher rate of efflux, but willreturn a smaller percentage of what they internalize.Thus, increased pinosome diameter could increase soluteinflux, efflux and retention simultaneously.
Although PMA has been shown to elicit a net increasein cell surface area (Phaire-Washington et al. 1980), it isstill reasonable to propose that, at steady state, mem-brane influx equals membrane efflux. Most of the shapechanges and membrane redistributions occur within thefirst hour of PMA stimulation, yet the enhanced rates ofLY accumulation can be observed for many hours after
Macropinocytosis in macrophages 141
addition of PMA. Therefore, after the first hour in PMA,steady state accumulation of LY should occur withoutgross redistribution of membrane.
One puzzling aspect of the kinetics remains, and that iswhy the LY accumulation curves become linear duringthe first hour and remain so for many hours. In theory,concentrating LY in endocytic compartments shouldcontinually raise its concentration in the efflux vesicles,and should consequently increase its rate of effluxindefinitely; that is, accumulation should always becurvilinear. Linear accumulation kinetics indicate that atsome point, independent of LY concentration outside thecell, both influx and efflux are constant terms. Onepossible explanation is that solutes such as LY aresequestered into a compartment that does not recycle itscontents. Such a compartment was proposed by Bester-man et al. (1981). How does one fit a non-participatingorganelle into a scheme of balanced membrane flow intoand out of the cell? Here again morphology offers a clue.Cohn and Benson (1965) observed, and I confirm thatobservation here, that after their formation, macropino-somes gradually shrink, ultimately either vanishing orcondensing into a dense, lysosomal granule. Pinosomes,and the endosomes and lysosomes they fuse with, mayrecycle membrane and solutes at a progressively decreas-ing rate. LY is trapped in these maturing pinosomes, andmore is trapped in those that start out larger (macropino-somes). Repeated cycles of this could allow the non-degradable probe to accumulate indefinitely.
The author thanks Philip Knapp, Dr Paul McNeil, EstherRacoosin and Gregory Cannon for technical assistance anduseful suggestions, and Drs David Begg and Daniel Kiehart forthe use of their equipment. This work was supported by grantsfrom the Whitaker Health Sciences Fund and the NIH (CA44328).
References
ALEY, S. B., COHN, Z. A. & SCOTT, W. A. (1984). Endocytosis inEntamoeba histolytica. J. exp. Med. 160, 724-737.
BESTERMAN, J. M., AIRHART, J. A., WOODWORTH, R. C. & Low, R.B. (1981). Exocytosis of pinocytosed fluid in cultured cells: Kineticevidence for rapid turnover and compartmentation. J. Cell Biol. 91,716-727.
CELADA, A., GRAY, P. W., RINDER, E. & SCHREIBER, R. D. (1984).
Evidence for a gamma-interferon receptor that regulatesmacrophage tumoncidal activity. J. exp. Med. 160, 55-74.
COHN, Z. A. & BENSON, B. (1965). The in vitro differentiation ofmononuclear phagocytes. II. The influence of serum on granuleformation, hydrolase production and pinocytosis. J. exp. Med. 121,835-848.
GOLDMACHER, V. S., TlNNEL, N. L. & NELSON, B. C. (1986).Evidence that pinocytosis in lymphoid cells has a low capacity.J. Cell Biol. 102, 1312-1319.
LEWIS, W. H. (1931). Pinocytosis. Johns Hopkins Hosp. Bull. 49,17-27.
MCLEAN, I. W. & NAKANE, P. K. (1974). Periodate-lysine-paraformaldehyde fixative. A new fixative for immunoelectronmicroscopy. J. Histochem. Cytochem. 22, 1077-1083.
OSBORN, M., WEBSTER, R. E. & WEBER, K. (1978). Individual
microtubules viewed by immunofluorescence and electronmicroscopy in the same PtK2 cell. J. Cell Biol. 77, R27-R34.
PHAIRE-WASHINGTON, L., WANG, E. & SILVERSTEJN, S. C. (1980).
Phorbol myTistate acetate stimulates pinocytosis and membranespreading in mouse peritoneal macrophages. .7. Cell Biol. 86,634-640.
SMITH, P. K., KROHN, R. I., HERMANSON, G. T., MALUA, A. K.,
GARTNER, F. H., PROVENZANO, M. D., FUTIMOTO, E. K., GOEKE,
N. M., OLSON, B. J. & KXENK, D. C. (1985). Measurement ofprotein using bicinchoninic acid. Analyt. Biochem. 150, 76—85.
STEINMAN, R. M., BRODIE, S. E. & COHN, Z. A. (1976). Membrane
flow during pinocytosis. A stereological analysis. J. Cell Biol. 68,665-687.
SWANSON, J. A., YlRINEC, B. D. & SlLVERSTEIN, S. C. (1985).Phorbol esters and horseradish peroxidase stimulate pinocytosisand redirect the flow of pinocytosed fluid in macrophages. J. CellBiol. 100, 851-859.
SWANSON, J. A., BURKE, E. & SILVERSTEIN, S. C. (1987). Tubular
lysosomes accompany stimulated pinocytosis in macrophages.J. Cell Biol. 104, 1217-1222.
VAN DEURS, B. & CHRISTENSEN, E. I. (1984). Endocytosis in kidneyproximal tubule cells and cultured fibroblasts: a review of thestructural aspects of membrane recycling between plasmamembrane and endocytic vacuoles. Eur.J. Cell Biol. 33, 163-173.
VAN DEURS, B. & NILAUSEN, K. (1982). Pinocytosis in mouse L-fibroblasts: Ultrastructural evidence for a direct membrane shuttlebetween the plasma membrane and the lysosomal compartment.J. Cell Biol. 94, 279-286.
VOGEL, S. N., WEINBLATT, A. C. & ROSENSTREICH, D. L. (1981).
Inherent macrophage defects in mice. In Immunologic Defects ofLaboratory Animals, vol. 1 (M. E. Gershwin and B. Marchant,editors). Plenum Press, New York, pp. 327-357.
WILLINGHAM, M. C. & YAMADA, S. S. (1978). A mechanism for thedestruction of pinosomes in cultured fibroblasts: piranhalysis.J. Cell Biol. 78, 480-487.
(Received 21 March 1989-Accepted 28 May 1989)
142 J. A. Swanson