phosphorous separation in the akd plant in...
TRANSCRIPT

Phosphorous separation in the AKD plant in
Trollhättan A study showing if/how the amount of phosphorous changes due to
different parameters
Bachelor of Science Thesis in Chemical Engineering
Zeinab Abdallah
Department of Chemical and Biological Engineering
CHALMERS UNIVERSITY OF TECHNOLOGY
Gothenburg, Sweden, 2011
Här finns utrymme att lägga in en bild.
Tänk bara på att anpassa så att nedersta
textraden ligger kvar i nederkant.

Table of Contents
Abstract…………………………………………………………………………….…… 1
1. Background…………………………………………………………………………. 2
1.1 Paper and Paper Manufacturing…………………………………………..2 – 4
1.2 AKD in Paper Manufacturing……………………………………………..4 - 5
1.3 The Aim of the Study……………………………………………………….....5
2. Chlorination Process……………………………………………………………….. 6
2.1 The first chlorination step…………………………………………….…..6 – 7
2.2 The second chlorination step…….……………………………………… 7 – 8
2.3 The dimerization step…………………………………………………… 8 – 9
3. Raw Materials used in the Chlorination process………………………………….10
3.1 Fatty Acids…………………………………………………………………..10
3.2 Phosphorous trichloride, PCl3……………………………………………….10
3.3 Thionyl chloride, SOCl2……………………………………………………...10
3.4 Dicalite, filter aid……………………………………………………………11
3.5 Activated Carbon……………………………………………………………11
4. Materials and Method……………………………………………………………....12
4.1 Observations………………………………………………………………….12
4.2 Method…………………………………………………………………12 - 13
4.3 Materials………………………………………………………………….....13
4.4 Chemicals..................................................................................................... 13
4.5 The Laboratory Performance..................................................................13 - 14
5. Results and Discussion............................................................................................. 15
5.1 Variance in analysis (1st and 2
nd chlorination reactor)..................................15
5.2 The Amount of Phosphorous compared to Batch number.................... 15 - 16
5.3 The Amount of Phosphorous compared to the content of Fatty Acid in the
samples...................................................................................................17 – 18
5.4 Correlation of the amount of phosphorous in 2nd
chlorination reactor to the
amount of phosphorous in 1st
chlorination reactor…...………………………18
5.5 Alterations of the stir time in 1st chlorination reactor………………………..19
6. Conclusions................................................................................................................20
7. Future Recommendations........................................................................................20
8. References................................................................................................................. 21
Appendices A – D.....................................................................................................22 - 28

Page | 1
Chalmers University of Technology
Degree Program: Chemical Engineering
Program Division: Department of Chemistry and Biotechnology
Title: Phosphorous separation in the AKD plant in Trollhättan
Author: Zeinab Abdallah
Year: 2011
Number of pages: 28
Abstract
Paper is a very important communicating system and is immensely manufactured all over the world. It
indicates that men have developed a lot since the Stone Age where communications were written on
tablets or in caves. Paper is mainly used for drying, drawing, printing, writing and packaging.
Paper is manufactured by harvesting trees and processing it into pulp where later several
materials or substances are added to alter the properties of the paper such as making it more water
resistant. Sizing is when a substance such as AKD (alkyl ketene dimer), which is produced in the plant
in Trollhättan, is added to the pulp to make the paper water resistant.
The purpose of this study was to study the phosphorous separation in the chlorination process in
the AKD plant in Trollhättan.
The phosphorous amount were compared to several parameters such as the batch number performed in
the process, the content of fatty acid in both the fatty acid chloride samples from both the 1st and 2
nd
chlorination reactors, the amount of phosphorous separated in the 1st, 2
nd and 3
rd separation processes
in the chlorination process in 1st chlorination reactor.
A correlation between the batch number and the amount of phosphorous in the samples was
performed and the result showed that the amount of phosphorous was not affected by the order of the
batch numbers however it showed that the High Melting Point (HMP) fatty acid was lower and more
stabilized than the Low Melting Point (LMP) fatty acid at a specific limit range. This correlation was
shown in all the tests that were performed. However the correlation between the amount of
phosphorous and the content of fatty acid, in the samples, showed a different result where the amount
of phosphorous increased with an increase in the content of fatty acid.
Alteration of the stir time in 1st chlorination reactor was performed to see if any changes would
occur in the system or if the amount of phosphorous would change in samples. The results of the small
alterations performed in the reactor did not contribute to any changes in the amount of phosphorus in
the sample.
A suggestion is to further investigate how much alterations could be done to the stir time in the 1st
reactor.
Page | 2
1. Background
Eka Chemicals is a part of the multinational company AkzoNobel, which has closer to 65000
employees all over the world. AkzoNobel works with the production of pharmaceuticals,
paint and various chemical. Eka Chemicals is specialized in producing paper chemicals.
Since 1996 Eka Chemicals in Trollhättan has been working on the production of AKD-
wax (alkyl ketene dimer), which is one of several other paper chemicals that is produced and
added into the paper manufacturing to influence the paper’s properties. The wax is produced
in two different qualities where the difference lies in the number of carbon atoms. The wax is
later transported into Eka’s dispersion facilities to be further processed to AKD-emulsion,
which is used as a sizing agent in paper manufacturing.
Paper is a material that is used for writing, printing, drawing, packaging and also for
drying. To enhance the printability with water based ink, i.e. less blurring; the sizing agent
such as the AKD-emulsion is added. The function of the sizing agent is that it alters the
properties of the paper to make it more hydrophobic (more water resistant) giving better
printability and better wet strength, i.e. cannot be easily ruined in contact with water.
In the plant, Eka Chemicals in Trollhättan, the substance AKD is produced by a two step
reaction, the chlorination and the dimerization reaction.
The chlorination, which is performed in two steps, has the main purpose is to produce the
substance called acid chloride. Acid chloride is an extremely reactive chemical that easily
could be further reacted to the AKD. The properties of the acid chloride are that it releases
the chlorine atom and reacts to other substances.
During the first chlorination step a separation step is performed. If this separation isn’t
separated correctly, problems can occur in the second chlorination step in the formation of
phosphorous acid and in the washing step of the AKD.
The dimerization is the second reaction step, where two acid chloride molecules react
with each other in the presence of the help chemical Triethylamine, TEA.
Except for producing AKD one also produces the byproduct Triethylamine-
hydrochloride, TEA-HCl, which is formed by bonding the chlorine molecules with TEA. 1, 7
1.1 Paper and Paper Manufacturing
Paper has not only been an important system of communication but it is also commonly used
as blue prints for many great inventions, studies and reading. If men hadn’t invented and
developed paper, the world would probably still be living in the Stone Age where
communications with each other would be through inscriptions on cave walls and tablets.
Worldwide consumption of the harvested trees used for pulp production is 42 percent i.e.
175 million tons (2006).
The wood that is harvested to achieve pulp making contains important substances such as
cellulose fibers (the main material in paper making) and lignin (a polymer that binds the
fibers together) and hemicelluloses (a carbohydrate polymer). The aiming of pulping is to
break down the bulk structure of the fiber source into constituent fibers. The most preferable
type of tree is coniferous tree because the cellulose fiber in this pulp is longer therefore
making a much stronger paper.
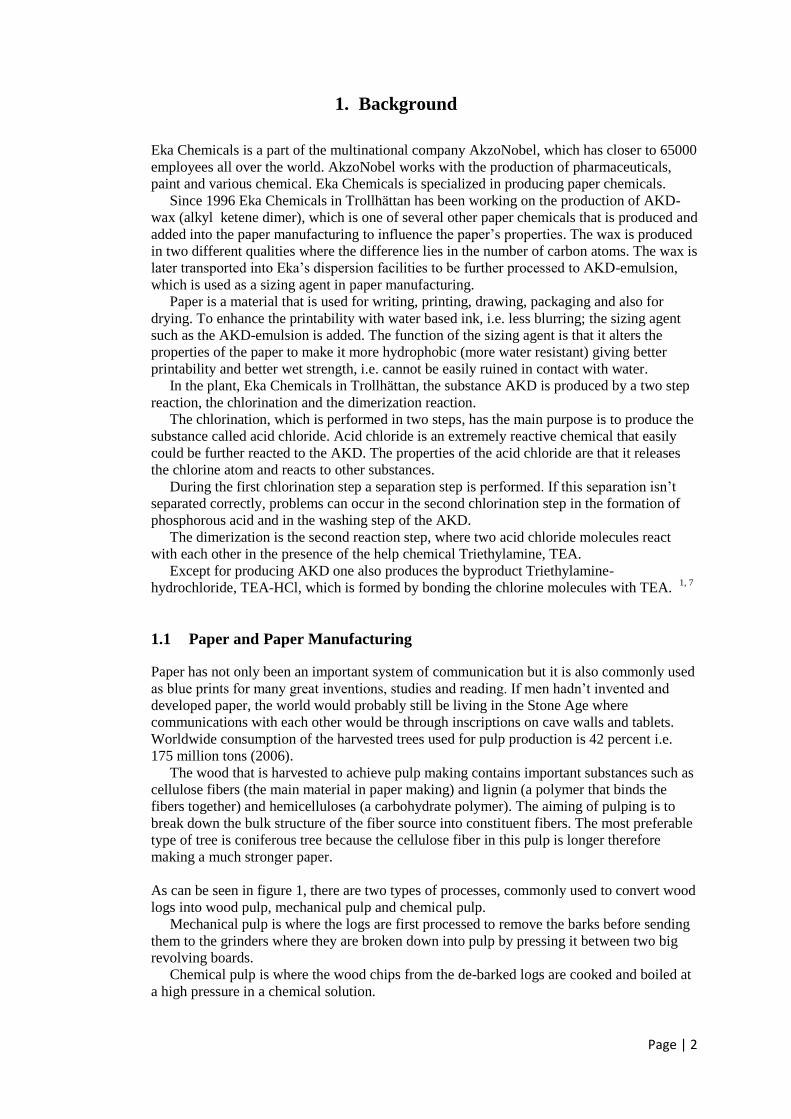
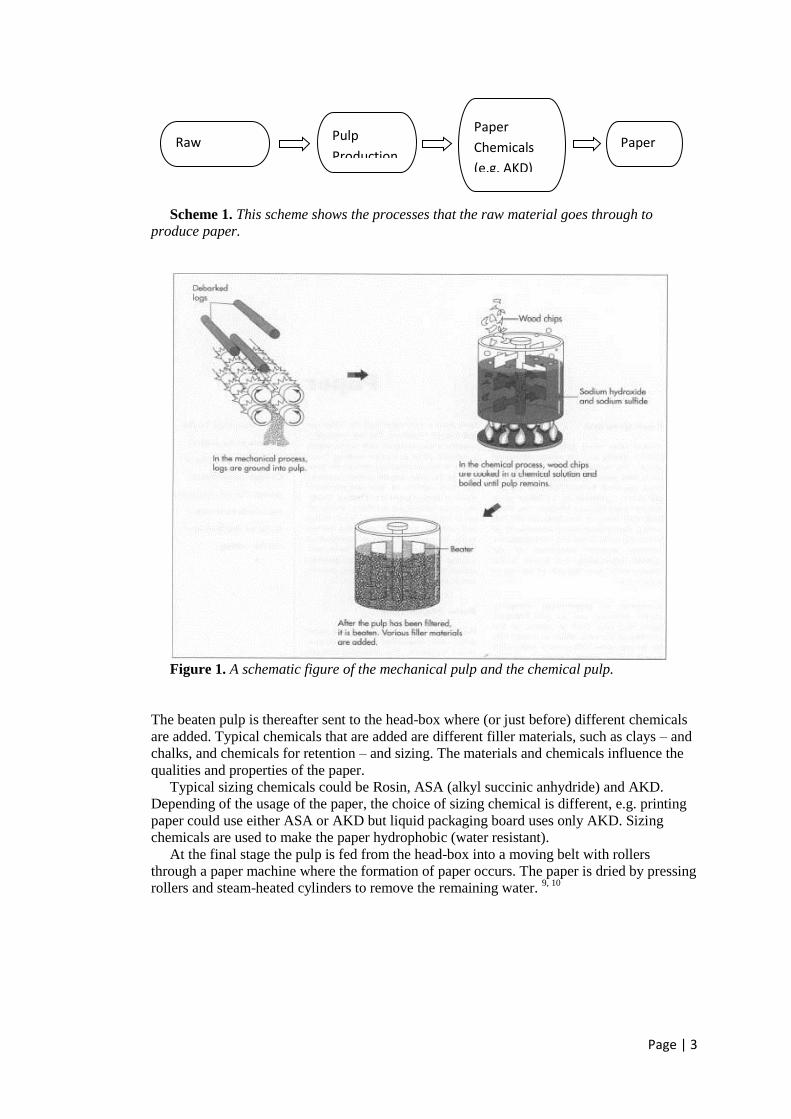
As can be seen in figure 1, there are two types of processes, commonly used to convert wood
logs into wood pulp, mechanical pulp and chemical pulp.
Mechanical pulp is where the logs are first processed to remove the barks before sending
them to the grinders where they are broken down into pulp by pressing it between two big
revolving boards.
Chemical pulp is where the wood chips from the de-barked logs are cooked and boiled at
a high pressure in a chemical solution.
Page | 3
Scheme 1. This scheme shows the processes that the raw material goes through to
produce paper.
Figure 1. A schematic figure of the mechanical pulp and the chemical pulp.
The beaten pulp is thereafter sent to the head-box where (or just before) different chemicals
are added. Typical chemicals that are added are different filler materials, such as clays – and
chalks, and chemicals for retention – and sizing. The materials and chemicals influence the
qualities and properties of the paper.
Typical sizing chemicals could be Rosin, ASA (alkyl succinic anhydride) and AKD.
Depending of the usage of the paper, the choice of sizing chemical is different, e.g. printing
paper could use either ASA or AKD but liquid packaging board uses only AKD. Sizing
chemicals are used to make the paper hydrophobic (water resistant).
At the final stage the pulp is fed from the head-box into a moving belt with rollers
through a paper machine where the formation of paper occurs. The paper is dried by pressing
rollers and steam-heated cylinders to remove the remaining water. 9, 10
Raw
Material
Pulp
Production
Paper
Chemicals
(e.g. AKD)
Paper

Page | 4
Figure 2. The pulp is sized and formed into paper.
10
1.2 AKD in Paper Manufacturing
Paper is mainly produced by uncovering cellulose from various wood raw materials, where
the main types of wood used in Sweden are birch and conifer. This is performed by boiling
the substances that binds the fibers in the raw material.
Cellulose is a hydrophilic material, i.e. consisting of a carbon backbone with many
hydroxyl groups attached, and it is one of the most costly parts in a paper. Depending on the
final usage of the paper, different chemicals are added to alter the properties of the paper
when making it. One such chemical is sizing agents, e.g. AKD, that makes the paper more
hydrophobic (water resistant) and gives the paper qualities such as wet strength and good
printability. Other chemicals that are added are typical kaolin to lower the production cost.
Before AKD is transported to the paper industries, it is homogenized in Eka’s dispersion
facilities to make it lasting and stable. This is done by mixing the AKD wax with water and
other chemicals. In the paper factory the AKD-emulsion is mixed with the pulp and is
divided equally into the mass. In the dry section of the paper machine, the particles are
melted, flows through the mass and react there with the hydroxyl groups of to the cellulose,
which at the same time makes the paper hydrophobic.1
Normally when water touches the paper, it is absorbed very quickly through the fibers
due to the capillaries in the paper structure and it is this process that is affected by adding a
sizing agent.

Page | 5
Figure 3. A schematic picture of a water droplet on the paper fibers; to the left without
sizing agent and to the right with a sizing agent.
As can be seen in figure 3, the sizing agent stops the water from diffusing into the fibers. In
fact the sizing agent AKD slows the process and lowers the surface energy.
When the dispersed AKD is deposited on the fiber, it is surrounded by water and will not
spread along the fiber because it would cause an undesirable contact between the water and
the hydrocarbon material. When the water has evaporated the dispersion spreads along the
fiber surface and a reaction between the cellulose and the dispersion takes place as shown in
reaction (1).
(1) R-CH=C—CH-R + Cellulose-OH → R-CH2-C-CH-R
| | || |
O – C=O O C=O
|
O-Cellulose
Sizing (hydrophobizing) reaction: This is the reaction that occurs on the fiber surface
between the AKD dispersion and the fiber Cellulose.2
1.3 The Aim of the Study
The purpose of this study was to study the phosphorous separation in the chlorination
process in the AKD plant in Trollhättan. By doing this, one wants to see how the
chlorination process works on regular basis and how it is affected by normal standard
operations.

Page | 6
2. The AKD process
The purpose of the chlorination process is to make the fatty acid more reactive by converting
it to an acid chloride. The chloride is a very good leaving group for further reactions, e.g. the
AKD reaction but it also reacts strongly with water producing the fatty acid and hydrochloric
acid. The chlorination process is entailed that the hydroxyl group in the end of the fatty acid
molecule is exchanged to a chlorine molecule.
As mentioned earlier the chlorination is performed in two steps with different
chlorinating agents, the first one by using phosphorous trichloride, PCl3 and the second one
by using thionyl chloride, SOCl2.
It is performed like this in order to optimize both the costs and the quality of the acid
chloride. The phosphorous trichloride is more cost efficient but if one only use it in the
process the amount of phosphorous in the product gets higher than the desirable amount and
will thereby cause disturbance in the dimerization where the final product is produced. If
only the thionyl chloride would be used as a chlorinating agent it would create large amounts
of SO2 which will be required to be taken care of which the plant is not designed for.
Two fatty acid chlorides are then further reacted to AKD by using Triethylamine as a helping
chemical.
(2) 2 PCl3 + 6 RCOOH → 5 RCOCl + RCOOH + H4P2O5 + HCl
Filter aid
(3) SOCl2 + RCOCl + RCOOH → 2 RCOCl + SO2 + HCl
(4) 2 R-CH2COCl + 2 Et3N → R-CH=C—CH-R + 2 Et3N*HC
| |
O – C=O
In the first chlorination step (reaction (2), which is performed in a reactor called 1st
chlorination reactor, the phosphorous trichloride is reacted with fatty acid and forms fatty
acid chloride along with other substances such as phosphorous anhydride and hydrochloride
acid.
The reaction (3), which is called the final step of the chlorination process, occurs in a
reactor called 2nd
chlorination reactor. The fatty acid chloride is mixed with thionyl chloride
but also with the remaining fatty acid because all fatty acid does not react completely in the
first step.
The reaction (4), which is called the dimerization, is where two acid chloride molecules
react with each other in the presence of the help chemical Triethylamine, TEA, and
produces the final product/sizing chemical AKD and the byproduct Triethylamine-
hydrochloride, TEA-HCl.
2.1 The first chlorination step
The first chlorination step is performed in 1st
chlorination reactor where fatty acid is added
and there after the dosage of the phosphorous trichloride is done during mixing. When the
dosage of the phosphorous trichloride is finished the mixer runs for an additional 30 seconds.
This last mixing step was altered for two batches to investigate the mixing effect on the
phosphorous separation.

Page | 7
The following reaction steps (5-9) describe the sub reactions that occur in the first
chlorination step however the fatty acid that remains in the solution are not shown in this
reaction scheme.
(5) 2 R-COOH + 2 PCl3 2 R-COCl + 2 HOPCl2
(6) 2 R-COOH + 2 HOPCl2 2 R-COCl + 2 (OH)2PCl
(7) R-COOH + (OH)2PCl R-COCl + H3PO3
(8) H3PO3 + (OH)2PCl (OH)2P-O-P-(OH)2 + HCl
____________________________________________________________
(9) 5 R-COOH + 2 PCl3 5 R-COCl + (OH)2P-O-P-(OH)2 + HCl
Chlorination reaction step 1: Sub reactions (5-8), Total reaction (9)
The hydrochloric acid, which is formed as a gas, is evaporated from the reactor and
absorbed by a scrubber. The hydrochloric acid can later be reused in the plant.
The reaction is slightly endothermic and requires heat to be able to achieve the desirable
amount of product.
During the reaction the mixture becomes a two phase system which is separated. The
solution separates into two phases where the upper phase consists of the acid chloride and
fatty acid while the lower phase consists of the different phosphorous substances. The lower
phase is later drained and transported for further reprocessing to phosphorous acid, H3PO3,
while the upper phase is transported to the next chlorination step in the 2nd
chlorination
reactor.
If the separation in the first chlorination step is not complete there will be problems in the
process down streams, both in the final chlorination step, in the production of the
phosphorous acid and in the dimerization. If the phosphorous phase contains too much fatty
acid and acid chloride, it would lead to a contaminated phosphorous acid. An increased
amount of phosphorous material in the fatty acid chloride leads to an increasing dosage of
the chlorinating agent SOCl2 in the final step and the appearance of the filter cake becomes
tenacious and sticky.
Problems in the dimerization process may be due to that the phosphorous substances will
bind to the acid chloride giving surface active components e.g. phosphonates and will
thereby cause problems in the washing process of the final AKD. If the acid chloride
contains a high amount of surface active substance, the AKD washing will become an
emulsion, which makes it impossible to wash.
2.2 The second chlorination step
As mentioned previously there is fatty acid left after the first step of the chlorination process,
therefore in the second chlorination step the other chlorinating agent SOCl2, thionyl chloride,
is reacted as shown in reaction (10). The SOCl2 reacts with the fatty acid creating the fatty
acid chloride together with hydrochloride and sulfur dioxide which are evaporated and
collected in a scrubber.
The thionyl chloride is a very aggressive substance and may also react with the undesirable
phosphorous substance making a sticky hydrophilic material which has to be separated. To
achieve this separation, dicalite and active carbon are added. The filter aid gives a large

Page | 8
surface area where the phosphorous substances and other contaminated substances that are
left in the solution could be collected and filtered of.
(10) R-COOH + SOCl2 → R-COCl + HCl + SO2
Chlorination reaction step 2: Shows how the fatty acid reacts with thionyl chloride and
forms acid chloride.
2.3 The dimerization step
As seen in reaction 11, the fatty acid chloride is transported into the dimerization process for
the final synthesis with the help chemical TEA to produce the final product AKD.
(11) 2 R-CH2COCl + 2 Et3N → R-CH=C—CH-R + 2 Et3N*HCl
| |
O – C=O
O :O-
⁄⁄ ⁄
(12) 2R-CH2-C → 2R-CH2-C-Cl \ |
Cl Et– N+–Et
.. | 2 Et–N–Et Et
|
Et
:O-
(13) ⁄
2 R-CH2–C–Cl → R-CH=C –– CH-R + 2 Et3N*HCl
| | |
Et–N+–Et O –– C==O
|
Et
Reaction 12 and 13 show the mechanism occurring when triethylamine and fatty acid
chloride reacts. The ion pair on the nitrogen atom in the triethylamine makes a nucleophilic
attack on the positive carbon atom. Then it eliminates the chloride ion and at the same time a
hydrogen atom is removed from the nitrogen and reacts with the chlorine atom and forms
hydrochloric acid.
Afterwards the triethylamine is removed from the acid chloride and reacts with the
hydrochloric acid and forms triethylamine-hydrochloride. At the same time the two acid
chloride molecules forms AKD.
In the dimerization process two fatty acid chloride molecules reacts with each other in the
presence of the help chemical Triethylamine, TEA and forms the sizing product AKD. At the
same time the two chlorine atoms attached to the acid chloride binds to the help chemical
and forms Triethylamine-hydrochloride, TEA-HCl. There are several of steps in this process
before the AKD becomes a completed product in the form of small pastilles.
In the first step of the dimerization, the chemicals are dosed slowly into the dimerization
reactor to control the size of the wax crystals. If they are dosed quickly in the beginning the
size of the crystals becomes wrong which gives a product with a higher viscosity. Later on
when the dosage of chemicals is finished, the chemicals are mixed strongly so the byproduct
TEA-HCl can form crystals with the right size.

Page | 9
The next step in the dimerization is called the washing step, which is divided into two steps
because the AKD product if washed with two different chemicals, hydrochloric acid and
water.
In the first step, the acid wash the AKD is washed with hydrochloric acid in order to clean
AKD from TEA. A separation occurs to separate the TEA-HCl from the AKD and then the
TEA-HCl is drained to a TEA-recycling system to gain TEA again.
In the mean time, when the acid wash is ongoing, a preparation for the water wash is
occurring. Another separation of the AKD phase and the water phase is performed, where
the water phase is later drained to another reactor. The stir time in the washing reactor is
very important due to if the chemicals are not stirred slowly the stirring can affect the AKD
wax by breaking it to small particles and an emulsion is formed.
The final step of the dimerization is the drying process, where the AKD is dried because it
contains a lot of water. The water and remaining parts of TEA and TEA-HCl are transported
through to the scrubber systems. When the drying is finished the AKD is transported in the
storage tank where it is later cooled down, filtered and is formed into pastilles so it can be
packed into big bags.
The dimerization is performed both in the batch line and the continuous line. 1, 8, 11, 12
Page | 10
3. Raw material used in the Chlorination process
As mentioned in the previous chapter, the chlorination process is done in two reactions. In
this chapter the characteristics of the fatty acid, the phosphorous trichloride and thionyl
chloride and the other raw materials will be discussed.
3.1 Fatty acid, RCOOH
A fatty acid is a carboxylic acid with a long aliphatic chain that is either unsaturated or
saturated. The used fatty acids are typically saturated with a difference in chain length and
melting point. Therefore they are separated into two types of fatty acid, low melting point
(LMP) fatty acid and high melting point (HMP) fatty acid. The LMP fatty acid comes
normally from tallow or palm and the HMP fatty acid comes typically from rapeseed.
The fatty acid must always be delivered in liquid state so it could be transferred into the
system. Both fatty acids are required to be heated to a certain temperature, 60° C, when
being transferred into the system because of the possibility of the acid freezing.
The fatty acid that is delivered has to be saturated, has to have a low peroxide value and a
good color to give a good product quality. The saturation is measured by the iodine value
which tells the amount of the double bonds existing in the fatty acid. 1, 3, 4, 13
3.2 Phosphorous trichloride, PCl3
Though phosphorous trichloride has become a much more expensive raw material to buy it is
still the main chlorination reactant that is used in the chlorination process.
As can be seen in reaction (14), phosphorous trichloride is produced by the combustion of
liquid phosphorous in dry stream of chlorine gas. It is mainly used to manufacture the
phosphorous acid (phosphonic acid), which is formed as byproduct in the chlorination
process, step 1.
(14) P4 + 6Cl2 4 PCl3 The phosphorous trichloride has no color as a liquid in room temperature and it reacts
strongly with many other substances and is therefore poisonous. For instance reactions with
water produce phosphorous acid and hydrochloric acid. In extreme cases the formation of
phosphine may occur, which is a very flammable and highly toxic chemical substance. 1, 5, 13
3.3 Thionyl chloride, SOCl2
Thionyl chloride is a very desirable chlorinating agent in the chemical industry. Thionyl
chloride is used for production of acid chlorides from carboxylic acids such as fatty acids.
Thionyl chloride is a nonflammable chemical substance and it has a very pungent odor
that irritates. It can be produced in two different ways; i) reaction between sulfur, chlorine
and oxygen or ii) reaction between sulfur trioxide and chlorine. Thionyl chloride has almost
the same characteristics as phosphorous trichloride but the difference is that when thionyl
chloride is mixed with water, besides the formation of hydrochloric acid gas, sulfur dioxide
is formed and is a very smelly poisonous gas. 1, 6, 13

Page | 11
3.4 Dicalite, filter aid
The second and final step in the chlorination process starts by adding a filter aid, Dicalite,
into the reactor 2nd
chlorination reactor. The function of this substance is that it adsorbs a
large part of the hydrophilic phosphorous substance that the thionyl chloride creates. Dicalite
is a white powder based on silica, SiO2.The silica dust must be treated very carefully because
there is a risk of getting silicosis, a disease causing lung damages. 1, 13
3.5 Activated Carbon
Activated carbon is added in the final stages of the second chlorination step along with
thionyl chloride. The purpose is to adsorb different hydrophobic (organic) phosphorous
and/or sulfuric substances, which could discolor the final product AKD. 1, 13

Page | 12
4. Materials and Method
This chapter covers the materials and the different methods used during the analysis that was
performed to determine the amount of phosphorous substance in the fatty acid chloride, in
the 1st chlorination reactor and in the 2
nd chlorination reactor.
4.1 Observations
To be able to distinguish how the amount of phosphorous changes from each one of those
processes, samples were collected from each chlorination steps. The first sample is taken
after the first chlorination step and the second sample is taken when the second chlorination
step is done and the fatty acid chloride is transferred into a storage tank.
To be able to determine the amount of the phosphorous substance in the two processes, an
analysis method that can calculate the amount of phosphorous substance from 50 ppm to
4000 ppm, was performed.
Another observation was that some changes were done in purpose of observing if and
how those changes would affect the amount of phosphorous in the fatty acid chloride and the
other systems in the plant.
The change/test that was performed included that the stir time in the 1st chlorination
reactor was altered to a desirable time. This was performed accordingly to old theories in
purpose of showing if the phosphorous substance where more bonded to the fatty acid when
being stirred for a longer period of time.
4.2 Method
The purpose of the analysis of phosphorous was to determine the level of phosphorous in
organic materials such as fatty acid chloride and AKD down to 50 ppm. The method consists
of a combustion part, where the sample is digested by strong acids and microwave, and an
analysis part of the complex color which is run by an UV-spectrophotometer. The samples
from the batches were removed in order in the process and the qualities of the acid chloride,
as mentioned earlier, could vary from LMP to HMP.
Two microwave ovens, as shown in figure 4, were used in the analysis, which made it
possible to analyze more samples in each round. The ovens consist of two cells each for the
samples and the function of the microwaves is to combust all carbon in the sample so that
only the phosphorous remained in the sample.
Figure 4. The two microwave ovens connected to the two chemical bottles, nitric acid
and hydrogen peroxide (lying in between the two ovens).

Page | 13
The UV-spectrophotometer measures the color complex of the sample in absorbance. A
given calibration curve works as a standard for the calculation of the amount phosphorous.
The calibration curve has a maximum limit for the absorbance for the different samples, 1st
chlorination reactor and 2nd
chlorination reactor samples.
Each analytical run required < 1 gram sample and each analytical run could take up to 2-3
hours. 12, 13
4.3 Materials
UV-spectrophotometer, a double beam instrument that can measure 10 cm cuvettes.
10 cm glass or quartz cuvettes
1 cm quartz or plastic cuvettes
Microwave ovens with associated tubes
50 ml and 100 ml flasks
2.5, 5, 10, 20 and 50 ml pipettes
Pasteur pipettes, plastic or glass
250 ml beakers, the high model
Litmus paper
4.4 Chemicals
Sulfuric acid (concentrated)
Nitric acid (concentrated)
Hydrogen peroxide, 30 % p.a.
Sodium hydroxide, 32 %
Ammonia (concentrated)
Ascorbic acid
Molybdate solution (color complex), containing ammoniumhepta molybdate and
potassium antimony oxide tartrate
4.5 The Laboratory Performance
The samples that were analyzed were removed from the chlorination steps, 1st chlorination
reactor and 2nd
chlorination reactor. The two types of samples are performed separately
because both samples have different measurement for the analysis. After estimating the time
and the work needed for each analysis run, a very profitable work schedule was performed,
meaning the amount of samples analyzed were between 8-16 samples a day. Though there
were occasionally some problems with the instruments the analysis work was not affected.
The sample from 1st chlorination reactor is a sample with high levels of phosphorous,
because it is measured between levels of 400 – 4000 ppm phosphorous. Unlike the sample
from 1st chlorination reactor, the sample from 2
nd chlorination reactor is called a sample with
low levels of phosphorous, because the measurement level of the phosphorous is between
50-400 ppm.
The samples from the 1st chlorination reactor are weighed to a maximum amount of 0.5
grams (0.8 grams of 2nd
chlorination reactor samples) into the tubes, but suggested amount is
0.3 grams (0.7 grams of 2nd
chlorination reactor samples).
Then 10 ml sulfuric acid was added to the samples. The sulfuric acid is a chemical that
helps in increasing the temperature during the combustion in the microwave. After adding
the acid, the tubes are put into the microwaves and the combustion was started.
During the combustion, the nitric acid was added primarily in several steps at definite
temperatures and nitrous gases are formed. Those gases are ventilated through the pipe to the
scrubbers. In the final stage of the combustion, hydrogen peroxide were added making some
of the nitrous gases to disappear.
Page | 14
After the dosage of the hydrogen peroxide was completed, the burning ended and the
tubes that contained the samples had a temperature of 200 °C, which meant that they had to
be cooled before being neutralized. When the samples were cooled, they were poured into
250 ml beakers and then neutralized by adding 20 – 25 ml ammonia.
To be able to determine if the samples were neutralized, a litmus paper was used. The
paper was put in the sample in the beaker and when it had a purple color, the sample was still
acidic and more ammonia was added. But when the paper got a yellow - orange color it
indicated that the sample was neutralized.
The neutralization required more than one small paper of the litmus because the ammonia
reacted strongly with the sample, which made it a lot hotter and much faster than usual
making that made the paper’s quality less trusted. There are two different ways to neutralize
the samples and not destroy the litmus paper. It was to either use a beaker filled with cold
water or by adding the ammonia thoroughly and quickly to the samples. Both methods were
used but the latter was the easiest one to perform.
Afterwards, the samples were diluted with water to a certain level into the 100 ml flasks
and later they were cooled down once again before they were further processed.
The final step of the analysis was transferring a given quantity of the samples to 50 ml flasks
(100 ml if 2nd
chlorination reactor samples were processed), where they are mixed with two
solutions, forming a color complex, that gives a blue color. The intensity of the blue color
indicated how much phosphorous the samples contained.
A zero sample, a blank, is a sample containing a given quantity of water and a given
quantity of the color complex, was diluted and measured in order to be sure that the color
complex was not contaminated. The blank had a maximum value in absorbance depending
on the type of analyzed sample. 1st chlorination reactor had a maximum value of 0.005, while
2nd
chlorination reactor had a maximum value of 0.05 in absorbance.
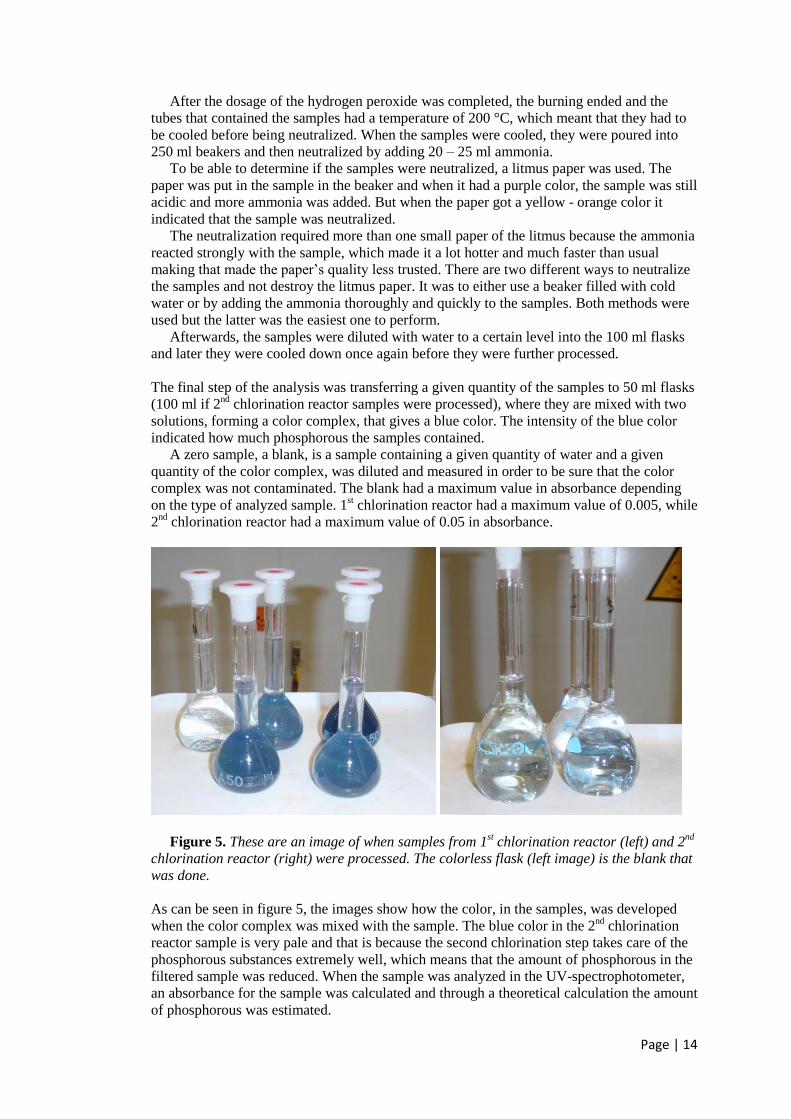
Figure 5. These are an image of when samples from 1st chlorination reactor (left) and 2
nd
chlorination reactor (right) were processed. The colorless flask (left image) is the blank that
was done.
As can be seen in figure 5, the images show how the color, in the samples, was developed
when the color complex was mixed with the sample. The blue color in the 2nd
chlorination
reactor sample is very pale and that is because the second chlorination step takes care of the
phosphorous substances extremely well, which means that the amount of phosphorous in the
filtered sample was reduced. When the sample was analyzed in the UV-spectrophotometer,
an absorbance for the sample was calculated and through a theoretical calculation the amount
of phosphorous was estimated.

Page | 15
5. Results and Discussion
In this chapter, the results from the phosphorous analysis will be presented and discussed. A
correlation between different parameters, which are parameters that are updated daily by the
shift personnel, was performed.
5.1 The Variance of the analysis (1st and 2
nd chlorination reactor)
Before the phosphorous analysis was used for evaluating the process a variance analysis
were performed. This was performed in order to see if the final result of one sample could be
trusted. The same sample was divided and put into four cells in the microwave oven and this
was done with both a 1st chlorination reactor sample and 2
nd chlorination reactor sample, see
result in table 1 and 2. The samples were analyzed individually.
Cell Quality Batch nr. Amount (g) Absorbance P (ppm)
1 LMP 12200 0.3085 0.4661 1956
2 LMP 12200 0.3139 0.4865 2007
3 LMP 12200 0.3187 0.4870 1979
4 LMP 12200 0.3121 0.5053 2097
Table 1. The variance in the analysis from 1st chlorination reactor
Cell Quality Batch nr. Amount (g) Absorbance P (ppm)
1 LMP 12199 0.7016 0.5119 94
2 LMP 12199 0.7252 0.5329 95
3 LMP 12199 0.7080 0.5516 101
4 LMP 12199 0.7006 0.5017 92
Table 2. The variance in the analysis from 2nd
chlorination reactor
As can be seen in table 1 and table 2, the variance in the analysis are small with a standard
deviation of only 62 and 4 respectively. This indicates that the analyses of different samples
could be performed at the same time, and the final result would still be credible.
5.2 The Amount of Phosphorous compared to Batch number in order
A correlation between the analyzed samples, samples from 1st chlorination reactor and 2
nd
chlorination reactor, and the batch numbers in the process was performed. The samples were
also separated by the type of quality, LMP and HMP.
This analysis shows primary that there are no structural errors in the sampling of the study,
e.g. that a series of batches have increasing phosphorous amount or decreasing phosphorous
amount.
This analysis does also show that there are a difference between the different raw materials,
LMP and HMP. As can be seen in figure 6, the amount of phosphorous of the LMP samples
are more spread than the HMP and that the HMP shows a better stability in the dispersal of a
specific limit range. Another fact that can be stated is that the HMP samples have generally a
lower amount of phosphorous than the LMP samples.
As can be seen in figure 7, unlike the LMP samples from 1st chlorination reactor, the LMP
samples from the 2nd
chlorination reactor do not spread much from the HMP samples.

Page | 16
The reason that HMP samples show a better stability might be because this type of fatty acid
is purchased with a slightly higher specification. Due to this, the limit of the properties in a
HMP fatty acid, such as the iodine value, the peroxide value etc., has been set at a lower
limit value than the LMP fatty acid.
Figure 6. 1st
chlorination reactor: A correlation between the amount of phosphorous in the
samples (in ppm) (LMP and HMP), and the batch numbers.
Figure 7. 2nd
chlorination reactor: A correlation between the amount of phosphorous (in
ppm) in the samples (LMP and HMP), and the batch numbers.
0
500
1000
1500
2000
2500
3000
3500
12140 12160 12180 12200 12220 12240 12260
LMP
HMP
0
20
40
60
80
100
120
140
12130 12150 12170 12190 12210 12230 12250
LMP
HMP
Page | 17
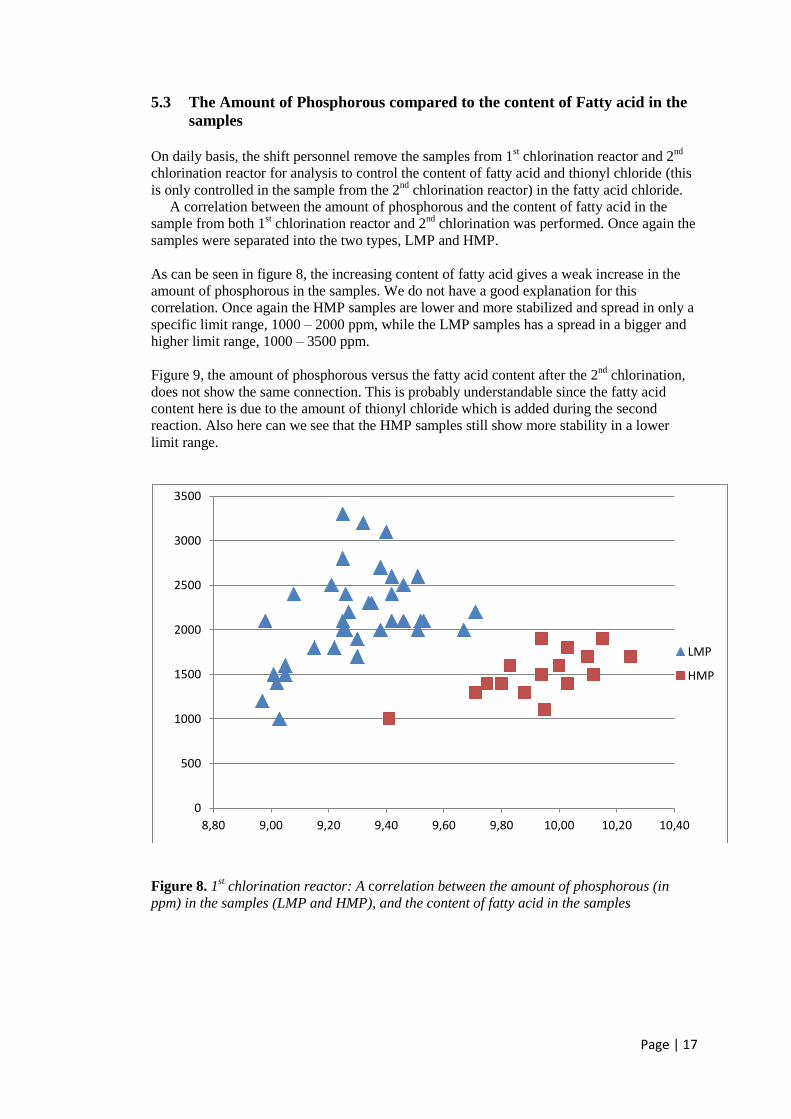
5.3 The Amount of Phosphorous compared to the content of Fatty acid in the
samples
On daily basis, the shift personnel remove the samples from 1
st chlorination reactor and 2
nd
chlorination reactor for analysis to control the content of fatty acid and thionyl chloride (this
is only controlled in the sample from the 2nd
chlorination reactor) in the fatty acid chloride.
A correlation between the amount of phosphorous and the content of fatty acid in the
sample from both 1st chlorination reactor and 2
nd chlorination was performed. Once again the
samples were separated into the two types, LMP and HMP.
As can be seen in figure 8, the increasing content of fatty acid gives a weak increase in the
amount of phosphorous in the samples. We do not have a good explanation for this
correlation. Once again the HMP samples are lower and more stabilized and spread in only a
specific limit range, 1000 – 2000 ppm, while the LMP samples has a spread in a bigger and
higher limit range, 1000 – 3500 ppm.
Figure 9, the amount of phosphorous versus the fatty acid content after the 2nd
chlorination,
does not show the same connection. This is probably understandable since the fatty acid
content here is due to the amount of thionyl chloride which is added during the second
reaction. Also here can we see that the HMP samples still show more stability in a lower
limit range.
Figure 8. 1st chlorination reactor: A correlation between the amount of phosphorous (in
ppm) in the samples (LMP and HMP), and the content of fatty acid in the samples
0
500
1000
1500
2000
2500
3000
3500
8,80 9,00 9,20 9,40 9,60 9,80 10,00 10,20 10,40
LMP
HMP

Page | 18
Figure 9. 2nd
chlorination reactor: A correlation between the amount of phosphorous (in
ppm) in the samples (LMP and HMP), and the content of fatty acid in the samples (%).
5.4 Correlation of the amount of phosphorous in the 2nd
chlorination reactor to the
amount of phosphorous in the 1st chlorination reactor.
As can be seen in figure 10, the phosphorous content reduces immensely in the fatty acid chloride
after the second and final chlorination step. We can also see that there is no correlation between
the amount of phosphorous after the 1st chlorination and 2
nd chlorination.
Figure 10. A correlation between the amount of phosphorous (in ppm) in the samples, in 2nd
chlorination reactor to the amount of phosphorous (in ppm) in the samples, in 1st
chlorination reactor
0
20
40
60
80
100
120
140
0 0,05 0,1 0,15 0,2 0,25
LMP
HMP
0
20
40
60
80
100
120
140
500 1000 1500 2000 2500 3000 3500
LMP
HMP

Page | 19
5.5 Alteration of the stir time in the 1st chlorination reactor
As mentioned previously, two small alterations were performed with the mixer in the 1st
chlorination reactor. The alterations done were to increase the second part of the stir time in the
reactor to 1 minute and 2 minutes, which is more than the original stir time at 30 seconds. The
alterations did not contribute to any changes of the value of the phosphorous in the samples or the
whole system. Unfortunately the project time did not admit to perform any more changes.

Page | 20
6. Conclusions
The batch order does not affect the amount of phosphorous in the fatty acid chloride
during the 1st and 2
nd chlorination.
Fatty acid chloride of the quality HMP has a lower spreading of the amount of
phosphorous than LMP.
The analysis showed that there are no systematic errors since there was no correlation to
the batch order.
The amount of phosphorous has a weak increase with increasing content of the fatty acid
in the samples, both HMP and LMP in the 1st chlorination.
No correlation between the amount of phosphorous and the content of the fatty acid in
the samples was found in the 2nd
chlorination.
Stir time in 1st chlorination reactor: No changes were noticed by the alterations that were
performed.
7. Future Recommendations
At the beginning of this study, as mentioned in the first chapter, there were some
parameters that were meant to be tested but due to different circumstances in theplant
they could not be performed. However, there are some recommendations on further work
in this matter.
- The dosage of the phosphorous trichloride could be slightly changed such as
decreasing or increasing the amount of dosage that will not affect the surrounding
systems in the plant.
- Another interesting aspect is the properties of the fatty acids that are delivered from
the two suppliers could be investigated. This could be done by observing the
delivery time of the fatty acids and link it to the batches numbers in the process.
Then maybe a connection between those two would be noticed.
- Looking back on the tests that was performed with the mixer in the reactor 1st
chlorination reactor, though they were performed shortly, the results showed that
there was no difference in the amount of phosphorous by altering the second stir
time just a few minutes. The suggestion is to try and run the mixer a longer period of
time, 15 min or 30 min.

Page | 21
8. References
Literature
1. Education Materials from Eka Chemicals
2. Fellers,C & Norman, B (1996) Paper technology. 3rd
edition, Department of Paper
Technology, KTH
3. Thomas, A. (2000-06-15) Fats and Fatty Oils. In Ullmann’s Encyclopedia of
Industrial Chemistry. (2011-06-03, Browsed through Chalmers’ Library Site,
www.lib.chalmers.se )
4. Anneken D.J., Both, S., Christoph, R., Fieg, G., Steinberner U. and Westfechtel, A.
(2006-12-15) Fatty Acids. In Ullmann’s Encyclopedia of Industrial Chemistry.
(2011-06-03, Browsed through Chalmers’ Library Site www.lib.chalmers.se )
5. Bettermann, G., Krause, W., Riess, G. and Hofmann, T. (2000-06-15) Phosphorous
Compounds, Inorganic. In Ullmann’s Encyclopedia of Industrial Chemistry. (2011-
06-03, Browsed through Chalmers’ Library Site, www.lib.chalmers.se )
6. Lauss, H.D. and Steffens, W. (2001-06-15) Sulfur Halides. In Ullmann’s
Encyclopedia of Industrial Chemistry. (2011-06-03, Browsed through Chalmers’
Library Site, www.lib.chalmers.se )
Electronics
7. Jim Clark (2004), Introducing Acyl Chloride (acid chloride). In Chemguide.
http://www.chemguide.co.uk (2011-05-16)
8. Information from Eka’s Internal Site (2011-04-04)
9. Wikipedia (2011), Paper, Pulp, Paper Chemicals, Sizing http://en.wikipedia.org
(2011-11-09)
10. Madehow (2006-2011), Paper, Volume 2, http://www.madehow.com/ (2011-11-09)
Personal Contact
11. Shift Personnel at Eka Chemicals (2011-04 to 2011-05)
12. Own Experience from working in Eka Chemicals
13. Karin Ohlsson, Process Engineer, Eka Chemicals AB. Numerous meetings and
discussions throughout the assignment (2011-04 to 2011-06)
14. Caroline Chouha, Senior Laboratory Scientist, Eka Chemicals AB. Numerous
discussions throughout the assignment. (2011-04 to 2011-06)
15. Ingela Svensson, Senior Laboratory Scientist, Eka Chemicals AB. Numerous
discussions throughout the assignment. (2011-04 to 2011-06)

Page | 22
Appendix A – Analysis Results 1st chlorination reactor and 2
nd chlorination
reactor, LMP samples
Quality Batchnr. Date of
analysis Amount of sample (g)
Absorbance P % in FA (1
st
Chl.reac) (ppm) Shown result
LMP 12142 2011-04-28 0,3234 0,6377 2554 2600
LMP 12143 2011-04-28 0,3284 0,5407 2132 2100
LMP 12144 2011-04-28 0,299 0,4683 2028 2000
LMP 12145 2011-04-28 0,3204 0,8137 3291 3300
LMP 12146 2011-05-02 0,3076 0,2939 1236 1200
LMP 12150 2011-05-05 0,3238 0,5072 2028 2000
LMP 12151 2011-05-05 0,3081 0,3805 1598 1600
LMP 12152 2011-05-05 0,3012 0,5072 2181 2200
LMP 12153 2011-05-05 0,3067 0,433 1828 1800
LMP 12157 2011-05-09 0,3339 0,5485 2128 2100
LMP 12158 2011-05-09 0,3131 0,6126 2534 2500
LMP 12159 2011-05-09 0,3142 0,5675 2339 2300
LMP 12160 2011-05-09 0,3252 0,2495 992 1000
LMP 12161 2011-05-09 0,3205 0,3586 1448 1400
LMP 12162 2011-05-09 0,3085 0,3536 1483 1500
LMP 12168 2011-05-12 0,3671 0,6166 2176 2200
LMP 12169 2011-05-17 0,3212 0,5214 2102 2100
LMP 12170 2011-05-17 0,313 0,4459 1844 1800
LMP 12171 2011-05-17 0,2971 0,5479 2388 2400
LMP 12172 2011-05-17 0,3218 0,6069 2443 2400
LMP 12178 2011-05-25 0,3103 0,5048 2107 2100
LMP 12192 2011-05-19 0,3024 0,4734 2027 2000
LMP 12193 2011-05-25 0,3204 0,6036 2440 2400
LMP 12194 2011-05-19 0,3071 0,4966 2094 2100
LMP 12200 2011-05-18 0,3133 0,4862 2009 2000
LMP 12201 2011-05-17 0,2941 0,4848 2134 2100
LMP 12203 2011-05-19 0,3004 0,3875 1670 1700
LMP 12210 2011-05-26 0,303 0,729 3117 3100
LMP 12213 2011-05-26 0,3209 0,7941 3206 3200
LMP 12216 2011-05-26 0,312 0,6217 2581 2600
LMP 12218 2011-05-26 0,3153 0,6527 2682 2700
LMP 12225 2011-05-26 0,3224 0,5065 2034 2000
LMP 12231 2011-05-26 0,3182 0,6019 2450 2500
LMP 12243 2011-05-20 0,3091 0,3604 1509 1500
LMP 12244 2011-05-20 0,3273 0,3567 2821 2800
LMP 12245 2011-05-20 0,3192 0,5744 2331 2300
LMP 12246 2011-05-20 0,3094 0,4597 1924 1900

Page | 23
Quality Batchnr. Date of analysis Amount of sample (g)
Absorbance P % in FAC (2
nd
Chl.reac) (ppm) Shown result
LMP 12142 2011-05-02 0,311 0,4669 96 100
LMP 12143 2011-05-02 0,317 0,5712 117 120
LMP 12144 2011-05-02 0,3065 0,5005 105 100
LMP 12145 2011-05-02 0,3271 0,5246 103 100
LMP 12146 2011-05-03 0,7231 0,6529 118 120
LMP 12151 2011-05-05 0,7689 0,5668 95 100
LMP 12152 2011-05-06 0,7106 0,486 88 90
LMP 12153 2011-05-06 0,7003 0,5347 99 100
LMP 12157 2011-05-11 0,7065 0,4027 72 70
LMP 12158 2011-05-11 0,766 0,4682 78 80
LMP 12159 2011-05-11 0,7209 0,4847 86 90
LMP 12160 2011-05-11 0,7137 0,4565 82 80
LMP 12161 2011-05-11 0,7084 0,6183 113 110
LMP 12162 2011-05-11 0,7158 0,498 90 90
LMP 12178 2011-05-25 0,7022 0,424 77 80
LMP 12180 2011-05-25 0,7066 0,4391 79 80
LMP 12187 2011-05-25 0,7058 0,4309 78 80
LMP 12195 2011-05-19 0,7142 0,5086 92 90
LMP 12199 2011-05-18 0,7089 0,5245 95 100
LMP 12200 2011-05-24 0,7017 0,5171 95 100
LMP 12201 2011-05-19 0,7084 0,6362 117 120
LMP 12203 2011-05-24 0,7269 0,4148 73 70
LMP 12207 2011-05-25 0,7118 0,4773 86 90
LMP 12213 2011-05-26 0,7418 0,4798 83 80
LMP 12216 2011-05-26 0,7146 0,4957 89 90
LMP 12226 2011-05-26 0,7087 0,4957 90 90
LMP 12231 2011-05-26 0,7041 0,5288 97 100
LMP 12233 2011-05-26 0,7127 0,4698 85 90
LMP 12235 2011-05-26 0,7361 0,4812 84 80
LMP 12237 2011-05-25 0,7146 0,4504 81 80
LMP 12238 2011-05-25 0,7167 0,4706 84 80
LMP 12243 2011-05-20 0,7109 0,4435 80 80
LMP 12244 2011-05-20 0,7253 0,4686 83 80
LMP 12245 2011-05-20 0,7112 0,4514 81 80
LMP 12246 2011-05-20 0,7283 0,4778 84 80

Page | 24
Appendix B – Analysis Result 1st chlorination and 2
nd chlorination reactor,
HMP samples
Quality Batchnr. Date of
analysis Amount of sample (g)
Absorbance P % in FA (1
st
Chl.reac) (ppm) Shown result
HMP 12147 2011-05-02 0,3384 0,4683 1792 1800
HMP 12148 2011-05-02 0,3319 0,3446 1344 1300
HMP 12149 2011-05-02 0,3176 0,3325 1355 1400
HMP 12154 2011-05-06 0,3007 0,2354 1012 1000
HMP 12155 2011-05-06 0,3095 0,3171 1326 1300
HMP 12156 2011-05-09 0,3225 0,4694 1885 1900
HMP 12163 2011-05-09 0,3209 0,2622 1057 1100
HMP 12164 2011-05-12 0,3177 0,385 1569 1600
HMP 12165 2011-05-12 0,3187 0,4029 1636 1600
HMP 12166 2011-05-12 0,3297 0,3865 1517 1500
HMP 12174 2011-05-25 0,3262 0,3545 1406 1400
HMP 12175 2011-05-25 0,3641 0,4072 1448 1400
HMP 12196 2011-05-17 0,3123 0,356 1475 1500
HMP 12197 2011-05-17 0,321 0,4157 1676 1700
HMP 12230 2011-05-26 0,3101 0,3962 1654 1700
HMP 12239 2011-05-26 0,3211 0,4751 1916 1900
Quality Batchnr. Date of analysis Amount of sample (g)
Absorbance P % in FAC
(2nd
Chl.reac) (ppm)
Shown result
HMP 12147 2011-05-03 0,7319 0,6589 117 120
HMP 12148 2011-05-03 0,7293 0,4495 79 80
HMP 12149 2011-05-03 0,7019 0,4062 74 70
HMP 12154 2011-05-06 0,733 0,4077 71 70
HMP 12155 2011-05-06 0,7074 0,3514 63 60
HMP 12156 2011-05-11 0,7373 0,362 62 60
HMP 12163 2011-05-11 0,7072 0,4356 79 80
HMP 12181 2011-05-25 0,7128 0,3904 70 70
HMP 12189 2011-05-24 0,7076 0,4309 78 80
HMP 12190 2011-05-19 0,695 0,3991 73 70
HMP 12191 2011-05-19 0,7002 0,4227 77 80
HMP 12205 2011-05-26 0,7158 0,3703 65 70
HMP 12211 2011-05-24 0,7086 0,4606 83 80
HMP 12212 2011-05-25 0,7158 0,3884 69 70
HMP 12221 2011-05-24 0,7057 0,4871 89 90
HMP 12223 2011-05-24 0,7209 0,5549 100 100
HMP 12229 2011-05-25 0,7253 0,3421 59 60
HMP 12241 2011-05-24 0,7176 0,3884 69 70
Page | 25
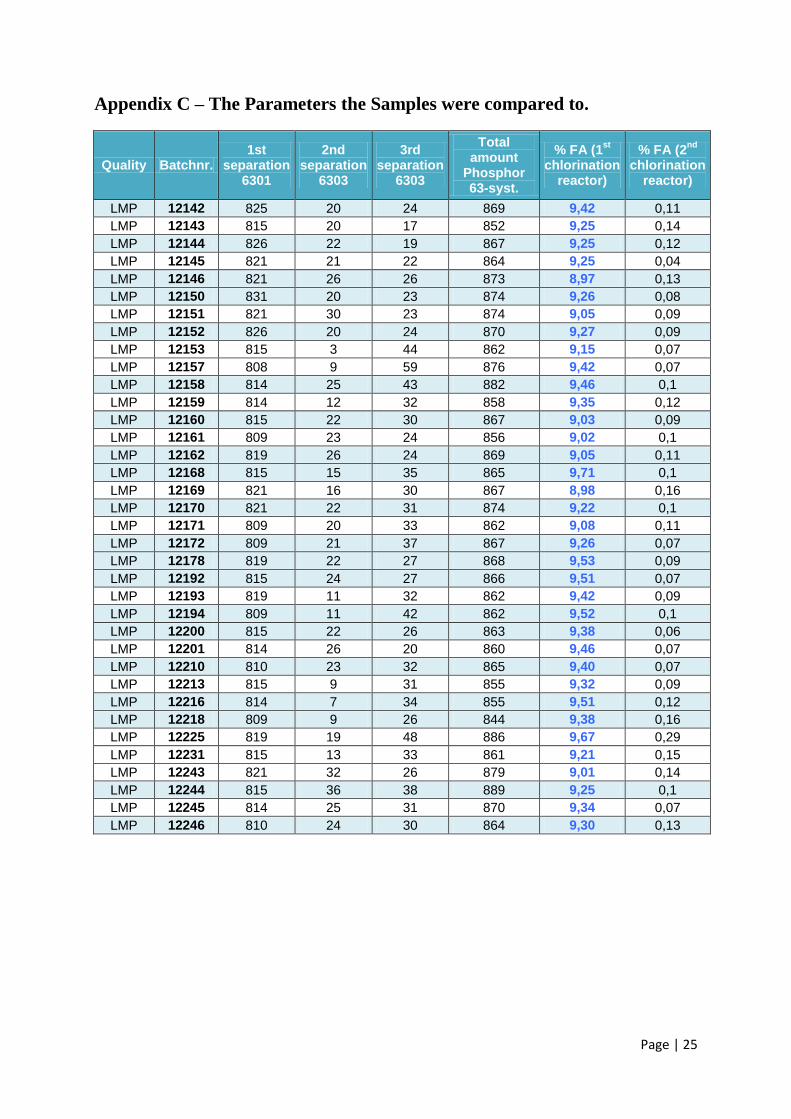
Appendix C – The Parameters the Samples were compared to.
Quality Batchnr. 1st
separation 6301
2nd separation
6303
3rd separation
6303
Total amount
Phosphor 63-syst.
% FA (1st
chlorination
reactor)
% FA (2nd
chlorination
reactor)
LMP 12142 825 20 24 869 9,42 0,11
LMP 12143 815 20 17 852 9,25 0,14
LMP 12144 826 22 19 867 9,25 0,12
LMP 12145 821 21 22 864 9,25 0,04
LMP 12146 821 26 26 873 8,97 0,13
LMP 12150 831 20 23 874 9,26 0,08
LMP 12151 821 30 23 874 9,05 0,09
LMP 12152 826 20 24 870 9,27 0,09
LMP 12153 815 3 44 862 9,15 0,07
LMP 12157 808 9 59 876 9,42 0,07
LMP 12158 814 25 43 882 9,46 0,1
LMP 12159 814 12 32 858 9,35 0,12
LMP 12160 815 22 30 867 9,03 0,09
LMP 12161 809 23 24 856 9,02 0,1
LMP 12162 819 26 24 869 9,05 0,11
LMP 12168 815 15 35 865 9,71 0,1
LMP 12169 821 16 30 867 8,98 0,16
LMP 12170 821 22 31 874 9,22 0,1
LMP 12171 809 20 33 862 9,08 0,11
LMP 12172 809 21 37 867 9,26 0,07
LMP 12178 819 22 27 868 9,53 0,09
LMP 12192 815 24 27 866 9,51 0,07
LMP 12193 819 11 32 862 9,42 0,09
LMP 12194 809 11 42 862 9,52 0,1
LMP 12200 815 22 26 863 9,38 0,06
LMP 12201 814 26 20 860 9,46 0,07
LMP 12210 810 23 32 865 9,40 0,07
LMP 12213 815 9 31 855 9,32 0,09
LMP 12216 814 7 34 855 9,51 0,12
LMP 12218 809 9 26 844 9,38 0,16
LMP 12225 819 19 48 886 9,67 0,29
LMP 12231 815 13 33 861 9,21 0,15
LMP 12243 821 32 26 879 9,01 0,14
LMP 12244 815 36 38 889 9,25 0,1
LMP 12245 814 25 31 870 9,34 0,07
LMP 12246 810 24 30 864 9,30 0,13

Page | 26
Quality Batchnr. 1st
separation 6301
2nd separation
6303
3rd separation
6303
Total amount
Phosphor 63-syst.
% FA (1st
chlorination
reactor)
% FA (2nd
chlorination
reactor)
HMP 12147 809 10 16 835 10,03 0,1
HMP 12148 819 12 13 844 9,88 0,07
HMP 12149 788 10 43 841 10,03 0,06
HMP 12154 798 15 30 843 9,41 0,07
HMP 12155 814 17 13 844 9,71 0,05
HMP 12156 809 10 31 850 9,94 0,05
HMP 12163 814 10 30 854 9,95 0,08
HMP 12164 809 12 24 845 10,00 0,08
HMP 12165 798 13 22 833 9,83 0,06
HMP 12166 814 10 17 841 9,94 0,11
HMP 12174 798 9 25 832 9,80 0,11
HMP 12175 809 10 29 848 9,75 0,11
HMP 12196 804 8 33 845 10,12 0,07
HMP 12197 798 14 32 844 10,10 0,08
HMP 12230 756 12 61 829 10,25 0,11
HMP 12239 793 17 36 846 10,15 0,08

Page | 27
Appendix D – Calibration Curve with equation for estimation of the
amount of phosphorous in the samples.
1st chlorination reactor:
The Equation:
The amount of phosphorous in acid chloride and AKD (400 – 4000 ppm)
P (sample) = (A – I) / L
A = Absorbance
I = Interception (Intersection with the x-axis)
L = The slope of the calibration curve
P / AC (ppm) = (P (sample) *1000) / (5*m (AC))
P (sample) = the Amount P in the calibration curve
m (AC) = the weighed amount of sample (g)

Page | 28
2nd
chlorination reactor:
The Equation:
The amount of phosphorous in acid chloride and AKD (50 – 400 ppm)
P (sample) = (A – I) / L
A = Absorbance
I = Interception (Intersection with the x-axis)
L = The slope of the calibration curve
P / AC (ppm) = P (sample) / (2*m (AC))
P (sample) = the Amount P in the calibration curve
m (AC) = the weighed amount of sample (g)