phosphors and quantum dots 2015 - yole€¦ · table of contents • report objectives ... •...
TRANSCRIPT
April © 2015
From Technologies to Market
Phosphors and Quantum Dots
2015:
LED Downconvertersfor Lighting and Display
Applications
Report Sample
From Technologies to Market
2
Biography & contact
ABOUT THE AUTHORS
Eric VIREY received a Ph-D in Optoelectronics from the National Polytechnic Institute of Grenoble. He’s held various R&D,engineering, manufacturing and marketing positions with Fortune 500 company Saint-Gobain in France and the United States. Inits most recent position, he was Market Manager Optoelectronics in charge various product lines and serving the LED andoptical telecommunication industries. In parallel, he was leading the corporate “Lighting Community” effort, acting as a marketand technology competitive intelligence evangelist to identify and develop new business opportunities in solid state lighting(LED/OLEDs) across multiple business units.
Eric has a broad knowledge of the entire solid state lighting value chain. In 2009, he joined Yole Developpement as a SeniorMarket and Technology Analyst for LED Devices and Materials.
Eric is also author / co-author of the following reports:
• LED Packaging
• LED Front End Manufacturing
• III-V epitaxy
• GaN bulk
• GaN on Silicon
• Status of the LED Industry
• Sapphire Market & Applications
• High Purity Alumina
Contact: [email protected]
©2015 | www.yole.fr |Phosphor and Quantum Dots 2015

3
WHO SHOULD BE INTERESTED IN THIS REPORT?
oThe report will be useful for executives, strategists, business developmentmanagers, sales managers, market researchers and purchasing managers atcompanies involved at all levels of the supply chain:• Phosphor and Quantum Dots precursors.
• Phosphor and Quantum Dot manufacturing and dispensing equipment.
• Phosphors and Quantum Dots material manufacturers.
• Component manufacturers (phosphor sheets, remote phosphors, Quantum Dots components)
• LED packagers
• System manufacturers (Luminaires, LCD Backlight Unit, Display manufacturers).
o The report is prepared in a way that will help new comers to the LED industry or to theparticular segment represented by downconverters to rapidly gain a thoroughunderstanding of the technical aspects as well as key market forces driving this market.This will benefit analysts at financial firms, VC firms, Academics in charge of R&Dvalorization etc…
©2015 | www.yole.fr |Phosphor and Quantum Dots 2015

4
TABLE OF CONTENTS
• Report Objectives - Scope and Limitations P7
• Acronyms and Definitions P8
• Companies cited in the Report - Phosphor Manufacturers P9
• Companies cited in the Report: - QD Manufacturers P10
• Executive Summary P11
• LED Market Overview P38
• LED market growth cycles
• LED adoption trends per application
• Packaged LED: 2008 -2020 revenue forecast
• LED market trends - Lighting
• LED market trends - Display
• LED phosphor IP
• LED Downconverters - Overview and Major Requirements P48
• How to make white light?
• Key requirements for LED downconverters
• Temperature stability
• Particle size and distribution
• Angle color consistency
• Textured phosphors
• Downconverter requirements for display applications
• Downconverter requirements for lighting - CCT
• Downconverter requirements for lighting - CRI
• Downconverter requirements for lighting - Summary
• Major white LED designs downconverter combinations
• Conclusion
• Downconverter Configurations P67
• Downconverter configurations and deposition methods
• On-Chip Downconverters P69
• Overview - Various types of on-chip conversion
• Volume conversion deposition technologies
• Needle and jet dispensing
• Ceramic preforms
• Single crystal preforms
• Conformal coatings
• Conformal downconverters
• Phosphor sheets
• Chip scale packages and phosphor deposition
• Summary of on-chip configurations
• Conclusion
• Remote Downconverters P86
• Overview
• Benefits
• Drawbacks
• Potential applications
• Trends
• Summary
• Phosphor sheets in displays
• Conclusion
• Traditional Phosphors P98
• Application overview – Report scope
©2015 | www.yole.fr |Phosphor and Quantum Dots 2015
5
TABLE OF CONTENTS
• Compositions Overview P100
• Introduction
• Example of commercial offerings
• Yellow phosphors
• Green and red phosphors
• Focus on Garnet phosphors
• Focus on Silicates Phosphors
• Focus on Nitrides and Oxynitrides
• CarbidoNitride and oxycarbidonitrides
• Mn4+ red phosphors - PFS/KFS
• UV chip + RGB phosphor solutions
• Example - Soraa MR16
• Summary of phosphor compositions
• Premixed “white phosphors”
• Conclusions
• Materials timeline
• Materials application matrix
• Competitive Landscape P132
• Overview
• Top 3 phosphor suppliers
• Other leading international suppliers
• Focus on China P139
• Competitive landscape
• 2014 China volume breakdown
• Major suppliers
• Price Trends P146
• YAG price trends
• Nitrides price trends
• Other Garnets and Silicates price trends
• Volume and Revenue Forecast P152
• Methodology & Challenges
• Average quantity of phosphor per LED
• 2012-2020 forecast - Surface of downconverted LED
• 2012-2020 forecast - Phosphor volumes for on-chip conversion
• Revenue forecast - Challenges and hypothesis
• 2012-2020 revenue forecast for on-chip conversion
• Remote phosphor hypothesis
• 2012-2020 volume forecast with remote phosphors
• 2012-2020 volume forecast – Remote vs on-chip
• 2012-2020 revenue forecast with remote phosphors
• Conclusion on traditional phosphors
• Quantum Dots P172
• What’s a quantum dot?
• Benefits and challenges
• Quantum Dot Manufacturing P175
• Environmental impact
• Quantum Dots for Display Applications (1/2) P182
• Introduction
• Structure of an LCD display
• Color gamut: definition
• Color Gamut: standard LED LCD TVs
©2015 | www.yole.fr |Phosphor and Quantum Dots 2015
6
TABLE OF CONTENTS
• Quantum Dots for Display Applications (2/2) P182
• Major color gamut in the CIE 1931 and 1976 spaces
• Strategies for extended gamut
• Benefits of quantum dot
• Backlight units - Edge and direct configurations
• Local dimming schemes with LED backlights
• Quantum dots implementation
• “1D” edge configurations
• 2D film configuration
• Edge vs. Film - Cost structure
• Edge vs. Film - Summary
• 2013-2014 overview of commercial QD displays
• Color encoding and display gamut
• The UHD alliance
• UHD vs. Current display capabilities
• QD-LCD TV and rec. 2020 color gamut
• Traditional phosphors for extended color gamut
• The quest for narrow band green
• Narrowband phosphors in commercial displays
• Quantum Dots LCD vs. OLED P220
• OLED display technologies
• OLED and QD display comparison
• High Dynamic Range (HDR)
• TV makers strategy
• QD-LCD TV at the 2015 CES
• Samsung And LG strategy for UHD
• QD-LCD 2015 supply chain overview
• Major QD suppliers for display applications
• QD and OLED displays SWOT analysis
• QD-LED displays
• Conclusion
• Quantum Dots for Lighting Applications P237
• Overview
• QD challenges for lighting applications
• Recent improvements and results of On-Chip QD
• Conclusion on lighting
• Quantum Dots - Competitive Landscape P243
• Nanoco
• Nanosys
• QD-Vision
• Quantum Materials Corp & NN Crystal
• Other QD material suppliers
• Quantum Dots - 2015-2020 Forecast P252
• QD - The virtuous circle
• Segment analysis for QD adoption in displays
• Apple and Quantum Dots
• QD penetration forecast 2015-2020
• QD material forecast - Key hypothesis
• QD material forecast - QD Usage per display
• QD material 2015-2020 forecast - Volumes for displays
• QD material 2015-2020 forecast - Revenue for displays
• Quantum dots - Lighting
• QD in lighting - 2013-2020 volume forecast
• QD in lighting - 2013-2020 revenue forecast
• Conclusions
• Presentation ofYole Développement P268
©2015 | www.yole.fr |Phosphor and Quantum Dots 2015
7
REPORT OBJECTIVES – SCOPE AND LIMITATIONS
A downconverter is a material that has the capacity to absorb photons at a given wavelength and restitute light at a higherwavelength (=lower energy). Downconverters are used in conjunction with blue LEDs to create light sources emitting variouscolors including white. Two types of downconverters are used in the LED industry: traditional phosphors and Quantum Dots.
The objective of the report is to provide the reader with a comprehensive review of the LED downconvertermarkets, technology trends, competitive landscape and price trends. Detailed volumes and revenue forecast areprovided for each downconverter group (phosphors and Quantum Dots)
• For readers new to the LED downconverter industry, the report provides an overview of the key requirements andspecifications for use in the major LED applications: lighting and displays. The fundamentals of color rendering and color gamutare explained, as well as how application-specific requirements impact the choice of a downconverter material.
• The major configurations (on-chip and remote) are presented and an overview of the phosphor dispensing methods is provided.An extensive discussion of remote configurations benefits and drawbacks helps the reader familiarize itself with drivers foradoption and understand our detailed set of hypothesis.
• A thorough review of the major established and emerging phosphor families is presented as well as adoption and market trendsfor each compositions.
• An extensive description of the competitive landscape including a special focus on China provides the reader an in-depthunderstanding and knowledge of established and emerging players in the industry.
• Price trends are discussed globally and for each material family.
• An extensive review of Quantum Dot applications in displays and lighting is provided. The reader will understand how thetechnology is positioned vs. established phosphor based LCD backlight and emerging Organic LED.
• Detailed volume and revenue forecast are provided for both traditional phosphor and quantum dots.
• The report does not provide a detailed analysis and quantifications of the dispensing equipment market.
©2015 | www.yole.fr |Phosphor and Quantum Dots 2015

8
DOWNCONVERTER REQUIREMENTS FOR LIGHTING: CRI
• The Color Rendering Index (CRI) is a measure of howwell a light source reproduces colors compared to areference illuminant.
• The CRI reports a unite-less value between 0 and 100,with 100 being a color reproduction identical to thereference.
• Depending on the color temperature of the observedlight bulb, the reference illuminant is sun light (when thecolor temperature is > 5000 K), or a black radiator(color temperature < 5000 K).
• The difference in color rendition between the sourcebeing evaluated and the reference is measured for 15reference colors. However, the result for only 8 colorsare averaged to obtain the CRI index.
• Because the CRI number is an average between those 8colors, it can give no valuable insight into the rendering ofany specific color. Comparing 2 light sources withidentical CRI of 70, one might render good yellow andpoor red while the other will de the exact opposite.
• Similarly, 2 sources with a very different spectra candeliver a similar CRI (next page).
CRI is an imperfect
indicator of the color rendering ability of a light source. Sources
with very different
characteristic can deliver the same CRI but very different
perception from the user.
Comparisons of 2 sources with same CRI. Note the different
rendering of the blue, yellow and red colors.
(Picture: Lighting research Center)
Source CRI
Incandescent 95
T8 Linear Fluorescent 75 - 85
Cool White Linear Fluorescent 62
Compact Fluorescent 82
Standard Metal Halide 65
Standard HPS 22
©2015 | www.yole.fr |Phosphor and Quantum Dots 2015

9
PHOSPHOR SHEETS
• Various processes have been developed by different companies to manufacture phosphor sheets. In this process, aphosphor material is embedded in a silicone binder and the mix is laminated or molded into a thin sheet. Typicalthickness varies from XXX to XXX µm.
Just like ceramic
preforms, phosphor
sheets allows for individual chromaticity testing and sorting and
precise matching with various LED
die bins.
• Depending on the mode of application (conformal or preform), full
curing is performed at the sheet level or after binding with the chips.
• Thickness control and uniform dispersion of the phosphor particles
are critical in controlling color uniformity.
• Light scattering particles can be added in order to further improve
color uniformity
Phosphor mixing + homogenization in silicone
binder
Phosphor sheet manufacturing: lamination or molding on a glass or PET substrate.
Initial curing.
Chromaticity testing and sheet sorting
SEM cross section showing uniform dispersion of the particles in the silicone sheet (source: Nitto Denko)
©2015 | www.yole.fr |Phosphor and Quantum Dots 2015
10
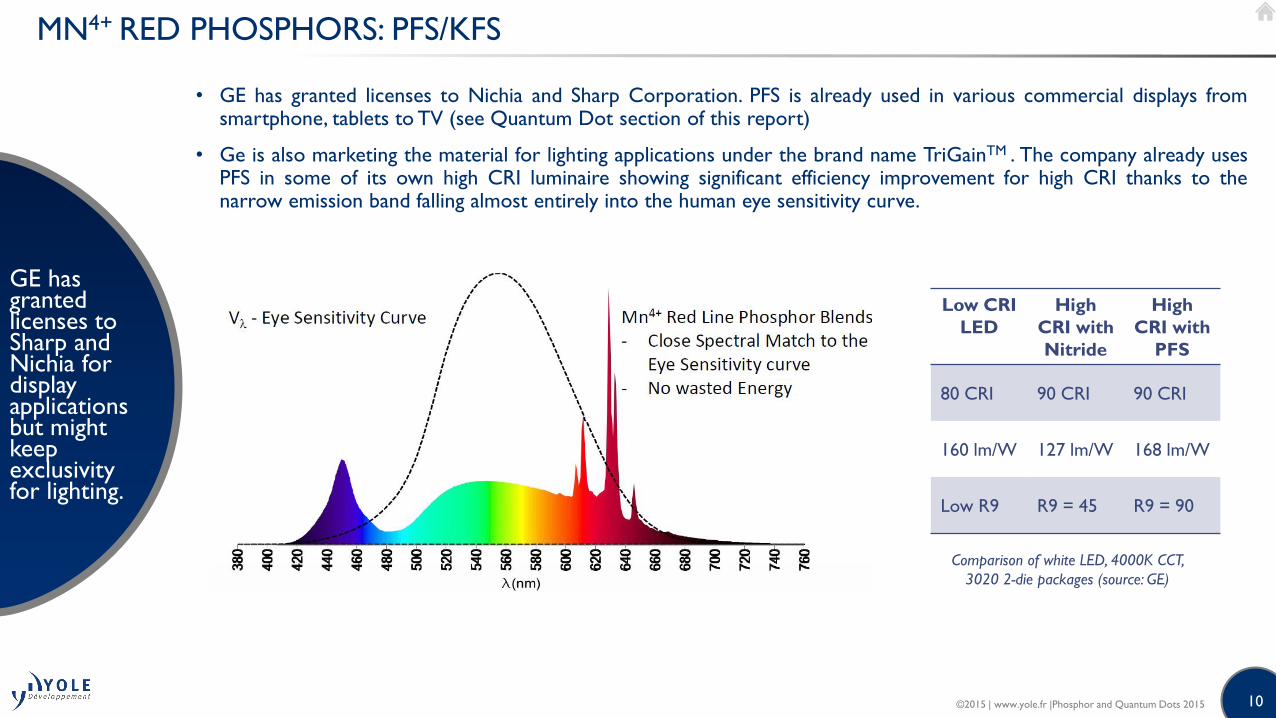
MN4+ RED PHOSPHORS: PFS/KFS
GE has granted licenses to Sharp and Nichia for display applications but might keep exclusivity for lighting.
• GE has granted licenses to Nichia and Sharp Corporation. PFS is already used in various commercial displays fromsmartphone, tablets to TV (see Quantum Dot section of this report)
• Ge is also marketing the material for lighting applications under the brand name TriGainTM . The company already usesPFS in some of its own high CRI luminaire showing significant efficiency improvement for high CRI thanks to thenarrow emission band falling almost entirely into the human eye sensitivity curve.
Low CRI
LED
High
CRI with
Nitride
High
CRI with
PFS
80 CRI 90 CRI 90 CRI
160 lm/W 127 lm/W 168 lm/W
Low R9 R9 = 45 R9 = 90
Comparison of white LED, 4000K CCT,
3020 2-die packages (source: GE)
©2015 | www.yole.fr |Phosphor and Quantum Dots 2015

11
MATERIALS TIMELINE
XXX is the most established and best
performing LED phosphor and could completely eliminate silicates once key IP
has expired after 2017. XXX is the
leading red phosphor but will face
competition from XX on some
segment.
XXX
XXX
XXX
XXX
XXX
XXX
XXX
XXX
XXX
XXX
XXX
XXX
XXX
XXX
1998 2000 2002 2004 2006 2008 2010 2012 2014
XXX
2016 2018
XXX
2020
XX
?
Not used anymore in lighting application because ofstability issues (moisture sensitive) but still consideredin display applications due to narrow emission,possibility to use moisture barrier layers and shorterlifetime requirements,
XXX
XXX
April 2015
©2015 | www.yole.fr |Phosphor and Quantum Dots 2015

12
OVERVIEW
There are more than 50 phosphor and 30 Quantum
Dots manufacturers
Down-converters Packaged LEDs OEMS
• Samsung (KR)• LG Innotek (KR)• Seoul
Semiconductor (KR)
• Cree (US)• Toyoda Gosei
(JP)• Sharp (JP)• Everlight (TW)• Lextar (TW)• Unity Opto (TW)• Bright LED (TW)• Harvatek (TW)• Edison Opto
(TW)• Ledtech (TW)• Oasis (TW)• Mason (TW)• Bridgelux (US)• Nationstar (CN)• Hongli (CN)• Changelight (CN)
• Refond (CN)• Jufei (CN)• Ledman (CN)• …
LCD Backlight displays
Automotive Lighting
General LightingXXX
XXX Osram Opto Semiconductor (DE) Osram (DE)XXX Philips Lumileds (US) Philips Lighting (NL)
Ph
osp
ho
rsQ
Ds
April 2015
©2015 | www.yole.fr |Phosphor and Quantum Dots 2015

13
COMPETITIVE LANDSCAPE
• Many of those companies rely on initial expertise developed in thefluorescent lamp phosphor market. Some are affiliates or jointventures with rare earth mining or processing companies (e.g.: XXX,XXX…) and derive cost benefits from access to cheap sources ofYttrium or Lutetium for garnet phosphors.
• Chinese phosphors manufacturers are still mostly focused on thedomestic market. Some of the leading ones such as XXX and XXXare attempting to export their products in Taiwan, Korea and the US.However, exports remain a challenge as very few can offer exclusive,internally developed composition that could be used by LED makerswithout infringing existing IP from their competitors or phosphormanufacturers. However, some LED packagers have secured licensesfrom Nichia for the use of YAG and are free to source the materialfrom whatever supplier they chose.
• As YAG mostly turns into a commodity for tier-2 LED makers, mostcompanies have shifted their focus on higher added valuecompositions such as LuAG, Ga-YAG, nitrides and oxynitrides.
• Chinese vendors offer significantly lower prices and the performanceat some leading players is closing the gap with historical leadersXXX, XXX or XXX. However, there are very large differences inperformance and consistency from one vendor to another.
Quality varies strongly from one vendor to another. But
leading players are closing the
gap with overseas
suppliers while offering
significantly lower prices.
©2015 | www.yole.fr |Phosphor and Quantum Dots 2015
14
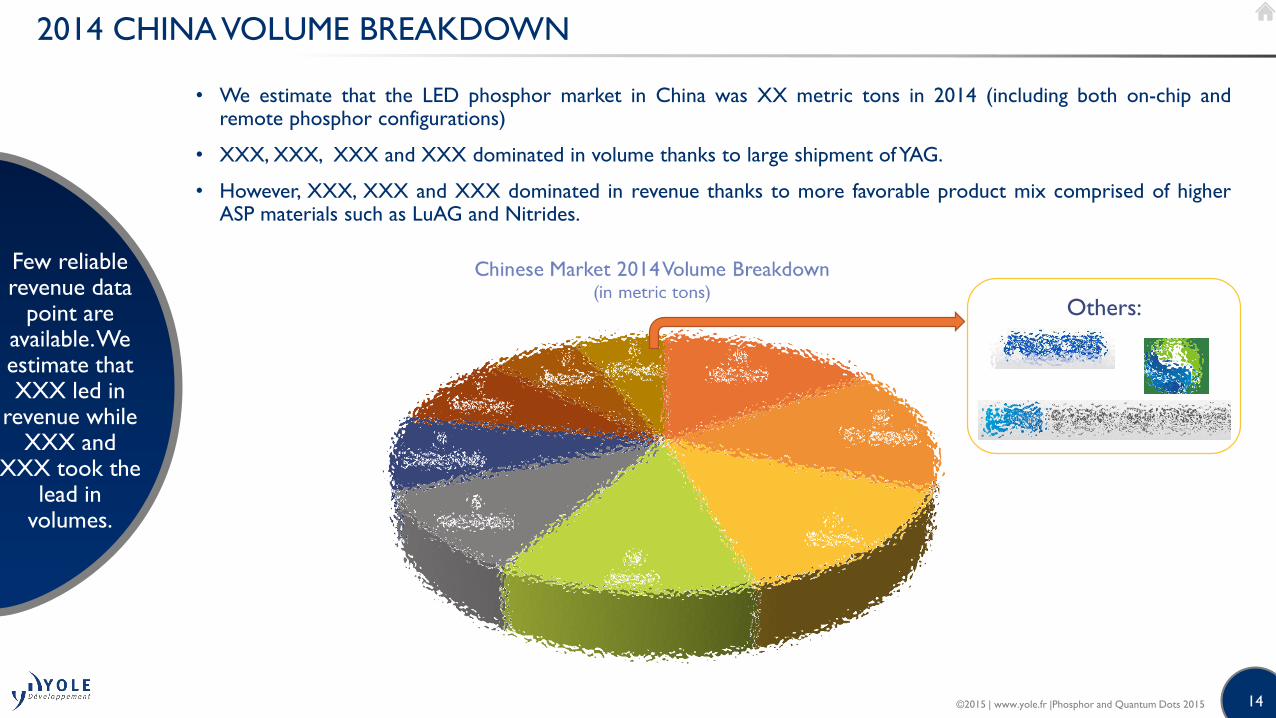
Others:
2014 CHINA VOLUME BREAKDOWN
• We estimate that the LED phosphor market in China was XX metric tons in 2014 (including both on-chip andremote phosphor configurations)
• XXX, XXX, XXX and XXX dominated in volume thanks to large shipment of YAG.
• However, XXX, XXX and XXX dominated in revenue thanks to more favorable product mix comprised of higherASP materials such as LuAG and Nitrides.
Few reliable revenue data
point are available. We estimate that XXX led in
revenue while XXX and
XXX took the lead in
volumes.
©2015 | www.yole.fr |Phosphor and Quantum Dots 2015
15
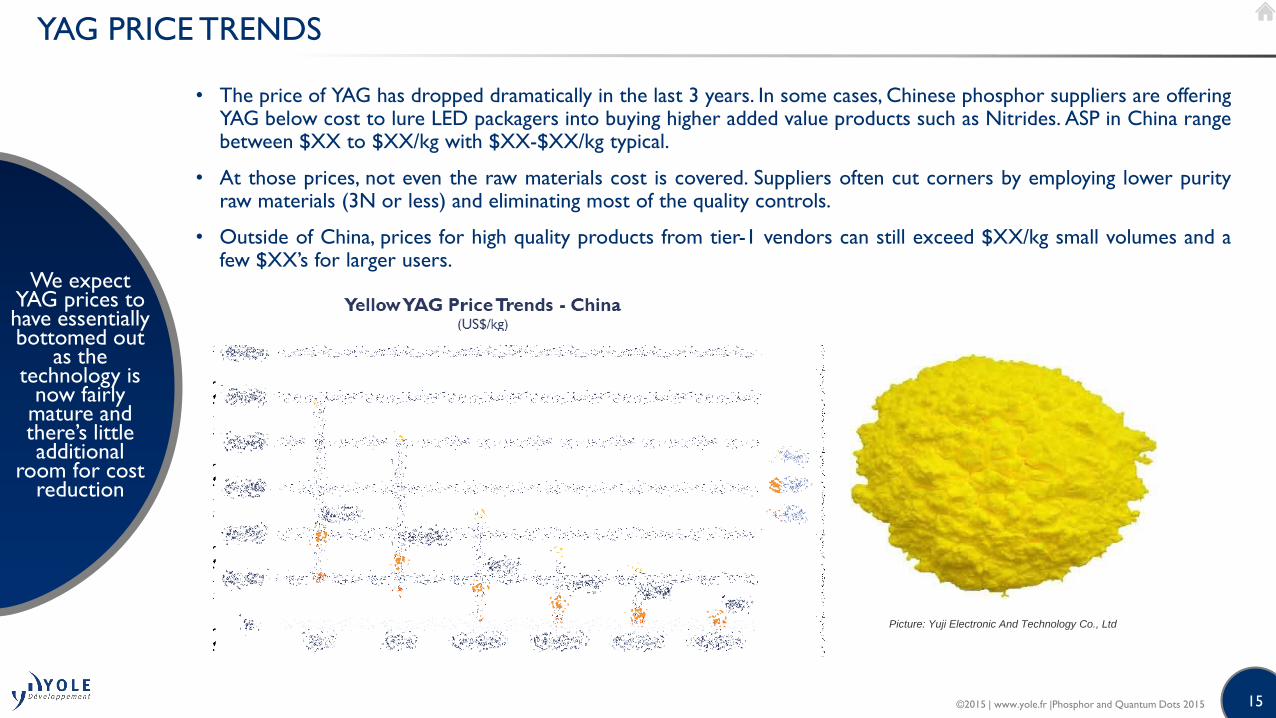
YAG PRICE TRENDS
• The price of YAG has dropped dramatically in the last 3 years. In some cases, Chinese phosphor suppliers are offeringYAG below cost to lure LED packagers into buying higher added value products such as Nitrides. ASP in China rangebetween $XX to $XX/kg with $XX-$XX/kg typical.
• At those prices, not even the raw materials cost is covered. Suppliers often cut corners by employing lower purityraw materials (3N or less) and eliminating most of the quality controls.
• Outside of China, prices for high quality products from tier-1 vendors can still exceed $XX/kg small volumes and afew $XX’s for larger users.
We expect YAG prices to have essentially bottomed out
as the technology is
now fairly mature and there’s little additional
room for cost reduction
Picture: Yuji Electronic And Technology Co., Ltd
©2015 | www.yole.fr |Phosphor and Quantum Dots 2015

16
METHODOLOGY
Phosphor converted LED Chip surface per Application (mm2)
Laptop and
Tablets
TV and
Monitors
Other
displaysCell Phones Automotive
Signs and
displaysProjectors
Personal
Lighting
Residential
Lighting
Industrial
Lighting
Outdoor
Lighting
Commercial
Lighting
Breakdown per
conversion schemes:
• RGB: xx%
• Y: xx%
• R: xx%
• G+Y: xx%
• …
Breakdown per
conversion schemes:
• RGB: xx%
• Y: xx%
• R: xx%
• G+Y: xx%
• …
Breakdown per
conversion schemes:
• RGB: xx%
• Y: xx%
• R: xx%
• G+Y: xx%
• …
Breakdown per
conversion schemes:
• RGB: xx%
• Y: xx%
• R: xx%
• G+Y: xx%
• …
Breakdown per
conversion schemes:
• RGB: xx%
• Y: xx%
• R: xx%
• G+Y: xx%
• …
…
Quantity of
phosphor:
• Blue: xx kg
• Green: xx kg
• Yellow: xx kg
• Red: xx kg
Quantity of
phosphor:
• Blue: xx kg
• Green: xx kg
• Yellow: xx kg
• Red: xx kg
Quantity of
phosphor:
• Blue: xx kg
• Green: xx kg
• Yellow: xx kg
• Red: xx kg
Quantity of
phosphor:
• Blue: xx kg
• Green: xx kg
• Yellow: xx kg
• Red: xx kg
Quantity of
phosphor:
• Blue: xx kg
• Green: xx kg
• Yellow: xx kg
• Red: xx kg
…
Breakdown per
composition:
Green Phosphors
• LuAG: xx%
• GaYAG: xx%
• Silicate: xx%
• Oxynitride: xx%
Breakdown per
composition:
Yellow Phosphors
• YAG: xx%
• Silicate: xx%
Breakdown per
composition:
Red Phosphors
• Nitride: xx%
• Silicate: xx%
Breakdown per
composition:
Green Phosphors
• LuAG: xx%
• GaYAG: xx%
• Silicate: xx%
• Oxynitride: xx%
Breakdown per
composition:
Yellow Phosphors
• YAG: xx%
• Silicate: xx%
Breakdown per
composition:
Red Phosphors
• Nitride: xx%
• Silicate: xx%
Breakdown per
composition:
Green Phosphors
• LuAG: xx%
• GaYAG: xx%
• Silicate: xx%
• Oxynitride: xx%
Breakdown per
composition:
Yellow Phosphors
• YAG: xx%
• Silicate: xx%
……
©2015 | www.yole.fr |Phosphor and Quantum Dots 2015
Breakdown per
composition:
Red Phosphors
• Nitride: xx%
• Silicate: xx%
17
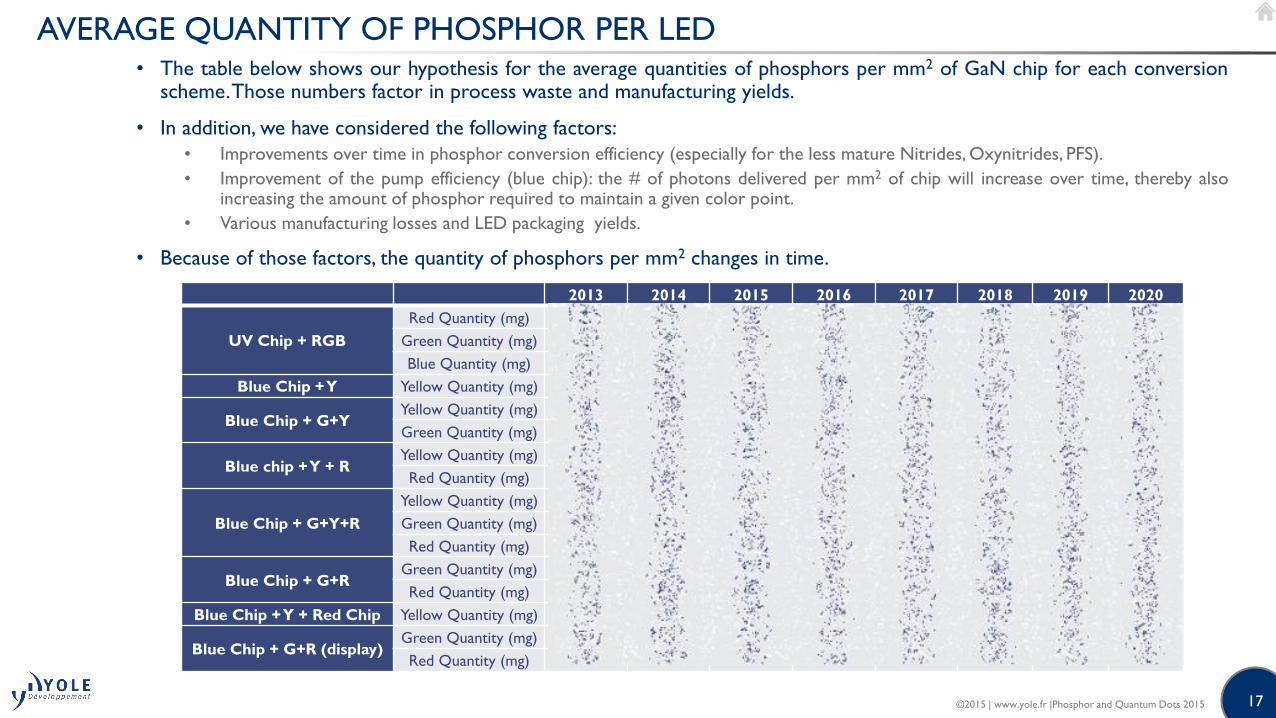
AVERAGE QUANTITY OF PHOSPHOR PER LED• The table below shows our hypothesis for the average quantities of phosphors per mm2 of GaN chip for each conversion
scheme.Those numbers factor in process waste and manufacturing yields.
• In addition, we have considered the following factors:
• Improvements over time in phosphor conversion efficiency (especially for the less mature Nitrides, Oxynitrides, PFS).
• Improvement of the pump efficiency (blue chip): the # of photons delivered per mm2 of chip will increase over time, thereby alsoincreasing the amount of phosphor required to maintain a given color point.
• Various manufacturing losses and LED packaging yields.
• Because of those factors, the quantity of phosphors per mm2 changes in time.
2013 2014 2015 2016 2017 2018 2019 2020
UV Chip + RGB
Red Quantity (mg)
Green Quantity (mg)
Blue Quantity (mg)
Blue Chip + Y Yellow Quantity (mg)
Blue Chip + G+YYellow Quantity (mg)
Green Quantity (mg)
Blue chip + Y + RYellow Quantity (mg)
Red Quantity (mg)
Blue Chip + G+Y+R
Yellow Quantity (mg)
Green Quantity (mg)
Red Quantity (mg)
Blue Chip + G+RGreen Quantity (mg)
Red Quantity (mg)
Blue Chip + Y + Red Chip Yellow Quantity (mg)
Blue Chip + G+R (display)Green Quantity (mg)
Red Quantity (mg)
©2015 | www.yole.fr |Phosphor and Quantum Dots 2015
18
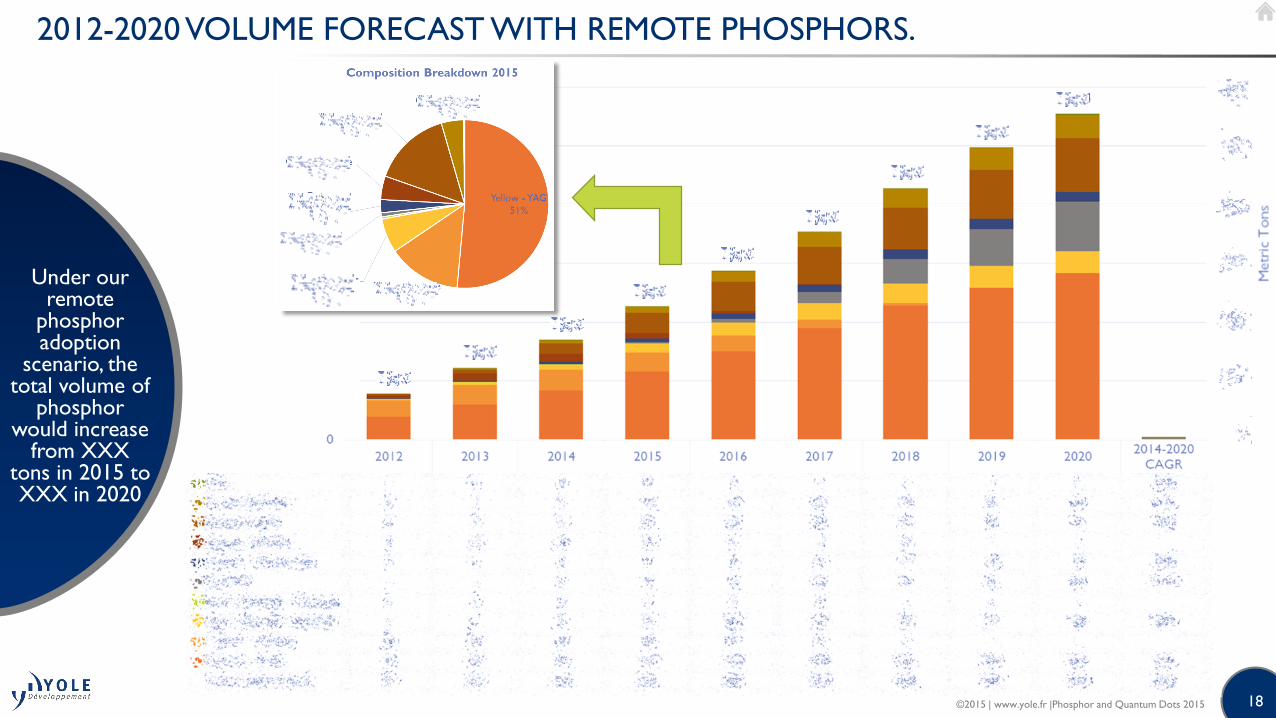
2012-2020 VOLUME FORECAST WITH REMOTE PHOSPHORS.
Under our remote
phosphor adoption
scenario, the total volume of
phosphor would increase
from XXX tons in 2015 to XXX in 2020
©2015 | www.yole.fr |Phosphor and Quantum Dots 2015
19
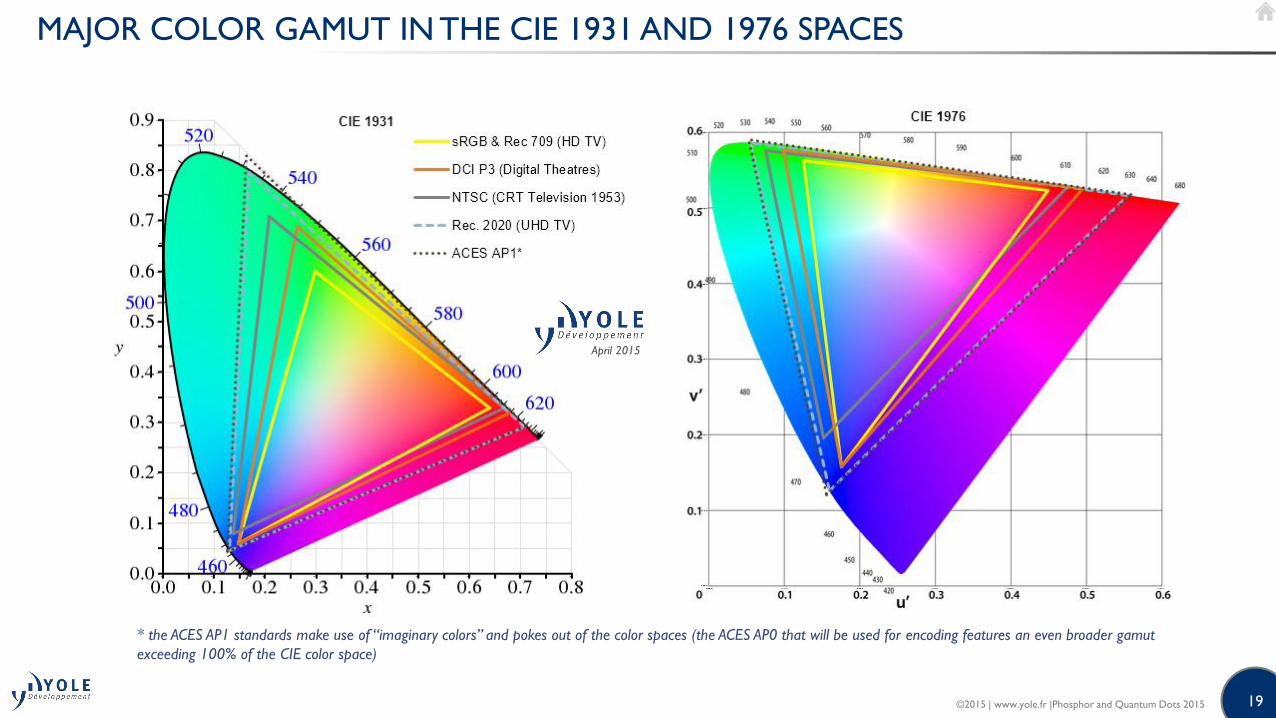
MAJOR COLOR GAMUT IN THE CIE 1931 AND 1976 SPACES
* the ACES AP1 standards make use of “imaginary colors” and pokes out of the color spaces (the ACES AP0 that will be used for encoding features an even broader gamut
exceeding 100% of the CIE color space)
April 2015
©2015 | www.yole.fr |Phosphor and Quantum Dots 2015

20
QUANTUM DOTS IMPLEMENTATION
Edge (1D) and full surface (2D) configurations.
Due to stability
limitations (High flux,
temperature), QD are
currently used only in remote configurations
• Despite significant progress over the last decade, Quantum dots still suffer from limitations in term stability whenexposed to high flux of blue photons and high temperatures. Those limitations have, so far, prevented QDs frombeing utilized in on-chip configurations.
• For display applications, 2 configurations are currently competing:
Glass tube
with QDBlue LED
Edges:“Color IQ”
Source: QD Vision
Full surface:“QDEF”, “QLAS” etc…
Source: 3M/Nanosys
Quantum Dot
Enhancement Film
©2015 | www.yole.fr |Phosphor and Quantum Dots 2015

21
EDGE VS. FILM: COST STRUCTURE
QDs are not the major contributor to the cost of the remote components.
• At the full component level, we estimate that for a 55” TV produced in large volume, the additional cost resulting fromthe adoption of QD is around $xx for 1D solutions and $xx to $xx for film solutions depending on the backlight type(direct backlit films benefit less from photon recycling compared to edge lighting where the photons travels in the lightguide plate parallel to the plane of the film).
• QD components cost will drop as volume increase and QD performance and manufacturing process improve.Especially, it is expected that new generations of QD less sensitive to oxygen and humidity will be developed. Filmscould therefore been built without the 2 encapsulation barrier layers, allowing significant cost savings.
2D films are more
expensive but more
versatile and easier to
implement.
1D
tubes
2D sheets
Edge
2D sheets
Direct
Backlit
QD Quantity (mg)
QD ASP ($/mg)
Total QD cost
Other components cost
(glass, polymer, barrier
layers, manufacturing …)
Margin
Total cost
©2015 | www.yole.fr |Phosphor and Quantum Dots 2015

22
COLOR ENCODING AND DISPLAY GAMUT
From content production to deliver.
The full content production and delivery chain
needs to define and adopt common
standards and practices to
enable improved image
quality for all viewers.
Content creation
Production -encoding
Distribution / broadcasting
Displays
• Digital cameras.
• Editing
• Codecs
• Connectivity (HDMI, DisplayPort,
Wireless..)
• Streaming
• BluRay
• Broadcasting
• Set top boxes
• TVs
• Tablets
• Laptops
• Smartphones©2015 | www.yole.fr |Phosphor and Quantum Dots 2015

23
OLED AND QD DISPLAY COMPARISON
Each technology has fundamental strength and weaknesses
• Ultimately, one can expect OLED to remain superior in term of contrast ratio, viewing angles and response timewhich, on QD-LCD displays, are all limited by the fundamentals of LCD TV designs or materials.
• But continuous LCD TV technology improvements contribute to reducing the gap. Film-compensated multi-domainLC structures, polymer-stabilized blue phase liquid crystal (PS-BPLC [1]) local dimming or edge-lit ultra thin BLU areexample of such improvements. The major remaining challenges for LCD would be response time (best in class arearound 4ms).
• Both OLED and QD-LCD are moving targets. Ultimately cost will decide if both can survive in different marketsegments (entry level for QD / high end for OLED) or if one will eventually dominate the whole TV market.
Both technologies are moving
targets: QD-LCD will strive to improve
performance while OLED will attempt to reduce
cost.
[1]) PS-BPLC nanostructure and short coherence length could lead to LCD response < 1 ms, significantly better than current best in class LCD display at 4 ms
April 2015
©2015 | www.yole.fr |Phosphor and Quantum Dots 2015

24
QD-LCD 2015 SUPPLY CHAIN OVERVIEW
Quantum DotsComponents
(Films, Tubes)
BLU components &
systemsDisplay OEMs
©2015 | www.yole.fr |Phosphor and Quantum Dots 2015
25
TIER 1 QD SUPPLIERS PLAYERS: NANOSYS
• Develops, manufactures and sells QD materials (concentrates).
• 60,000 ft. facility in California with capacity to produce 20 tons of QD concentrate.
• The company has 2 streams of revenue:
• Sales of QD concentrates to its component partners
• Royalties from sales of its component partners to display makers and OEMs.
• In 2010, Nanosys received a US$15m investment from Samsung.
• In 2010 and 2011, Nanosys collaborated with LG Innotek to develop QD backlight based on 1D
glass tube (the “QuantumRail™”). The product received an award at the 2011 CES. Nevertheless,
Nanosys later switched its component design effort toward 2D sheets.
• In June 2012, Nanosys signed an agreement with the Optical system Division of 3M to
commercialize Quantum Dot Enhancement Film™ (“QDEF”).
• In June 2014, the company signed a similar agreement with Korean company LMS (KR). LMS will
manufacture and commercialize its Quantum Light Accumulation Sheet (QLAS).
• Nanosys started shipping its QD material in large volumes in 2013 to serve demand from
Amazon for its Kindle Fire HDX (total: 2000 kg of QD concentrate).
• Nanosys major design wins include Amazon, Hisense, Asus, VP Dynamics as well as a licensing
agreement for its Cd-free technology to Samsung.
• The company holds 222 worldwide granted patents + 75 more pending.
233 South Hillview Drive
Milpitas, CA 95035
Phone: 408-240-6700
Fax: 408-240-6900
Email: [email protected]
©2015 | www.yole.fr |Phosphor and Quantum Dots 2015
26
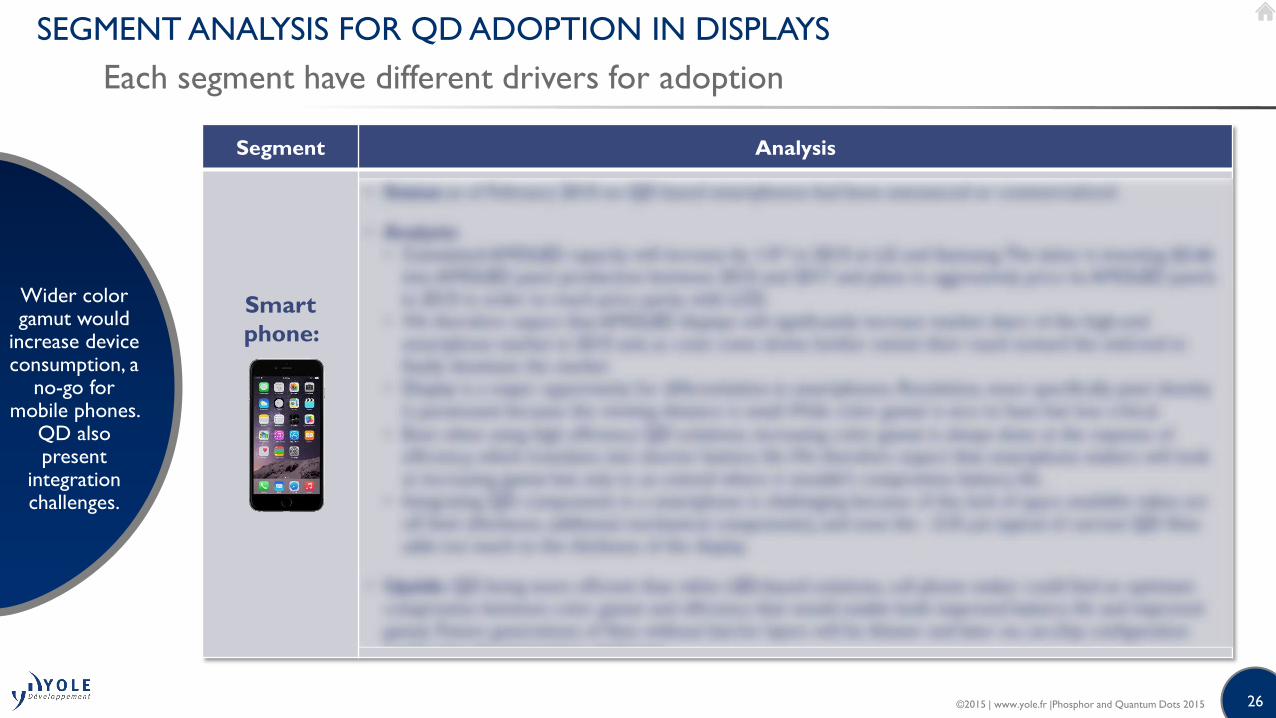
SEGMENT ANALYSIS FOR QD ADOPTION IN DISPLAYS
Each segment have different drivers for adoption
Wider color gamut would
increase device consumption, a
no-go for mobile phones.
QD also present
integration challenges.
Segment Analysis
Smart
phone:
©2015 | www.yole.fr |Phosphor and Quantum Dots 2015

© 2015
From Technologies to Market
Presentation of Yole Développement
With Focus on LED, OLED and Sapphire
Activities
Corporate Presentation
From Technologies to Market

29
FIELDS OF EXPERTISE
Our 30 analysts operate in the following areas.
MEMS &
Sensors
LED &
OLED
Compound
Semi.
Imaging Photonics
MedTech
Manufacturing
Advanced
Packaging
PV
Power
Electronics
30
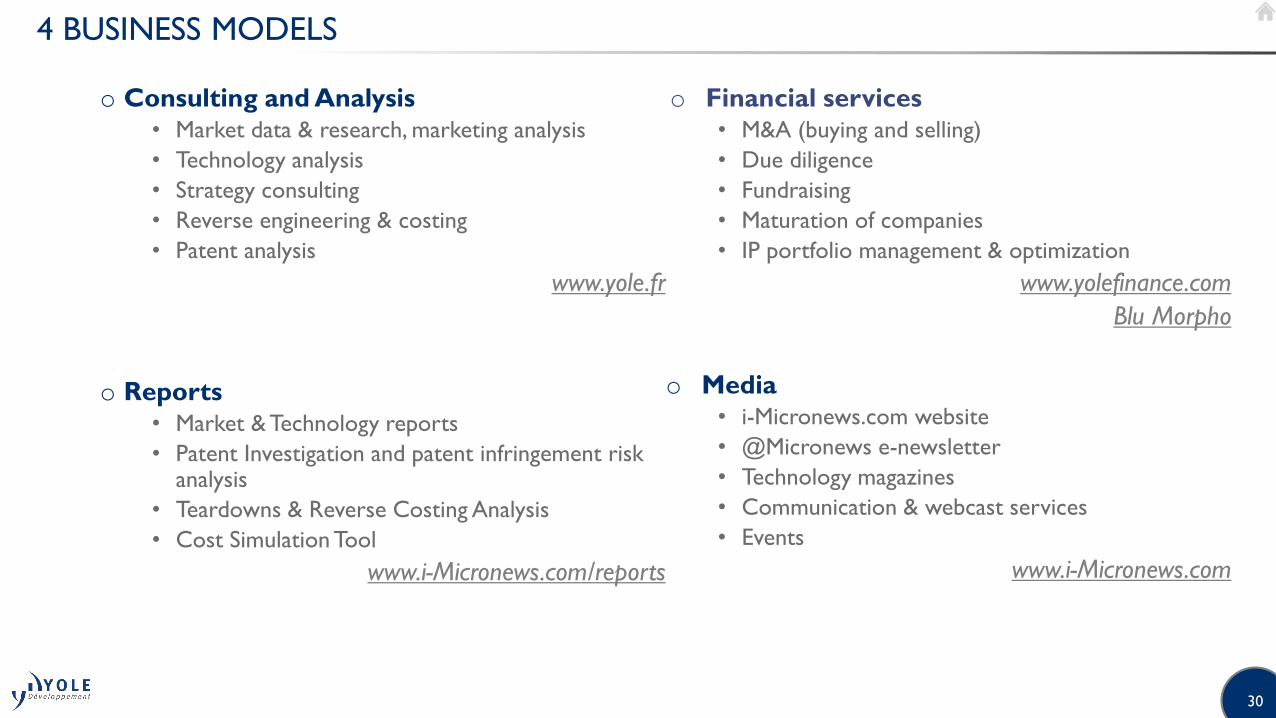
4 BUSINESS MODELS
o Consulting and Analysis
• Market data & research, marketing analysis
• Technology analysis
• Strategy consulting
• Reverse engineering & costing
• Patent analysis
www.yole.fr
o Reports
• Market & Technology reports
• Patent Investigation and patent infringement risk analysis
• Teardowns & Reverse Costing Analysis
• Cost Simulation Tool
www.i-Micronews.com/reports
o Financial services
• M&A (buying and selling)
• Due diligence
• Fundraising
• Maturation of companies
• IP portfolio management & optimization
www.yolefinance.com
Blu Morpho
o Media
• i-Micronews.com website
• @Micronews e-newsletter
• Technology magazines
• Communication & webcast services
• Events
www.i-Micronews.com

31
A GROUP OF COMPANIES
Market,
technology and
strategy
consulting
www.yole.fr
M&A operations
Due diligences
www.yolefinance.com
Fundraising
Maturation of companies
IP portfolio management & optimization
www.bmorpho.com
Manufacturing costs analysis
Teardown and reverse engineering
Cost simulation tools
www.systemplus.fr
IP analysis
Patent assessment
www.knowmade.fr
32
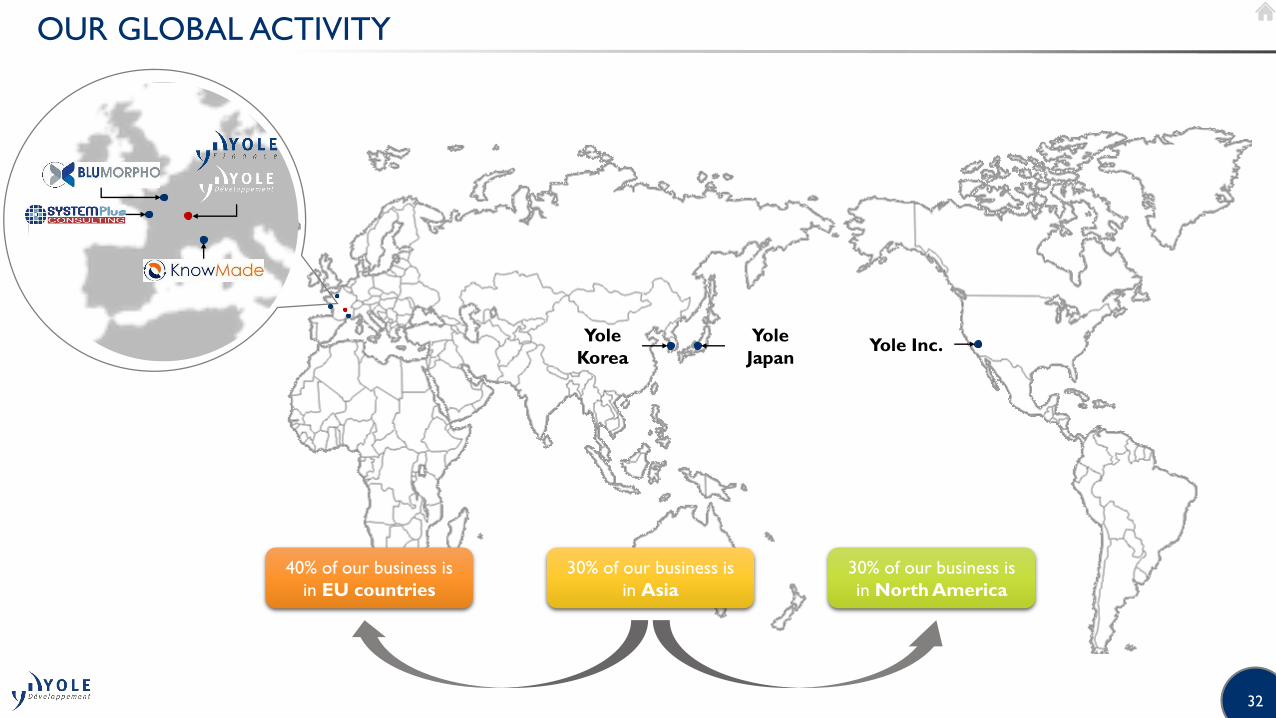
OUR GLOBAL ACTIVITY
Yole
JapanYole Inc.
Yole
Korea
40% of our business is
in EU countries
30% of our business is
in North America
30% of our business is
in Asia
33
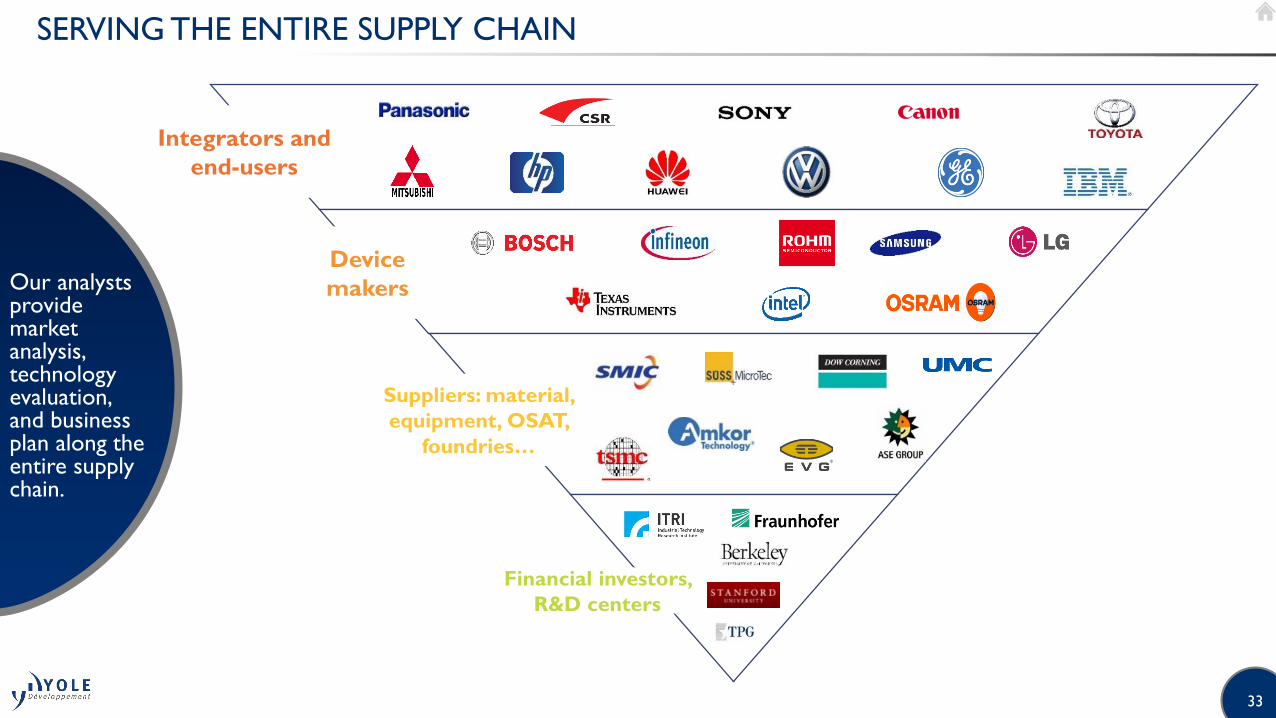
SERVING THE ENTIRE SUPPLY CHAIN
Our analysts provide market analysis, technology evaluation, and business plan along the entire supply chain.
Integrators and
end-users
Device
makers
Suppliers: material,
equipment, OSAT,
foundries…
Financial investors,
R&D centers
34
CONTACT INFORMATION
o Consulting and Specific Analysis
• North America: Steve LaFerriere, Director of Northern America Business Development, Yole Inc.
Email: [email protected]
• Japan: Yutaka Katano, General Manager, Yole Japan & President, Yole K.K.
Email: [email protected]
• RoW: Jean-Christophe Eloy, President & CEO, Yole Développement
Email: [email protected]
o Report business
• North America: Steve LaFerriere, Director of Northern America Business Development, Yole Inc.
Email: [email protected]
• Europe: Fayçal El Khamassi, Headquarter Sales Coordination & Customer Service
Email: [email protected]
• Japan & Asia: Takashi Onozawa, Sales Asia & General Manager, Yole K.K.
Email: [email protected]
• Korea: Hailey Yang, Business Development Manager, Korean Office
Email: [email protected]
o Financial services
• Jean-Christophe Eloy, CEO & President
Email: [email protected]
o General
• Email: [email protected]
Follow us on


36
FOCUS ON LED, OLED AND SAPPHIRE ACTIVITIES
Yole is active throughout the value chain (LED and Sapphire activities)
We are active throughout the value chain: from substrates to systems! And we interact with industrial / R&D players from each level!
Substrate
SiC / Sapphire / Silicon /
Bulk GaN / Engineered
substrates
LED epi-
wafer
Mesa LED, Flip Chip LED,
Vertical LED structures
LED dies-
on-wafer
LED dies
Front-end Level 0 - Epitaxy• Nucleation layer
• n-type layer
• Active layers (MQW)
• p-type layer
Back-End Level 0 - Packaging• Substrate separation & Bonding
• Die singulation
• Testing & Binning
LED systems and applications
Front-end Level 1 - Device Production• Inspection
• Masking / Lithography
• Etching
• Metallization / Contacts / Mirrors
Back-End level 1 - Packaging• Die Attach & Interconnections
• Phosphors
• Encapsulation & Optics
• Testing & Binning
Packaged LEDs
Module Packaging• Substrates (PCB)
• Encapsulation & Optics
• Heatsink
• Testing & Binning
LED modules

37
FOCUS ON LED, OLED AND SAPPHIRE ACTIVITIES
Insights on Forecast Methodology
“What’s Behind the Crystal Ball?”
Only analysts that follow the industry on a daily basis (trough interviews and developed market modeling tools based on discussions with key players of the industry.
APPLICATION
Forecast of standard
product market volume
(unit)Ex.: Smartphone, TVs, lamps (…)
Definition of functions using
LEDsEx.: “Flash vs. Keypad” for
smartphone (…)
Definition of technical
requirementsEx.: Efficacy, size (…)
Definition of LED
penetration rate and
competitiveness with
alternative technologiesEx.: “OLED vs. LED” in smartphone
(…)
Forecast of LED market volume (unit)Split by application, power type (low vs. medium vs. high
power), package type (single vs. multi-die…) (… )
Definition of LED
ASPPer power type, packaged
type (…)
Forecast of LED market size ($)Split by application, power type, package type
(… )
Definition of manufacturing flows for
front-end and packaging (process,
technologies, materials, yields…)Split by application, power type, package type (…)
Forecast of LED manufacturing
equipment and material markets
(unit and $)Ex.: Phosphors, encapsulant, dicing equipment
Definition of LED die
surface (mm²)
Definition of substrate die surface (mm²)
and epiwafer volume (unit)Split by type of substrate (…)
Forecast of LED substrate
markets (unit and $)Split by type of substrate (…)
Definition of sale
levels of key
manufacturers ($)Ex: LED, packaging
materials, epitaxy
materials, manufacturing
equipment, MOCVD
reactor, substrate (…)
System Plus Consulting
expertise in reverse
costing / reverse
engineering
38
FOCUS ON LED, OLED AND SAPPHIRE ACTIVITIES
About Yole’s Analyst Team
A team based on persons having complementary skills and expertise.
Dr. Hong LIN - Market & Technology Analyst
Hong LIN holds a Ph-D in Physics and Chemistry of Materials from the University Pierre et Marie Curie (France). She
works as Market and Technology Analyst in the fields of Compound Semiconductors, Power Electronic and LED. She is also
responsible for investigation on China as being fluent in Chinese. Before joining Yole Développement, she has worked as R&D
Engineer (at Newstep Technologies SAS - France) and research scientist (at ONERA - French Aerospace lab).
Pars MUKISH - Business Unit Manager
Pars MUKISH holds a master degree in Materials Science & Polymers (ITECH - France) and a master degree in Innovation
& Technology Management (EM Lyon - France). Since 2015, Pars MUKISH has taken on responsibility for developing LED,
OLED and Sapphire activities as Business Unit Manager at Yole Développement. Previously, he has worked as Marketing
Analyst and Techno-Economic Analyst for several years at the CEA (French Research Center).
Dr. Eric VIREY - Senior Market & Technology Analyst
Eric VIREY holds a Ph-D in Optoelectronics from the National Polytechnic Institute of Grenoble (INPG - France). He
works as Market and Technology Analyst in the fields of Sapphire and LED. In the last 12 years, he has held various R&D,
engineering, manufacturing and marketing positions with Saint-Gobain. Most recently, he was Market Manager at Saint-Gobain
Crystals, in charge of Sapphire and Optoelectronic products.
Dr. Milan ROSINA - Senior Market & Technology Analyst
Milan ROSINA holds a Ph-D in Optoelectronics from the National Polytechnic Institute of Grenoble (INPG - France). He
works as Market and Technology Analyst in the fields of Energy Conversion, LED / OLED and Emerging Materials. Before
joining Yole Développement, he has worked as research scientist and project manager in PV, microelectronics and LED
industries. He has more than 15 year experience with prominent research institutions and a utility company.
39
FOCUS ON LED, OLED AND SAPPHIRE ACTIVITIES
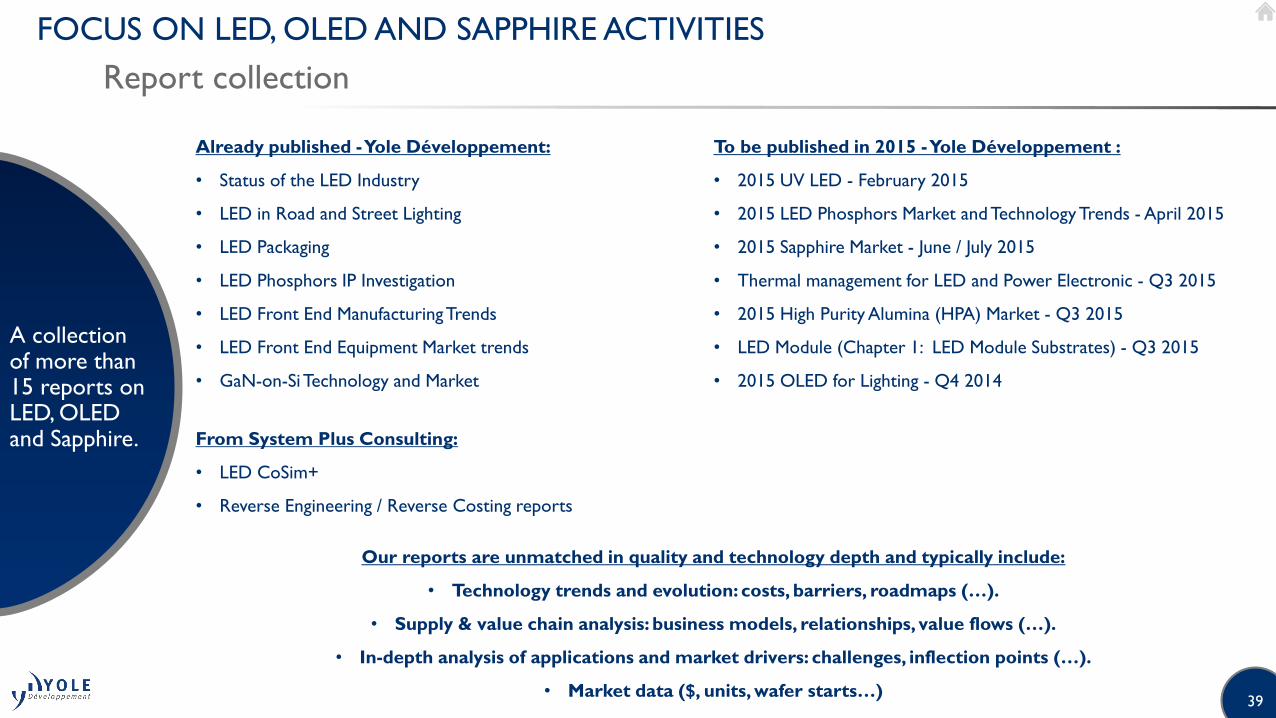
Report collection
Already published -Yole Développement:
• Status of the LED Industry
• LED in Road and Street Lighting
• LED Packaging
• LED Phosphors IP Investigation
• LED Front End ManufacturingTrends
• LED Front End Equipment Market trends
• GaN-on-SiTechnology and Market
From System Plus Consulting:
• LED CoSim+
• Reverse Engineering / Reverse Costing reports
To be published in 2015 -Yole Développement :
• 2015 UV LED - February 2015
• 2015 LED Phosphors Market and Technology Trends - April 2015
• 2015 Sapphire Market - June / July 2015
• Thermal management for LED and Power Electronic - Q3 2015
• 2015 High Purity Alumina (HPA) Market - Q3 2015
• LED Module (Chapter 1: LED Module Substrates) - Q3 2015
• 2015 OLED for Lighting - Q4 2014
A collection of more than 15 reports on LED, OLED and Sapphire.
Our reports are unmatched in quality and technology depth and typically include:
• Technology trends and evolution: costs, barriers, roadmaps (…).
• Supply & value chain analysis: business models, relationships, value flows (…).
• In-depth analysis of applications and market drivers: challenges, inflection points (…).
• Market data ($, units, wafer starts…)
ORDER FORMPhosphors & Quantum Dots 2015: LED Downconverters
for Lighting & Displays
SHIPPING CONTACT
FirstName:
Email:
LastName:
Phone:
PAYMENTBYCREDITCARD Visa Mastercard Amex
Name oftheCardHolder:
CreditCardNumber:
CardVerification Value(3digitsexceptAMEX:4digits):
Expirationdate:
BYBANKTRANSFERBANKINFO:HSBC,1placedelaBourse, F-69002Lyon,France,Bankcode:30056,Branchcode:00170AccountNo:0170200156587,SWIFTorBICcode:CCFRFRPP,IBAN:FR7630056001700170200156587
RETURNORDERBY• FAX:+33(0)472830183• MAIL:YOLEDÉVELOPPEMENT,LeQuartz, 75CoursEmileZola,69100Villeurbanne/Lyon-France
SALESCONTACTS • NorthAmerica:[email protected]• Japan&Asia:[email protected]• Europe&RoW:[email protected]• Korea:[email protected]• General:[email protected]
(1) Our Terms and Conditions of Sale are available at www.yole.fr/Terms_and_Conditions_of_Sale.aspx The present document is valid 24 months after its publishing date: April 16th, 2015
/
ABOUT YOLE DEVELOPPEMENT
BILL TOName(Mr/Ms/Dr/Pr):
JobTitle:
Company:
Address:
City:
State:
Postcode/Zip:
Country*:
*VATIDNumberforEUmembers:
Tel:
Email:
Date:
PRODUCT ORDERPlease enter my order for above named report : One user license*: Euro 4,990 Multi user license: Euro 5,990For price in dollars, please use the day’s exchange rate. Allreports are delivered electronically at payment reception. ForFrenchcustomers,add20%forVATI hereby accept Yole Développement’s Terms and Conditions of Sale(1)
Signature:
*One user license means only one person at the company can use the report.
Foundedin1998,YoleDéveloppementhasgrowntobecomeagroupofcompaniesprovidingmarketing,technologyandstrategyconsulting,mediainadditiontocorporatefinanceservices.Withastrongfocusonemergingapplicationsusingsiliconand/ormicromanufacturing(technologyorprocess),YoleDéveloppementgrouphasexpandedtoincludemorethan50associatesworldwidecoveringMEMS,CompoundSemiconductors,LED,ImageSensors,Optoelectronics,Microfluidics&Medical,Photovoltaics,AdvancedPackaging,Manufacturing,NanomaterialsandPowerElectronics.Thegroupsupportsindustrialcompanies,investorsandR&Dorganizationsworldwidetohelpthemunderstandmarketsandfollowtechnologytrendstodeveloptheirbusiness.
MEDIA & EVENTS• i-Micronews.com,onlinedisruptivetechnologieswebsite• @Micronews,weeklye-newsletter• TechnologyMagazinesdedicatedtoMEMS,AdvancedPackaging,
LED and Power Electronics• Communication&webcastsservices• Events:YoleSeminars,MarketBriefings…More information on www.i-micronews.com
CONTACTSFormoreinformationabout:• ConsultingServices:Jean-ChristopheEloy([email protected])• FinancialServices:Jean-ChristopheEloy([email protected])• ReportBusiness:DavidJourdan([email protected])•Pressrelations:SandrineLeroy([email protected])
CONSULTING• Marketdata&research,marketinganalysis• Technologyanalysis• Reverse engineering & costing services• Strategyconsulting• Patent analysisMore information on www.yole.fr
REPORTS• Collectionoftechnology&marketreports• Manufacturingcostsimulationtools• Componentreverseengineering&costing
analysis• Patent investigationMore information on www.i-micronews.com/reports
FINANCIAL SERVICES• Mergers&Acquisitions• Due diligence• FundraisingMore information on www.yolefinance.com