phosphorus and potassium fertilization of alfalfa profitability, it is important to adjust...
TRANSCRIPT
AY-331-W
Purdue extension
Fertilizing alfalfa with phosphorus (P) and potassium (K) can increase yield and stand longevity. However, to maximize production and profitability, it is important to adjust fertilizer rates to meet the specific nutritional needs of plants in each field.
This publication provides information on P and K fertilization rates in alfalfa. First, we will review important P and K deficiency symptoms and current soil test recommendations. Next, we will discuss recent Purdue University fertilizer rate studies. Finally, we will address the importance of balanced fertility, the timing of fertilizer application, and the influence of P and K fertility on alfalfa forage quality.
Essential for Plant Processes P and K are macronutrients, which means plants require them in relatively high amounts compared to many other nutrients. Both nutrients are essential for plant growth.
Plants require K for a number of important physiological processes including the activation of several enzymes, the synthesis and degradation of carbohydrates, the synthesis of protein, and the opening and closing of stomata — the pores in leaf surfaces that are involved in gas exchange and photosynthesis.
Plants require P for many cellular constituents including nucleic acids (DNA, RNA), phospholipids, ATP, and other high-energy compounds. All of these compounds are necessary for photosynthesis, energy transfer, carbohydrate and protein synthesis, and lipid metabolism (Rhykerd and Overdahl, 1982).
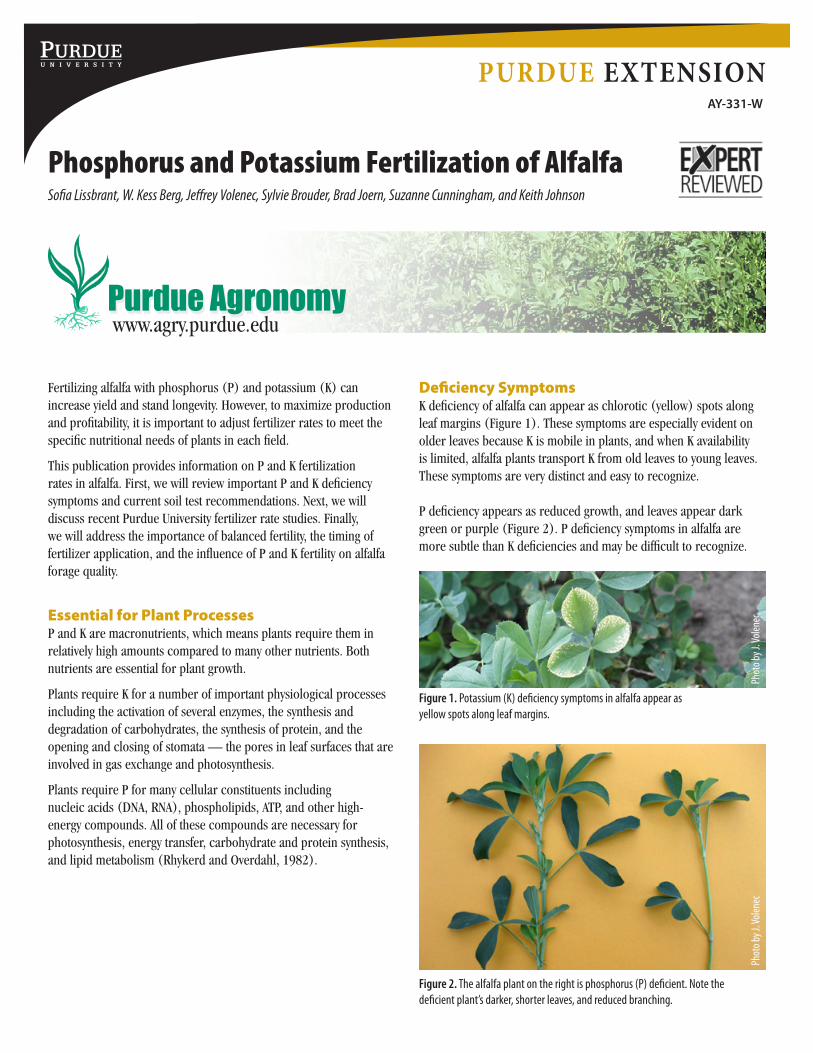
Deficiency Symptoms K deficiency of alfalfa can appear as chlorotic (yellow) spots along leaf margins (Figure 1). These symptoms are especially evident on older leaves because K is mobile in plants, and when K availability is limited, alfalfa plants transport K from old leaves to young leaves. These symptoms are very distinct and easy to recognize. P deficiency appears as reduced growth, and leaves appear dark green or purple (Figure 2). P deficiency symptoms in alfalfa are more subtle than K deficiencies and may be difficult to recognize.
Figure 1. Potassium (K) deficiency symptoms in alfalfa appear as yellow spots along leaf margins.
Figure 2. The alfalfa plant on the right is phosphorus (P) deficient. Note the deficient plant’s darker, shorter leaves, and reduced branching.
Phosphorus and Potassium Fertilization of AlfalfaSofia Lissbrant, W. Kess Berg, Jeffrey Volenec, Sylvie Brouder, Brad Joern, Suzanne Cunningham, and Keith Johnson
www.agry.purdue.edu
Phot
o by J
. Vole
nec
Phot
o by J
. Vole
nec

2
Improving Stand Longevity Alfalfa stands normally provide the highest yield in their first two or three production years, and then start to decline thereafter. If a stand’s productivity decreases enough, re-establishing the stand will be necessary. However, re-establishing a stand is costly, so it may be more profitable to improve management practices that will keep stands high-yielding for more years. Adding sufficient P and K will help alfalfa stands persist better and produce high yields longer than stands not receiving P and K.
CEC and Yield Affect Fertilizer Rates When P soil test levels are 45 ppm or less, the current recommendations call for applying P (Table 1). For very low P soil test results (15 ppm), recommendations call for 115 to 165 pounds per acre of phosphate (P
2O
5) depending on yield
expectations.
Recommendations for K vary according to both the soil’s cation exchange capacity (CEC) and yield expectations (Table 2). At the same soil test level, a soil with a high CEC will need more K fertilizer than a soil with a low CEC. However, regardless of CEC, never apply more than 300 pounds of K
20 per acre (Vitosh et al., 1996).
Current Recommendations May Be High Purdue researchers have shown that the current P and K fertilizer recommendations certainly are adequate, but also may be higher than necessary for high yield and stand persistence. With increasing fertilizer costs, a conservative approach to identifying fertilizer application rates may be more profitable than current recommendations, which tend to be more aggressive.
Purdue researchers are currently collaborating with surrounding states to re-evaluate alfalfa fertilizer recommendations.
High Rates Do Not Always Equal to High Yield The amount of fertilizer an alfalfa stand needs to provide high yield and good persistence depend on the soil’s current nutrient status and yield expectations; the lower the initial soil test levels and the higher the yield expectations, the more fertilizer is needed. However, over-applying fertilizer may not always result in higher yield.
A seven-year Purdue study started out with low P (8 ppm) and medium K (70 ppm) soil test levels. The average across all years of the study shows that the highest yields were routinely obtained with applications of:
• 50 pounds of P2O
5 per acre per year and 300 pounds of K
2O per
acre per year
or• 100 pounds of P
2O
5 per acre per year and 200 pounds of K
2O per
acre per year (Figure 3)
Higher fertilizer rates did not significantly increase yields.
Table 1. Phosphate (P2O5) Recommendations1
Soil Test P (ppm)
Expected Yield (tons/acre)5 6 7 8 9
lbs P2O5/acre15 115 130 140 155 16520 90 105 115 130 140
25-402 65 80 90 105 11545 35 40 45 50 6050 0 0 0 0 0
1Rate recommendations based on soil test results and yield expectations.2Maintenance recommendations are given for this soil test range.Source: adapted from Purdue Extension publication AY-9-32-W, Vitosh et al., Tri-State Fertilizer Recommendations for Corn, Soybeans, Wheat & Alfalfa, Table 17.
Table 2. Potash (K2O) Recommendations1
Soil Test K (ppm)
Cation Exchange Capacity (meq/100g) 5 10 20 30
lbs K2O/acre75 2852 300 300 300
75-100 1503 2702 300 300100-125 404 1605 2702 300125-150 0 556 1605 2702
150-175 0 0 556 1605
175-200 0 0 0 556
200- 0 0 0 01Rate recommendations based on soil test results and cation exchange capacity for
an expected yield of 5 tons per acre.2For an expected yield of 6 tons or more per acre, apply 300 pounds per acre.3For each additional ton of yield, add 30 pounds per acre, but do not exceed 260
pounds per acre. 4For each additional ton of yield, add 10 pounds per acre, but do not exceed 70
pounds per acre.5For each additional ton of yield, add 30 pounds per acre.6For each additional ton of yield, add 10 pounds per acre.Source: adapted from Purdue Extension publication AY-9-32-W, Vitosh et al., Tri-State Fertilizer Recommendations for Corn, Soybeans, Wheat & Alfalfa, Table 22.
Figure 3. A multi-year Purdue study found that the highest alfalfa yields were recorded when fertilizer rates were 50 pounds of P2O5 per acre per year, and 200 pounds or more of K2O per acre per year. There was no significant yield increase when rates of more than 50 pounds of P2O5 per acre per year and more than 200 pounds of K2O per acre per year were applied. Source: adapted from Berg et al., 2005, 2007.
Purdue extension
Annu
al y
ield
(lbs
/A)
Applie
d P2O 5
(lbs/A
)
Applied K2O (lbs/A)

3
Nutrient Balance Is Critical It is essential to consider an alfalfa plant’s P and K needs before fertilizing. Testing soil P and K, and then fertilizing accordingly will ensure balanced soil fertility.
In the Purdue study, researchers found that alfalfa stands receiving P fertilizer but not K fertilizer yielded less than stands that were not fertilized at all. In fact, some of the plots receiving imbalanced fertilizer rates experienced complete stand loss, while unfertilized plots and those provided low rates of both P and K persisted, but were low-yielding (Figure 4).
Purdue researchers showed that an alfalfa stand fertilized with 50 to 150 pounds of P
2O
5 per acre per year and 200 to 400 pounds of K
2O
per acre per year had higher yields than unfertilized stands (Figure 5). Providing adequate P and K fertilizer slowed yield reduction over time, resulting in progressively greater yield advantages due to P and K fertility as stands became older.
Figure 5. Influence of P and K fertilization on total annual yield. Soil test P and K concentrations averaged 8 and 70 ppm, respectively at stand establishment. Source: Lissbrant et al., unpublished.
Purdue extension
Figure 4. Photo of the Purdue study site at first harvest of the seven-year-old stand. Note that the two dead plots have imbalanced fertility (0 K2O plus 50 pounds P2O5 and 0 K2O plus 100 pounds P2O5). This photo shows areas with varying P2O5 and 0 K2O application rates:
Phot
o by J
. Vole
nec
A = 0 K2O plus 50 pounds P2O5
B = 300 pounds K2O plus 100 pounds P2O5
C = 0 K2O plus 100 pounds P2O5
D = 100 pounds K2O plus 150 pounds P2O5
E = 300 pounds K2O plus 50 pounds P2O5
A B C
D E
Yiel
d, lb
s/Ac
re
4
Apply After First and Last Harvests At the test site in west central Indiana, the soils released considerable amounts of K over the winter. Plants generally used these released nutrients during their initial growth in spring, so applying additional P and K after the first harvest is recommended. After the last harvest of the growing season, make a second application to increase the availability of K in fall, which may improve the alfalfa stand’s winter hardiness and survival.
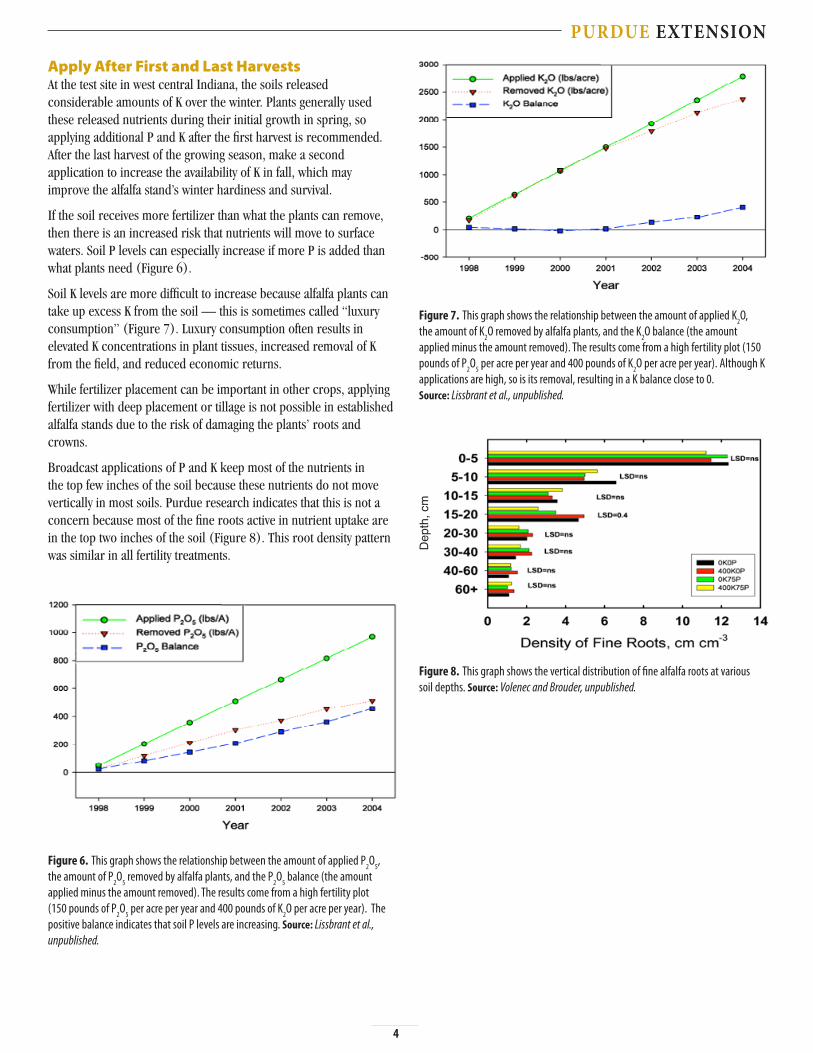
If the soil receives more fertilizer than what the plants can remove, then there is an increased risk that nutrients will move to surface waters. Soil P levels can especially increase if more P is added than what plants need (Figure 6).
Soil K levels are more difficult to increase because alfalfa plants can take up excess K from the soil — this is sometimes called “luxury consumption” (Figure 7). Luxury consumption often results in elevated K concentrations in plant tissues, increased removal of K from the field, and reduced economic returns.
While fertilizer placement can be important in other crops, applying fertilizer with deep placement or tillage is not possible in established alfalfa stands due to the risk of damaging the plants’ roots and crowns.
Broadcast applications of P and K keep most of the nutrients in the top few inches of the soil because these nutrients do not move vertically in most soils. Purdue research indicates that this is not a concern because most of the fine roots active in nutrient uptake are in the top two inches of the soil (Figure 8). This root density pattern was similar in all fertility treatments.
Figure 6. This graph shows the relationship between the amount of applied P2O5, the amount of P2O5 removed by alfalfa plants, and the P2O5 balance (the amount applied minus the amount removed). The results come from a high fertility plot (150 pounds of P2O5 per acre per year and 400 pounds of K2O per acre per year). The positive balance indicates that soil P levels are increasing. Source: Lissbrant et al., unpublished.
Figure 7. This graph shows the relationship between the amount of applied K2O, the amount of K2O removed by alfalfa plants, and the K2O balance (the amount applied minus the amount removed). The results come from a high fertility plot (150 pounds of P2O5 per acre per year and 400 pounds of K2O per acre per year). Although K applications are high, so is its removal, resulting in a K balance close to 0. Source: Lissbrant et al., unpublished.
Figure 8. This graph shows the vertical distribution of fine alfalfa roots at various soil depths. Source: Volenec and Brouder, unpublished.
Purdue extension
Dep
th, c
m

5
Applications May Reduce Quality Adding fertilizer to alfalfa may increase yields, but the plants’ morphology and physiology may be altered in ways that impact forage quality.
P and K applications can cause shoots to grow taller and thicker, which reduces the amount of leaves relative to the amount of stem tissue (the leaf-to-stem ratio). Low leaf-to-stem ratios often mean reduced forage quality.
Table 3 shows how digestibility decreases as yields increase due to P and K application. To compare the benefits and constraints caused by P and K fertilization, researchers calculated the digestible nutrient yield (DNY, in pounds per acre) by multiplying the percent digestibility of the forage by the forage yield (in pounds per acre):
DNY = (Percent Digestibility÷100) x Forage Yield
Higher yields easily compensated for slightly reduced digestibility in the high fertility plots (Table 3, Figure 9).
Table 3. Digestible Nutrient Yields
Treatment(lbs/acre/year)
Forage Yield(lbs/acre)
Digestibility1
(%)
Digestible Nutrient Yield
(lbs/acre)
0 P2O
5
0 K2O
1,087 86 927
50 P2O
5
200 K2O
2,324 83 1,915
150 P2O
5
400 K2O
2,542 81 2,063
1Values adjusted for organic matter (ash content removed).
Source: Lissbrant et al. (unpublished).
Figure 9. This graph shows the relationship between forage yield and digestible nutrient yield (DNY). Source: Lissbrant et al., unpublished.
Fertilizer Applications May Lower ProteinAnimals differ in their protein requirements, so it may be worthwhile to regulate the amount of protein in the forage (depending on how it is used). In fields with low P and K fertility, protein concentrations were slightly higher than in fields with high P and K fertility (Figure 10).
Despite these differences, Purdue research shows that high-fertility, high-yield stands provide sufficient protein concentration to satisfy the requirements of dairy cows in lactation, and only slightly less than the requirements for dairy cows in early lactation. Small drops in protein concentrations resulting from P and K fertilization were more than offset by the large difference in forage yields. Other factors, such as cutting management, will influence forage quality more than fertility.
Figure 10. This graph shows protein concentrations for alfalfa fertilized with contrasting rates of P and K fertilizer (Lissbrant et al., unpublished). Horizontal reference lines indicate the dietary protein requirements for moderate work horses, lactating dairy cows producing 70 pounds of milk per day, and dairy cows in early lactation. Source: Perry et al., 2003.
Excessive P and K applications can reduce economic returns because of wasted fertilizer as well as lower forage value.
If the forage K concentration exceeds 3 percent of its dry weight, animals may be stricken with milk fever, which is caused by hypocalcemia (low blood calcium). This potentially fatal condition is most prevalent in cows shortly after calving. Monitoring soil test levels and applying fertilizers as split applications can reduce the risk for excess K in the forage, and milk fever.
Forage can be sampled and tested for P and K concentrations, which is a good idea if low or high P and K levels are suspected (see information below on finding testing laboratories). Table 4 provides general guidelines regarding deficient, sufficient, and excessive tissue P and K concentrations.
Table 4. Deficient, Sufficient, and Excessive P and K in Alfalfa
Deficient Sufficient ExcessivePhosphorus (%)1 <0.25 0.26-0.70 >0.71
Potassium (%)1 <2.0 2.01-3.5 >3.511Determined by sampling the top 6 inches of the plant prior to initial flowering.Source: adapted from Purdue Extension publication AY-9-32-W, Vitosh et al., Tri-State Fertilizer Recommendations for Corn, Soybeans, Wheat & Alfalfa, Table 24.
Purdue extensionD
iges
tible
Nut
rient
Yie
ld (D
NY)
Cru
de P
rote
in (%
)

6
Order or download materials from Purdue Extension • The Education Store
www.extension.purdue.edu/store
It is the policy of the Purdue University Cooperative Extension Service that all persons have equal opportunity and access to its educational programs, services, activities, and facilities without regard to race, religion, color, sex, age, national origin or ancestry, marital status, parental status, sexual orientation, disability or status as a veteran.
Purdue University is an Affirmative Action institution. This material may be available in alternative formats.
Purdue Agriculture New 03/09
Purdue extension
Key Points to Remember
Before starting any fertilization program, remember the following:
• P and K positively influence alfalfa yield and stand persistence.
• Alfalfa requires balanced nutrition for high yield and persistence. Split applications of P and (especially) K after the first and last harvests enhance productivity and avoid luxury consumption of K.
• Broadcast applications of P and K fertilizer work well since fine roots are abundant near the soil surface.
• Fertilize for high yield; do not worry about forage quality. Higher yields will compensate for slight reductions in forage quality.
• Do not over-apply K. Plants can engage in luxury consumption, leading to increased tissue K concentrations and the risk of milk fever.
Find a Laboratory
Purdue Extension maintains a list of certified commercial laboratories at www.agry.purdue.edu/ext/soiltest.html.
References
Berg, W. K., S. M. Cunningham, S. M. Brouder, B. C. Joern, K. D. Johnson, J. Santini, and J.J. Volenec. 2005. Influence of phosphorus and potassium on alfalfa yield and yield components. Crop Sci. 45: 297-304.
Berg, W. K., S. M. Cunningham, S. M. Brouder, B. C. Joern, K. D. Johnson, J. Santini, and J.J. Volenec. 2007. The long-term impact of phosphorus and potassium fertilization on alfalfa yield and yield components. Crop Sci. 47: 2198-2209.
Perry, T. W., A. E. Cullison, and R. S. Lowrey. 2003. Feeds & Feeding. 6th ed. Prentice Hall, Upper Saddle River, N.J.
Rhykerd, C.L., and C.J. Overdahl. 1982. Nutrition and fertilizer use. In Hanson, C.H. (ed) Alfalfa Science and Technology. Agronomy Monograph 15, pp. 437-468. Am. Soc. Agron., Madison, WI.
Vitosh, M.L., J.W. Johnson, and D.B. Mengel, eds. 1996. Tri-State Fertilizer Recommendations for Corn, Soybeans, Wheat & Alfalfa. Purdue Extension publication AY -9-32-W.
AcknowledgementWe greatly appreciate the assistance of Jay Young and his staff at the Throckmorton Purdue Agricultural Center for their outstanding support of the field operations necessary for the conduct of this research.