phosphorus nutrition of wheat. outline: p nutrition of wheat 1.what are the nutrient requirements of...
TRANSCRIPT

Phosphorus Nutritionof Wheat

Outline:P Nutrition of Wheat
1. What are the nutrient requirements of wheat throughout the season?
2. Why is P needed early in the season?
3. Why is placing P near the seed important?
4. How can I be sure there are adequate supplies of P?
5. What are some good strategies for managing P?
Photo courtesy of the USDA-ARS

What have the trends been in wheat yield?
NASS; Statistics Canada
0.31 bu/A/yr
0.38 bu/A/yr
10
15
20
25
30
35
40
45
1960 1965 1970 1975 1980 1985 1990 1995 2000 2005
Year
Whe
at y
ield
, bu
/A
Canada
U.S.

What are the nutrient requirements of wheat throughout the season?
Photo courtesy of the USDA-ARS

Plants take up P as:
• Primary orthophosphate ion: H2PO4- (pH < 7.0)
• Secondary orthophosphate ion: HPO4= (pH > 8.0)
• The form most common is a function of soil pH – both equally present at neutral
Solution P

How much N, P, and K does wheat take up?
0
20
40
60
80
100
120
140
emer
gence
tille
ring
flag le
af
headin
g
anth
esis
early
milk
soft
dough
harve
st
Nut
rient
upt
ake,
lb/A
N
K2O
P2O5
38 bu/A spring wheat
Growth stage
Johnston et al., 1999

How are nutrients distributed in the plant?
Grain Straw
0
20
40
60
80
100
120
N P2O5 K2O
Nut
rient
con
tent
, lb
/A
Crop Removal 0.5 – 0.6
lb P2O5/bu
38 bu/A spring wheat
Johnston et al., 1999

How is P distributedin the plant?
Miller et al., 1994
Percent at physiological maturity:
16.01.8 15.07.0 10.2 11.5 14.04.5Haun**
80
9
830
10
20
30
40
50
60
139 319 499 679 859 1039 1219 1399 1579 1759GDD*
Leaves
Stem
Head
Grain
Cum
ulat
ive
P u
ptak
e,lb
P2O
5/A
90 bu/A irrigated spring wheat
* Growing degree days ** Haun growth stage

What percent of the Pin the plant comes from fertilizer?
Mitchell, 1957
0
50
100
150
200
250
300
4 weeks heading soft dough mature
Tot
al P
upt
ake,
mg
Unfertilized
Fertilized with MAP
46 %
43 %
36 %
39 %
Stage of growth

Why is P neededearly in theseason?

Early season P nutritionis critical
• Early season P deficiencylimits yield potential
– Critical period:first 5 to 6 weeks
– P has major impacts ontillering and rooting
• Wheat absorbs only 15%of total P uptake in firsttwo weeks of growth
– Small amount but critical for optimum yield– Reserves can support later growth
• Later season P stress has much lower impact oncrop production
Photo courtesy of the USDA NRCS

Wheat tillers
• Wheat producestwo kinds of stems (culms):
– Main stem– Variable number of tillers
• Tillering is not a random event• Follows a very strict pattern• Tillers initiated vary greatly
in vigor and potentialfor grain production
Wheat Plant
Nodal roots
Seminal roots
Seed
ColeoptiletillerT0
SecondtillerT2
SecondleafL2
FourthleafL4
FifthleafL5
ThirdleafL3
FirstleafL1
FirsttillerT1
Goos and Johnson, 1996; Klepper et al., 1982

Contribution of tillersto yield
Goos and Johnson, 1996
0
10
20
30
40
50
60
Main stem T1 + T2 Other
Per
cent
of
final
yie
ld
SecondtillerT2
Mainstem
FirsttillerT1
Spring WheatEmbden, ND – 46 bu/A
Spring WheatEmbden, ND – 46 bu/A

Phosphorus increases tiller initiation
Goos and Johnson, 1996
0
10
20
30
40
50
60
70
80
90
100
T0 T1 T2 T3 T4 ST
Per
cent
initi
atio
n
0
30
lb P2O5 /A placed with the seed
Tillers
Hettinger, NDOlsen P = 10 ppm
Hettinger, NDOlsen P = 10 ppm

Why is placing Pnear the seedimportant?

10 lb of starterP2O5 with seed
No starter P
Impact of a Cool Spring on Spring Wheat’s EmergenceBoth sides received fall-banded 70-30-10-10

Root development:1-2 leaf stage
Winter wheatWinter wheat
Veseth et al., 1986
0
2
4
6
80246 2 4 6
Distance from the seed row, in.
Dep
th,
in.
Primary root
First seminal pair
Crown
Rooted soil volume

Root development:4 leaf stage, 1 tiller
0
2
4
6
80246 2 4 6
Distance from the seed row, in.
Dep
th,
in.
Crown
Second seminal pairFirst crown root
First seminal pair
Winter wheatWinter wheat
Veseth et al., 1986

The primarycause oflow, shortterm uptakeof Pfertilizer:
The inability of P to moveto absorbing roots
Pla
nt r
oot
Higher Pconcentration
Lower Pconcentration
Diff
usio
n

Spring wheat rootsat 38 days
• Based on average root density in surface 6”
0.12”P diffusion zone
Root
0.5”Distance between roots
5% of soil volume can contribute P to the plant
5% of soil volume can contribute P to the plant

Spring wheat rootsat 94 days
• Based on average root density in surface 6”
0.13”
P diffusion zone
0.24”Distance between
roots
26% of soil volume can contribute P to the plant
26% of soil volume can contribute P to the plant
Root

Is P near the seed important at higher soil test P levels?
Year – site: 95-1 95-2 96-1 96-2 96-3 95-3 96-4 95-4
T1
+ T
2 til
ler
initi
atio
n,nu
mbe
r/pl
ant
0.0
0.4
0.8
1.2
1.6
2.0
Control
20 lb P2O5/A applied with the seed as 10-34-0
Olsen P, ppm: 6 9 10 13 13 1687
Goos and Johnson, personal communication

Is P near the seed important at higher soil test P levels?
Goos and Johnson, 2001
95-1 95-2 96-1 96-2 96-3 95-3 96-4 95-4
Spr
ing
whe
at y
ield
, bu
/A
0
10
20
30
40
50
60
70 Control
Olsen P, ppm: 6 9 10 13 13 1687
Year – site:
20 lb P2O5/A applied with the seed as 10-34-0

How can Ibe surethere areadequatesuppliesof P?
Photos courtesy of the USDA NRCS

What information does a P soil test provide?
• An index of the amountof plant-available P inthe soil
• This index must becalibrated to yieldresponse:
– Examine responses to Padditions at various soil test levels
– Conduct studies across a wide rangeof soil test levels and environmental conditions

How is a soil test calibrated to yield response?
Gelderman et al., 1995
% relative yield for this site-year:39 bu/A
73 bu/AX 100 = 53.4%
Watertown Site 1995Olsen P = 5.0 ppm
0
10
20
30
40
50
60
70
80
0 20 40 60 80 100
Fertilizer P, lb P2O5/A
Win
ter
whe
at y
ield
, bu
/A

Crop responses at various soil test levels
0 20 40 60 80 10030
45
60
75
90
105
P2O5 rate, lb/A
Spr
ing
whe
at y
ield
, bu
/ASoil test P
(ppm)
4 Hauberg (Irr.)
19 Tullis (Irr.)
12 Riley (Irr.)
5 SIDC (Irr.)
6 Kent (Irr.)
3 Hauberg (dry-Fallow) 4 Hauberg (dry-Stub.)
Henry and Gares, 1993

Average level of yield response is related to soil test P
Soil type Soil test PYield
Increase
(ppm) (%)
Hauberg (dry) 3 93
Hauberg (Irr.) 4 43
Hauberg (S) 4 65
SIDC 5 65
Kent 6 17
Riley 12 27
Tullis 19 5
Henry and Gares, 1993

Average level of yield response is related tosoil test P• As soil test levels
increase, the magnitude of yield response to added P decreases
Mitchell, 1932
90
Yie
ld in
crea
se,
%r = - 0.68
0 10 20 30 40 50 60
Soil test P, ppm
80
70
60
50
40
30
20
10
0-10-20

How is a soil test calibrated to yield response?
120
Gelderman et al., 1996 Olsen P, ppm
Win
ter
whe
at r
elat
ive
yiel
d, %
0 5 10 15 20 25 30 350
20
40
60
80
100
Watertown 1995
Critical level = 16 ppm
Several sitesand years
Several sitesand years

Accuracy in response predictions is limited
Winter wheat study site
Phosphorus Ideal Watertown
rate 4.5 ppm 5.0 ppm
(lb P2O5/A) ------------ (bu/A) -----------
0 33 39
25 32 49
50 34 45
75 31 56
100 32 73
Responsive? No Yes
Gelderman et al., 1996

Examples of Pcalibration data
• Calibration curve indicates which soil test levels tend to limit yields
• Data based on P responses observed across several sites and years
McKenzie et al., 1995
Norwest P, ppm
Rel
ativ
e yi
eld,
%
Prairie soils
one site-year
40
50
60
70
80
90
100
10 20 30 40 50 60 700

Examples of Pcalibration data
PPI, PKMAN Ver. 1.0
30
40
50
60
70
80
90
100
0 5 10 15 20 25 30
Olsen P soil test level, ppm
Rel
ativ
e yi
eld,
%
Winter wheat, Kansas
Spring wheat, Northern Great Plains

What are the best uses for soil test P information?
— Estimating average probabilities of crop response
— Examining changes in levels over time
— Estimating average relative yield response
— Estimating a specific probability of response for a given site and year
— Estimating a specific relative yield response at a given site and year
Good
Fair
Poor

What are somegood strategies for managing P?
Photos courtesy of the USDA NRCS

Approaches to P fertilization
• Sufficiency approach:Apply P to maximizenet returns to fertilizationin the year of application
– Strategy: fertilize onlywhen there is a goodchance that a profitableyield response will be realized
– Soil test levels kept in lower,responsive ranges
– Normally adopted on land leasedfor short periods of time or when cash flow is limited
Rel
ativ
e yi
eld
, %
Soil test P level
Approaches to P fertilization
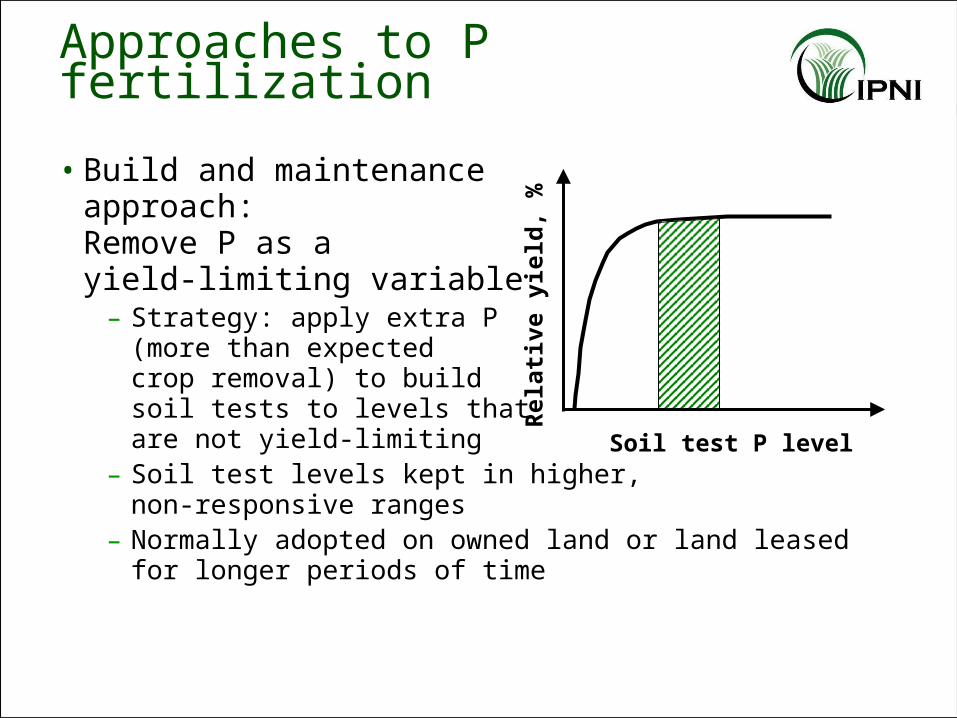
• Build and maintenanceapproach:Remove P as ayield-limiting variable
– Strategy: apply extra P(more than expectedcrop removal) to buildsoil tests to levels thatare not yield-limiting
– Soil test levels kept in higher,non-responsive ranges
– Normally adopted on owned land or land leased for longer periods of time
Rel
ativ
e yi
eld
, %
Soil test P level

Can annual fertilizer applications match higher fertility?
Annual seed-placed P2O5, lb/A
0 10 20 30 4028
30
32
34
36
38
40
42
Whe
at y
ield
, bu
/A
5 ppm
8 ppm
15 ppm
Amount broadcast initially, lb P2O5/A
160
80
0
Olsen soil testat end of 5-yr:
Wager et al., 1986

N rate, lb/AP2O5 rate,lb/A
Winter wheatyield, bu/A
11055
00
2040
0
10
20
30
40
50
60
70
How do N and P interact?
Grant et al., 1985; Grant et al., 1986
64.8
54.8
47.946.7
42.341.7
20.4
17.0
14.6
6 bu:40% increase
5 bu:12% increase
17 bu:35% increase

$0.22$0.27
$0.32$3.00
$4.00$5.000.00
1.002.003.00
4.005.00
6.00
7.00
8.00
9.00
P2O5 price, $/lbWinter wheat
price, $/bu
Net returnto P
fertilization,$/A
How do crop and nutrient prices impact profit?
$8.60
$6.82
$5.60
$6.68
$5.26
$4.28$4.76
$3.69
$2.96
110 lb N/A40 lb P2O5/A
110 lb N/A40 lb P2O5/A
Grant et al., 1985; Grant et al., 1986

Does P fertilizer form influence crop response?
• Research evaluating crop response to MAP, DAP and APP have found all sources give equal crop response
• In addition, no agronomic differences have been found between dry and liquid sources
• The only exception is rock phosphate which provides limited crop response due to low P solubility
Fixen, 1989; Leikam, 1990

How much is saved the first year if P is applied below recommended rates?
If you cut the rate by:
*Fertilizer cost
savings:
(lb P2O5/A) ($/A)
5 1.25
10 2.50
20 5.00
40 10.00
* $0.25/lb P2O5

How much is saved the first year if P is applied below recommended rates?
If you cut the rate by:
*Fertilizer cost
savings:
**Interest on money saved:
(lb P2O5/A) ----------- ($/A) -------------
5 1.25 0.13
10 2.50 0.25
20 5.00 0.50
40 10.00 1.00
* $0.25/lb P2O5
** 10% real interest rate (after inflation rate has been subtracted), compounded annually, 12 month term

How much is saved the first year if P is applied below recommended rates?
If you cut the rate by:
*Fertilizer cost
savings:
**Interest on money saved:
Total savings (fertilizer cost +
interest)
(lb P2O5/A) -------------------- ($/A) ------------------------
5 1.25 0.13 1.38
10 2.50 0.25 2.75
20 5.00 0.50 5.50
40 10.00 1.00 11.00
* $0.25/lb P2O5
** 10% real interest rate (after inflation rate has been subtracted), compounded annually, 12 month term

How much is saved the first year if P is applied below recommended rates?
If you cut the rate by:
*Fertilizer cost
savings:
**Interest on money saved:
Total savings (fertilizer cost +
interest)
***Maximum allowable yield
reduction
(lb P2O5/A) -------------------- ($/A) ------------------------ (bu/A)
5 1.25 0.13 1.38 (0.3)
10 2.50 0.25 2.75 (0.7)
20 5.00 0.50 5.50 (1.4)
40 10.00 1.00 11.00 (2.8)
* $0.25/lb P2O5
** 10% real interest rate (after inflation rate has been subtracted), compounded annually, 12 month term
*** $4.00/bu wheat

What does it cost the first yearif P is applied aboverecommended rates? (one-year lease)
If you over-apply by:
*The lost principle is:
**The lostinterest is:
Total cost (principle +
interest)
***Yield equivalent of
total cost
(lb P2O5/A) -------------------- ($/A) ------------------------ (bu/A)
5 (1.25) (0.13) (1.38) (0.3)
10 (2.50) (0.25) (2.75) (0.7)
20 (5.00) (0.50) (5.50) (1.4)
40 (10.00) (1.00) (11.00) (2.8)
* $0.25/lb P2O5
** 10% real interest rate (after inflation rate has been subtracted), compounded annually, 12 month term
*** $4.00/bu wheat

What happens to fertilizer P after I apply it?
• Solution P:– 10 to 30 % of applied P– Immediately available
Solution P Labile P Non-labile P
• Labile P:– 70 to 90% of applied P– Future supply– Metastable Ca-phosphates

What does it cost the first yearif P is applied aboverecommended rates? (five-year lease)
If you over-apply by:
*The lost interest is:
(lb P2O5/A) ($/A)
5 (0.13)
10 (0.25)
20 (0.50)
40 (1.00)
* 10% real interest rate (after inflation rate has been subtracted), compounded annually

What does it cost the first yearif P is applied aboverecommended rates? (five-year lease)
If you over-apply by:
*The lost interest is:
**The depreciation is:
(lb P2O5/A) ----------- ($/A) -----------
5 (0.13) (0.08)
10 (0.25) (0.15)
20 (0.50) (0.30)
40 (1.00) (0.60)
* 10% real interest rate (after inflation rate has been subtracted), compounded annually
** 30% of applied P not recovered after five years (30% depreciable base with five-year economic life, straight line depreciation, $0.25/lb P2O5)

What does it cost the first yearif P is applied aboverecommended rates? (five-year lease)
If you over-apply by:
*The lost interest is:
**The depreciation is:
Total cost: (interest plus depreciation)
(lb P2O5/A) ---------------------- ($/A) ---------------------------
5 (0.13) (0.08) (0.21)
10 (0.25) (0.15) (0.40)
20 (0.50) (0.30) (0.80)
40 (1.00) (0.60) (1.60)
* 10% real interest rate (after inflation rate has been subtracted), compounded annually
** 30% of applied P not recovered after five years (30% depreciable base with five-year economic life, straight line depreciation, $0.25/lb P2O5)

What does it cost the first yearif P is applied aboverecommended rates? (five-year lease)
If you over-apply by:
*The lost interest is:
**The depreciation is:
Total cost: (interest plus depreciation)
***Yield equivalent of total loss
(lb P2O5/A) ---------------------- ($/A) --------------------------- (bu/A)
5 (0.13) (0.08) (0.21) (0.05)
10 (0.25) (0.15) (0.40) (0.1)
20 (0.50) (0.30) (0.80) (0.2)
40 (1.00) (0.60) (1.60) (0.4)
* 10% real interest rate (after inflation rate has been subtracted), compounded annually
** 30% of applied P not recovered after five years (30% depreciable base with five-year economic life, straight line depreciation, $0.25/lb P2O5)
*** $4.00/bu wheat

Over-applying vs. under-applying (five-year lease)
If you over-apply by:
Yield equivalent of
total loss:If you under-
apply by:
Maximum allowable yield
reduction
(lb P2O5/A) (bu/A) (lb P2O5/A) (bu/A)
5 (0.05) 5 (0.3)
10 (0.1) 10 (0.7)
20 (0.2) 20 (1.4)
40 (0.4) 40 (2.8)
* 10% real interest rate (after inflation rate has been subtracted), compounded annually
** 30% of applied P not recovered after five years (30% depreciable base with five-year economic life, straight line depreciation, $0.25/lb P2O5)
*** $4.00/bu wheat

Summary
• P nutrition is critical to reaching the attainable yield potential of wheat
• Early in the season when the wheat plant is “deciding” to initiate tillers, P must be positionally available
• P deficiencies earlier in the season are more detrimental than those occurring later
• P nutrition must be part of a management strategy that considers the importance of other nutrients
• Land ownership/rental and cash flow have a large impact on the approaches taken to managing soil fertility

For more information, contact:
International Plant Nutrition Institute (IPNI) 655 Engineering Drive, Suite 110Norcross, GA 30092-2604Phone: 770-447-0335; Fax: 770-448-0439www.ipni.net
Reference 06128