phosphorus recovery from wastewater and sludge: concept
TRANSCRIPT

Phosphorus recovery from wastewater and sludge: Concept for different regional conditions
vorgelegt von M.Sc. Kuangxin Zhou
geb. in Jiangsu, Volksrepublik China
von der Fakultät VI – Planen Bauen Umwelt der Technischen Universität Berlin
zur Erlangung des akademischen Grades
Doktor der Ingenieurwissenschaften - Dr.-Ing. -
genehmigte Dissertation
Promotionsausschuss:
Vorsitzender: Prof. Dr.-Ing. Reinhard Hinkelmann, Technische Universität Berlin
Gutachter: Prof. Dr.-Ing. Matthias Barjenbruch, Technische Universität Berlin
Gutachter: Prof. Dr.-Ing. habil. Christian Schaum, Universität der Bundeswehr München
Tag der wissenschaftlichen Aussprache: 12. September 2017
Berlin 2017

Vorwort
III
Vorwort Die Ressourcen der Erde werden heute genutzt wie in keinem Zeitalter zuvor, obwohl sie
oftmals nur begrenzt zur Verfügung stehen. Phosphor ist weltweit nur begrenzt vorhanden,
aber essentiell für das Pflanzwachstum und damit für die Sicherung der Ernährung.
Über menschliche Ausscheidungen gelangt der wertvolle Stoff Phosphor ins Abwasser und
landet schließlich im Klärschlamm und Gewässer. Vor diesem Hintergrund werden Verfahren
zur Rückgewinnung von Phosphor aus häuslichem Abwasser seit mindestens 10 Jahren
intensiv beforscht.
Die vorliegende Arbeit bietet eine systematische Übersicht der Phosphorrückgewinnung und
Recyclingrouten. Die verschiedenen Konzepte und Fallstudien aus der Praxis für
unterschiedliche regionale Bedingungen könnten eine Inspiration für die zukünftige
Phosphorrückgewinnung geben und damit Möglichkeiten zur nachhaltigen Entwicklung in der
Abwasserbehandlung aufzeigen.
Die vorliegende Arbeit entstand während meiner Tätigkeit als Doktorand am Fachgebiet
Siedlungswasserwirtschaft der Technischen Universität Berlin und Kompetenzzentrum
Wasser Berlin gGmbH. Die Finanzierung meiner Promotion läuft über das Stipendium von
China Scholarship Council (CSC). Die Arbeit basiert zu einem Teil auf den Ergebnissen des
Projekts „Nachhaltiges Klärschlammmanagement zur Förderung des Phosphorrecyclings
und der Energieeffizienz“ (P-REX), finanziert durch EU’s Seventh Framework Programme for
Research (FP7), Grant Agreement #308645.
Zuerst möchte ich meinem Betreuer, Herrn Prof. Dr.-Ing. Matthias Barjenbruch, ganz herzlich
für das Vertrauen, die gute Zusammenarbeit und die Unterstützung meiner Arbeit in den
vergangenen Jahren danken. Sein professionelles Vorbild im Bereich der
Siedlungswasserwirtschaft hat diese Arbeit geprägt, und dafür bin ich ihm sehr dankbar.
Weiterhin möchte ich meinem betrieblichen Betreuer, Herrn Dr. Christian Kabbe, vom
Kompetenzzentrum Wasser Berlin gGmbH (KWB) herzlich danken. Er gab mir die
Möglichkeit, am KWB bei unterschiedlichen spannenden Projekten der
Phosphorrückgewinnung und Schlammbehandlung mitzuwirken und ließ mir zudem die
notwendigen Freiräume zur Erstellung dieser Dissertation. Er hat auch viele wertvolle
Anregungen für die schriftliche Ausarbeitung dieser Dissertation gegeben.
Ein besonderer Dank gilt Prof. Dr.-Ing. habil. Christian Schaum für die Übernahme des
Gutachtens meiner Dissertation und Prof. Dr.-Ing. Reinhard Hinkelmann für die Übernahme
des Vorsitzes des Prüfungsausschusses.
Die Arbeit zur Ökobilanz baut auf den umfangreichen Vorarbeiten von Dr.-Ing. Christian
Remy auf, dem ich für seine Einführung in die Ökobilanz-Methodik und den Umgang mit der
LCA Software herzlich danke. Ich danke Herr Dr. Ulf Miehe für die Unterstützung des
methodischen Vorgehens bei den Laborversuchen und Praxistests. Erwähnt werden soll
auch Johan Stüber, der mich in das Thema der Schlammentwässerung mit Green Polymer in
verschiedenen Kläranlagen eingeführt hat.
Den vielen Kolleginnen und Kollegen am KWB danke ich ganz herzlich für die sehr
angenehme und offene Atmosphäre und den guten Zusammenhalt, die meine Arbeit in den

Vorwort
IV
vergangenen Jahren so angenehm und spannend gemacht haben, speziell Boris Lesjean,
Fabian Kraus, Rabea-Luisa Schubert und Wolfgang Seis.
Des Weiteren gilt mein Dank den Veolia Kollegen Goulven Inial, Christophe MÊLÉ, Hervé
PAILLARD für die Unterstützung der Fallstudien in China. Ich danke auch für die
Unterstützung durch Mike Dragon und Bernd Modler der Kläranlage Schönebeck; Karl-Heinz
Schröder und Maximilian Menke der Kläranlage Putzhagen; Alex Veltman von der
Kläranlage Amsterdam West. Mein Dank für die sprachliche Verbesserung dieser
Dissertation geht an meinen Deutschlehrer, Uwe Schiffke, an der Hochschule Merseburg.
Am Schluss möchte ich besonders meiner Familie und meiner Gastfamilie in Deutschland
(Familie GORKE) danken, die mich die ganzen Jahre so wunderbar unterstützt und auf
meinen Weg gebrachte haben und ohne die diese Arbeit nicht möglich gewesen wäre.
Berlin, im August 2017
Kuangxin Zhou

Zusammenfassung
V
Zusammenfassung Phosphor ist eine essentielle, aber begrenzte Ressource. Technologien zur Phosphorrückgewinnung
wurden in den vergangenen Jahren weiter entwickelt und zum Teil großtechnisch umgesetzt, wodurch
kommunales Abwasser und Klärschlamm als eine vielversprechende sekundäre Phosphorquelle
angesehen werden kann. Deutschland ist bei Phosphor nahezu vollständig vom Import abhängig. Die
neue, 2017 beschlossene Klärschlammverordnung verpflichtet zur Rückgewinnung von Phosphor aus
Klärschlamm großer Anlagen nach einer Übergangsfrist. China ist der größte Phosphatproduzent
(Bergbau und Verarbeitung) und Konsument weltweit mit großen mineralischen Phosphorvorkommen.
Verschiedene Rahmenbedingungen erfordern unterschiedliche Ansätze zur Phosphorrückgewinnung.
Diese Arbeit konzentriert sich auf unterschiedliche regionale Optionen zum Phosphorrecycling in der
Landwirtschaft und Rückgewinnung aus Klärschlamm als Struvit und Düngemittelindustrieabwasser.
Die landwirtschaftliche Nutzung von Klärschlamm ist in mehreren Ländern gesetzlich eingeschränkt
oder sogar verboten. Zum Beispiel verlangt in Deutschland die neue Regelung der
Düngemittelverordnung, dass ab dem Jahr 2017 synthetische Polymere bei der Herstellung von
Düngemitteln nur noch eingesetzt werden dürfen, soweit diese sich mindestens um 20 % innerhalb
von zwei Jahren abbauen. Vor diesem Hintergrund wurde in dieser Studie die großtechnische
Anwendbarkeit der stärkebasierten biologisch abbaubaren Polymere in der Schlammeindickung und
Entwässerung untersucht. Ergebnisse zeigen, dass die Substitution von 20-30% des Polyacrylamid-
basierten Polymers eine ähnliche Trockensubstanz bei der Schlammentwässerung erreicht.
Die Phosphorrückgewinnung durch Struvit-Fällung ist bereits sowohl technisch als auch wirtschaftlich
machbar. Dies belegen die mehr als 40 großtechnischen Anlagen weltweit. Bei der Auslegung und
Umsetzung dieser Verfahren sollten auch die Umweltauswirkungen berücksichtigt werden. Eine
Ökobilanz wurde in dieser Studie durchgeführt. Sie vergleicht zwei Generationen des AirPrex®
Reaktors auf der Kläranlage Waßmannsdorf und der Kläranlage Amsterdam West. Die Ergebnisse
zeigen, dass der neue Reaktor energieeffizienter ist, weniger Treibhausgasemissionen generiert und
ein geringeres Eutrophierungspotential hat. Diese Verbesserungen resultieren vor allem aus
optimierter Struvitfällung und –ernte und zeigen, dass sich die Technologie vor allem im Betrieb und
nicht nur im Labor oder Technikum weiterentwickeln lässt.
Die Phosphorrückgewinnung aus dem kommunalen Abwasser in China ist eingeschränkt durch
niedrige Phosphatkonzentration im kommunalen Klärschlamm und die unsachgemäße
Schlammentsorgung. Die Rückgewinnung aus industriellen Abwässern mit höherer
Phosphatkonzentration zeigt ein höheres Potential aufgrund eines leichten Marktzugangs und der
Vorteile für den Betreiber. Deshalb wurde das Potential der Phosphorrückgewinnung in
Düngermittelindustrieabwasser im Rahmen einer Machbarkeitsstudie untersucht. Die Ergebnisse des
Laborversuchs zeigen, dass mit einem neuen Konzept durch Mischung von Phosphat-Abwasser und
Ammonium-Abwasser aus Düngemittelproduktionsanlagen, etwa 95% Orthophosphat und 30%
Ammonium-Stickstoff entfernet werden können. Die wirtschaftliche Machbarkeit der
Phosphorrückgewinnung als Struvit an dieser Anlage ist ebenfalls bewiesen.
Obwohl die technische Machbarkeit der Phosphorrückgewinnung bereits gezeigt werden konnte, sollte
die Gesetzgebung und die nationale Politik mit der technologischen Entwicklung Schritt halten. Es
sollten mehr Anstrengungen unternommen werden, um nicht nur ein einziges Element
rückzugewinnen, sondern sowohl die Ressourcen- als auch die Energieeffizienz in Kläranlagen zu
verbessern.


Abstract
VII
Abstract Phosphorus (P) is an essential but limited resource. In recent years, technologies for phosphorus
recovery have been developed further and some of them have been implemented on a large scale,
making municipal wastewater and sludge promising secondary phosphorus sources. Germany is
almost completely dependent on phosphorus imports. The newly adopted sewage sludge ordinance in
2017 requires, after a transitional period, the recovery of phosphorus from sewage sludge in large
WWTP plants. China has abundant phosphate rock deposits and is the world's largest producer
(mining and processing) and consumer of phosphate rock. Different frameworks require different
approaches to the recovery of phosphorus. This paper focuses on different regional options for
phosphorus recycling in agriculture and recovery from sewage sludge via struvite and wastewater from
the fertilizer industry.
The agricultural use of sewage sludge is restricted by legislation or even prohibited in several
countries. In Germany, for example, a new and more stringent regulation of German fertilizer
ordinance, effective from 2017, requires the degradation of 20% of synthetic additives such as
polymeric substances within two years. Against this background, the general feasibility of applying
starch-based biodegradable polymers in full-scale thickening and centrifugation was demonstrated in
this study. Results show that a substitution of 20-30% of the polyacrylamide-based polymer was
capable of achieving similar total solids of the dewatered sludge.
P-recovery through struvite is already both technically and economically feasible. This has been
proved by more than 40 large-scale plants worldwide. However, when designing and implement these
P-recovery technologies, the environmental effects need to be considered. Therefore, a comparative
environmental life cycle assessment of phosphorus recovery with different generations of the Airprex®
reactors at WWTP Wassmannsdorf and Amsterdam West was carried out in this study. Results show
that the new reactor is more energy efficient and has a lower greenhouse gas (GHG) footprint and
eutrophication potential. These improvements are mainly due to optimized struvite precipitation and
harvesting, and show that technology can be developed further, especially in plant operation and not
only in the laboratory or pilot plant.
P-recovery from municipal wastewater in China is limited to the low P concentration in sludge and
improper sludge disposal. The recovery from industrial wastewater with a high concentration of
phosphorus shows higher potential due to easier market access and benefits to its operators. For this
reason, the potential of P-recovery from fertilizer industry wastewater was investigated in this study.
The results of the lab experiment show that about 95% orthophosphate and 30% ammonium nitrogen
can be recovered using a new treatment where of phosphate and ammonia wastewater from fertilizer
plants are mixed. The economic feasibility of phosphorus recovery via struvite has also been proved at
this plant.
Although the full-scale P-recovery techniques have proved to be technologically feasible, legislation
and national policies need to keep up with the development of technology. More efforts are required
taken to recover not only one single element, but also to improve both the energy and resource
efficiency in WWTPs.


IX
We may be able to substitute nuclear power for coal power, and plastics for wood, and yeast
for meat, and friendliness for isolation—but for phosphorus there is neither substitution nor
replacement.
Isaac Asimov, 1959

Contents
XI
Contents
Zusammenfassung ................................................................................................................... V
Abstract ................................................................................................................................. VII
Contents ................................................................................................................................... XI
List of Tables ......................................................................................................................... XV
List of Figures .................................................................................................................... XVII
List of Abbreviations ............................................................................................................ XX
Chapter 1: Current state and full-scale applications of phosphorus recovery and
recycling from wastewater in different regions ..................................................................... 1
1.1 Introduction and objective of this thesis ........................................................................... 2
1.2 Global phosphorus security .............................................................................................. 6
1.3 Routes and potentials of phosphorus recovery from municipal wastewater .................... 9
1.3.1 Potentials of P-recycling through bio-solids valorization in agriculture ................. 11
1.3.2 Potentials of P-recovery from sludge water ............................................................. 12
1.3.3 Potentials of P-recovery from sludge solids ............................................................ 15
1.3.4 Potentials of P-recovery from sewage sludge ash .................................................... 16
1.3.5 Comparison of different P-recovery methods with Life Cycle Assessment ............ 17
1.3.6 Combined energy and nutrient recovery .................................................................. 18
1.4 Implementation of phosphorus recovery ........................................................................ 20
1.4.1 Full scale techniques and global application ........................................................... 20
1.4.2 Case studies for Europe-wide implementation ........................................................ 21
1.4.3 Case studies for implementation in North America ................................................. 24
1.4.4 Case studies for implementation in Asia ................................................................. 25
1.5 Conclusion ...................................................................................................................... 27
Chapter 2: Full-scale performance of selected starch-based biodegradable polymers in
sludge dewatering and recommendations for application .................................................. 28
2.1 Sludge valorization in agriculture ................................................................................... 29
2.2 Materials and methods .................................................................................................... 30
2.2.1 Study sites and sampling locations .......................................................................... 30
2.2.2 Testing polymers ...................................................................................................... 30

Contents
XII
2.2.3 Jar Testing to determine optimal polymer dose (OPD) ........................................... 31
2.2.4 Drip-off test .............................................................................................................. 32
2.2.5 Pilot-scale test .......................................................................................................... 32
2.2.6 Full-scale tests .......................................................................................................... 33
2.3 Results and discussion .................................................................................................... 35
2.3.1 Lab-scale trials at WWTP Putzhagen ...................................................................... 35
2.3.2 Pilot-scale trials at WWTP Steinhof ........................................................................ 37
2.3.3 Full-scale trials ......................................................................................................... 39
2.4 Conclusion ...................................................................................................................... 43
Chapter 3: Comparative Environmental Life Cycle Assessment of phosphorus recovery
with different generations of the Airprex® reactors at WWTP Waßmannsdorf and
Amsterdam West .................................................................................................................... 44
3.1 Phosphorus recovery with Airprex®
Process .................................................................. 45
3.2 P mass balance and AirPrex®
reactor in WWTP Amsterdam West and Wassmannsdorf
.............................................................................................................................................. 47
3.2.1 AirPrex process in WWTP Wassmannsdorf ............................................................ 47
3.2.2 Airprex process in WWTP Amsterdam West .......................................................... 48
3.2.3 Comparison of Airprex system in WWTP Wassmannsdorf and Amsterdam West 50
3.3 Methodology and system details .................................................................................... 53
3.3.1 Methodology of Life Cycle Assessment .................................................................. 53
3.3.2 Goal and scope definition ........................................................................................ 53
3.3.3 System boundary and scope definition .................................................................... 54
3.3.4 Life Cycle Inventory ................................................................................................ 56
3.4 Life Cycle Impact Assessment ....................................................................................... 61
3.5 Conclusion ...................................................................................................................... 66
Chapter 4: Phosphorus recovery from municipal and fertilizer wastewater: China's
potential and perspective ....................................................................................................... 67
4.1 The importance of phosphorus recovery in China .......................................................... 68
4.2 Status of the municipal wastewater infrastructure in China ........................................... 69
4.2.1 The development of urban sewage treatment .......................................................... 69
4.2.2 Wastewater treatment process in China ................................................................... 70

Contents
XIII
4.2.3 Phosphorus removal in WWTPs .............................................................................. 71
4.2.4 Sewage sludge treatment in China ........................................................................... 71
4.3 Materials and methods .................................................................................................... 72
4.4 Potential and options for phosphorus recovery in China ................................................ 73
4.5 Results and discussion .................................................................................................... 75
4.5.1 Option 1: Recovery from digested sludge ............................................................... 75
4.5.2 Option 2: Recovery from sludge water .................................................................... 76
4.5.3 Option 3: Recovery from sludge water with sludge extraction ............................... 77
4.5.4 Option 4: Recovery from sewage sludge ash ........................................................... 77
4.5.5 Option 5: Recovery from fertilizer industry wastewater ......................................... 78
4.6 Summary and perspective ............................................................................................... 80
4.7 Conclusion ...................................................................................................................... 81
Chapter 5: Phosphorus recovery from Chinese fertilizer industry wastewater ............... 82
5.1 Phosphate fertilizer industry ........................................................................................... 83
5.2 Fertilizer wastewater characterization and treatment ..................................................... 86
5.2.1 Phosphate fertilizer wastewater ............................................................................... 86
5.2.2 Nitrogenous fertilizer wastewater ............................................................................ 87
5.2.3 Wastewater influent and effluent parameters at plant A .......................................... 87
5.2.4 Current wastewater treatment process in plant A .................................................... 89
5.2.5 New concept of wastewater treatment in plant A .................................................... 91
5.3 Materials and methods .................................................................................................... 92
5.3.1 Chemical equilibrium modelling with MINEQL+ .................................................. 92
5.3.2 Laboratory jar test with synthetic and real wastewater ............................................ 92
5.4 Results and discussion .................................................................................................... 96
5.4.1 MINEQL+ Results ................................................................................................... 96
5.4.2 Jar-test results with synthetic wastewater ................................................................ 99
5.4.3 Jar-test results with wastewater from the fertilizer Industry .................................. 104
5.5 Dimensioning and design of a pilot plant ..................................................................... 110
5.5.1 Process Description ................................................................................................ 110
5.5.2 Operating conditions .............................................................................................. 111

Contents
XIV
5.5.3 Cost estimation for the pilot plant .......................................................................... 112
5.6 Economic feasibility study for the new concept of wastewater treatment ................... 115
5.6.1 Recovered product ................................................................................................. 115
5.6.2 Fertilizer industry analysis in China ...................................................................... 115
5.6.3 Commercial feasibility ........................................................................................... 116
5.7 Conclusion .................................................................................................................... 123
Chapter 6: General discussion and outlook ....................................................................... 124
Reference ............................................................................................................................... 129
List of Tables
XV
List of Tables Table 1: Global phosphorus production in 2015 and 2016 and current reserves in thousand
metric tons (USGS, 2017) ........................................................................................................ 7
Table 2: Overview of phosphorus recovery facilities operating or under construction in
Europe (Kabbe & Kraus, 2017a) (modified) ........................................................................... 22
Table 3: Overview of phosphorus recovery facilities operating or under construction in North
America (Kabbe & Kraus, 2017a) (modified) .......................................................................... 24
Table 4: Overview of phosphorus recovery facilities operating in Asia (Kabbe & Kraus, 2017a;
Ohtake & Okano, 2015) (modified) ......................................................................................... 25
Table 5: Tested sludge types and characteristics .................................................................. 30
Table 6: List of tested polymers ............................................................................................. 31
Table 7: Characteristics of digested excess sludge WWTP Steinhof for pilot trials and
operation of pilot-scale centrifuge .......................................................................................... 38
Table 8: Operational parameters of sludge and centrifuge Operation data at WWTP Steinhof
............................................................................................................................................... 40
Table 9: List of full-scale AirPrex® technology (CNP, 2017b) ................................................. 46
Table 10: Comparison of AirPrex® Systems in WWTP Wassmannsdorf and Amsterdam West
(Lengemann, 2017; Veltman, 2016; Wendl, 2013) ................................................................. 51
Table 11: Site Specific Data for reference system at WWTP Wassmannsdorf 2016
(Lengemann, 2017) ................................................................................................................ 55
Table 12: Reference Data for Digester and CHP (Remy, 2012) ............................................ 57
Table 13: Specific Data for AirPrex® Scenarios (Lengemann, 2017; Veltman, 2016) ............ 58
Table 14: Specific Data for Decanter (Jossa, 2014; Veltman, 2016) ..................................... 58
Table 15: Reference Data for simplified WWTP (Remy, 2012) .............................................. 59
Table 16: Reference Data for Return Load (Lengemann, 2017) ............................................ 59
Table 17: Reference Data for Mono Incineration (Remy et al., 2015) .................................... 59
Table 18: Anaerobic sludge digestion projects in China ........................................................ 75
Table 19: Parameters of sludge water in WWTP A in China (mean value) ............................ 76
Table 20: Analysis of selected parameters of composite sludge feed to incinerator and
sludge ash in the Sludge Treatment Facility in Hong Kong, China ........................................ 78
Table 21: Different streams and compositions of wastewater in a fertilizer plant in China a .. 79
Table 22: Design parameters of wastewater quality at plant A .............................................. 88
Table 23: Composition of process water in Chemical Plant A ................................................ 88
Table 24: Discharge standard of water pollutants for phosphate fertilizer industry ................ 89
Table 25: Different molar ratio for the MINEQL+ calculation .................................................. 92
Table 26: Components and concentration of synthetic wastewater ....................................... 93
Table 27: Used chemicals for the jar test experiments .......................................................... 93
Table 28: Characteristics of phosphate and ammonia wastewater ...................................... 105
Table 29: Characteristics of phosphate wastewater, ammonia wastewater and P-
concentrated process water ................................................................................................. 107
Table 30: Design parameters of Struvia™ pilot plant (Stemann et al., 2014) ...................... 111
Table 31: Summary of construction cost for the pilot plant .................................................. 113

List of Tables
XVI
Table 32: Summary of operation and maintenance cost for the pilot plant .......................... 114
Table 33: Summary of capital expenditure with StruviaTM process for the full scale application
............................................................................................................................................. 117
Table 34: Summary of operation cost and benefit for the full scale application ................... 119
Table 35: Different business scenarios for the application of the new technology ............... 121
List of Figures
XVII
List of Figures Figure 1: The three principle routes for P recovery and recycling from the wastewater stream
as a nutrient (Kabbe, 2013b) ................................................................................................... 3
Figure 2: Overview of the research with different options for P recovery (Red box indicates
experimental work, Green box indicates modelling work and Orange box indicates case
research work) .......................................................................................................................... 4
Figure 3: Trends in phosphorus consumption in different regions and the top 3 consumption
countries from 1962 to 2014 (IFA, 2017) .................................................................................. 6
Figure 4: Hot spots for P recovery in WWTP (Kabbe et al., 2015). 1. Direct agricultural
utilization of dewatered sludge; 2a. Undrained sludge after anaerobic digestion; 2b. Sludge
liquor after dewatering; 3. Ash after incineration ...................................................................... 9
Figure 5: Most visible phosphate recovery technologies applied in Europe with indication of
their state of maturity and product (Kabbe & Kraus, 2017b) .................................................. 10
Figure 6: Disposal and recycling routes for sewage sludge in European countries (BAFU,
2013; Destatis, 2016; EurEau, 2016; Eurostat, 2016) ............................................................ 11
Figure 7: P-recovery from sludge water with combination of PEARL® and WASSTRIP®
Process (Ostara, 2017b) ........................................................................................................ 13
Figure 8: P-recovery from sludge with AirPrex® process (P-REX-Factscheets, 2015) ........... 14
Figure 9: Process flow of ExtraPhos® process (Budenheim, 2017) ....................................... 15
Figure 10: Process flow of Ecophos® process (P-REX-Factscheets, 2015) ........................... 16
Figure 11: Net energy demand for different P recovery pathways (Remy et al., 2015) ......... 18
Figure 12: Combined energy and nutrient recovery (Kabbe & Kraus, 2017b) ....................... 19
Figure 13: Distribution of plants with P-recovery process from wastewater worldwide (Kabbe,
2017) ...................................................................................................................................... 20
Figure 14: Sludge floccules with different polymer doses ...................................................... 32
Figure 15: Jar Test results with different blends of starch-based polymer and original polymer
at WWTP Putzhagen .............................................................................................................. 35
Figure 16: Results of Drip-off test at WWTP Putzhagen ........................................................ 36
Figure 17: Substitution potential according to polymer blend and sludge type ...................... 36
Figure 18: Results of pilot-scale trials digested excess sludge .............................................. 39
Figure 19: Results of full-scale trials digested mixed sludge at WWTP Steinhof ................... 40
Figure 20: Results of full-scale trials with excess sludge at WWTP Schönebeck .................. 41
Figure 21: Results of full-scale trials with excess sludge at WWTP Putzhagen ..................... 42
Figure 22: Principe of AirPrex® technology ©CNP (Forstner, 2015) ....................................... 45
Figure 23: Process scheme and P mass balance of WWTP Wassmannsdorf (modified)
(Forstner, 2015) ...................................................................................................................... 47
Figure 24: AirPrex® reactor at WWTP Wassmannsdorf (Wendl, 2013) .................................. 48
Figure 25: Process scheme and P mass balance of WWTP Amsterdam West (modified)
(Forstner, 2015) ...................................................................................................................... 49
Figure 26: The Airprex® reactor at WWTP Amsterdam west (Veltman, 2016) ....................... 50
Figure 27: System Boundary of the LCA (Remy et al., 2015) ................................................ 54
List of Figures
XVIII
Figure 28: Reference system for Life Cycle Inventory analysis (Jossa, 2014; Remy et al.,
2015) ...................................................................................................................................... 56
Figure 29: Total Cumulative Energy Demand of AirPrex® system with 1-reactor and 3-reactor
configuration ........................................................................................................................... 61
Figure 30: Total Cumulative Energy Demand for FU per kg P production ............................. 62
Figure 31: Global Warming Potential ..................................................................................... 63
Figure 32: Freshwater Eutrophication Potential ..................................................................... 64
Figure 33: Marine Eutrophication Potential ............................................................................ 65
Figure 34: Development of urban sewage treatment from 2005 to 2013 in China (MOHURD,
2016) ...................................................................................................................................... 69
Figure 35: Variety of different processes of municipal WWTPs in China (MEP, 2014) .......... 70
Figure 36: Phosphate fertilizer production in thousand tons P2O5 in China and the rest of
world from 1961 to 2014 (IFA, 2017) ...................................................................................... 83
Figure 37: Process diagram for wet process dihydrate phosphoric acid plant (Cheremisinoff &
Rosenfeld, 2010) .................................................................................................................... 86
Figure 38: Process diagram for ammonium nitrate and urea manufacturing (Cheremisinoff &
Rosenfeld, 2010) .................................................................................................................... 87
Figure 39: The current wastewater treatment scheme of plant A ........................................... 90
Figure 40: The new concept for treatment of wastewater in plant A ...................................... 91
Figure 41: Software interface of MINEQL+ version 4.6 .......................................................... 92
Figure 42: Jar test experiments to determine optimum operating conditions ......................... 94
Figure 43: Calcium speciation calculation with MINEQL+ software at pH value 5, Ca:F ratio
1:2. ......................................................................................................................................... 96
Figure 44: Modelling results of distribution of added calcium in solution under different
reaction conditions ................................................................................................................. 97
Figure 45: Fluoride speciation calculation with MINEQL+ software at pH value 5, Ca:F ratio
1:2. ......................................................................................................................................... 98
Figure 46: Modelling results of removal of fluoride in solution under different reaction
conditions ............................................................................................................................... 98
Figure 47: The influence of pH and reaction time on the fluoride removal with molar ratio
([Ca2+]:[F-]) of 0.5. ................................................................................................................... 99
Figure 48: Experimental results of fluoride removal with different calcium doses ................ 100
Figure 49: Experimental results of orthophosphate removal with different calcium doses ... 101
Figure 50: Experimental results of orthophosphate removal efficiency with different pH values
............................................................................................................................................. 102
Figure 51: Orthophosphate removal in the first and second stage of reaction ..................... 103
Figure 52: Ammonium nitrogen removal in the second stage of the reaction ...................... 103
Figure 53: The removed molar concentration of orthophosphate, ammonium nitrogen and
magnesium in the second stage of reaction ......................................................................... 104
Figure 54: Effect of pH value on the precipitation of ammonium nitrogen and phosphate ... 105
Figure 55: Effect of Mg/P molar ratio on precipitation of phosphate ..................................... 106
List of Figures
XIX
Figure 56: Efficiency of reaction time on precipitation of ammonium nitrogen and phosphate
............................................................................................................................................. 106
Figure 57: Results of orthophosphate and ammonium nitrogen removal with different mixing
ratio of phosphate wastewater and ammonia wastewater (P wastewater: N wastewater) ... 108
Figure 58: Flow of designed pilot system ............................................................................. 110
Figure 59: Simplified scheme of the Struvia™ reactor (source: Veolia) ............................... 111
Figure 60: Top ten phosphate fertilizer producers accounted for about 50% of the total output
in 2012 (Xiu, 2013) ............................................................................................................... 116
Figure 61: The current wastewater treatment process (1) and the new process with struvite
recovery (2) .......................................................................................................................... 118
Figure 62: Possibilities of phosphorus recovery from sewage sludge (modified) (Kabbe, 2015;
Schaum, 2016) ..................................................................................................................... 125

List of Abbreviations
XX
List of Abbreviations
AAO Anaerobic-Anoxic-Oxic
AD Anaerobic Sludge Digestion
AMS Amsterdam West
AOAO Anoxic-Aerobic-Anoxic-Aerobic
Bio-P Biological Phosphorus Elimination
CED Cumulative Energy Demand
CHP Combined Heat and Power
COD Chemical Oxygen Demand
DAP Diammonium Phosphate
DM Dry Matter
DS Dry Solids
EBPR Enhanced Biological Phosphorus Removal
FEP Freshwater Eutrophication Potential
GHG Greenhouse Gas Footprint
GWP Global Warming Potential
HAP Hydroxyapatite
HRT Hydraulic Retention Time
LCA Life Cycle Assessment
LCI Life Cycle Inventory
LCIA Life Cycle Impact Assessment
LOI Loss on Ignition
MAP Monoammonium Phosphate
MEP Marine Eutrophication Potential
Mg Magnesium
NPK Nitrogen (N), Phosphorus (P) and Potassium (K)
OPD Optimal Polymer Doses
OSP Ordinary Superphosphate
P Phosphorus
PAM Polyacrylamide

List of Abbreviations
XXI
SBR Sequencing Batch Reactor
SRT Sludge Retention Time
SS Suspended Solids
SSA Sewage Sludge Ash
TN Total Nitrogen
TOC Total Organic Carbon
TP Total Phosphorus
TS Total Solids
TSP Triple Superphosphate
TSS Total Suspended Solids
WMD Wassmannsdorf
WWTP Wastewater Treatment Plant

Chapter 1: Current state and full-scale applications of phosphorus recovery and recycling from wastewater in different regions
1
Chapter 1: Current state and full-scale applications of
phosphorus recovery and recycling from wastewater in
different regions
Graphical abstract
Highlights
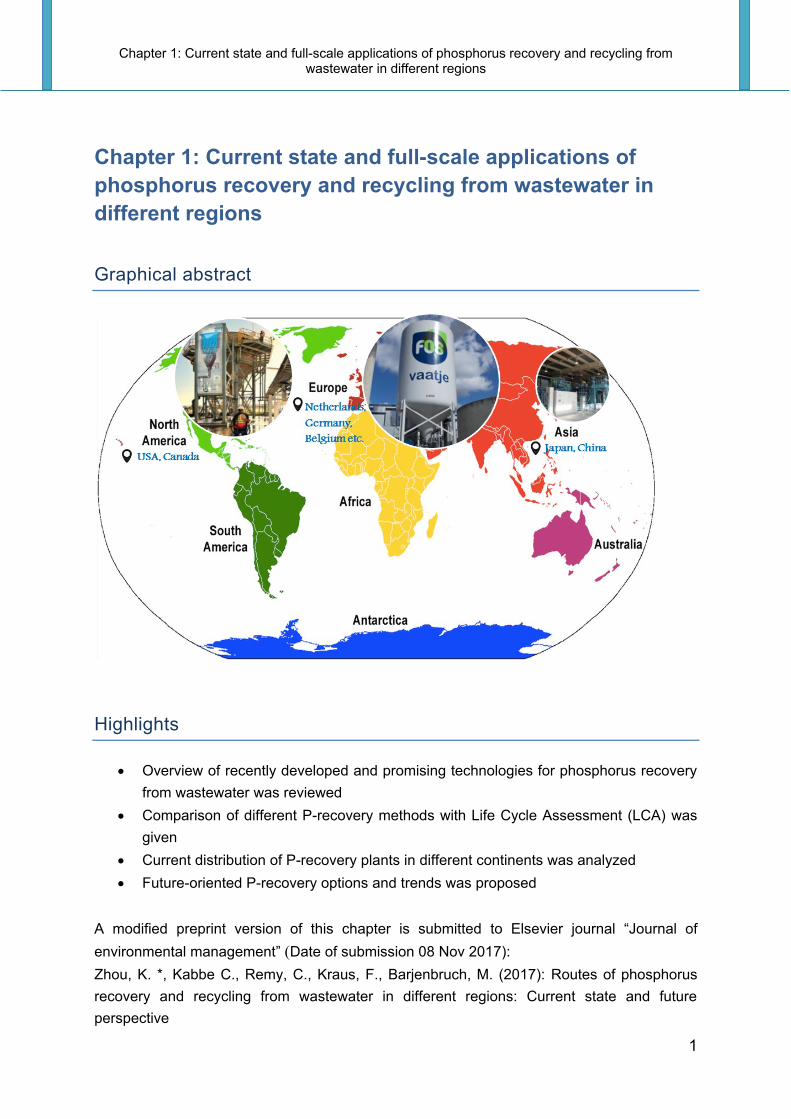
Overview of recently developed and promising technologies for phosphorus recovery
from wastewater was reviewed
Comparison of different P-recovery methods with Life Cycle Assessment (LCA) was
given
Current distribution of P-recovery plants in different continents was analyzed
Future-oriented P-recovery options and trends was proposed
A modified preprint version of this chapter is submitted to Elsevier journal “Journal of
environmental management” (Date of submission 08 Nov 2017):
Zhou, K. *, Kabbe C., Remy, C., Kraus, F., Barjenbruch, M. (2017): Routes of phosphorus
recovery and recycling from wastewater in different regions: Current state and future
perspective

Chapter 1: Current state and full-scale applications of phosphorus recovery and recycling from wastewater in different regions
2
1.1 Introduction and objective of this thesis
Phosphorus (P) is a limited and non-replaceable resource for all life processes (Asimov,
1959). In the living cell phosphorus plays a decisive role in the cell membrane, the storage
and retrieval system for genetic information, DNA and RNA, as well as in the energy system,
ATP. Furthermore, in vertebrate animals phosphorus is an important component in sinew,
cartilage, bone, and enamel (Butusov & Jernelöv, 2013). Phosphorus (P) is also essential for
crop growth and food production, and most of the phosphorus applied to agricultural land
comes from phosphate rock, which is a non-renewable resource.
The largest and least expensive source of phosphorus is obtained by mining and
concentrating phosphate rock from the numerous phosphate deposits of the world. The
currently explored and economically feasible global reserves may be depleted within only a
few generations (Childers et al., 2011). Mined phosphate rock is global principally used for
agricultural fertilizer (80%), the remainder being used for animal feed additions (5%) and
industrial applications (15%) including detergents and metal treatment (Smit et al., 2009).
The most important mineral phosphate fertilizers are Ordinary Superphosphate (OSP), Triple
Superphosphate (TSP), Monoammonium Phosphate (MAP) and Diammonium Phosphate
(DAP). The use efficiency of phosphate is quite low. Only about 20% of the phosphorus used
in agriculture reaches the food we consume, most of the remainder is lost in inefficient steps
along the phosphorus cycle e.g. crops harvesting, food production etc. (Alexander et al.,
2017; Cordell et al., 2011).
The phosphate rock is mined and then processed into fertilizers and transported around the
world for plant growth. Once the crops are harvested, the phosphorus they contain will be
transported worldwide and no longer recycled locally via the decomposition of plant matter
(SCUUWE, 2013). When the crops have been eaten by humans the phosphorus is excreted
and in the EU the P intakes is from about 1,800 mg/d (Spain) to about 2,700 mg/d (Germany)
and in women from about 1,500 mg/d (Spain) to about 2,100 mg/d (Germany) (Flynn et al.,
2009). In Germany, per capita loading of phosphorus in municipal wastewater treatment is
1.8 g phosphorus per day (DWA-A-131, 2016). However, the phosphorus is no longer
returned to the soil, but transported in to the sewage. Depending on the level and the
efficiency of the wastewater treatment plants, most of the phosphorus ends up in the sewage
sludge. Other phosphorus may end up in water systems may causing widespread pollution in
lakes, rivers and coastal areas, algal blooms, and dead zones in the oceans. In Germany,
91.8% of the P entering the WWTPs are transferred into sludge (DWA, 2016) by biological
accumulation in sludge using Enhanced Biological Phosphorus Removal (EBPR) or by
chemical precipitation e.g. with iron or aluminum salt. The other 10% of P ends up in rivers,
lakes and oceans.
With increasing industrialization and urbanization, the dependence on mined phosphate and
the creation of a water-based disposal system for human waste the traditional natural cycle
of phosphorus was broken (Kabbe, 2013a). Key to “closing the loop” on current phosphorus
losses is the recovery of phosphorus from human and animal wastes, which should be used
as a readily available phosphorus resource rather than treated as waste (Cordell et al., 2009).

Chapter 1: Current state and full-scale applications of phosphorus recovery and recycling from wastewater in different regions
3
Figure 1: The three principle routes for P recovery and recycling from the wastewater stream
as a nutrient (Kabbe, 2013b)
As shown in Figure 1, most of the phosphorus entering a WWTP ends up in the sewage
sludge. Three principle and complementary routes for closing the phosphorus cycle by
recovery from sewage sludge appear to be reasonable. Traditional sludge directly applied to
arable land as bio-solid is considered one of the most economical ways for P recycling. But
due to the increased concern for heavy metals, organic contaminants and pathogens, this
option is controversially debated by the public and authorities. Therefore, different
technologies of P recovery have been developed from the aqueous and solid phase of
sludge. The details of these technologies will be discussed in Chapter 1.3.
Although various technologies of P recovery have been developed and tested in pilot plants
or on an industrial scale and some of them are even economically feasible under current
conditions, there is still no “one solution fits all” for different regions with different
infrastructures, legal, social and economic structures. The objective of this thesis is to
explore the promising relevant paths of P recovery and recycling for different regional
conditions. Four case studies have been conducted to support sustainability of phosphorus
on a global scale. Figure 2 provides a brief overview of this research.

Chapter 1: Current state and full-scale applications of phosphorus recovery and recycling from wastewater in different regions
4
Figure 2: Overview of the research with different options for P recovery (Red box indicates
experimental work, Green box indicates modelling work and Orange box indicates case
research work)
Chapter 1 of this thesis gives an overview of global phosphorus security and recently
developed and promising technologies for phosphorus recovery from wastewater and sludge.
Full-scale implications of phosphorus recovery and recycling from wastewater and case
studies in different regions are summarized.
The simplest method of phosphorus recovery from sludge is the direct use of sludge as a
fertilizer in agriculture. Agricultural reuse of dewatered sludge can remain an adequate way
of valorization for small and mid-size wastewater treatment plants in some countries. When
the agricultural use of dewatered sludge is planned, synthetic flocculants based on non-
biodegradable polyacrylamide (PAM) may have a negative impact on the environment due to
toxicity and non-biodegradability. Chapter 2 of this thesis describes the feasibility of applying
starch-based “green” polymers in full-scale dewatering devices at three WWTPs in Germany.
The successive approach through screening, lab-scale and pilot-scale trials paved the way
for full-scale trials in order to test starch-based polymers.
P-recovery through struvite is already both technically and economically feasible. This has
been proved by more than 40 large-scale plants worldwide. However, when designing and
implement these P-recovery technologies, the environmental effects need to be considered.
In Chapter 3 a Life Cycle Assessment (LCA) is carried out in order to compare the
environmental impact of phosphorus recovery with the one-reactor AirPrex® configuration at
WWTP Berlin Wassmannsdorf and the three-reactor AirPrex® configuration at WWTP
Amsterdam West. The full-scale operational data in both plants e.g. demand for electricity,
chemicals, product yield and side effects were used to accomplish the assessment. The

Chapter 1: Current state and full-scale applications of phosphorus recovery and recycling from wastewater in different regions
5
cumulative energy demand and related environmental impacts (e.g. greenhouse gas
emissions, freshwater eutrophication potential, marine eutrophication potential) were
selected as environmental indicators for the LCA.
China is the second-largest economy and one of the largest water markets in the world.
Considering the urbanization process in current China, the treatment capacity of WWTPs is
expected to continue to grow in the next decades. In Chapter 4 the feasibility of phosphorus
recovery in the Chinese municipal wastewater and phosphate industry will be investigated.
Based upon existing phosphorus recovery technologies and the current wastewater
infrastructure in China, five options for phosphorus recovery from sewage sludge, sludge
water, sludge ash and the fertilizer industry are analyzed according to the specific conditions
in China.
According to the investigation results in Chapter 4, phosphorus recovery from phosphate
industrial wastewater shows a higher potential in China. In Chapter 5, a new approach for
the treatment of wastewater from the fertilizer industry with high phosphate and fluoride
concentration is researched. A Jar test is conducted with synthetic and real wastewater to
demonstrate the feasibility of the crystallization and precipitation process. The feasibility of a
full scale plant using this new concept at a Chinese fertilizer plant will be further discussed in
details.
The last part, Chapter 6 gives a brief summary of the main findings in this study and
presents an outlook to the future and recommendations for further research.
Different frameworks require different approaches to the recovery of phosphorus. The overall
objectives of this study are firstly, to provide a systematic overview of phosphorus recovery
and recycling methods and then through a series of case studies under different regional
conditions to provide inspiration for the future P-recovery.

Chapter 1: Current state and full-scale applications of phosphorus recovery and recycling from wastewater in different regions
6
1.2 Global phosphorus security
Phosphorus deficiency is often the limiting factor of plant growth (De Vries, 1998). Thus,
phosphorus is a critical element in food security: a shortage of phosphorus in any agro
system results in low agricultural productivity that, in many cases, may cause
undernourishment and, in extreme cases, famine (Ragnarsdóttir et al., 2011; Sanchez &
Swaminathan, 2005). By 2050, the world’s population is estimated to reach 9.1 billion, and in
order to feed the growing population, agricultural production would need to increase by 70%
overall and 100% in developing countries (FAO, 2009).
Figure 3: Trends in phosphorus consumption in different regions and the top 3 consumption
countries from 1962 to 2014 (IFA, 2017)
Figure 3 gives an overview of global phosphorus consumption, in developed and developing
countries from 1961 to 2014. Industrial nations have experienced decreasing demands since
the 1980s. This is primarily due to an accumulation of residual phosphorus, which was not
taken up by annual crops, but rather, is bound to soil particles and is available for
subsequent crops. In Germany, the fertilization is regarded as in line with good agricultural
practice if the phosphate (P2O5) surplus is less than 20 kg/ha per year (on average over the
last 6 years) (UBA, 2015). The decrease is also reflective of the increasing use of livestock
manures from concentrated feeding operations (Roland W. Scholz, 2014). In contrast, there
is increasing demand for phosphorus in many developing countries. According to the IFA
data (IFA, 2017), in 1961 fertilizer consumption of developing countries accounted for 9% of
the global total and this increased to 74% by 2014. China contributed about 27% to the world
fertilizer consumption in 2014. The top three fertilizer consumers (China, India and United
States) accounted for 51% of the world consumption in 2014. Some countries such as China
are now promoting phosphorus use efficiency and thus may flatten or decrease future
00
5,000
10,000
15,000
20,000
25,000
30,000
35,000
40,000
45,000
1961 1967 1973 1979 1985 1991 1997 2003 2009 2015
tho
usan
d t
on
nes o
f P
2O
5
Year
World
Developed Countries
Developing Countries
China
India
United States

Chapter 1: Current state and full-scale applications of phosphorus recovery and recycling from wastewater in different regions
7
demand projections (Fan et al., 2011; Zhang et al., 2011). A specific dip in 2008 was related
to the global or regional economic booms or crashes, which caused an increase in world
energy prices and directly affected P prices, production and consumption rates. World
consumption of P2O5 contained in all uses is expected to increase incrementally to 48.9
million tons in 2020 from 44.5 million tons in 2016 (USGS, 2017).
Table 1: Global phosphorus production in 2015 and 2016 and current reserves in thousand metric tons (USGS, 2017)
Mine production
Percent of
Production
Reserves Percent of Reserves
2015 2016 2016
United States 27,400 27,800 10.7% 1,100,000 1.6%
Algeria 1,400 1,500 0.6% 2,200,000 3.2%
Australia 2,500 2,500 1.0% 1,100,000 1.6%
Brazil 6,100 6,500 2.5% 320,000 0.5%
China 120,000 138,000 52.9% 3,100,000 4.6%
Egypt 5,500 5,500 2.1% 1,200,000 1.8%
India 1,500 1,500 0.6% 65,000 0.1%
Israel 3,540 3,500 1.3% 130,000 0.2%
Jordan 8,340 8,300 3.2% 1,200,000 1.8%
Kazakhstan 1,840 1,800 0.7% 260,000 0.4%
Mexico 1,680 1,700 0.7% 30,000 0.0%
Morocco and Western Sahara
29,000 30,000 11.5% 50,000,000 73.5%
Peru 3,880 4,000 1.5% 820,000 1.2%
Russia 11,600 11,600 4.4% 1,300,000 1.9%
Saudi Arabia 4,000 4,000 1.5% 680,000 1.0%
Senegal 1,240 1,250 0.5% 50,000 0.1%
South Africa 1,980 1,700 0.7% 1,500,000 2.2%
Syria 750 — — 1,800,000 2.6%
Togo 1,100 900 0.3% 30,000 0.0%
Tunisia 2,800 3,500 1.3% 100,000 0.1%
Vietnam 2,500 2,800 1.1% 30,000 0.0%
Other countries 2,470 2,410 0.9% 810,000 1.2%
World total (rounded) 241,000 261,000 100% 68,000,000 100%
According to statistics from the U.S. Geological Survey (USGS, 2017), the world’s reserves
are 68 billion tons of phosphorus rock. If the world’s P rock consumption of 261 million tons
(44.5 million tons P2O5) in 2016 (USGS, 2017) continues, the world profitable phosphate ore
may run out within 260 years. Table 1 shows the annual phosphate rock production for the

Chapter 1: Current state and full-scale applications of phosphorus recovery and recycling from wastewater in different regions
8
most important countries worldwide in 2015 and 2016 and the P rock reserves in these
countries.
The main reserves include those held by four countries: China, Saudia Arabia, Iraq and
Morocco. It can be seen that Morocco and the Western Sahara (73.5%) and China (4.6%)
have an estimated amount of 78.1% of the world's remaining phosphate reserves. Large
parts of the world, including Europe, India and Australia, are almost totally dependent on the
imports of phosphate from other countries. Unless additional sources of phosphorus can be
accessed or society can significantly increase phosphorus recycling, future global
phosphorus security will be increasingly reliant on some single countries (Cooper et al.,
2011). North Africa, especially Morocco and Western Sahara is the most important exporter
in the world. The largest areas of growth are predicted for Africa and the Middle East. In
Morocco, work will continue on the expansion of phosphate rock mines and processing
facilities, which is expected to double phosphate rock production capacity by 2020 (USGS,
2017). The largest sedimentary deposits are found in northern Africa, China, the Middle East,
and the United States. Significant igneous occurrences are found in Brazil, Canada, Finland,
Russia, and South Africa. Large phosphate resources have been identified on the continental
shelves and on seamounts in the Atlantic Ocean and the Pacific Ocean. World resources of
phosphate rock are more than 300 billion tons (USGS, 2017).

Chapter 1: Current state and full-scale applications of phosphorus recovery and recycling from wastewater in different regions
9
1.3 Routes and potentials of phosphorus recovery from municipal wastewater
In the municipal wastewater treatment plants in Germany, an average of approx. 11% of the
incoming phosphorus load is removed with primary sludge and 28% of the incoming
phosphorus load are incorporated into the biomass and removed (DWA-A-131, 2016).
Approx. another 50% of the incoming phosphorus has to be removed by biological or
chemical-physical P removal processes or combined processes (Cornel & Schaum, 2009).
Thus, the main hot spots for P recovery in WWTPs are from sewage sludge.
Figure 4: Hot spots for P recovery in WWTP (Kabbe et al., 2015). 1. Direct agricultural
utilization of dewatered sludge; 2a. Undrained sludge after anaerobic digestion; 2b. Sludge
liquor after dewatering; 3. Ash after incineration
At municipal wastewater treatment plants phosphate can be extracted and recovered or
recovered mainly from three locations (Figure 4).
1. The first is direct land utilization of sewage sludge with 40-90% of the P recovery
potential compared to the incoming WWTP phosphorus load. The plant availability of
phosphorus in sewage sludge and the contaminants contained in sludge should be
considered.
2. The second option is from sludge, including the aqueous sludge phase prior to
dewatering (5-20% P load) and from sludge liquor after dewatering (≤25% P load). With
forced P dissolution, e.g. chemical or thermal treatment, the maximal recovery rate can
reach 50%.
3. The third option is from mono-incineration ash with the highest P recovery potential for
more than 80% of the influent P load.
Over the past years, numerous technologies have been developed to recover phosphorus (P)
from waste streams to close the nutrient cycles (Kraus et al., 2016b). Figure 5 gives an
overview of the promising approaches and their state of maturity. These alternative routes for

Chapter 1: Current state and full-scale applications of phosphorus recovery and recycling from wastewater in different regions
10
phosphorus recovery are supposed to provide products or raw materials suitable for reuse in
the nutrient cycle.
Figure 5: Most visible phosphate recovery technologies applied in Europe with indication of
their state of maturity and product (Kabbe & Kraus, 2017b)
Currently the full scale plants are focused mainly on the recovery of phosphate from sludge
and its liquid phase in the form of struvite or calcium phosphate. The struvite recovery
process e.g. AirPrex®, PEARL®, NuReSys®, StruviaTM offers the benefit of improved sludge
dewatering and has even led to substantial savings in operational costs for sludge handling.
Other technologies with forced P re-dissolution, such as the ExtraPhos® process and
Gifhorn® process are able to recover more dissolved phosphate from WWTPs and the
technology is also suitable for chemical-P removal plants. Recovery technology using
chemical leaching or thermal treatment of sludge ash provides the best opportunity for
maximum phosphorus recovery. The challenge with this approach is the separation of
remobilized heavy metals from phosphorus and the disposal of the waste contaminated acid.
Until now there is no technology available on an industrial scale in Europe, apart from the
EcoPhos® plant currently under construction in Dunkerque in France and TetraPhos®
tendered for implementation in Hamburg, Germany.

Chapter 1: Current state and full-scale applications of phosphorus recovery and recycling from wastewater in different regions
11
1.3.1 Potentials of P-recycling through bio-solids valorization in agriculture
In the past, phosphorus was traditionally returned to the soil and recycled in agriculture. The
land utilization of sewage sludge in agriculture can significantly reduce the sludge disposal
costs as well as provide a large part of the nitrogen and phosphorus. Sewage sludge as a
soil improver has also obvious benefits due to improving soil structure and water retention
qualities etc. With industrialization, the urban sewage systems do not only transport domestic
wastewater, but also industrial effluents and storm-water runoff from roads and other paved
areas. Thus sewage sludge may contain organic waste material, heavy metals,
pharmaceuticals, pathogenic bacteria, viruses, worms and protozoa (Fijalkowski et al.;
Kirchmann et al., 2017). Some of these substances can be phytotoxic and/or toxic to humans
and/or animals. Depending on legislation, rules, attitudes and risk perceptions, the use of
sewage sludge in agriculture varies between countries.
Figure 6: Disposal and recycling routes for sewage sludge in European countries (BAFU,
2013; Destatis, 2016; EurEau, 2016; Eurostat, 2016)
Since 1986, land application of sewage sludge within the European Union has been
governed by Council Directive No. 86/278/EEC (Directive, 1986). As shown in Figure 6, in
total 9,286,571 tons of dry sludge was generated in the 29 European countries (EU27,
Norway and Switzerland) and about 51% of the sewage sludge was directly applied in
agriculture. Land application is widely used in Luxemburg, France, Spain, Italy and the UK.
The sludge produced in the Netherlands is banned from land application and therefore
0
200,000
400,000
600,000
800,000
1,000,000
1,200,000
1,400,000
1,600,000
1,800,000
2,000,000
AT
BE
BG
CH
CY
CZ
DE
DK
EE
ES FI
FR
GR
HU IE IT LT
LU
LV
MT
NL
NO PL
PT
RO
SE SI
SK
UK
Sew
ag
e s
lud
ge
qu
an
tity
in
me
tric
to
ns
dry
ma
tte
r
European Country
unknown
Other
Storage
Landfill
Incineration
Landscaping
Green Areas
Forestry
Agriculture

Chapter 1: Current state and full-scale applications of phosphorus recovery and recycling from wastewater in different regions
12
exported or incinerated since 1995. In Greece, Malta and Romania, landfilling is the
dominant disposal option. In Germany, about 23.7% (428,000 tons dry matter) of the
accumulated sludge was utilized in agriculture in 2015 (Destatis, 2016).
The agricultural application on land may still play an important role for some countries within
a certain period. The proportion of agricultural use of sludge in the US was always relatively
high totaling 60~66% in 2015 (Yu, 2011). China has a long history of the sludge agriculture
application. Currently, more than 80% of sludge is disposed by improper dumping in China
(Yang et al., 2015). According to the overall situation of China, “thickening-anaerobic
digestion-dewatering-land application” may be the priority technical route of sludge treatment
and disposal (Yang et al., 2015). In India, the problems associated with wastewater arise
from its lack of treatment. An estimated 38,354 million liters per day sewage is generated in
major cities of India, but the sewage treatment capacity is only of 11,786 million liters per day
(Kaur et al., 2012). Integrated management of wastewater through sewage fed aquaculture
for resource recovery and reuse of treated effluent is being recognized as a suitable route for
Indian (Kumar et al., 2014). Australia currently produces approximately 300,000 dry tonnes
of biosolids annually (AWA, 2017). Approximately 55% is applied to agricultural land and
around 30% is disposed of in landfill or stockpiled. The remaining 15% is used in composting
(AWA, 2017).
In total, P recycling through the use of biosolids in agriculture varies from country to country
due to differing national regulations. Yet, it can still be considered as one of the main
recycling routes for phosphorus worldwide.
1.3.2 Potentials of P-recovery from sludge water
With this option, less than 25% of phosphorus loading can be recovered from the
supernatant of the digested sludge either before or after sludge dewatering. In the Pearl®,
NuReSys® and StruviaTM processes, phosphorus is recovered in the form of struvite crystals
(magnesium ammonium phosphate) through crystallization from the aqueous sludge phase
after dewatering. The crystallization of struvite directly from digested sludge can recovery 5-
20% of phosphorus loading, e.g. by the AirPrex® process, and offers an additional benefit of
improved sludge dewatering.
Apart from the P recovery as such, the biggest driver for struvite processes is the reduction
of operational and maintenance costs for the WWTPs with enhanced biological P removal
and anaerobic digestion. The growing use of digestion of sludge may results unintended
struvite crystallization in their sludge train of the WWTP. P recovery from sludge liquids can
help to prevent scaling in pipes and to reduce the return P load for biological wastewater
treatment. It also supports the WWTP performance to meet the P discharge standard.

Chapter 1: Current state and full-scale applications of phosphorus recovery and recycling from wastewater in different regions
13
Figure 7: P-recovery from sludge water with combination of PEARL® and WASSTRIP®
Process (Ostara, 2017b)
As the example in Figure 7 shows, Pearl® is designed by Ostara to prevent unwanted struvite
incrustation after sludge dewatering in EBPR WWTPs. There are currently 14 operational
Pearl® systems worldwide (Ostara, 2017a). The crystallization reactor is installed directly
after the dewatering unit and treats the sludge liquor. Struvite is precipitated by dosing MgCl2
at the bottom of the reactor and increasing pH with NaOH dosing. Internal recirculation in the
PEARL® reactor assures proper mixing and good crystal growth, while the specially designed
reactor shape guarantees uniform crystal size and optimum hydraulic conditions (P-REX-
Factscheets, 2015). The product (Crystal Green®) reaches the desired size from 0.9 mm to
4.5 mm, with a purity of 99.6% (Ostara, 2017c). In the WASSTRIP® process the waste
activated sludge or waste activated sludge of the wastewater treatment is sent to an
anaerobic reactor, which is designed to rapidly trigger the release mechanism of PAOs by
optimizing conditions for P release. The waste activated sludge is then sent to a thickening
device and the liquid with enhanced orthophosphate and magnesium concentrations is then
fed into the PEARL® reactor. In combination with the WASSTRIP® process for P release prior
to digestion, P recovery can be significantly increased above 40% of the total influent while
improving sludge dewaterability and digestor capacity (Ostara, 2017b). The operational data
of the PEARL® and WASSTRIP® processes are from the company of Ostara.

Chapter 1: Current state and full-scale applications of phosphorus recovery and recycling from wastewater in different regions
14
Figure 8: P-recovery from sludge with AirPrex® process (P-REX-Factscheets, 2015)
Another widely used process to recover dissolved P within the sludge directly after digestion
is the AirPrex® process. The process mechanism is shown in Figure 8. In the AirPrex®
reactor, CO2 is stripped from the digested sludge by aeration to increase the pH of the sludge.
With aeration it also forms a fluidized bed within the reactor and therefore sets the retention
time for growing struvite crystals. After dosing of magnesium chloride, mineral phosphorus
product struvite is crystallized and precipitated into the bottom of the reactor. In this process
struvite is crystallized within the wet sludge and can therefore prevent the down-stream
struvite scaling and at the same time improve the sludge dewaterability by 3-6 % and reduce
the polymer by up to 30% for sludge dewatering (Forstner, 2015; Heinzmann & Lengemann,
2011).
Struvite process limitations:
Although struvite process from sludge water can provide environmental and economic
benefits, there are limitations in application and recovery rate. Struvite recovery is only
applicable to plants with an EBPR system, which can create a high concentration of
recoverable orthophosphate. The struvite process is more suitable for the sludge water with
more than 100 mg/l of dissolved P (Stemann et al., 2014). There are still many plants using
chemical phosphorus elimination (e.g. with iron salts) or a combination of Bio-P and chemical
P-removal processes. Based on the available data, in the UK and Germany EBPR is used
across 23% and 16% of the total number of plants in those countries respectively (Wiseman,
Chapter 1: Current state and full-scale applications of phosphorus recovery and recycling from wastewater in different regions
15
2015). Currently, without sludge extraction, the recovery rate of phosphorus can reach 5-25 %
compared to the influent phosphorus.
At present, some WWTPs are also interested in creating energy neutral or energy positive
wastewater treatment plants. One of the current projects, POWERSTEP
(www.powerstep.eu), uses chemical methods to remove carbon and phosphates to maximize
the conversion of incoming carbon into the sludge stream. In such an “energy factory”
process, EBPR process cannot be applied since the phosphorus is removed by a chemical
process, which is contrary to the struvite process.
1.3.3 Potentials of P-recovery from sludge solids
In many WWTPs in Europe, phosphate removal is achieved by using chemical precipitation.
At this point, an enforced phosphorus dissolution process, such as the ExtraPhos® process,
Stuttgart process or Gifhorn® process is able to recover phosphate where chemical
precipitation has been applied. With forced P dissolution, e.g. leaching the sludge with hard
acids, the recovery potential can reach 50% of the total P load in the WWTP. The challenge
of sludge leaching is to separate heavy metals, which are also re-mobilized by acid. A high
phosphorus recovery rate means higher dosage of chemicals and/or energy demand (Remy
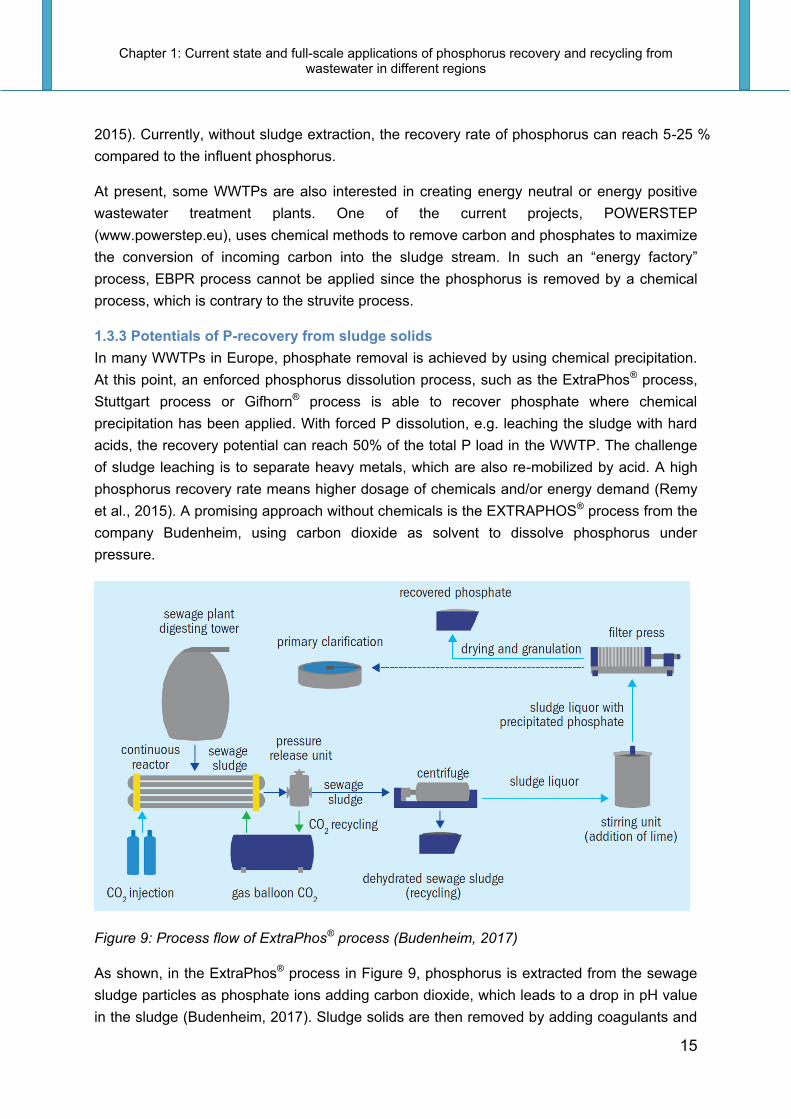
et al., 2015). A promising approach without chemicals is the EXTRAPHOS® process from the
company Budenheim, using carbon dioxide as solvent to dissolve phosphorus under
pressure.
Figure 9: Process flow of ExtraPhos® process (Budenheim, 2017)
As shown, in the ExtraPhos® process in Figure 9, phosphorus is extracted from the sewage
sludge particles as phosphate ions adding carbon dioxide, which leads to a drop in pH value
in the sludge (Budenheim, 2017). Sludge solids are then removed by adding coagulants and

Chapter 1: Current state and full-scale applications of phosphorus recovery and recycling from wastewater in different regions
16
dewatering using a centrifuge, while the carbon dioxide recovered following degassing is
recycled for reuse. The mobilized phosphorus is precipitated with lime (calcium hydroxide) to
generate dicalcium phosphate (DCP), which is separated out and can be used as a fertilizer
in agriculture, closing the loop for phosphorus. The advantage of this method is that it works
without additional chemicals (except lime) or the use of thermal energy (Schnee, 2016).
1.3.4 Potentials of P-recovery from sewage sludge ash
The sludge incineration process destroys all pathogens, organic pollutants and nitrogen and
the resulting ash provides the best opportunity for maximum phosphorus recovery (>80% of
P load). However, this waste stream also contains heavy metals that are not degraded in the
incineration process and are present in concentrations higher than their allowed limits,
restricting their use in agriculture. The direct use of sludge ash is also limited to bioavailability
due to low P-solubility (Krüger & Adam, 2015a). In this route the incinerated ash of sludge
solids is treated with thermo-chemical and wet chemistry technologies (e.g. AshDec®,
Mephrec® and LeachPhos®). Using acid or caustic digestion of these ashes can produce P
products with high P-availability suitable for animal feed or fertilizers, or as elemental P. The
challenge with this approach is the separation of remobilized heavy metals from phosphorus
(Schaum et al., 2008) and the disposal of the waste contaminated acid. However, these
technologies are based on the existing infrastructure or require high capital investment on
mono-incinerators.
One of the promising technologies is the Ecophos® process, which was originally developed
by the phosphate industry to process low-grade P input material into a high-quality P product.
Figure 10: Process flow of Ecophos® process (P-REX-Factscheets, 2015)

Chapter 1: Current state and full-scale applications of phosphorus recovery and recycling from wastewater in different regions
17
The Ecophos® process is based on the digestion of ash into a large excess of H3PO4 (Figure
10), which is recycled from the product side. After digestion, insoluble residues are removed
via filtration and disposed as inert material. The liquid solution contains a high amount of
H3PO4 and dissolved impurities from the ash (Remy et al., 2015). This solution is purified by
a multi-stage ion exchange (IEX) process, thus removing divalent salts (Mg, Ca), metals (Fe,
Al), and other impurities such as heavy metals (Ruiter, 2014). After purification of the solution,
a part of the H3PO4 is recycled back to the ash digestion, whereas another part is recovered
as H3PO4 product and is further concentrated using steam. More than 95% of P can be
extracted and recovered as phosphoric acid. The final product is a H3PO4 solution with high
concentration (62% technical grades) and low impurities (Ruiter, 2015).
A similar approach with the application of different ion exchangers is applied by the company
Remondis. With the TetraPhos® process, the sewage sludge ash is dissolved in phosphoric
acid and a number of final products were produced including RePacid® phosphoric acid for
the production of phosphates (inc. fertilizers), gypsum for the building supplies trade, and
iron and aluminum salts which can be returned to the sewage treatment plant to be used as
a precipitating agent to treat wastewater and eliminate phosphorus.
1.3.5 Comparison of different P-recovery methods with Life Cycle Assessment
Within the P-REX project, different pathways and processes for P recovery from sewage
sludge have been assessed according to their environmental and economic impact (Remy et
al., 2015). Process data of the different P recovery technologies had to be transferred from
pilot or full-scale installations to a defined reference system to overcome potential bias due to
site-specific conditions. The reference system is defined as the sludge treatment line of a
wastewater treatment plant (WWTP) for 1 million inhabitant equivalents, reflecting the annual
operation of a typical large-scale WWTP in Germany.
Figure 11 shows an important LCA indicator, reflecting the relation between P recovery rate
and total cumulative energy demand of fossil fuels for the different P recovery pathways. It
indicates that struvite recovery directly from sludge or sludge liquor is energetically beneficial
due to higher dewaterability and lower return load. But the struvite process has only a limited
P recovery rate (5-25%) and is only applicable in Bio-P plants.

Chapter 1: Current state and full-scale applications of phosphorus recovery and recycling from wastewater in different regions
18
Figure 11: Net energy demand for different P recovery pathways (Remy et al., 2015)
The sludge leaching process has a higher P yield of about 50% of P load, but is also requires
more chemicals and has a high energy and greenhouse gas footprint (GHG). The ash
processes can recover up to 97% with a reasonable energy or GHG footprint, but it depends
on the process (ash leaching, thermo-chemical, metallurgic) and the potential integration of
thermal processes into existing incineration facilities for efficient heat management. The
trade-off between different technologies depends on the goals of maximum P recovery and
maximum energy recovery from sludge with a low carbon footprint. The struvite recovery
technology is limited to dissolved orthophosphate in sludge water. It does not compete
against other processes of phosphorus recovery from ash.
1.3.6 Combined energy and nutrient recovery
Compared to the single technology option for recovery of phosphorus from the municipal
plant, the next generation of competitive technologies may provide the synergetic recovery of
phosphate, nitrogen and carbon (Kabbe & Kraus, 2017a).

Chapter 1: Current state and full-scale applications of phosphorus recovery and recycling from wastewater in different regions
19
Figure 12: Combined energy and nutrient recovery (Kabbe & Kraus, 2017b)
As shown in Figure 12, one option to improve the yield of recovered struvite is a combination
with thermal (i.e. CAMBI) or chemical (i.e. PONDUS) hydrolysis for the disintegration of
waste activated sludge. The biogas production in the subsequent digester can be increased
with sludge disintegration and, at the same time, insoluble or hardly soluble polyphosphates
are transformed into soluble ortho-phosphate, which is available for struvite crystallization in
the sludge water. After the struvite crystallization the ammonia in the sludge liquid is stripped
by increasing pH and temperature. The stripped ammonia is mixed with sulfuric acid and
recovered as liquid ammoniumsulphate.
An excellent example of future energy and nutrient recovery factory is WWTP Amersfoort in
the Netherlands which combined Ostara’s WASSTRIP® and PEARL® processes together
with the LYSOTHERM® thermal sludge process (Kraus & Kabbe, 2017). Another example is
currently underway at Steinhof WWTP in Braunschweig, Germany. Commissioning is
expected for 2018. The plant will be the first full-scale enhanced carbon, phosphorus and
nitrogen recovery facility in Europe. It combines thermal hydrolysis for enhanced sludge
disintegration with struvite recovery and ammonia stripping. The recovered struvite and
ammonium sulphate will be utilized locally (Kabbe & Kraus, 2017a).

Chapter 1: Current state and full-scale applications of phosphorus recovery and recycling from wastewater in different regions
20
1.4 Implementation of phosphorus recovery
1.4.1 Full scale techniques and global application
P-recovery has been widely studied and a number of full scale installations for recovery are
already in operation or under construction. Figure 13 shows the distribution of plants with P-
recovery processes from wastewater in different continents. Due to the rapid development of
phosphorus recovery, the data may not cover all the plants worldwide. The current
phosphorus recovery plants are mainly operated in three continents: Europe, North America
and Asia. The major reason seems to be a low or lack number of phosphate rock reserves in
these regions. In Europe, about 90% of the phosphate used is imported (van Dijk et al.,
2016). Japan has even no economically viable phosphate rock reserves, being almost
entirely dependent on imported phosphorus (Ohtake & Okano, 2015). To ensure the food
security, the developed countries with hardly any or no P reserves take the lead in recovering
and recycling phosphorus.
Figure 13: Distribution of plants with P-recovery process from wastewater worldwide (Kabbe,
2017)
From a technical aspect, precipitation of struvite from phosphate-rich sewage sludge water is
becoming a well-established technology with more than 40 full-scale installations world-wide
(Kabbe & Kraus, 2017b). There are approx. 10,000 tones/a of struvite currently produced in
Europe are likely to double in the coming five years (Kabbe & Kraus, 2017a). AirPrex®,
NuReSys®, PEARL® are the most applied technologies among the struvite processes. The
recovery from ash is still rare in industrial scale plants. In Europe, there are some full-scale
plants under construction using of recovery from ash. i.e. through the EcoPhos process or
directly as secondary P sources in the fertilizer industry. In Japan, some recovery plants are
in full-scale in special industries.
Chapter 1: Current state and full-scale applications of phosphorus recovery and recycling from wastewater in different regions
21
1.4.2 Case studies for Europe-wide implementation
In 2014, The European Commission added phosphate rock to the list of 20 Critical Raw
Materials which are economically important and are subject to a “high supply risk” (EU-
Commission, 2014). In May 2017, the European Commission (JRC) circulated a draft for
“nutrient recovery rules” (outline for possible CMC – Component Material Category – criteria
under the revised EU Fertilizers Regulation) for struvite (widened to recovered phosphate
salts), biochars and pyrolysis products and ashes – STRUBIAS (Huygens et al., 2017). The
phosphorus challenge in Europe was not only taken up by the governments, but also
different stakeholders and platforms, such as the European Sustainable Phosphorus
Platform (ESPP), the Netherlands Nutrient Platform, German Phosphorus Platform (DPP)
and Baltic Sea Action Group (BSAG) etc. They contribute to define a long-term vision for
phosphorus sustainability in Europe.
According to the phosphorus flows analysis for EU-27 and its Member States (van Dijk et al.,
2016), sewage sludge is apart from manure, the second most relevant P recovery and
recycling renewable waste stream in Europe with a potential of 182,000 tons of phosphorus
per year. About 90% of the phosphate used in the EU is imported from Morocco, Tunisia and
Russia. It is estimated that, 20-30% of the EU’s demands for phosphate fertilizers could
potentially be met by undertaking recycling in line with a circular economy approach.
Therefore, various technologies were developed in Europe and have been applied in
European countries. Table 2 gives an overview of phosphorus recovery facilities operating or
under construction in Europe.

Chapter 1: Current state and full-scale applications of phosphorus recovery and recycling from wastewater in different regions
22
Table 2: Overview of phosphorus recovery facilities operating or under construction in Europe (Kabbe & Kraus, 2017a) (modified)
Technology Location and operator Operational since Recovered product
Onsite wastewater treatment plants
AirPrex®
MG-Neuwerk (DE), Niersverband
Wassmannsdorf (DE), Berliner Wasserbetriebe
Echten (NL), Drents Overijsselse Delta
Amsterdam-West (NL), Waternet
Uelzen (DE), SE Uelzen
Salzgitter Nord (DE), ASG
Wolfsburg (DE), SE Wolfsburg
2009
2010
2013
2014
2015
2015
2016
Struvite
ANPHOS Land van Cuijk (NL), Aa en Maas 2011 Struvite
EloPhos® Lingen (DE), SE Lingen 2016 Struvite
EXTRAPHOS
(Budenheim)
MZ-Mombach (DE), Wirtschaftsbetrieb Mainz
2017 (pilot) DCP
Gifhorn Gifhorn (DE), ASG 2007 Struvite/CaP
NASKEO Castres (FR) 2015 Struvite
NuReSys®
Harelbeke (BE), Agristo
2x Niewkuerke (BE), Clarebout Potatoes
Waasten (BE), Clarebout Potatoes
Geel (BE), Genzyme
Leuven (BE), Aquafin
Schiphol Airport (NL), Evides
Land van Cuijk (NL), Logisticon
Apeldoorn (NL), Vallei & Veluwe
Braunschweig Steinhof (DE), SE|BS / AVB
2008
2009/12
2012
2014
2013
2014 (pilot)
2015
2016
2018/19
Struvite
PEARL®
(OSTARA)
Slough (UK), Thames Water
Amersfoort (NL), Vallei & Veluwe
Madrid (ES), Canal de Isabel II
2013
2015
2016
Struvite
(Crystal Green®)
PHORWater Calahorra (ES), El Cidacos 2015 (demo) Struvite
PHOSPAQ™
Olburgen (NL), Waterstromen
Lomm (NL), Waterstromen
Nottingham (UK), Severn Trent Water
Tilburg (NL), Waterchap de Dommel
2006
2008
2014
2016
Struvite
PhosphoGREEN
(SUEZ)
Aaby (DK), Aarhus Water
Marselisborg (DK), Aarhus Water
Herning (DK), Herning Water
2013
2018
2016
Struvite
REPHOS®
(delivered by NuReSys)
Altentreptow (DE), Remondis Aqua (dairy) 2006 Struvite
STRUVIA™
Helsingør Southcoast (DK) 2015 Struvite
Stuttgart
Offenburg (DE), AZV
Mobile Pilot – MSE Mobile Schlammentwässerungs GmbH
2011 (demo)
2015
Struvite
(after acid leaching)
Downstream wastewater treatment plants and ash treatment
EcoPhos Varna (BG), DecaPhos Dunkerque (FR), EcoPhos
2016
2017 H3PO4/DCP/ MCP
Fertilizer industry Various companies already apply or consider use of secondary P sources
tested and
intended Commercial fertilizer
MEPHREC Nürnberg (DE), SUN 2016 (demo) P-slag
TetraPhos®
Hamburg (DE), Hamburg Wasser/Remondis Aqua
2015 (pilot)
2019 (full scale) H3PO4

Chapter 1: Current state and full-scale applications of phosphorus recovery and recycling from wastewater in different regions
23
National regulations for P recovery in Europe:
Some European countries have implemented national regulation to promote phosphorus
recovery from the wastewater path and other relevant waste streams with rich phosphorus. A
new waste regulation entered into force in January 2016 in Switzerland, making phosphorus
recovery from sewage sludge and meat and bone meal obligatory within a 10 year transition
phase.
In Germany, a new sewage sludge ordinance was passed by the German cabinet on 18th
January 2017 (BMUB, 2017; Bundestag, 2017). This ordinance will make phosphorus
recovery from sewage sludge obligatory for all German WWTPs larger than 50,000 person
equivalents (e.p.) (approx. 500 WWTPs). They will have to recover the phosphorus if the
sludge contains more than 2% phosphorus/DM (dry matter) or recover it from sewage sludge
incineration ash. These 500 larger sewage works represent about 2/3 of the total phosphorus
removed from German wastewater and transferred into sludge. Larger sewage plants with
more than 100,000 p.e. have a transition period of 12 years. WWTPs between 50,000 and
100,000 p.e. will have a transition phase of 15 years. If the phosphorus in sludge is less than
2%, co-incineration can be authorized. Land application of sludge will only be allowed for
WWTPs of < 50,000 person equivalents.
Following the legislative developments in Switzerland and Germany, Austria is now also
opting for mandatory P recovery from municipal sewage sludge. The draft Federal Waste
Plan 2017 (BMLFU, 2017) includes a ban of direct land application or composting for sewage
sludge generated at Wastewater Treatment Plants with capacities of 20,000 p.e. or above
within a transition phase of 10 years. Alternatively, these WWTPs will have to recover the P
from sludge onsite targeting P contents below 20 g P / kg dry solids or have to deliver their
sludge to sludge mono-incinerators. The P is then to be recovered from the sewage sludge
ashes obtained. This regulation will cover 90% of the P contained in municipal wastewater in
Austrian.
Regional study in the Netherlands
The Netherlands is among the pioneer countries in the field of phosphorus recovery from
sludge in full-scale plants at municipal level. Agricultural spreading of sewage sludge has not
been allowed in the Netherlands since 1995 (Stark, 2004). One of the consequences of this
situation is a 100% incineration of sludge (part of them export to Germany) in the
Netherlands (Eurostat, 2016).
Within the wastewater sector, P will partly be recovered as struvite at the WWTPs (e.g.
WWTP Amsterdam West, WWTP Amersfoort, WWTP Land van Cuijk, WWTP Apeldoorn
etc.), but, more importantly sludge ash from mono-incineration will be used as input in order
to replace rock phosphate. Acronym for Foundation for Applied Water Research (STOWA)
(Notenboom et al., 2013) quantified that, based on the amount of sludge in 2010, about 11
600 t/a P can be recovered from Dutch sludge annually if all sludge in the Netherlands to
mono-incinerators. An EcoPhos plant is currently under construction for phosphorus recovery

Chapter 1: Current state and full-scale applications of phosphorus recovery and recycling from wastewater in different regions
24
from Dutch sewage sludge incineration ash (60,000 tons/year) in cooperation with SNB
(Slibverwerking Noord-Brabant) and HVC Group.
Regional study in Germany
Approximately two-thirds of sewage sludge in Germany is now incinerated, with similar
quantities going to sewage sludge mono-incineration and to co-incineration. 23.7% of sludge
is still applied to agricultural land (Destatis, 2016), but that figure can be expected to decline
in the future by implementation of new sewage sludge ordinance. According to the new
sludge regulation with P-recovery, the P recovery from mono-incineration ash can been
considered as the main route for Germany (Kraus et al., 2016a). Some large plants are
planning to construct new mono-incineration plants, e.g. Berlin Wassmannsdorf. German
sewage sludge ash (SSA) contains up to 19,000 t/a P which equals approximately 13% of
the phosphorus applied in German agriculture in the form of phosphate rock based mineral
fertilizers (Krüger & Adam, 2015b).
1.4.3 Case studies for implementation in North America
In North America, the dependence of phosphorus imports is not as high as in Europe. Table
3 gives information on currently operating or under construction full-scale recovery plants.
All the plants in North America use the struvite process with PEARL® and MultiformTM
technology.
Table 3: Overview of phosphorus recovery facilities operating or under construction in North
America (Kabbe & Kraus, 2017a) (modified)
Country Technology Location and operator Operationa
l since
Recovered material or
product
Onsite wastewater treatment plants
USA MultiformTM
Yakima, WA
Boise, ID
Massey, MD, Jones Family Farms (dairy)
Green Bay, WI
n.a. Struvite
USA PEARL®
(OSTARA)
Tigard, OR, Clean Water Services
Suffolk, VA, Hampton Roads Sanit. District
York, PA, City of York
Hillsboro, OR Clean Water Services
Madison, WI, Madison Metro. Sew. Distr.
Burford, GA, Gwinnett County
Stickney, IL, Metro. Water Recl. Chicago
Reno, NV, Cities of Reno and Sparks
Winchester, VA, F. Winchester Service A.
2009
2010
2010
2012
2014
2015
2016
2016
2016
Struvite
(Crystal Green
®)
Canada PEARL®
(OSTARA)
Edmonton, AB, EPCOR Water Services
Saskatoon, SK, City of Saskatoon
2015
2013
USA AirPrex® Liverpool, OH, Medina County 2017/2018 Struvite

Chapter 1: Current state and full-scale applications of phosphorus recovery and recycling from wastewater in different regions
25
There are about nine PEARL® plants operating or being completed in the USA and two in
Canada in Edmonton and Saskatoon. The world’s largest nutrient recycling facility based on
wastewater is currently also located in America. The world´s largest struvite recovery
installation at Stickney Water Reclamation Plant in Chicago, USA (2.3 million p.e.), started
operation in 2016 with the PEARL® 10k reactor that produces 10,000 tons of struvite per year
(Ostara, 2016). The Liverpool Wastewater Treatment Plant by the Medina County Sanitary
Engineers in Ohio, USA, selected to install the AirPrex® process in the fourth quarter of 2017
(CNP, 2017a).
It is predicted that, the recovery of P as struvite in WWTPs will continuously grow in North
America, mainly driven by the savings on maintenance costs and prevention of scaling and
blocking of pipes.
1.4.4 Case studies for implementation in Asia
Most of the P-recovery plants in Asia are located in Japan. China has only two plants based
on recovery from the liquid phase. Table 4 gives the details of these plants.
Table 4: Overview of phosphorus recovery facilities operating in Asia (Kabbe & Kraus, 2017a;
Ohtake & Okano, 2015) (modified)
Country Technology
Location and operator Operational since
Recovered material or
product
Onsite wastewater treatment plants
Japan Hitachi-Zosen
(Unitika)
Matsue (JP)
Senboku (JP), Senboku City
1998
2009
Struvite
HAP
Japan J-Oil Yokohama (JP), J-Oil Mills Co.
HAP
Japan JSA Kawasaki (JP), Japan Synthetic Alcohol Co.
1998 HAP
Japan KURITA Fukuoka (JP), 3 plants 1997 Struvite
Japan Kyowa Hakko
Hofu (JP), Kyowa Hakko Bio Corp.
2006 HAP
Japan Swing Kobe (JP), Swing Corp. 2012 Struvite
China AirPrex® Tianjin (CN), Tianjin CEPG 2016 Struvite
China Crystalactor®
Nanjing (CN), Royal Haskoning DHV
2010 Struvite
Downstream wastewater treatment plants and ash treatment
Japan METAWATER
Gifu (JP)
Tottori (JP)
2010
2013
HAP
Japan Nippon PA Chiba (JP), Nippon Phosphoric Acid
2009 H3PO4

Chapter 1: Current state and full-scale applications of phosphorus recovery and recycling from wastewater in different regions
26
The sustainable supply of P is critical in Japan, not only due to agricultural production but
also industrial manufacturing (Ohtake & Okano, 2015). Approximately 44% of the total P
imported into Japan is associated with food, animal feed, and mineral resources such as iron
ore and coal. Phosphate rock accounts for only 15% of the total P imports from abroad
(Matsubae-Yokoyama et al., 2009). P recycling has been implemented in several WWTPs
(e.g. Matsue, Senbuko) and blackwater treatment plants (e.g. Senboku city) in Japan. Full-
scale P recovery plants based on incinerated sludge ash are also operated at Gifu and
Tottori with the production of calcium hydroxyapatite.
There are two plants with struvite recovery in China. One plant which use the with AirePrex®
process in municipal wastewater treatment plant in Tianjin. Another plant uses Crystalactor
technology for struvite recovery with from a chemical company producing caprolactan in
Nanjing. Growing urbanization in China has caused a rising trend in domestic wastewater
and sewage sludge discharges. According to the case studies research (Zhou et al., 2017),
most of the P-recovery options are limited to the current infrastructure and P content in
sludge. The recovery from industrial wastewater with high concentration of P shows higher
potential than in municipal WWTPs due to easier market access and benefits to its operators.

Chapter 1: Current state and full-scale applications of phosphorus recovery and recycling from wastewater in different regions
27
1.5 Conclusion
In this review a variety of different approaches are described for the recovery of phosphorus
from sludge water, solid sludge and sludge ash. The struvite recovery is state of the art for P
recovery and recycling from sludge and sludge water. The additional benefits for WWTP
operators play an important role in P-recovery. But this process is still limited to Bio-P plants
and the recovery rate can reach a maximum of 50%. P recovery from ash has a higher
recovery potential with about 80-90%. But this option requires a highly developed
infrastructure. If the sewage sludge is incinerated or planned to be incinerated separately
(obligatory in Switzerland, the Netherlands, Austria, Germany), the P recovery from ash
seems to be the main method for these countries. In the future, a combination of phosphorus
recovery with energy and resource efficiency (e.g. WWTP Amersfoort and WWTP Steinhof)
will be a promising route for the further development of the technology.
The P-recovery plants are mainly located on three continents: Europe (Belgium, Denmark,
Germany, Italy, the Netherlands and Spain), North America (USA, Canada), Asia (Japan,
China). The most appropriate way of P recovery and recycling may differ from region to
region under different national conditions. Therefore, there is no “one solution fits all” for the
recovery of phosphorus. The decision for the most suitable technology depends on the
existing infrastructures, economic feasibility, legislations and national policies.

Chapter 2: Full-scale performance of selected starch-based biodegradable polymers in sludge dewatering and recommendations for application
28
Chapter 2: Full-scale performance of selected starch-based
biodegradable polymers in sludge dewatering and
recommendations for application
Graphical abstract:
Highlights:
A jar testing methodology was developed for the assessment of the optimal polymer
dose for sewage sludge
Comparison the dewaterability of starch-based polymers and polyacrylamide
synthetic polymers in pilot and full-scale
Evaluation of the substitution potential of synthetic polymers in WWTPs
Recommendations for the future application of starch-based polymers was given
A modified postprint version of this chapter has been published as:
Zhou, K. *, Stüber, J., Kabbe C., Schubert, R., Barjenbruch, M. (2017): Full-scale
performance of selected starch-based biodegradable polymers in sludge dewatering and
recommendation for applications, Water Science and Technology, In Press
©IWA Publishing [2017]. The definitive peer-reviewed and edited version of this article is
published in Water Science and Technology, https://doi.org/10.2166/wst.2017.476 and is
available at www.iwapublishing.com.

Chapter 2: Full-scale performance of selected starch-based biodegradable polymers in sludge dewatering and recommendations for application
29
2.1 Sludge valorization in agriculture
Agricultural reuse of dewatered sludge can remain an adequate route for sludge valorization
for small and medium sized wastewater treatment plants (WWTP) due to the direct utilization
of nutrients. According to statistic data (BAFU, 2013; Destatis, 2016; EurEau, 2016; Eurostat,
2016), about 51% of the sewage sludge generated in the 28 European countries (including
UK, Switzerland) is directly applied in agriculture. About 23.7% (428 000 ton dry) of the
accumulated sludge in Germany was valorized in agriculture in 2015 (Destatis, 2016). When
agricultural use of the dewatered sludge is planned, synthetic flocculants based on non-
biodegradable polyacrylamide (PAM), may have a negative impact on the environment due
to their toxicity and non-biodegradability (Khachan et al., 2011). Therefore a more stringent
regulation for this valorization route has been put in force (German Fertilizer Ordinance
(DüMV, 2012) which requires the degradation of 20% of the polymeric substance within two
years by the year 2017 in order to increase the soil’s water holding capacity. Due to
uncertainty of the degradable of synthetic polymers, the regulations are still evaluated and
the transition period for the application of synthetic polymers is extended until 31.12.2018
(BGBL, 2017). According to the amendment of the German Fertilizer Ordinance (BMEL,
2016), effective from 01. January 2019, the quantity of applied synthetic polymers in
agricultural land should not exceed 45 kg active substance (AS) per hectare within three
years. Regardless of the long term strategic decision on sludge valorization and phosphorus
recycling, partial or total substitution of PAM-based polymers with biodegradable polymers is
therefore an environmentally friendly alternative.
PAM-based polymers are used to improve dewatering outcomes considerably and therefore
decrease the sludge volume and less energy is required for transport. However, the
petroleum resources are limited and the widespread use of non-biodegradable polymers may
cause serious environmental problems (Lu et al., 2009). Therefore more focus need to be put
on natural polymers based on renewable input (Scott, 2000)., e.g. starch and chitosan, which
are inherently biodegradable (Chiellini & Solaro, 1996) and can be considered promising
candidates to meet different requirements. Starch is mainly composed of two homopolymers
of D-glucose (Pareta & Edirisinghe, 2006), which form non-toxic residues after degradation.
Starch-based completely biodegradable polymers (SCBP) combine the individual
advantages of starch and synthetic polymers, providing promising potential for sludge
dewatering.
This chapter aims at assessing the use of starch-based polymers for full-scale dewatering of
municipals wastewater sludge. The successive approach through lab-scale and pilot-scale
trials paved the way for full-scale trials. Varying blends of starch-based polymers and PAM-
based polymers were tested in lab-scale trials with jar tests and drop-off tests. Pilot-scale
trials with a centrifuge have identified the optimization and quantification of dewatering
outcomes. Short term trials on a full-scale centrifuge, drum filter and belt thickener at three
WWTPs in Germany with the blends demonstrated the substitution potential with different
dewatering devices and showed the limits of the state of the art product.

Chapter 2: Full-scale performance of selected starch-based biodegradable polymers in sludge dewatering and recommendations for application
30
2.2 Materials and methods
2.2.1 Study sites and sampling locations
Laboratory scale trials were conducted on the premises of WWTP Schönebeck and WWTP
Putzhagen (Gütersloh) whereas pilot and full-scale trials took place at WWTP Steinhof
(Braunschweig), WWTP Schönebeck and WWTP Putzhagen. Since the sludge properties as
well as sludge types as well as sludge types vary significantly from one to another WWTP,
the starch-based polymers were tested with three sludge types collected from different
WWTPs. Table 5 summarizes the sludge types and characteristics. WWTP Steinhof is one of
the very few large scale agricultural reuse sites in Germany. Sludge from WWTP
Schönebeck and Putzhagen is also used in agriculture after anaerobic digestion.
Table 5: Tested sludge types and characteristics
WWTP Sludge type
Dewatering/ thickening
Applied processes
Total Solids
in %
Synthetic polymer
Ruhleben Non-digested
mixed sludge
Centrifuge Primary sludge; Bio-P; Co-
precipitation; various sludge
sources
2.8 – 3.45
SUPERFLOC® C-2260
Wassmannsdorf Digested mixed sludge
Centrifuge Primary sludge; Bio-P, MAP-
precipitation after digestion
3.4 Eurofloc
DP4–60CT2
Schönebeck Excess sludge
Drum filter Bio-P 0.74 Eurofloc K7CZST
Steinhof Digested excess sludge
Centrifuge Bio-P; struvite-precipitation
2.8 – 3.5
PK1440
Putzhagen Excess sludge
Belt thickener Chemical
P-removal
0.6-0.8 Reiflock RF1204 A
2.2.2 Testing polymers
The polymers selected for use in this study are listed in Table 6. Two starch-based polymers,
Hydrex™ H0661 and H6864 (new products not yet on the market), are extracted from non-
genetically modified potatoes, which were provided by Veolia Water STI. Three PAM-based
polymers used for the respective WWTPs were tested as references. Blends of starch-based
and PAM-based polymers were tested in order to identify the case specific substitution
potential.

Chapter 2: Full-scale performance of selected starch-based biodegradable polymers in sludge dewatering and recommendations for application
31
Table 6: List of tested polymers
Product Molecular
weight
Charge Charge density Origin
HydrexTM H0661 High Cationic n.a. Starch
HydrexTM H6864 High Cationic High Starch
Eurofloc K7CZST
(Schönebeck)
High Cationic Medium PAM
POLY SEPAR®
PK1440 (Steinhof)
High Cationic n.a. PAM
Reiflock RF1204 A
(Putzhagen)
High Cationic Very High PAM
(n.a. = not accessible)
The PAM-based polymer make up should be done according to best-practice advice and
recommendations of polymer manufacturers. The synthetic polymer should mature at least
45 minutes and be consumed within 4 hours (DWA-M-366, 2013).
The H6864 and H0661 do not need any maturation time, but complete mixing should be
ensured. During the pilot and full-scale trials a mixing time of 15 minutes was sufficient using
an impeller mixer.
2.2.3 Jar Testing to determine optimal polymer dose (OPD)
In this study, a Jar testing titrimetric method was developed in order to determine the optimal
polymer dose. The reliability and validity of this method was repeatedly confirmed by testing
the original polymer demand in different WWTPs. The jar test was performed using two
starch-based polymers and the combination of PAM-based polymers. The equipment used
was a laboratory flocculator: solutions were observed in 4 parallel jars. The procedure of the
jar test was as follows:
For each Jar test 200 mL of sludge was filled in a 500 mL beaker and the predetermined
polymer solution, approximately 60% of the total hypothetical demand, was firstly dosed.
The mixed liquor was then stirred for 2 min at a speed of 200 rotations per minute (rpm).
Stirring was continued for another 5 min at a speed of 30 rpm.
The polymer demand was observed based on the change of the floc size as shown in
the example in Figure 14 with digested sludge from WWTP Stahnsdorf in Germany. If
required, another 2 ml of polymer, approximately 1 kg AS/ mega gram (Mg) total solids
(TS), was added until the larger floccules appeared and the optimum polymer dose was
reached.
The polymer solutions were made with tap water as in the full-scale plant and all
experiments were performed at ambient temperature (18-23°C). For all trials the

Chapter 2: Full-scale performance of selected starch-based biodegradable polymers in sludge dewatering and recommendations for application
32
planned blend, e.g. 50:50% of the synthetic and the “green” polymer, were prepared in a
mixed solution and dosed together.
Figure 14: Sludge floccules with different polymer doses
2.2.4 Drip-off test
In order to determine the achievable dry solids (DS) and shear stability of the formed sludge,
the Drip-off test was performed. For the drip-off test 200 ml sludge were dosed with the
optimum polymer demand and mixed at 200 rpm for 15 seconds. Then it was filtered through
a micro sieve with pore size of 100 μm. The accumulated permeate volume was documented
every 5–10 seconds until the volume in the graduated cylinder was stable (Kopp, 2013).
2.2.5 Pilot-scale test
Pilot-scale trials were conducted with the polymer HYDREX H6864 in cooperation with the
Institute of Sanitary and Environmental Engineering Braunschweig (ISWW). A pilot-scale
centrifuge, Hiller DP15-422, with a maximum capacity of 400 l/h was used for two sludge
types: mesophilic digested excess sludge and digested mixed sludge (mix of thermophilic
digested primary, mesophilic digested excess sludge and thermophilic digested co-substrate).
The sludge was tested with different polymer blends and compared to PAM-based polymer.
Both polymers were made with a concentration of 0.2 mass%. In order to confirm the correct
concentration the TS of the polymer solutions was measured for each sample.
The separation ratio was evaluated through the total suspended solids of the feed,
dewatered sludge and centrate, which is defined as:

Chapter 2: Full-scale performance of selected starch-based biodegradable polymers in sludge dewatering and recommendations for application
33
𝐒𝐞𝐩𝐚𝐫𝐚𝐭𝐢𝐨𝐧 𝐫𝐚𝐭𝐢𝐨 =(𝐓𝐒𝐒𝐟𝐞𝐞𝐝 − 𝐓𝐒𝐒𝐜𝐞𝐧𝐭𝐫𝐚𝐭𝐞) ∗ 𝐓𝐒𝐒𝐝𝐞𝐰𝐚𝐭𝐞𝐫𝐞𝐝 𝐬𝐥𝐮𝐝𝐠𝐞
(𝐓𝐒𝐒𝐝𝐞𝐰𝐚𝐭𝐞𝐫𝐞𝐝 𝐬𝐥𝐮𝐝𝐠𝐞 − 𝐓𝐒𝐒𝐜𝐞𝐧𝐭𝐫𝐚𝐭𝐞) ∗ 𝐓𝐒𝐒𝐟𝐞𝐞𝐝
∗ 𝟏𝟎𝟎 [%]
TSSfeed: total suspended solids of feed
TSSdewatered sludge: total suspended solids of dewatered sludge
TSScentrate: total suspended solids of centrate
The total solids content includes both the suspended solids and dissolved salts. The total
solids content is also used to determine a sludge dry weight (DS) in percent. In this paper
total solids (TS) and dry matter (DS) are regarded as being equivalent
The substitution potential is calculated with respect to the replaced amount of the synthetic
polymer considering the optimal polymer dose (OPD). The substitution potential is given in
the replaced amount (kg AS/Mg TS) as well as in %.
2.2.6 Full-scale tests
At WWTP Steinhof digested mixed sludge was centrifuged using a Flottweg Dekanter Z53
with addition of the synthetic polymer PK1440 and the starch-based polymer H6864 added.
The centrifuge was started and torque, differential speed and polymer dose was adapted in
order to achieve a minimum separation ratio of 90 % and the highest possible TS of the
dewatered sludge. The sludge flow was kept constant at 20 m3/h and the TS value of the
sludge to be dewatered was between 2.8-3.1%. Total solids (TS), loss on ignition (LOI) and
total suspended solids (TSS) measurements were carried out on site as well by the
laboratory of WWTP Steinhof. The subsequent pipeline was approximately 15 m long, thus a
contact time of 45 – 55 s for the H6864 was achieved. The centrifuge was operated over
night with the synthetic polymer PK1440 and after a stable operation was achieved the
reference sample was taken in the morning. The starch-based polymer was added in
increments of 10 % over the next few hours, reducing the synthetic polymer mass ratio from
70% to 50%.
At WWTP Schönebeck a drum filter was used for thickening. The starch-based polymer
H6864 was tested with sludge 17 m3/h with an average polymer demand of approximately
4.5 kg AS/Mg TS. The synthetic and the starch-based polymers were mixed once the
synthetic polymer was saturated. A blend with 0.1 % AS was prepared. The blend was dosed
into the sludge stream just before entering the flocculation tank. After flocculation, the sludge
mixture passed to the drum filter where a stainless steel sieve was used for separation. The
mesh size was 400 µm.
Full-scale trials were also performed at WWTP Gütersloh for two days. The excess sludge
was treated using a Bellmer Turbodrain Compact TDC 08 belt thickener, with a sieve
diameter of 0.7 mm. Excess sludge entered the process with 0.6-0.8% TS at a sludge flow of
27 m³/h; retention time on the belt was approx. 2 minutes, thickened sludge contained 4-6%
Chapter 2: Full-scale performance of selected starch-based biodegradable polymers in sludge dewatering and recommendations for application
34
DS. In the continuous process the cationic polymer (Reiflock RF 1204 A, 48% TS) and
starch- based polymer H0661 were dosed at a flow of 1 m³/h, with 0.1% dilution (polymer
solution), meaning 0.048% AS and 2.7 kg AS/Mg DS.
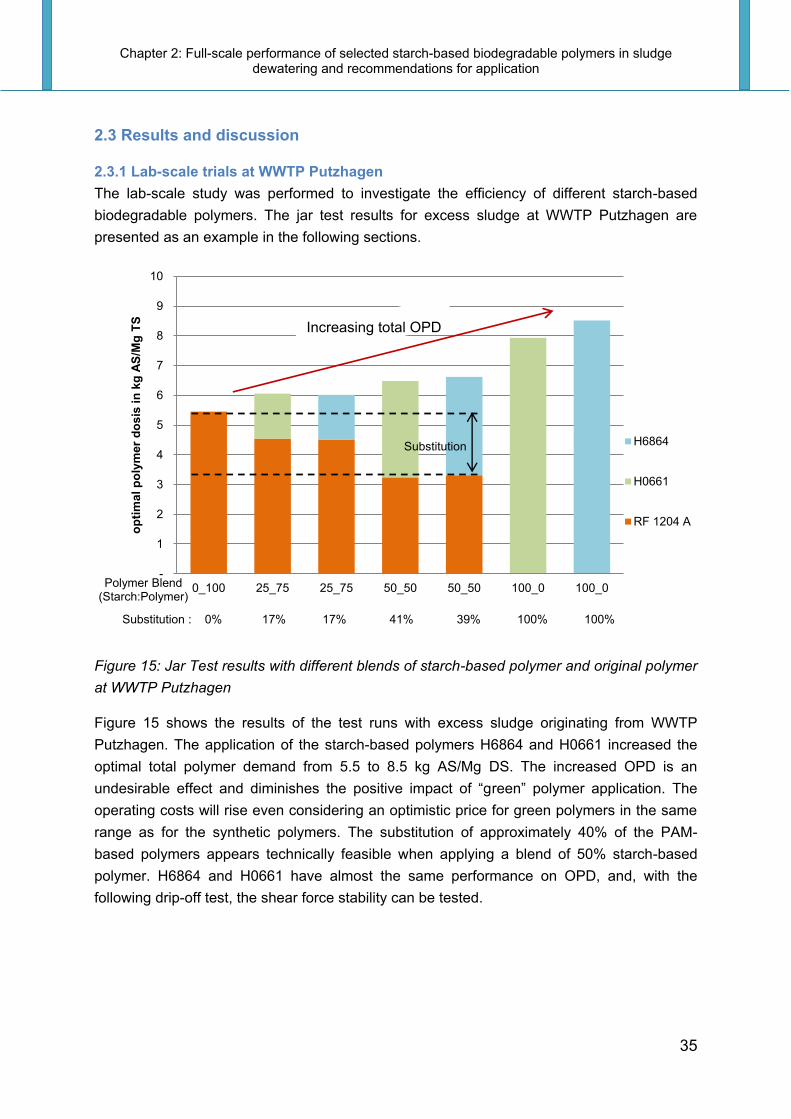
Chapter 2: Full-scale performance of selected starch-based biodegradable polymers in sludge dewatering and recommendations for application
35
2.3 Results and discussion
2.3.1 Lab-scale trials at WWTP Putzhagen
The lab-scale study was performed to investigate the efficiency of different starch-based
biodegradable polymers. The jar test results for excess sludge at WWTP Putzhagen are
presented as an example in the following sections.
Figure 15: Jar Test results with different blends of starch-based polymer and original polymer
at WWTP Putzhagen
Figure 15 shows the results of the test runs with excess sludge originating from WWTP
Putzhagen. The application of the starch-based polymers H6864 and H0661 increased the
optimal total polymer demand from 5.5 to 8.5 kg AS/Mg DS. The increased OPD is an
undesirable effect and diminishes the positive impact of “green” polymer application. The
operating costs will rise even considering an optimistic price for green polymers in the same
range as for the synthetic polymers. The substitution of approximately 40% of the PAM-
based polymers appears technically feasible when applying a blend of 50% starch-based
polymer. H6864 and H0661 have almost the same performance on OPD, and, with the
following drip-off test, the shear force stability can be tested.
-
1
2
3
4
5
6
7
8
9
10
0_100 25_75 25_75 50_50 50_50 100_0 100_0
op
tim
al p
oly
mer
do
sis
in
kg
AS
/Mg
TS
Polymer Blend (Starch:Polymer)
H6864
H0661
RF 1204 A
Substitution : 0% 17% 17% 41% 39% 100% 100%
Increasing total OPD
Substitution

Chapter 2: Full-scale performance of selected starch-based biodegradable polymers in sludge dewatering and recommendations for application
36
Figure 16: Results of Drip-off test at WWTP Putzhagen
Figure 16 provides the results of drip-off test with different blends of starch and PAM-based
polymers. The clearly lower volume for the samples treated with blends can be explained by
smaller flocs formed by the starch-based polymer. The flocs break while being mixed and
transferred to the filtration unit. The small flocs block the 100 μm sieve and clogging is
prevented by proper filtration. The starch-based H0661 shows a better performance with
higher filtration volume than H6864. For this reason H0661 was chosen for further full-scale
investigations.
Figure 17: Substitution potential according to polymer blend and sludge type
0
30
60
90
120
150
180
210
0 20 40 60 80 100 120
Dro
po
ff v
olu
me
in
ml
Time in s
Reference: RF1204A
H0611 : RF1204A=25:75
H6864 : RF1204A=25:75
H0661 : RF1204A=50:50
H6864 : RF1204A=50:50

Chapter 2: Full-scale performance of selected starch-based biodegradable polymers in sludge dewatering and recommendations for application
37
Further laboratory scale trials were carried out to test the effect of starch-based polymer for
different sludge type. Figure 17 describes the substitution potential with respect to the used
polymer blend and the tested sludge types. The angle of the bisector indicates the total
polymer demand for the reference. The total polymer demand with starch-based polymer
blend increased for some of the sludge types, thus the substitution potential decreases. Both
types of excess sludge tested at WWTP Schoenebeck and WWTP Ruheleben were more
suitable for the application of the starch-based polymer than sludge from other sources.
In general, testing different sludge with varying blends of PAM-based and starch-based
polymers gave a broad overview of the feasibility and applicability of starch-based polymers.
Applying a blend of starch-based and PAM-based polymer can increase the total polymer
demand and therefore the substitution potential has to be calculated accordingly. The flocs
showed lower shear stability and are therefore less suitable for process steps requiring
strong flocs, e.g. dewatering with centrifuges. In order to introduce a green polymer as an
alternative or a partial substitute for PAM-based polymers, the applicability in full-scale
processes has to be proved.
2.3.2 Pilot-scale trials at WWTP Steinhof
The pilot-scale centrifuge can be used to predict the full-scale dewatering results. Different
dosing and mixing conditions were tested during the pilot-scale trials, and the best setup
identified was dosing the starch-based polymer H6864 prior to the PAM-based polymer PK
1440. The H6864 has cationic charge that allows for surface particle neutralization resulting
in flocculation. The PAM-based PK 1440 has the ability to bridge together particles
suspended in the solution by an adsorption process. For each trial run the differential speeds
as well as the total polymer dose were adapted balancing the TS of the dewatered sludge
and the quality of the centrate, i.e. the separation ratio. The bowl speed was kept at 6000
rpm, except of the one trial run dosing 100 % of H6864. Due to the insufficient results with
the starch-based polymer alone, a bowl speed of 3400 rpm was used. Apart from this
particular trial run, the differential speed was kept between 1.4 – 2 rpm trying to achieve a
high torque, thus increasing the DS of the dewatered sludge. For the trial run with 100 % of
H6864 the differential speed was set to 5 rpm. Table 7 summarizes the operational
parameters for the pilot-scale centrifuge and gives the sludge characteristics throughout the
trials.
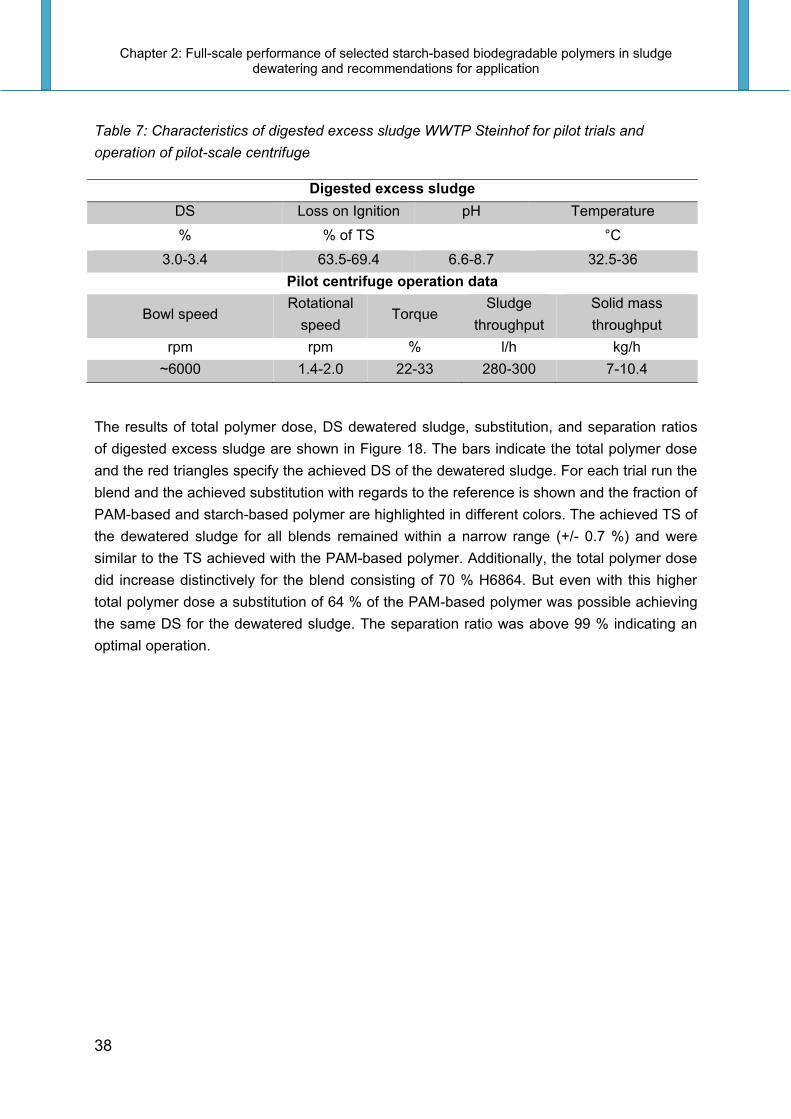
Chapter 2: Full-scale performance of selected starch-based biodegradable polymers in sludge dewatering and recommendations for application
38
Table 7: Characteristics of digested excess sludge WWTP Steinhof for pilot trials and
operation of pilot-scale centrifuge
Digested excess sludge
DS Loss on Ignition pH Temperature
% % of TS °C
3.0-3.4 63.5-69.4 6.6-8.7 32.5-36
Pilot centrifuge operation data
Bowl speed Rotational
speed Torque
Sludge
throughput
Solid mass
throughput
rpm rpm % l/h kg/h
~6000 1.4-2.0 22-33 280-300 7-10.4
The results of total polymer dose, DS dewatered sludge, substitution, and separation ratios
of digested excess sludge are shown in Figure 18. The bars indicate the total polymer dose
and the red triangles specify the achieved DS of the dewatered sludge. For each trial run the
blend and the achieved substitution with regards to the reference is shown and the fraction of
PAM-based and starch-based polymer are highlighted in different colors. The achieved TS of
the dewatered sludge for all blends remained within a narrow range (+/- 0.7 %) and were
similar to the TS achieved with the PAM-based polymer. Additionally, the total polymer dose
did increase distinctively for the blend consisting of 70 % H6864. But even with this higher
total polymer dose a substitution of 64 % of the PAM-based polymer was possible achieving
the same DS for the dewatered sludge. The separation ratio was above 99 % indicating an
optimal operation.
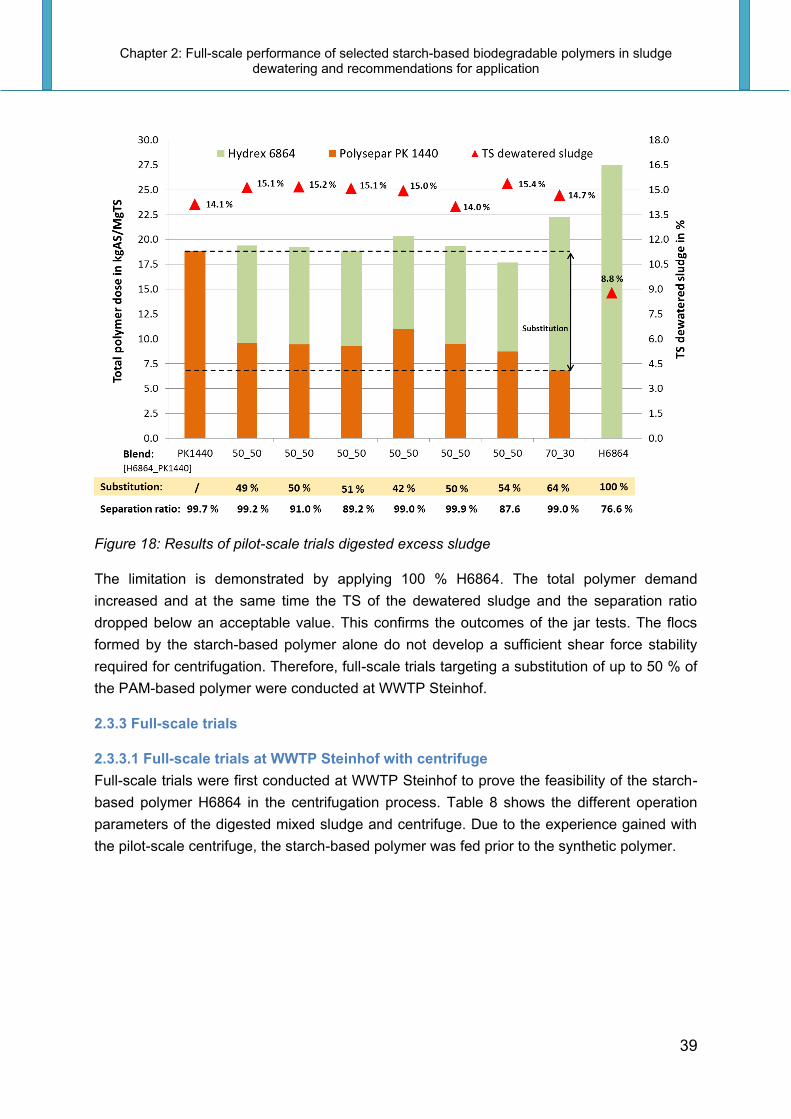
Chapter 2: Full-scale performance of selected starch-based biodegradable polymers in sludge dewatering and recommendations for application
39
Figure 18: Results of pilot-scale trials digested excess sludge
The limitation is demonstrated by applying 100 % H6864. The total polymer demand
increased and at the same time the TS of the dewatered sludge and the separation ratio
dropped below an acceptable value. This confirms the outcomes of the jar tests. The flocs
formed by the starch-based polymer alone do not develop a sufficient shear force stability
required for centrifugation. Therefore, full-scale trials targeting a substitution of up to 50 % of
the PAM-based polymer were conducted at WWTP Steinhof.
2.3.3 Full-scale trials
2.3.3.1 Full-scale trials at WWTP Steinhof with centrifuge
Full-scale trials were first conducted at WWTP Steinhof to prove the feasibility of the starch-
based polymer H6864 in the centrifugation process. Table 8 shows the different operation
parameters of the digested mixed sludge and centrifuge. Due to the experience gained with
the pilot-scale centrifuge, the starch-based polymer was fed prior to the synthetic polymer.

Chapter 2: Full-scale performance of selected starch-based biodegradable polymers in sludge dewatering and recommendations for application
40
Table 8: Operational parameters of sludge and centrifuge Operation data at WWTP Steinhof
Digested mixed sludge
TS LOI pH Temperature
% % of TS °C
2.8-3.1 70.2-72.4 7.1-7.4 32.5-36
Centrifuge operation data
Bowl speed Rotational speed Torque Sludge throughput Solid mass throughput
rpm rpm % m³/h kg/h
~3000 1.3-3.0 28-30 20 566-614
Figure 19 illustrates the used polymer dose, TS dewatered sludge, substitution, the
separation ratio as well as the achieved TS of the dewatered sludge with respect to the
reference synthetic polymer PK1440.
Figure 19: Results of full-scale trials digested mixed sludge at WWTP Steinhof
The achieved TS of the dewatered sludge were within an acceptable range from 23.2-25.7%.
The separation ratio of blends was lower compared to the reference PK1400 alone with a
separation ratio of 90.2%. For the later trials 50_50 the actual ratio differed slightly, because
the dosing concentration of the H6864 was slightly lower than planned. According to the
results, a substitution ratio of 34% can be achieved without decreasing of the sludge TS.

Chapter 2: Full-scale performance of selected starch-based biodegradable polymers in sludge dewatering and recommendations for application
41
In order to increase the separation ratio to an acceptable level, further trial runs optimizing
the operational set-up are required. Torque and differential speed were adapted during the
tests discussed. With regards to the experience gained with the pilot-scale centrifuge, these
adjustments could improve the separation ratio.
2.3.3.2 Full-scale trials at WWTP Schönebeck with drum filter
Jar tests and drip off tests were conducted to support the full-scale tests at WWTP
Schönebeck using drum filter. The promising results for blends of synthetic and starch-based
polymers H6864 showed a substitution of up to 67.5 % of the synthetic polymer, the shear
stability still need to be confirmed in full-scale. On the other hand, flocculation with the
starch-based polymers H6864 alone did not show a sufficient flocculation for excess sludge
at WWTP Schönebeck. To prove the sludge flocculation in full-scale, a one mega gram blend
consisting of 50 % of the starch-based polymer was first tested. After stable operation was
achieved, samples were collected for detailed analysis. The result is given in Figure 20.
Reference 1 and 2 with the synthetic polymer K7CZST were measured before and after the
blend test with DS of thickened sludge of about 6%. During the tests with a 50% blend of
H6864 and K7CZST, the sludge TS decreased to 3.7 and 3.8, which shows a lower stability
of sludge flocs. Due to the low TS concentration of sludge, 100% of H6864 has not been
further tested, instead, the H6864 fraction was reduced to 1/3 (33_66) and tested in full sale
again. The achieved TS values of the thickened sludge for the blends with a 33% H6864
fraction were between 4.3% and 4.9%, which was still below the reference of 6%. According
to the WWTP operator, a value of about 4.5% was still acceptable.
Figure 20: Results of full-scale trials with excess sludge at WWTP Schönebeck

Chapter 2: Full-scale performance of selected starch-based biodegradable polymers in sludge dewatering and recommendations for application
42
Full-scale tests were performed for the excess sludge using a drum filter with a blend of a
starch-based polymer and a synthetic polymer. The formed flocs were shredded within the
drum sieve due to insufficient shear stability. A maximum substitution of 31% was possible
with an acceptable sludge TS. Due to a low shear stress on the belt filter press systems, this
technology might be applicable. Further full-scale trials with a belt thickener were planned at
WWTP Putzhagen.
2.3.3.3 Full-scale trials at WWTP Putzhagen (Gütersloh) with belt thickener
The results of the lab experiments are shown in Chapter 2.3.1. The starch-based polymer
H0661 has a better performance with the drip-off tests. In Figure 21, different blends of
H0661 and RF 1204 were tested: 25:75, 33:66, 50:50 and 66:33. According to the
experience of the WWTP operator, achieving sludge TS with a ratio above 4% has shown
good results for the belt thickener. As shown in Figure 9, 33% substitution of the polymer RF
1204 is an acceptable quantity limit for operators. Substituting 50% of the reference polymer
RF 1204 leads to an insufficient TS below 4%. Thus, a blend of polymer and starch showed
promising results for excess sludge thickening with a belt filter. The critical limit (maximum
ratio) of starch is 33%. According to the experience of the WWTP operator, 25% substitution
with a starch-based polymer will be a “safe” option.
Figure 21: Results of full-scale trials with excess sludge at WWTP Putzhagen

Chapter 2: Full-scale performance of selected starch-based biodegradable polymers in sludge dewatering and recommendations for application
43
2.4 Conclusion
The main objective of this chapter was to identify a starch-based eco-friendly polymer that
demonstrates a similar performance for full-scale sludge dewatering. Based on the results of
different sludge types and dewatering units, the following summary can be made:
Non-digested excess sludge showed more suitable characteristics for the treatment with
a starch-based polymer, and a 70% substitution potential can be achieved.
A substitution of 20% - 30% of the PAM-based polymer was demonstrated achieving
similar DS of the dewatered sludge with different dewatering devices.
Optimization of operational parameters as well as machinery setup is recommended to
achieve a high substitution potential.
In conclusion, a successive approach through screening, lab-scale and pilot-scale trials
paved the way for full-scale trials of testing starch-based polymers. The feasibility of using a
starch-based green polymer in full-scale dewatering was shown. Based on the current
selected starch-based polymer product, a partial substitution of 25-30 % of the synthetic
polymer can be achieved. With further development of the product, decreasing the product
price and optimization of the dewatering devices in the near future, starch-based polymers
have a great potential as an alternative flocculants to synthetic polymers.

Chapter 3: Comparative Environmental Life Cycle Assessment of phosphorus recovery with different generations of the Airprex® reactors at WWTP Waßmannsdorf and Amsterdam West
44
Chapter 3: Comparative Environmental Life Cycle
Assessment of phosphorus recovery with different
generations of the Airprex® reactors at WWTP
Waßmannsdorf and Amsterdam West
Graphical abstract
Highlights:
P mass balance for both WWTPs was given
Comparison of two different AirPrex® reactor systems was conducted
LCA process data were taken from the full-scale phosphorus recovery plant
Cumulative fossil energy demand was calculated
Environmental impact (Climate change, Eutrophication) was assessed
A modified preprint version of this chapter is submitted to Springer journal “International
Journal of Environmental Science and Technology” (Date of submission 09 Nov 2017):
Zhou, K. *, Remy, C., Kabbe C., Barjenbruch, M. (2017): A comparative environmental life
cycle assessment for phosphorus recovery at WWTP Amsterdam West and Waßmannsdorf

Chapter 3: Comparative Environmental Life Cycle Assessment of phosphorus recovery with different generations of the Airprex® reactors at WWTP Waßmannsdorf and Amsterdam West
45
3.1 Phosphorus recovery with Airprex® Process
Various technologies are currently being developed to recover P by crystallization or
precipitation from wastewater and sludge (Kabbe et al., 2015). The AirPrex® technology is
one of the promising technologies for phosphorus recovery from sludge liquid of digested
sludge. The AirPrex® technology was first developed by the “Berliner Wasserbetriebe (BWB)”
after being affected by massive incrustations at their plant. The incrustations found in the
centrifuges of WWTPs were later proved to consist mainly of struvite with small portions of
different calcium phosphate compounds (Heinzmann & Engel, 2006). The advantages of the
AirPrex® process are not only P-recovery, but also economic benefits for the WWTP
operation. About 70% of the economic benefits of the AirPrex® process come from reduction
of the handling costs of biosolids and polymers costs. About 20% of the savings are due to
lower maintenance requirments associated with struvite and 10% is the potential revenue
from fertilizer sales (Rulseh, 2015).
Figure 22: Principe of AirPrex® technology ©CNP (Forstner, 2015)
In the AirPrex® process, the digested sludge is led through a so-called “airlift reactor”, in
which air is used to create internal recycle flows (Figure 22). The aeration has two functions.
First, it increases the pH value from 7 to 8 by stripping CO2 from the digested sludge. Second,
it creates a loop convection within the reactor by central air injection and the baffles is to
initiate inner upflow and outer downflow of sludge. The airlift reactor sets the retention time of
the growing struvite crystals, which sink to the bottom when reaching a certain size.
Ammonium ions (NH4+) and phosphate ions (PO4
3-) are present in sufficient concentrations in
the digested sludge. By adding magnesium ions (Mg2+), usually as magnesium chloride
(MgCl2), to the reactor, struvite (NH4MgPO4·6H2O) is formed. The formed Struvite crystals
are suspended in the sludge until they reached a limited size, where their sink rate faster

Chapter 3: Comparative Environmental Life Cycle Assessment of phosphorus recovery with different generations of the Airprex® reactors at WWTP Waßmannsdorf and Amsterdam West
46
than the circulation rate. Struvite has a density of 1.7 g/cm³ and therefore can be collected at
the bottom of the reactor. It is then separated from organic residues by a sand washer.
Afterwards, the crystals are atmospherically dried and the product is brought to the market or
user.
The patent of the AirPrex® technology was held by Berliner Wasserbetriebe (BWB) and since
2013 the license is obtained by CNP-Technology Water and Biosolids GmbH in Hamburg,
Germany. At the moment, eight full-scale plants are in operation. In these plants 80–90% of
the phosphate is removed from the liquid phase of the digested sludge as struvite (CNP,
2017b). Table 9 gives an overview of the current operational plants.
Table 9: List of full-scale AirPrex® technology (CNP, 2017b)
Country Location and Operator Operational
since
Personal
equivalent
Capacity
of
AirPrex®
Design
struvite
production
p.e. m³/d kg/d
Germany MG-Neuwerk,
Niersverband 2009 995,000 1500 1000
Germany Wassmannsdorf,
Berliner Wasserbetriebe 2010 1,400,000 2400 2000
Netherlands
Echten,
Drents Overijsselse
Delta
2013 190,000 400 500
Netherlands Amsterdam-West,
Waternet 2014 1,000,000 2500 3500
Germany Uelzen,
SE Uelzen 2015 83,000 145 n.a.
Germany Salzgitter Nord,
ASG 2015 150,000 240 n.a.
Germany Wolfsburg,
SE Wolfsburg 2016 170,000 280 n.a.
China Tianjin,
Tianjin CEPG 2016 1,000,000 1600 n.a.
(n.a. = not accessible)
The first installation of AirPrex® at WWTP Wassmannsdorf (WMD) in Berlin and the largest
AirPrex® plant at WWTP Amsterdam West (AMS) were chosen for comparison in this study.
The AirPrex® system in Berlin has only one big reactor, while in Amsterdam there are three
separated reactors. The AirPrex® system in Amsterdam has higher struvite yield, but with
higher energy demand and more materials used for the infrastructure compared to
Wassmannsdorf. The objective of this study is to compare the environmental impact of the
two AirPrex® reactor systems. The ultimate goal of this study is to develop an analysis that
could assist decision-makers in considering environmental effects when designing new
AirPrex® processes in different treatment plants.

Chapter 3: Comparative Environmental Life Cycle Assessment of phosphorus recovery with different generations of the Airprex® reactors at WWTP Waßmannsdorf and Amsterdam West
47
3.2 P mass balance and AirPrex® reactor in WWTP Amsterdam West and
Wassmannsdorf
3.2.1 AirPrex process in WWTP Wassmannsdorf
WWTP Wassmannsdorf currently has a daily treatment capacity of 180,000 m³ of wastewater
daily during dry weather. The sludge treatment lines include three centrifuges for excess
sludge thickening, six digesters each with a volume of 8,000 m³ and five centrifuges for
sludge dewatering (BWB, 2017b).
Figure 23: Process scheme and P mass balance of WWTP Wassmannsdorf (modified)
(Forstner, 2015)
Figure 23 shows the process scheme and P balance of WWTP Wassmannsdorf. About 96.7%
of total phosphate was eliminated from wastewater to sludge. In the AirPrex® reactor, 87% of
the orthophosphate was removed from the sludge liquid phase, but the real P harvesting in
struvite was only about 14% with regards to the dissolved orthophosphate in the sludge.
About 74% of the produced struvite was still contained in the dewatered sludge. This part of
struvite and the residual phosphorus were incinerated. In Wassamnsdorf, a part of the
dewatered sludge (16% of DM) is transported to the mono-incineration plant in Berlin-
Ruhleben, while the rest (50% of DM) is transported to different lignite power plants for co-
incineration (Remy, 2012). In order to utilize the thermal energy of sludge completely and
recover more phosphorus in accordance with the new sewage sludge ordinance, the BWB
will start the construction of a mono-incineration plant in 2022 (BWB, 2017a)

Chapter 3: Comparative Environmental Life Cycle Assessment of phosphorus recovery with different generations of the Airprex® reactors at WWTP Waßmannsdorf and Amsterdam West
48
Figure 24: AirPrex® reactor at WWTP Wassmannsdorf (Wendl, 2013)
To solve the operational problem of struvite crystallization in pipes and pumps, the BWB built
the first AirPrex® reactor (Figure 24) in 2009 which was put in operation in March 2010. The
AirPrex® process in Berlin is a one reactor system with a volume of 800 m³. Using air
stripping (2000-3000 m³/h), the CO2 in the sludge is stripped and the pH value in the rector
increases from 7.2 to 7.8-8 (Heinzmann & Lengemann, 2011). After adding 5.3 L 30%
magnesium chloride solution per cubic meter sludge (Mg:P molar ratio=1.7), the dissolved
orthophosphate concentration in the sludge water decreases by 87%, on average from 387
mg/l to 49 mg/l in 2016 (Lengemann, 2017). The sludge retention time in the reactor is about
10.5 hours. The energy demand for the AirPrex system is 2.2 kWh/m3 sludge.
3.2.2 Airprex process in WWTP Amsterdam West
WWTP Amsterdam West is one of the largest WWTP of WATERNET in the Netherlands. It
was opened in 2005 and has a treatment capacity of 168,000 m3/d of dry weather influent. At
the WWTP Amsterdam West (in total 1 million people equivalent), using enhanced biological
phosphorus removal, massive scaling problems occurred after digestion of the primary and
secondary sludge. In order to solve the operational problems, the Airprex® process was
implemented in 2014, and the WWTP Amsterdam West has become one of Europe's largest
production facilities of struvite. Figure 25 shows the process scheme and P balance at
WWTP Amsterdam West.

Chapter 3: Comparative Environmental Life Cycle Assessment of phosphorus recovery with different generations of the Airprex® reactors at WWTP Waßmannsdorf and Amsterdam West
49
Figure 25: Process scheme and P mass balance of WWTP Amsterdam West (modified)
(Forstner, 2015)
The WWTP Amsterdam West does not only process the sludge from its own treatment
(approx. 91 t DS/d), but also that of the nearby WWTP Westpoort and that of some other
external sources (approx. 13 t DS/d). The external sludge is collected in the Central Sludge
Intake. The primary sludge is thickened by gravity thickeners and the secondary sludge by
belt thickeners. After that, all sludge is treated in anaerobic digesters, where the sludge is
stabilized, its volume is reduced and biogas is produced. At last, the sludge is dewatered in
bowl centrifuges, after which it is transported for incineration in a waste incineration plant
(Bergmans, 2011; Veltman, 2016).

Chapter 3: Comparative Environmental Life Cycle Assessment of phosphorus recovery with different generations of the Airprex® reactors at WWTP Waßmannsdorf and Amsterdam West
50
Figure 26: The Airprex® reactor at WWTP Amsterdam west (Veltman, 2016)
The Airprex® process at WWTP Amsterdam West was launched in Dezember 2013. As
shown in Figure 26, the Airprex® system includes three reactors. The first a volume of 500 m³
and the second reactor a volume of 250 m³ are with air stripping and magnesium chloride
dosing. In total 1000 Nm³/h of air are dosed in the first two reactors. The total residence time
of sludge is between 8 to 10 hours depending on the sludge flow. The third reactor is used
only for struvite settling with a volume of 250 m³. Two magnesium chloride storage tanks
have a volume of 50 m³ each. With the three reactor systems, the harvesting efficiency of
struvite can achieve 21% with regards to the dissolved ortho-P in the digester sludge.
3.2.3 Comparison of Airprex system in WWTP Wassmannsdorf and Amsterdam West
The difference between the AirPrex® system in WWTP Wassmannsdorf (WMD) and in
WWTP Amsterdam West (AMS) is described in Table 10. WWTP AMS has a higher
harvesting efficiency of struvite due to the reactor design. The three separate reactor
systems have a lower sludge retention time, but achieve a better separation of crystals from
sludge due to a better crystallization condition in the first two reactors and an additional quiet
condition for struvite precipitation in the third reactor. The WMD reactor (33 Nm³ air /m³
sludge) has more than twice the amount of air pumped into the sludge than in AMS (15
Nm³/m³), but the energy demand of WMD is lower than in AMS. This is mainly due to the
sludge transport between three reactors system. Data of operational benefits show that the
AirPrex® reactor installed in AMS is more efficient than the one in Berlin. AMS achieved a
higher sludge dewatering improvement and polymer saving after using the AirPrex® system.
By aeration and pH increase, the ammonia gas is stripped with CO2 from liquid phase to gas
phase. The AirPrex® reactor in WMD is uncovered and emits ammonia directly into the air,
while the aeration reactor in AMS is closed and the exhaust gas is treated in a biofilter.
However, it is to be considered that, the AirPrex® system in AMS has a higher demand for
energy, magnesium chloride doses and infrastructure. For a more accurate comparison of
the environmental impacts of the both reactors, Life Cycle Assessment (LCA) was used to

Chapter 3: Comparative Environmental Life Cycle Assessment of phosphorus recovery with different generations of the Airprex® reactors at WWTP Waßmannsdorf and Amsterdam West
51
evaluate the cumulative energy demand, the Greenhouse Gas emission and Eutrophication
potential.
Table 10: Comparison of AirPrex® Systems in WWTP Wassmannsdorf and Amsterdam West
(Lengemann, 2017; Veltman, 2016; Wendl, 2013)
WWTP
Unit WWTP
Wassmannsdorf WWTP Amsterdam West
Person equivalent p. e. 1,400,000 1,000,000
Sludge volume m³/a 664,300 600,000
TSS % 5.89 6
TS sludge t/a 39,127 36,000
AirPrex reactor
Dissolved PO4-P Input mg/l 387 400
Dissolved PO4-P Output mg/l 49 20
PO4-P Precipitation
efficiency % 87 95
MgCl2 dosing mol Mg/mol
P 1.7 1.9
Sludge hydraulic
residence time in all
reactors
h 10.5 9
Air pumping m³/h 2500 1000
Energy Demand kWh/m3 2.2 2.4
Sludge Dewatering
TS improvement % 2%
(from 25% to 27%)
2.5%
(from 21% to 23.5%)
Polymer Saving g/kg TSS 3
(from12 to 9)
4
(from 17 to 13)
Struvite Harvesting
Product harvesting ton/a 360 500
Share of struvite in total
solids product % 78 80
Harvesting efficiency
(P in Product/dissolved P
in sludge)
% 14% 21%

Chapter 3: Comparative Environmental Life Cycle Assessment of phosphorus recovery with different generations of the Airprex® reactors at WWTP Waßmannsdorf and Amsterdam West
52
A total of EUR 2.3 million was invested for the one reactor AirPrex® system in WMD (Egle,
2014) while in AMS EUR 3 million was invested for the three reactor AirPrex® system
(Veltman, 2016). It is estimated that in AMS the savings of installation of AirPrex® reactor is
EUR 500,000 million per year, (from that total benefits of EUR 1.2 million per year and
operational costs of EUR 700,000 million per year) with return on investment (ROI) of 6 years.
Chapter 3: Comparative Environmental Life Cycle Assessment of phosphorus recovery with different generations of the Airprex® reactors at WWTP Waßmannsdorf and Amsterdam West
53
3.3 Methodology and system details
3.3.1 Methodology of Life Cycle Assessment
Life Cycle Assessment is an internationally standardized method for the evaluation of the
environmental burdens and resources consumed along the life cycle of products or
processes (ISO-14040, 2006; ISO-14044, 2006). For assessing technical processes and
systems in their potential environmental impacts, the method of Life Cycle Assessment (LCA)
has been developed and applied widely within research and industry (Grahl, 2009), also in
the field of wastewater and sludge treatment (Corominas et al., 2013; Remy et al., 2012;
Wenzel et al., 2008).
Typical environmental effects that can be assessed using LCA include eutrophication, global
warming, human health, and air acidification. LCA can be used to analyze the differences in
environmental effect between multiple processes that accomplish the same task or function.
Umberto® NXT LCA is a software package providing a graphical interface for life cycle
assessment. Umberto® NXT LCA is licensed and maintained by ifu Hamburg GmbH (Institut
für Umweltinformatik). Umberto® NXT LCA supports environmental consultants, process
engineers, and process technicians in developing comprehensive analyses of product life
cycles.
Ecoinvent is a commercial database set for life cycle assessment of the Ecoinvent
Association, which was originally known as the Ecoinvent Centre, the Swiss Centre for Life
Cycle Inventories. The Ecoinvent database is one of the market leaders in this field. The
Ecoinvent version 3 is the latest database of the provider. It contains more than 11,500 data
sets and offers a lot of new and updated data sets (IFU, 2017).
3.3.2 Goal and scope definition
The purpose of this study is to quantify the life cycle environmental impacts of different
reactor systems for the Airprex process. The assessment is based on a reference system,
which is defined as the sludge line treating the mixed sludge of WWTP Wassmannsdorf. The
following relevant side effects on the sludge treatment or the mainstream WWTP are
considered:
Demand of electricity, chemicals
Product yield (t/a P) and quality
Substitution of mineral fertilizer production (only P and N accounted)
Side effects (return load, dewatering)
The function unit is chosen as sludge treatment and disposal of annual load in WMD (39127 t
TS/a). The sludge treatment line can represent the view from the WWTP operator for the
effect of sludge treatment. An alternative F.U. is chosen as 1 kg P product. This P-fertilizer
perspective (1 kg P) gives information about the environmental impact of one kg recovered P.
The ultimate goal of this study is to develop an analysis that could assist decision-makers
(engineers, owners, regulators, etc.) in considering environment effects when optimizing or
designing new AirPrex® processes in the treatment plants.
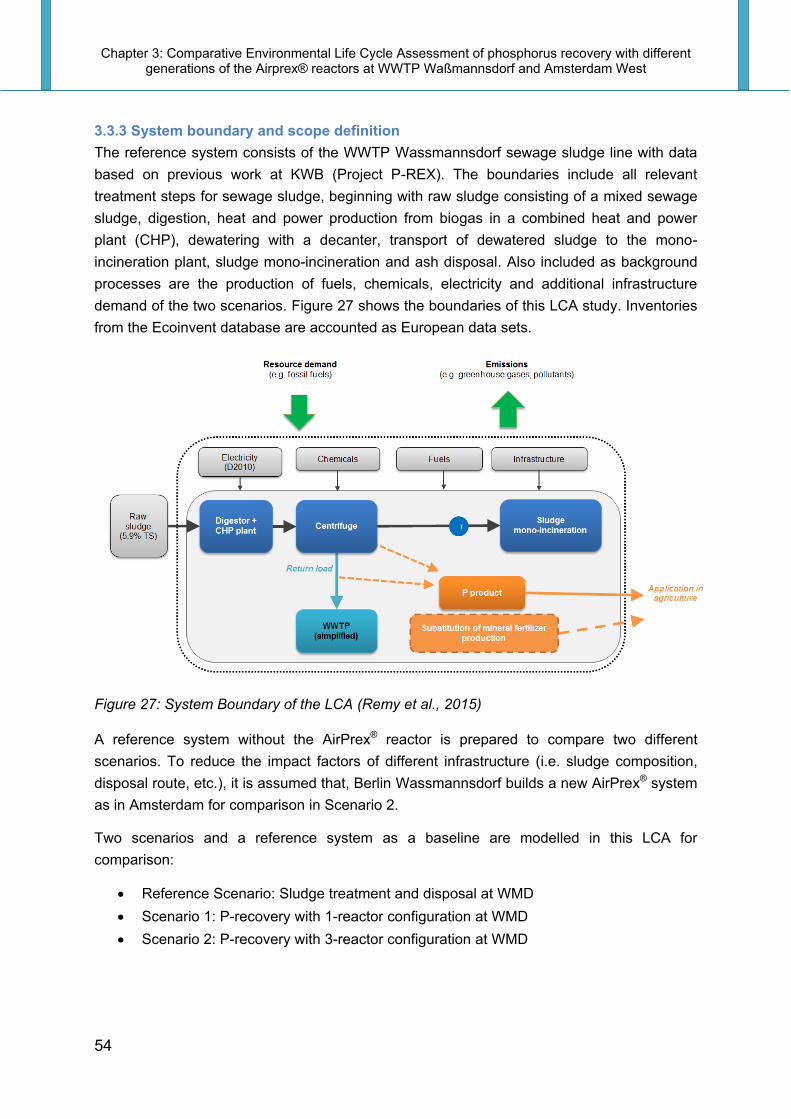
Chapter 3: Comparative Environmental Life Cycle Assessment of phosphorus recovery with different generations of the Airprex® reactors at WWTP Waßmannsdorf and Amsterdam West
54
3.3.3 System boundary and scope definition
The reference system consists of the WWTP Wassmannsdorf sewage sludge line with data
based on previous work at KWB (Project P-REX). The boundaries include all relevant
treatment steps for sewage sludge, beginning with raw sludge consisting of a mixed sewage
sludge, digestion, heat and power production from biogas in a combined heat and power
plant (CHP), dewatering with a decanter, transport of dewatered sludge to the mono-
incineration plant, sludge mono-incineration and ash disposal. Also included as background
processes are the production of fuels, chemicals, electricity and additional infrastructure
demand of the two scenarios. Figure 27 shows the boundaries of this LCA study. Inventories
from the Ecoinvent database are accounted as European data sets.
Figure 27: System Boundary of the LCA (Remy et al., 2015)
A reference system without the AirPrex® reactor is prepared to compare two different
scenarios. To reduce the impact factors of different infrastructure (i.e. sludge composition,
disposal route, etc.), it is assumed that, Berlin Wassmannsdorf builds a new AirPrex® system
as in Amsterdam for comparison in Scenario 2.
Two scenarios and a reference system as a baseline are modelled in this LCA for
comparison:
Reference Scenario: Sludge treatment and disposal at WMD
Scenario 1: P-recovery with 1-reactor configuration at WMD
Scenario 2: P-recovery with 3-reactor configuration at WMD

Chapter 3: Comparative Environmental Life Cycle Assessment of phosphorus recovery with different generations of the Airprex® reactors at WWTP Waßmannsdorf and Amsterdam West
55
Reference input flows:
The reference input sludge flow is defined as the mixed sludge in Wassmannsdorf, which
enter the system of sludge handling. The quantity and quality of the mixed sludge in WWTP
Wassmannsdorf are given or measured by the BWB staff in 2016.
Table 11: Site Specific Data for reference system at WWTP Wassmannsdorf 2016
(Lengemann, 2017)
Input mixed sludge
Annual Load Concentration
Parameter Value Unit Value Unit
Volume 664,300 m³/a
Dry matter 39,127,270 kg/a 5.89 %
Organic dry matter 3,208,436 kg/a 82 % of dry matter
COD 30,816,877 kg/a 4639 mg/l
Total nitrogen 2,120,698 kg/a 54.2 mg/kg
Phosphorus 1,074,044 kg/a 27.45 mg/kg
Indicators of Life Cycle Impact Assessment:
There are different areas of protection declared in ISO 14044, but according to the goal of
the LCA study only cumulative energy demand and the natural environment are considered.
For the environmental impacts assessed in this study, the following indicators are relevant:
Cumulative energy demand of fossil and nuclear origin (VDI, 2012)
Global warming potential: CO2 footprint including fossil CO2, N2O, CH4
Fresh Water Eutrophication Potential (FEP): P emissions into water and soil
Marine Eutrophication Potential (MEP): N emissions into air, water and soil
(Goedkoop et al., 2009)
Data Quality:
It is clear that different quality of input data results in different reliability of the output results.
To collect AirPrex® operational data (energy demand, chemical demand etc.), questionnaires
were sent to operators and were iteratively checked with literature and expert opinions.
The sludge input data was from Wassmannsdorf with average monthly measurements in
2016 (Lengemann, 2017). The data for the demand of electricity, heat and chemicals of each
process was taken from the project CoDiGreen (Remy, 2012) with the operational data in
2009. Data of AirPrex® reactor (efficiency, struvite production, energy demand etc.) for the
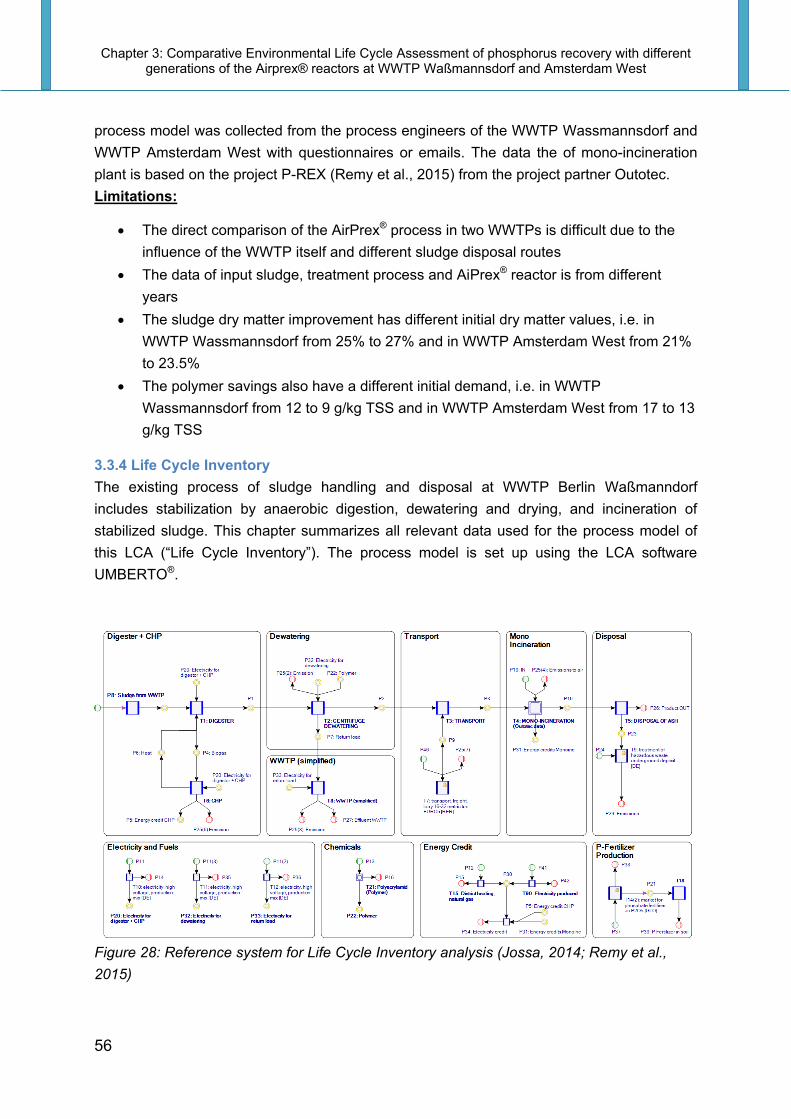
Chapter 3: Comparative Environmental Life Cycle Assessment of phosphorus recovery with different generations of the Airprex® reactors at WWTP Waßmannsdorf and Amsterdam West
56
process model was collected from the process engineers of the WWTP Wassmannsdorf and
WWTP Amsterdam West with questionnaires or emails. The data the of mono-incineration
plant is based on the project P-REX (Remy et al., 2015) from the project partner Outotec.
Limitations:
The direct comparison of the AirPrex® process in two WWTPs is difficult due to the
influence of the WWTP itself and different sludge disposal routes
The data of input sludge, treatment process and AiPrex® reactor is from different
years
The sludge dry matter improvement has different initial dry matter values, i.e. in
WWTP Wassmannsdorf from 25% to 27% and in WWTP Amsterdam West from 21%
to 23.5%
The polymer savings also have a different initial demand, i.e. in WWTP
Wassmannsdorf from 12 to 9 g/kg TSS and in WWTP Amsterdam West from 17 to 13
g/kg TSS
3.3.4 Life Cycle Inventory
The existing process of sludge handling and disposal at WWTP Berlin Waßmanndorf
includes stabilization by anaerobic digestion, dewatering and drying, and incineration of
stabilized sludge. This chapter summarizes all relevant data used for the process model of
this LCA (“Life Cycle Inventory”). The process model is set up using the LCA software
UMBERTO®.
Figure 28: Reference system for Life Cycle Inventory analysis (Jossa, 2014; Remy et al.,
2015)

Chapter 3: Comparative Environmental Life Cycle Assessment of phosphorus recovery with different generations of the Airprex® reactors at WWTP Waßmannsdorf and Amsterdam West
57
Figure 28 shows the reference system used for the Life Cycle Inventory Analysis (LCI). The
LCI is carried out by using version 7.1 of Umberto NXT LCA by ifu Hamburg GmbH. The
reference system is sub-divided into functional system units.
Digester and CHP unit
The digester unit used in the system (Table 12) represents the mesophilic digester at WWTP
Wassmannsdorf. The volatile suspended solid (VSS) degradation is estimated empirically to
47%, while the biogas yield and methane content of the biogas are 60.5%. The electricity
demand of the digester is 4.1 kWh/m3 Sludge, consisting of required energy for mixing and
sludge pumping. The sludge is also preheated using 20 kWh/m3 of thermal energy before it is
fed to the digesters.
Table 12: Reference Data for Digester and CHP (Remy, 2012)
Digester
Parameter Value Unit
VSS degradation 47 %
Biogas yield 423 NL/kg V SSIn
Biogas CH4 content 60.5 Vol-% CH4
Electricity demand 4.1 kWh/m3 Sludge
Heat demand 20 kWh/m3 Sludge
CHP
Efficiency electric 36 %
Efficiency thermal 44 %
CH4 leakage 0.75 % of Biogas
CH4 to flare 0.01 % of Biogas
Electricity demand for gas purification and
CHP plants
0.156 kWh/m3 Biogas
AirPrex® process
Digested sludge is pumped to the AirPrex® reactor (Scenario 1 and 2). The differences of the
operational data are shown in Table 13. The harvesting efficiency of AirPrex® process
describes the relation of the amount of total P that is recovered in the product and the
contained dissolved ortho-P in digested sludge. With the three-reactor system in Amsterdam,
there is a higher demand for electricity needed for pumping sludge to the different reactors.

Chapter 3: Comparative Environmental Life Cycle Assessment of phosphorus recovery with different generations of the Airprex® reactors at WWTP Waßmannsdorf and Amsterdam West
58
Table 13: Specific Data for AirPrex® Scenarios (Lengemann, 2017; Veltman, 2016)
AirPrex
Unit Scenario 1
WMD
Scenario 2
AMS
Throughput m3 per da 1820 1820
Retention time h 10.5 8
PO4-P Precipitation
efficiency
% 87 95
30% MgCl2 dosing l/m3 5.3 7
Air pumping m³/h 2500 1000
Energy Demand kWh/m3 2.2 2.4
Harvesting efficiency % 14 21
P in recovered struvite kg/a 34198 55243
N in recovered struvite kg/a 15467 24985
NH4-N emission % 8 2
Dewatering Unit
In the sludge after digestion the TS of digested sludge decreased from 5.9 to 3.4%. With the
AirPrex® system the TS content of dewatered sludge was improved from 25% to 27% in
Scenario 1, while in Scenario 2 has a higher improvement to 27.5% due to a lower PO4-P
content in the sludge water (Table 14).
With lower dissolved Ortho-P concentration in sludge liquid, higher TS can be achieved by
dewatering (Forstner, 2015). The polymer demand is decreased from 12 to 9 g/kg TSS with
the AirPrex® system. In scenario 2, the polymer demand is lower than in scenario 1 with 8
g/kg TSS. The energy demand for both scenarios is the same with 3.8 kWh/m3 sludge.
Table 14: Specific Data for Decanter (Jossa, 2014; Veltman, 2016)
Sludge Dewatering
Value Unit
Reference Scenario 1 Scenario 2
Final TS 25 27 27.5 %
Decanter electricity demand 3.8 3.8 3.8 kWh/m3 sludge
Polymer Demand 12 9 8 g/kg TSS
Return load and smplified WWTP
Within the boundaries of the reference system, there is a simplified WWTP model for
treatment of the return load after the dewatering unit. Calculations are mainly based on the
modelling by KWB within the research project CoDiGreen and P-REX.
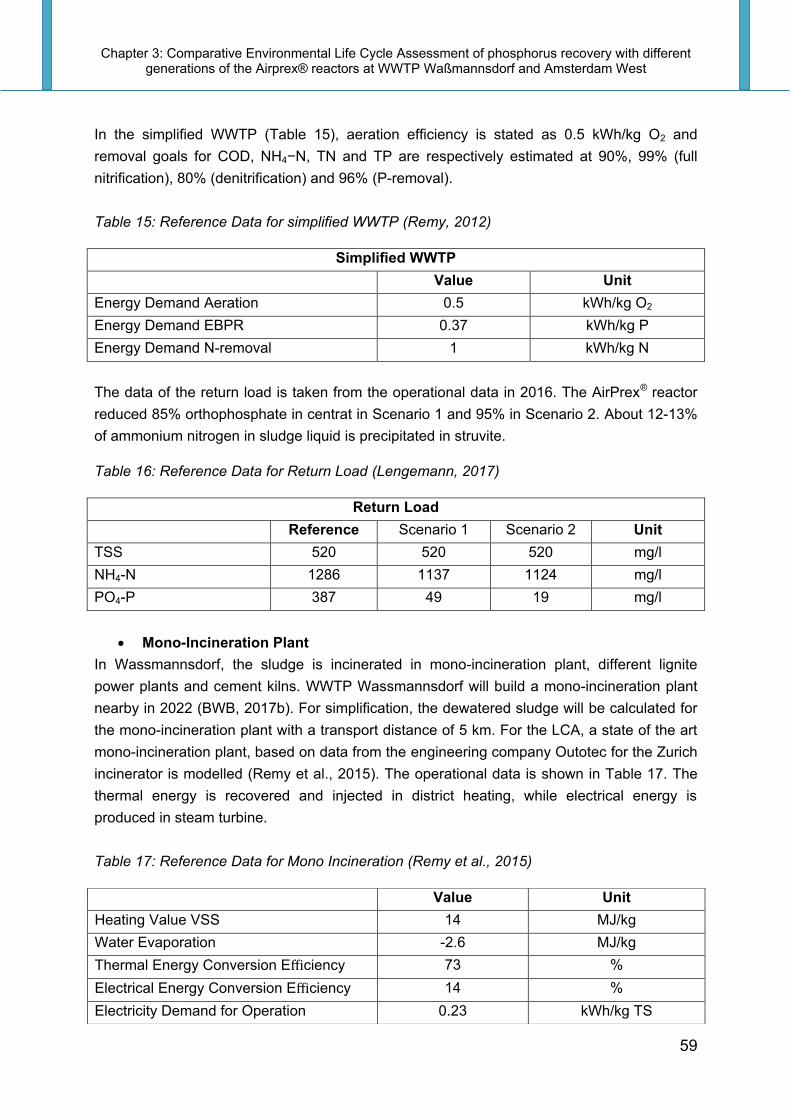
Chapter 3: Comparative Environmental Life Cycle Assessment of phosphorus recovery with different generations of the Airprex® reactors at WWTP Waßmannsdorf and Amsterdam West
59
In the simplified WWTP (Table 15), aeration efficiency is stated as 0.5 kWh/kg O2 and
removal goals for COD, NH4−N, TN and TP are respectively estimated at 90%, 99% (full
nitrification), 80% (denitrification) and 96% (P-removal).
Table 15: Reference Data for simplified WWTP (Remy, 2012)
Simplified WWTP
Value Unit
Energy Demand Aeration 0.5 kWh/kg O2
Energy Demand EBPR 0.37 kWh/kg P
Energy Demand N-removal 1 kWh/kg N
The data of the return load is taken from the operational data in 2016. The AirPrex® reactor
reduced 85% orthophosphate in centrat in Scenario 1 and 95% in Scenario 2. About 12-13%
of ammonium nitrogen in sludge liquid is precipitated in struvite.
Table 16: Reference Data for Return Load (Lengemann, 2017)
Return Load
Reference Scenario 1 Scenario 2 Unit
TSS 520 520 520 mg/l
NH4-N 1286 1137 1124 mg/l
PO4-P 387 49 19 mg/l
Mono-Incineration Plant
In Wassmannsdorf, the sludge is incinerated in mono-incineration plant, different lignite
power plants and cement kilns. WWTP Wassmannsdorf will build a mono-incineration plant
nearby in 2022 (BWB, 2017b). For simplification, the dewatered sludge will be calculated for
the mono-incineration plant with a transport distance of 5 km. For the LCA, a state of the art
mono-incineration plant, based on data from the engineering company Outotec for the Zurich
incinerator is modelled (Remy et al., 2015). The operational data is shown in Table 17. The
thermal energy is recovered and injected in district heating, while electrical energy is
produced in steam turbine.
Table 17: Reference Data for Mono Incineration (Remy et al., 2015)
Value Unit
Heating Value VSS 14 MJ/kg
Water Evaporation -2.6 MJ/kg
Thermal Energy Conversion Efficiency 73 %
Electrical Energy Conversion Efficiency 14 %
Electricity Demand for Operation 0.23 kWh/kg TS

Chapter 3: Comparative Environmental Life Cycle Assessment of phosphorus recovery with different generations of the Airprex® reactors at WWTP Waßmannsdorf and Amsterdam West
60
Disposal of Ash
Ashes from mono-incineration (0.2 kg/kg TS) are transported to landfills (100km) (Jossa,
2014; Remy et al., 2015). Disposal of mono-incinerated sewage sludge ash is modelled via a
data set market for hazardous waste, for underground deposit according to Econinvent
database version 3.0.2.1. The data set includes all upstream activities from cradle to grave.
The used data set refers to average global data in the years 2011-2013.
Phosphorus and nitrogen fertilizer production
Phosphorus fertilizer production and nitrogen fertilizer production are modelled via a data set
market for phosphate and nitrogen fertilizer (Jossa, 2014; Remy et al., 2015), as P2O5 and N
of econinvent database version 3.0.2.1. The data set includes all upstream activities from
cradle to grave. The used data set refers to average global data in the years 2011-2013.

Chapter 3: Comparative Environmental Life Cycle Assessment of phosphorus recovery with different generations of the Airprex® reactors at WWTP Waßmannsdorf and Amsterdam West
61
3.4 Life Cycle Impact Assessment
Cumulative Energy Demand (CED)
The difference between reference scenarios and AirPrex® scenarios in energy demand per
year (including fossil and nuclear) is displayed in Figure 29. Compared to the reference
system, additional electricity for the AirPrex® reactor (approx. 16 million MJ) and for the
magnesium chloride production (approx. 8 million MJ) is needed. The negative impact is
equivalent to an energetic surplus of sludge treatment and disposal compared to the
reference system. The main energy savings are savings from polymer (approx. 8 million MJ),
higher electricity production in mono-incineration (approx. 14 million MJ) and heat for district
heating to substitute natural gas (approx. 20 million MJ). The polymer savings and
improvements in dewaterability of digested sludge enable a better energy recovery in mono-
incineration and therefore obtain the saving of energy credits. Without sludge disposal,
avoided production of mineral fertilizer alone cannot cover the additional efforts in energy
and chemical demand.
Figure 29: Total Cumulative Energy Demand of AirPrex® system with 1-reactor and 3-reactor
configuration
Compared to Scenario 1 with 1-reactor configuration, Scenario 2 with 3-reactor configuration
has a higher electricity demand, but also a higher benefit or surplus. In total, the net energy
benefit in 1-reactor configuration is -20 million MJ/a. In Scenario 2 the total benefit is -26.9
million MJ/a, improving the energy surplus by 35%. From this point, the AirPrex® system with
3-reactor configuration has a better energy efficiency than the one with 1-reactor
configuration due to the benefits of sludge disposal. It needs to be mentioned that, in
Scenario 1 the 2% improvement of dewaterability is based on AMS sludge, but in Scenario 2,
the improvement of dewaterability of 2.5% is based on AMS sludge with a different starting
point of dry matter improvement.

Chapter 3: Comparative Environmental Life Cycle Assessment of phosphorus recovery with different generations of the Airprex® reactors at WWTP Waßmannsdorf and Amsterdam West
62
Figure 30: Total Cumulative Energy Demand for FU per kg P production
For a better understanding of the environmental impact of one kg of recovered P, the total
cumulative energy demand is also calculated for the function unit per kg of produced
phosphorus (Figure 30). In scenario 1 and scenario 2 the harvested P in struvite is 34198
kg/a and 55243 kg/a respectively. It can be observed that 3-reactor configuration has a lower
energy and chemical demand per kg P for its AirPrex® reactor. The energy surplus is less
than the one with 1-reactor configuration due to a much higher P harvested in struvite. In
total, the net energy credits in 1-reactor configuration are -586 MJ/kg P and with 3-reactor
configuration are -487 MJ/kg P. It is worth noting that the surplus of energy comes from
sludge dewatering, polymer saving and disposal benefits, which is not directly related to the
produced amount of P. Thus, considering the average demand for energy per kg P and the
amount of phosphorus produced, the new reactor shows a better performance.
Global Warming Potential (GWP)
Global warming potential (GWP) is typically closely related to fossil energy demand, as
greenhouse gases are mainly emitted from the combustion of fossil fuels (Remy et al., 2015).
The CO2 footprints in this study include fossil CO2, N2O, CH4. The additional AiPrex® reactor
and MgCl2 production caused an increased impact of approximately 1 million and 0.5 million
kg CO2 –eq (Figure 31). The negative net impact means the equivalent CO2 emissions are
reduced in relation to the reference state. These shares are caused by the mono-incineration
plant, polymer, electricity for return load, WWTP and the credits of P- and N-fertilizer. The
major credits in the system come from the mono-incineration plant (heating, natural gas and
electricity produced). If the sludge disposal was not considered, the net values would be
positive.
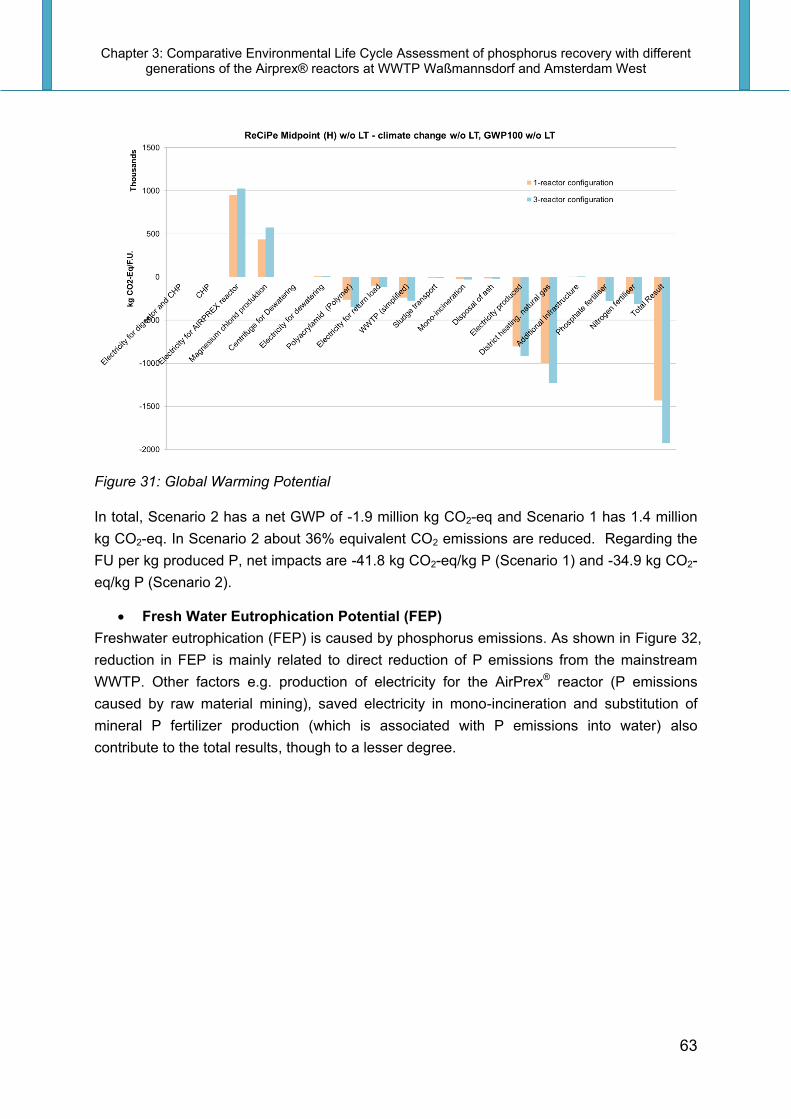
Chapter 3: Comparative Environmental Life Cycle Assessment of phosphorus recovery with different generations of the Airprex® reactors at WWTP Waßmannsdorf and Amsterdam West
63
Figure 31: Global Warming Potential
In total, Scenario 2 has a net GWP of -1.9 million kg CO2-eq and Scenario 1 has 1.4 million
kg CO2-eq. In Scenario 2 about 36% equivalent CO2 emissions are reduced. Regarding the
FU per kg produced P, net impacts are -41.8 kg CO2-eq/kg P (Scenario 1) and -34.9 kg CO2-
eq/kg P (Scenario 2).
Fresh Water Eutrophication Potential (FEP)
Freshwater eutrophication (FEP) is caused by phosphorus emissions. As shown in Figure 32,
reduction in FEP is mainly related to direct reduction of P emissions from the mainstream
WWTP. Other factors e.g. production of electricity for the AirPrex® reactor (P emissions
caused by raw material mining), saved electricity in mono-incineration and substitution of
mineral P fertilizer production (which is associated with P emissions into water) also
contribute to the total results, though to a lesser degree.
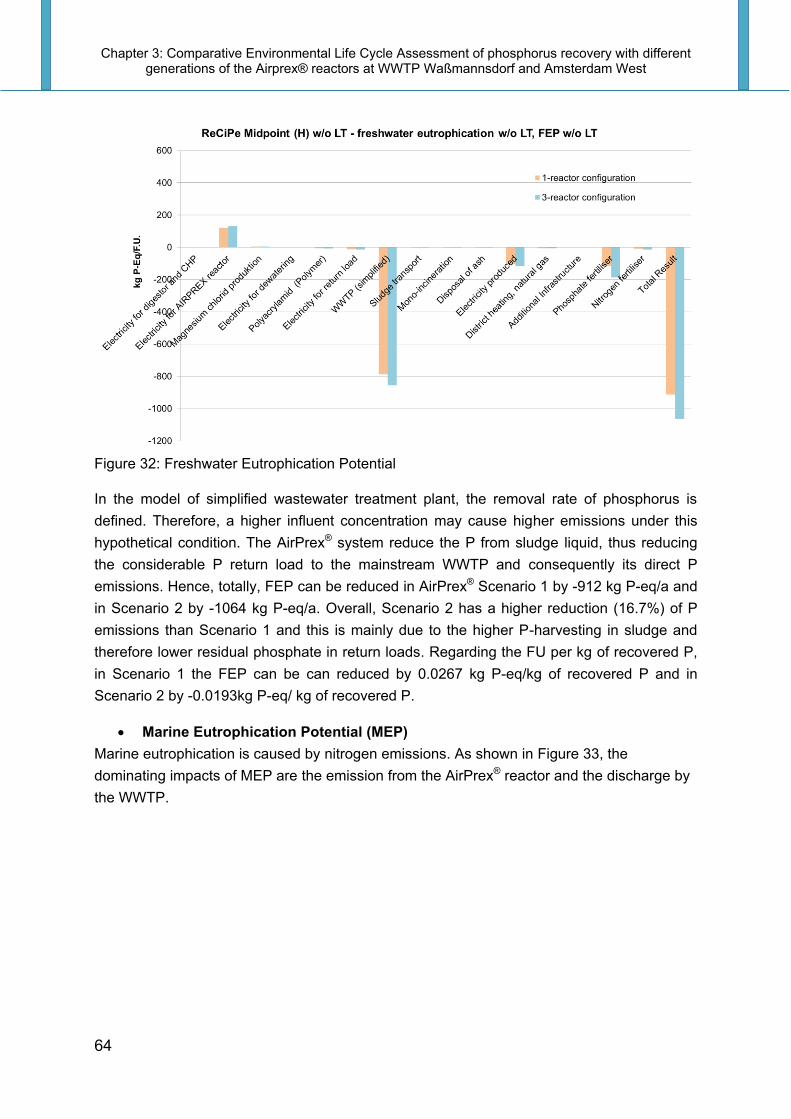
Chapter 3: Comparative Environmental Life Cycle Assessment of phosphorus recovery with different generations of the Airprex® reactors at WWTP Waßmannsdorf and Amsterdam West
64
Figure 32: Freshwater Eutrophication Potential
In the model of simplified wastewater treatment plant, the removal rate of phosphorus is
defined. Therefore, a higher influent concentration may cause higher emissions under this
hypothetical condition. The AirPrex® system reduce the P from sludge liquid, thus reducing
the considerable P return load to the mainstream WWTP and consequently its direct P
emissions. Hence, totally, FEP can be reduced in AirPrex® Scenario 1 by -912 kg P-eq/a and
in Scenario 2 by -1064 kg P-eq/a. Overall, Scenario 2 has a higher reduction (16.7%) of P
emissions than Scenario 1 and this is mainly due to the higher P-harvesting in sludge and
therefore lower residual phosphate in return loads. Regarding the FU per kg of recovered P,
in Scenario 1 the FEP can be can reduced by 0.0267 kg P-eq/kg of recovered P and in
Scenario 2 by -0.0193kg P-eq/ kg of recovered P.
Marine Eutrophication Potential (MEP)
Marine eutrophication is caused by nitrogen emissions. As shown in Figure 33, the
dominating impacts of MEP are the emission from the AirPrex® reactor and the discharge by
the WWTP.

Chapter 3: Comparative Environmental Life Cycle Assessment of phosphorus recovery with different generations of the Airprex® reactors at WWTP Waßmannsdorf and Amsterdam West
65
Figure 33: Marine Eutrophication Potential
The AirPrex® reactor in 1-reactor configuration is uncovered and part of in the ammonia gas
in digested sludge is discharged directly into air. Calculation the ammonia concentration in
the sludge before and after AirPrex®, about 8% of ammonia was emitted into the atmosphere.
The aeration reactor in 3-reactor configuration is closed and the off gas is treated in a biofilter
and therefore a 2% loss is taken into account. In scenario 1, the benefit of return load
reduction (15481 kg N-eq per year) is offset by the ammonia emission from the AirPrex®
reactor (18,908 kg N-eq per year), and finally with a total net impact of 2,357 kg N-eq per
year. Scenario 2 emits 4,727 kg N-eq per year into the air and reduces 17,878 kg N-eq per
year from the return load. Thus, a net redution of 14,615 kg N-eq per year is achieved in
scenario 2. The net impacts per kg P are 0.069 kg N-eq/kg P and -0.264 kg N-eq/kg P. Thus,
scenario 2 has improved the marine eutrophication impact significantly due to the lower
ammonia gas emissions and lower nitrogen concentration in the return load.

Chapter 3: Comparative Environmental Life Cycle Assessment of phosphorus recovery with different generations of the Airprex® reactors at WWTP Waßmannsdorf and Amsterdam West
66
3.5 Conclusion
In this study, LCA is used to compare 1-reactor system versus 3-reactor system of AirPrex®
process and to find an orientation towards environmentally friendly reactor system. In the
following, the most important findings are summarized.
Compared to the reference system, which is defined as the sludge line treating the mixed
sludge at WWTP Wassmannsdorf, both AirPrex® configurations have positive energy
benefits and better environmental credits for the GWP, FEP, and MEP. The most important
contributors to the energy impacts in 3-reactor configuration are electricity for AirPrex®
reactor (62.6%) and production of magnesium chloride (36.5%) while the main energy
benefits are from the heat for district heating to substitute natural gas (40.2%), electricity
production in mono-incineration (20.9%), reduced polymer demand (17.5%), the substitution
of conventional N and P-fertilizer (10%) and the reduced electricity for return load (3.5%).
The AMS reactor shows better results in cumulative energy demand with 35% improvement
of energy surplus, 36% reduction of global warming potential and lower eutrophication
potential. The different results of both scenarios are mainly caused by the reactor design and
the harvesting efficiency. The 3-reactor configuration has a better separation of crystals from
the sludge due to a better crystallization condition in the first two reactors and an additional
quiet condition for struvite precipitation in the third reactor. The higher the amount of struvite
recovered, the more P- and N-fertilizer credits can be achieved. The TS improvement of
dewatering in 3-reactor configuration has the most important impact on the CED and GWP
benefits while the return load of WWTP. Ammonia gas emissions have the most important
impact on the FEP and MEP.
It is suggested that, when installing a new AirPrex® reactor, the 3-reactor configuration is
recommended due to a higher struvite yield and a better environmental impact. Although the
investment of 3-reactor configuration is ca. 30% higher than 1-reactor configuration, the
additional investment can be returned through operational savings within 1 to 2 years. In
WMD, the NH3 emissions into the air can be reduced by instilling a biofilter. At the same time,
it is also important to mention that, the further development of technology, e.g. AirPrex®, can
be practiced not only in the laboratory or pilot plant but also in full-scale operation.
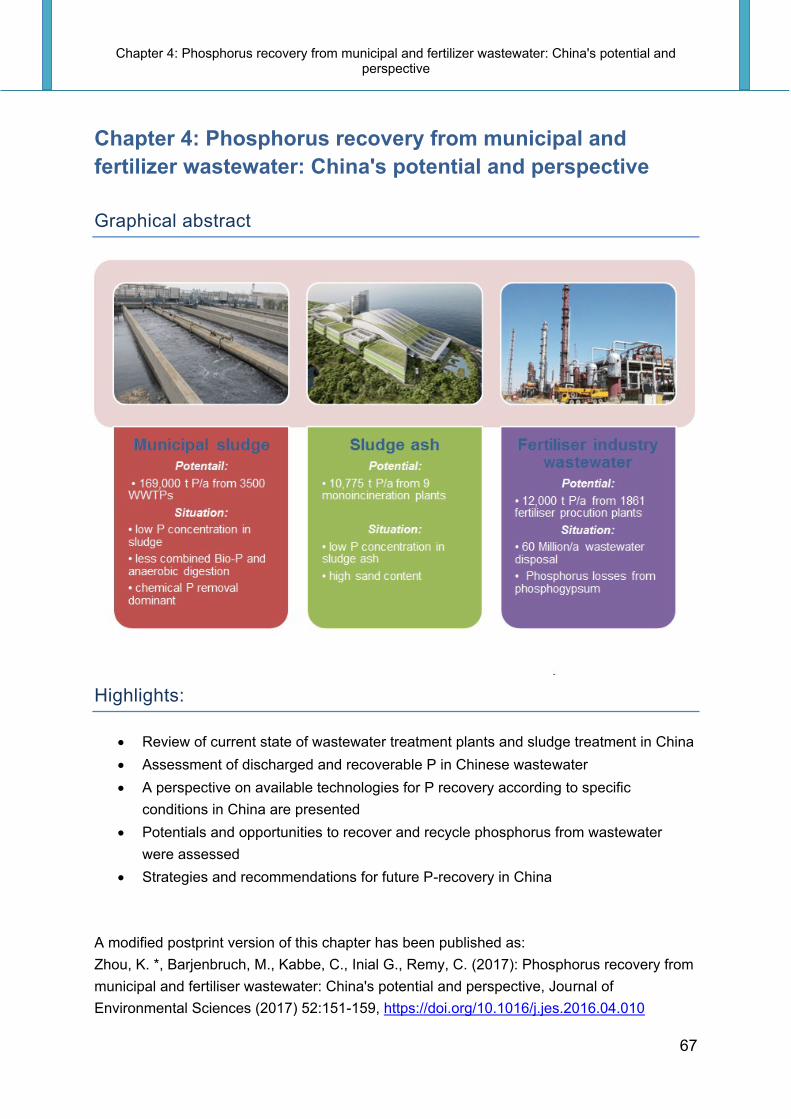
Chapter 4: Phosphorus recovery from municipal and fertilizer wastewater: China's potential and perspective
67
Chapter 4: Phosphorus recovery from municipal and
fertilizer wastewater: China's potential and perspective
Graphical abstract
Highlights:
Review of current state of wastewater treatment plants and sludge treatment in China
Assessment of discharged and recoverable P in Chinese wastewater
A perspective on available technologies for P recovery according to specific
conditions in China are presented
Potentials and opportunities to recover and recycle phosphorus from wastewater
were assessed
Strategies and recommendations for future P-recovery in China
A modified postprint version of this chapter has been published as:
Zhou, K. *, Barjenbruch, M., Kabbe, C., Inial G., Remy, C. (2017): Phosphorus recovery from
municipal and fertiliser wastewater: China's potential and perspective, Journal of
Environmental Sciences (2017) 52:151-159, https://doi.org/10.1016/j.jes.2016.04.010
Chapter 4: Phosphorus recovery from municipal and fertilizer wastewater: China's potential and perspective
68
4.1 The importance of phosphorus recovery in China
On one hand, China has abundant phosphate rock deposits and is the world's largest
producer (mining and processing) and consumer of phosphate rock. On the other hand,
China is the second-largest economy and one of the largest water markets in the world.
Considering the urbanization process in current China, the treatment capacity of WWTPs is
expected to continue to grow in the next decades. Thus, from a global viewpoint phosphorus
recovery in this country seems to have a good prospect.
China is a big country with a large population and limited farmland area per capita with only
0.08 ha per capita compared with the world average of 0.2 ha per capita in 2012, according
to the World Bank (WB, 2014). The production of sufficient food to feed the population is of
vital importance for the country. In the year 2001, phosphorus was identified by the Ministry
of Land and Resources of the People’s Republic of China (MLR, 2012a) as one of the most
important 20 minerals which, after 2010, cannot meet the development needs of the national
economy.
According to statistics from the United States Geological Survey (USGS, 2015), China's
phosphorus reserves are 3.7 billion Megagram (Mg), 5.52% of the global total volume. Based
on current phosphate rock mine production with 100 million Mg in 2014 (USGS, 2015),
Chinese phosphorus ore may run out within 37 years. It is a remarkable fact that there is only
little high-grade phosphorus ore, but the country is rich in low-grade phosphorus ore. More
than 80% is low grade phosphate rock and the average grade only reaches 17% of
phosphorus pentoxide (P2O5) (Huang et al., 2014; Lu, 2004).
In Europe, phosphate rock is officially considered to be one of the 20 critical raw materials by
the European Commission in 2014 (EU-Commission, 2014). The recovery of phosphorus has
been repeatedly discussed due to the strong dependency on imports of more than 90% (De
Ridder et al., 2012) and the food security of the growing population worldwide. Various
phosphorus recovery technologies have been developed and tested on a pilot or industrial
scale. Among these technical options, phosphorus is mostly recovered by precipitation or
crystallization processes in the form of HAP (hydroxyapatite, Ca5(PO4)3OH) or struvite
(MgNH4PO4·6H2O). The recovered products can be utilized as fertilizer in the agricultural or
other specific industries.
Consequently, closure of the anthropogenic phosphorus cycle through recovery and
recycling of phosphorus from municipal wastewater and sludge, as well as from special
industry wastewater, may help to avoid eutrophication, promote resource conservation and
increase the value chain efficiency of this precious resource.

Chapter 4: Phosphorus recovery from municipal and fertilizer wastewater: China's potential and perspective
69
4.2 Status of the municipal wastewater infrastructure in China
4.2.1 The development of urban sewage treatment
In 1984, the first large-scale wastewater treatment plant (WWTP), the Tianjin Jizhuangzi
wastewater treatment plant was built and put into operation with a treatment capacity of
260,000 m³ (Fu et al., 2008). After 1990, with the rapid development of the economy, rapid
urbanization and industrialization and the increasing environmental standards in China, the
wastewater treatment infrastructure stepped into a rapid development period and improved
the quantity of wastewater treatment facilities and also the effectiveness of treatment.
Figure 34: Development of urban sewage treatment from 2005 to 2013 in China (MOHURD,
2016)
Figure 34 shows the development of the treatment capacity for urban sewage and the
number of facilities from 2005 to 2013. During the past years, China's sewage treatment
sector has experienced rapid development. In April 2015, the General Office of the State
Council issued the “National Water Pollution Prevention and Treatment Action Plan of China”
(MEP, 2015) to address nationwide water protection; the objective of municipal wastewater
treatment is that by the end of 2020, the city and county municipal wastewater treatment
rates should reach 95% and 85% respectively.
Although China's urban wastewater treatment industry has seen much progress in terms of
scale and number since the 1990s, the conditions of the municipal water networks and the
treatment rate in rural areas still need to be improved. In 2013, the wastewater treatment rate
of the cities, counties, towns and villages were 89%, 79%, 19%, 5% respectively (MOHURD,
2016). The majority of wastewater generated in rural areas undergoes limited treatment or is
discharged to water bodies without treatment. According to the corresponding population
0
20
40
60
80
100
120
140
160
0
500
1000
1500
2000
2500
3000
3500
2005 2006 2007 2008 2009 2010 2011 2012 2013
Nu
me
r o
f W
as
tew
ate
rtre
atm
en
t f
ac
ilit
ies
year Number of wastewater treatment facilities Total wastewater treatment capacity
Scale
of
Wa
stew
ate
r T
reatm
en
t F
acil
itie
s 1 m
io m
3/d

Chapter 4: Phosphorus recovery from municipal and fertilizer wastewater: China's potential and perspective
70
distribution in different areas (MOHURD, 2016), 37% of the population is connected to
wastewater treatment systems in China.
4.2.2 Wastewater treatment process in China
There are three major steps in state-of-the-art wastewater treatment schemes, i.e. primary
physical treatment, secondary biological treatment and tertiary treatment (or effluent
polishing) to further improve the effluent quality (Halling-Sørensen & Jorgensen, 1993). Most
sewage treatment plants in China are centralized with biological wastewater treatment.
Figure 35: Variety of different processes of municipal WWTPs in China (MEP, 2014)
Figure 35 shows the variety and distribution of different processes of WWTP in China.
According to the statistics of the Ministry of Environmental Protection of the People's
Republic of China (MEP, 2014) for 4,136 commissioned wastewater treatment plants in 2013
(include urban sewage treatment and industry wastewater treatment plants), the most widely
used technologies are the Oxidation Ditch Process with a share of 27%, the Anaerobic-
Anoxic-Oxic (A2/O) process with a share of 26% and the Sequencing Batch Reactor (SBR)
process with a share of 19%.
3% of super-large-scale (>30×104 m3/d) and 13% of large-scale (10-30×104 m3/d) WWTPs
were built in large (>1,000,000 population) and medium-sized (500,000-1,000,000 population)
cities. Most of these plants apply the A2/O process. The percentage of medium-scale (1-
10×104 m3/d) WWTPs was 75%. They were generally built in medium-sized and smaller (<
500,000 population) cities and commonly apply the oxidation ditch and SBR processes (Jin
et al., 2014).
Activated sludge
process 4%
Secondary biochemical treatment
4%
Oxidation ditch 27%
A²/O process
26%
SBR process
19%
A/O process 9%
Biochemical treatment+ Trickling
filter 3%
Other 8%

Chapter 4: Phosphorus recovery from municipal and fertilizer wastewater: China's potential and perspective
71
4.2.3 Phosphorus removal in WWTPs
Two methods are currently being used around the world to remove phosphorus from
wastewater: biological and chemical phosphorus removal and combination of both. In China,
influent NH4-N ranges from 40 to 55 mg/l, and total phosphorus (TP) ranges from 4 to 9 mg/l
(Jin et al., 2014). According to the “Discharge standard of pollutants for municipal wastewater
treatment plant” (GB18918-2002), the primary A standard of total phosphorus concentration
in WWTPs effluent built after 2005 should not exceed 0.5 mg/l. It is quite difficult to meet this
requirement with biological phosphorus removal alone (Qiu & Ding, 2002). A potential reason
for the low efficiency of enhanced biological phosphorus removal (EBPR) is the competition
for carbon sources between denitrification and phosphorus release in sludge under an anoxic
condition with respect to the sludge retention time (SRT) demand, the nitrate inhibition of
phosphate release, which is not easily resolved (Chen et al., 2011; Peng et al., 2010; Qiu &
Ting, 2014).
4.2.4 Sewage sludge treatment in China
In China, thickening, conditioning and dewatering are the three most applied methods for
sludge treatment (Yang et al., 2015). There is no accurate official data of sludge disposal in
China, rather conflicting sources with different estimates. According to (Yang et al., 2015),
more than 84% of sludge is disposed by improper dumping. Regarding proper disposal, the
most commonly used method is sanitary landfill (13%), followed by land application (2%),
incineration (0.4%) and building materials (0.2%). Other data (Wang et al., 2015) indicates
that, the most widely used disposal route was landfilling with a share of 63%, followed by
compost and agricultural use with a share of 14%, incineration with a share of 2%. The
disposal route for approx. 22% of sludge is unknown. Many WWTPs in China did not report
clearly the treatment and final disposal of their sludge (Jin et al., 2014). In general, the
majority of sludge is often processed without stabilization or drying and disposed to sanitary
landfill or dumping sites.
So far, sludge digestion (AD) has not been used widely in China. Until 2010, only about 50
WWTPs adopted AD to stabilize sludge and some of them were not under stable operation
or were even closed (Kong, 2012). The main problems for sludge digestion are the lack of an
overall development plan on AD, the technical design parameters of sludge digestion not
matching the specific local condition. On the other hand, the utilization and efficiency of
sludge digestion in China is not high due to the low production of gas and the lower
economic benefit. The technical reasons are the high sand content and less volatile organic
compounds with 30-50% in the sludge (Dai et al., 2014). Based on the overall situation in
China, thickening-anaerobic digestion-dewatering and following land application (does not
include agricultural use) can be considered as the main technical route of sludge treatment
and disposal in the future. This route is favorable for large-scale and medium-scale WWTPs
due to the limited land resources in the city and shortage in energy supply in economically
developed regions (Yang et al., 2015).
Chapter 4: Phosphorus recovery from municipal and fertilizer wastewater: China's potential and perspective
72
4.3 Materials and methods
Phosphorus recovery and recycling options need to be ecologically sound, socially
acceptable and economically and technically feasible. Based on real operational data and
samples from selected WWTPs in China and available technical solutions in the EU research
and demonstration project P-REX (www.p-rex.eu), a systematic analysis of different options
was conducted.
The total concentrations of phosphorus and nitrogen in sludge water, supernatants and
centrates and were determined by spectrophotometry according to the respective Chinese
standards (GB11893-89; HJ636-2012). Ammonia nitrogen was determined with titration
according to (GB7478-87).
The sludge water samples were taken from WWTP A in China from January to May 2014.
The influent and effluent of the WWTP were analysed every two days. Other supernatants
and centrates were analysed every second week.
For the determination of iron (Fe) and aluminium (Al) in sludge and sludge ash, samples
were digested with nitric acid/hydrochloric acid according to ASTM D3974-09 and measured
in accordance with US EPA 6010/ICP-OES and US EPA 6020/ICP-MS. For the
determination of phosphorus, samples were digested with sulphuric acid according to the
APHA 4500P B, H.
The tested sludge and sludge ash samples were taken from incineration Sludge Treatment
Facility in Hongkong from December 2014 to January 2015.

Chapter 4: Phosphorus recovery from municipal and fertilizer wastewater: China's potential and perspective
73
4.4 Potential and options for phosphorus recovery in China
In the year 2013, there was a total of 45.1 billion m³ (MOHURD, 2016) of municipal
wastewater treated in counties and cities. The total phosphorus concentration in the WWTP
influents ranged from 4 to 9 mg/l (Jin et al., 2014). Based on the average value of 6.5 mg/l,
the phosphorus discharged to municipal wastewater in cities and counties added up to
approximately 293,163 Mg in 2013. The quantity of this phosphorus in municipal wastewater
in 2013 corresponded to 6% of the chemical fertilizer phosphorus (P) consumption of 5.3
teragram (Tg) (Li et al., 2015) in 2010 in China.
According to a statistical analysis of 98 WWTPs in China (Guo et al., 2009), the total P
concentration in municipal sewage sludge varies significantly, from a low of 2.2 g/kg of
sludge dry matter to 51.3 g/kg (Li et al., 2003) with a mean value of 22.2 ± 6.64 g/kg. The
treatment plants with high P concentration in the sludge are mostly located in phosphate
mining areas or in highly developed areas, e.g. Yunnan or Hong Kong. With the dry sludge
production of 7.55 million Mg in 2013 (MOHURD, 2016) and the content mean value for
phosphorus, the total phosphorus that is contained in the current Chinese sewage sludge is
estimated to be 167,634 Mg/a, or in other words, 57% of the totally discharged phosphorus.
This low rate of P in sludge might be due to the dilution in sanitary sewers by infiltration and
inflow, which causes low phosphorus influent with average value of 6.5 mg/l.
At a municipal wastewater treatment plant, phosphorus can be recovered and recycled
mainly from three locations. The first is direct land utilization of sewage sludge, the second
includes the dissolved P in the aqueous sludge phase prior to dewatering and sludge liquor
after dewatering and the third is the recovery from mono-incineration ash.
Plant availability and P uptake from different P products of P recycling has been tested
(Achat et al., 2014; Kataki et al., 2016; Römer, 2013; Wilken et al., 2015). Products from
precipitation processes Mg compounds consistently showed a better P supply in relation to
comparable Ca compounds. With struvite, the same P uptake as in triple super phosphate
(TSP) was reached.
The traditional land utilization of sewage sludge in agriculture is being considered as one of
the most economical ways for sludge disposal, but the presence of toxic heavy metals,
organic contaminants and pathogens in the sewage sludge greatly limits its direct use as a
fertilizer. According to a study of heavy metals in sewage sludge all over China (Guo et al.,
2014), the concentration of Cu, Zn, Cd, Hg, and Ni in alkaline soils about 2%, 6%, 6%, 3%, 4%
of the samples exceeded the limits set by the “Discharge Standard of Pollutants for Municipal
Wastewater treatment plants” of China (GB18918-2002). In acid soils the non-attainment
rates of Cu, Pb, Zn, Cd, Hg, Cr and Ni were 7%, 1%, 10%, 27%, 20%, 2% and 12%,
respectively. The main sources of the heavy metals may be derived from high-density
industrial zones, non-ferrous metal ores and anthropogenic activities (Guo et al., 2014). The
source control of wastewater, especially the industry wastewater, can help decrease the
amount of heavy metals entering the sewers and ensure the quality of sludge. Agricultural
soils are also significantly influenced by Cd, Hg and Pb derived from anthropogenic activities
(Wei & Yang, 2010). The use of sewage sludge on agricultural land is strictly limited. The

Chapter 4: Phosphorus recovery from municipal and fertilizer wastewater: China's potential and perspective
74
amount, duration and quality of sludge applied to agriculture should meet the requirements of
the “Control Standards for Pollutants in Sludges from Agricultural Use” (GB4284-84) and
other existing relevant agricultural standards and regulations. Hence, cost-effective
alternative strategies and technologies for phosphorus recovery for agriculture are needed.

Chapter 4: Phosphorus recovery from municipal and fertilizer wastewater: China's potential and perspective
75
4.5 Results and discussion
4.5.1 Option 1: Recovery from digested sludge
Dissolved phosphorus is recovered directly from the digested sludge. In the AirPrex® process,
the struvite is crystallized within the wet sludge and can, therefore, prevent down-stream
struvite scaling and, at the same time, improve the sludge dewater ability by 3–6 % dry
matter content and save the polymer costs for sludge dewatering (Heinzmann & Lengemann,
2011).
Table 18: Anaerobic sludge digestion projects in China
Name Wastewater Treatment process
Sludge Treatment capacity (Mg DS/d)
Disposal year of operation
Reference
Beijing Gaobeidian
active sludge treatment process
160 - 1999 (Jiang, 2014)
Beijing Xiaohongmen
AAO process with biological phosphorus removal
160 land application
2009 (Chen, 2013; Zhang et al., 2014)
Chongqing Jiguanshi
reversed AAO process, combined biological and chemical phosphorus removal
90
co-incineration and land application
2009 (Zhang, 2009)
Dalian Xiajiahe
Constant Waterlevel SBR with biological P-removal
120 land application
2009 (Dai et al., 2008; Yang et al., 2015)
Haikou Baishamen
activated sludge and biological aerated filter, chemical phosphor removal
100 agricultural use
2005 (Pan et al., 2006; Sun et al., 2008)
Qingdao Maidao
Enhanced clarification and lamella settling with biological aerated filter (BAF)
21.8 land application
2008 (Wang et al., 2012)
Shanghai Bailonggang
AAO process with chemically enhanced primary treatment
204 land application
2011 (Jiang et al., 2013)
Wuhan Sanjintan
modified A/O process with biological phosphorus removal
40 land application
2013 (Zhu, 2009)
Zhengzhou Wangxin
AAO process with biological phosphorus removal
66 - 2009 (Li et al., 2007)
Tianjing Jizhuangzi (Tianjing Jinnan sludge treatment plant)
AAO process with deep bed filtration, combined biological and chemical P-removal
160 land application
2015 (NCME, 2013)
In Table 18 selected sewage sludge digestion projects in China are listed. These WWTPs
are mostly operated with combined biological and chemical removal of phosphorus. Among

Chapter 4: Phosphorus recovery from municipal and fertilizer wastewater: China's potential and perspective
76
them, several plants have reported that struvite precipitation has been a problematic issue,
e.g. Shanghai Bailonggang (Jiang et al., 2013), Haikou Baishamen (Pan et al., 2006). For
most of these plants with anaerobic digestion, land application is the first choice for sewage
disposal.
This option is designed for a significantly higher efficiency at WWTPs with biological
Phosphorus elimination (Bio-P) and sludge digestion. However, for the phosphorus that is
fixed within the sludge, after chemical precipitation with ferrous or ferric, aluminum, direct
struvite crystallization is not a suitable option for recovery. Hence, with the current sewage
and wastewater treatment facilities in China, only a few WWTPs are adapted to this option,
such as Dalian Xiajiahe, Wuhan Sanjintan Beijing Xiaohongmen WWTP etc. The current
limits of this option for the WWTPs in China are the shortage of combined biological
phosphorus removal and anaerobic sludge digestion.
4.5.2 Option 2: Recovery from sludge water
Phosphorus is recovered from the supernatants of the digested sludge after liquid-solid
separation. In the Struvia™, Pearl®, and Airprex® process, an important component of these
technologies are crystallization reactors. In these processes, struvite is precipitated by
dosing MgCl2 and increasing the pH by adding caustic soda (NaOH) or aeration.
Table 19: Parameters of sludge water in WWTP A in China (mean value)
Influent Effluent Supernatant Pre-thickener
before digester
Supernatant Post-thickener after digester
Centrate after dewatering
Total returns
mg/l mg/l mg/l mg/l mg/l mg/l
Total Nitrogen 23.9 19.8 391 614 533 320
NH4-N 19.0 15.6 325 489 398 249
Total Phosphorus
3.5 2.0 205 289 238 180
Municipal wastewater treatment plant A in southern China has a capacity of 300,000 m³/d,
and the wastewater is treated with an activated sludge process and before discharge to the
deep sea. After digestion, phosphate is released into the liquid phase, in which the total
phosphorus increases from 205 mg/l to 289 mg/l (Table 19). Under specific conditions, this
phosphate reacts with magnesium and ammonium and builds up struvite in pipes and
dewatering facilities, which needs to be cleaned every one or two weeks by high pressure
water in this plant. The replacement of pipelines with external mechanical cleaning is also
used to cope with the scaling problem in another WWTP on the east coast of China.
Mechanical treatment is preferred due to economic reasons, i.e. the low cost of manpower,
compared to the chemical treatment by anti crustration agents. In the Tianjing Chennan

Chapter 4: Phosphorus recovery from municipal and fertilizer wastewater: China's potential and perspective
77
sludge treatment plant, P recovery from sludge water with the AirPrex® process was
constructed in 2016.
Regarding the high soluble phosphorus and ammonia concentration in centrates in such
plants in China, techniques are available, to recover 80–90% of the dissolved phosphorus
(Niewersch et al., 2014) in sludge water. The limits of this option are that no more than 20%
of a WWTP’s phosphorus load can be recovered, and this only if enhanced biological P
removal is applied. Furthermore, its economic viability should be considered.
4.5.3 Option 3: Recovery from sludge water with sludge extraction
Phosphorus is recovered from the supernatant of the digested sludge after acidic leaching or
thermal hydrolysis pre-treatment and followed by liquid-solid separation e.g. the Gifhorn,
Stuttgart and ExtraPhos® process.
Due to the additional increase of phosphorus dissolved in the sludge supernatant by acidic
treatment, the processes with sludge extraction step are applicable for digested sludge from
WWTPs with both EBPR and chemical P elimination. Hence, with the current sewage and
wastewater treatment facilities in China, Shanghai Bailonggang, Haikou Baishamen and
Tianjing Jinnan WWTP, among others, are technically suitable for this option. However, it
was shown that with the current reagent strategies and investment costs, the struvite
recovery process was not economically feasible for WWTPs with AD and P-physicochemical
removal, only in the case of Bio-P removal WWTPs with AD (Garcia-Belinchón et al., 2013).
4.5.4 Option 4: Recovery from sewage sludge ash
The P recovery from sewage sludge ash (SSA) is generally divided into two approaches: the
wet-chemical (LeachPhos) and thermal processes (AshDec). Wet-chemical approaches
consist of an acidic or alkaline digestion of SSA followed by a separation of P from dissolved
(heavy) metals and organics. In Germany, 54.7% (Wiechmann et al., 2015) of the sludge is
incinerated, but only about 3.45% (Fang et al., 2012) of sludge in China is treated by
incineration. The quantity of recoverable phosphorus in sludge ash in China is not calculable
due to the lack of reliable mono-incineration data.
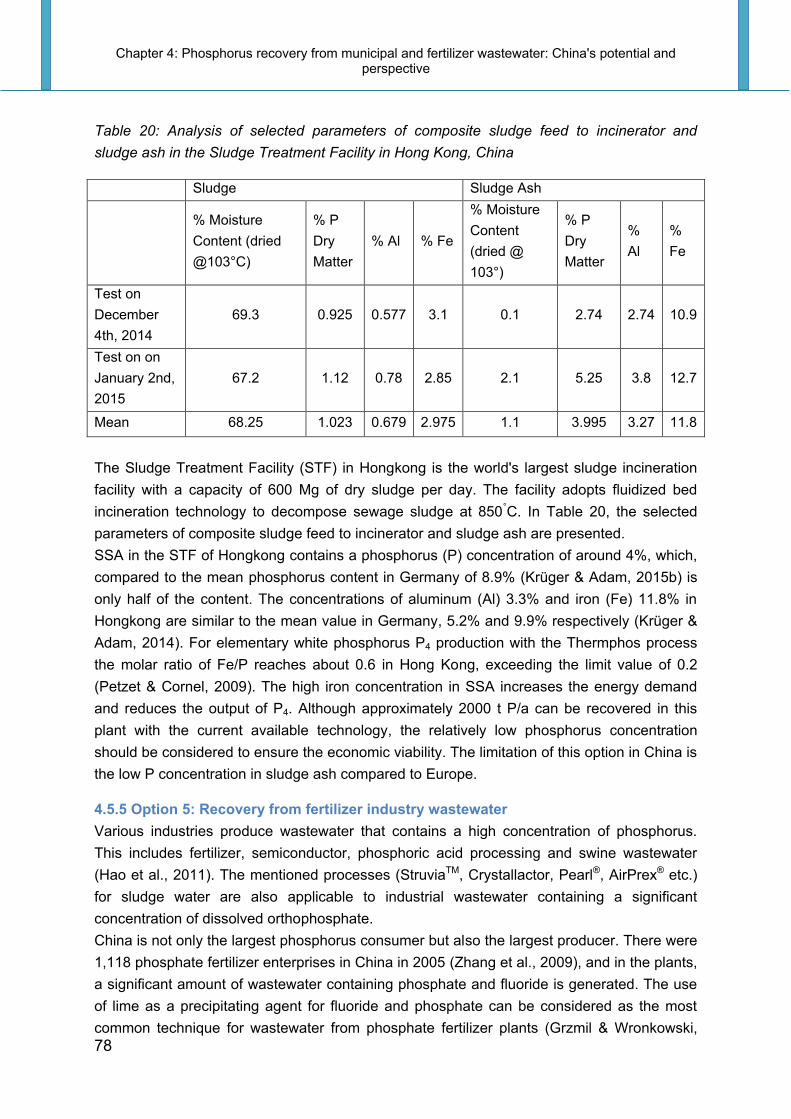
Chapter 4: Phosphorus recovery from municipal and fertilizer wastewater: China's potential and perspective
78
Table 20: Analysis of selected parameters of composite sludge feed to incinerator and
sludge ash in the Sludge Treatment Facility in Hong Kong, China
Sludge Sludge Ash
% Moisture
Content (dried
@103°C)
% P
Dry
Matter
% Al % Fe
% Moisture
Content
(dried @
103°)
% P
Dry
Matter
%
Al
%
Fe
Test on
December
4th, 2014
69.3 0.925 0.577 3.1 0.1 2.74 2.74 10.9
Test on on
January 2nd,
2015
67.2 1.12 0.78 2.85 2.1 5.25 3.8 12.7
Mean 68.25 1.023 0.679 2.975 1.1 3.995 3.27 11.8
The Sludge Treatment Facility (STF) in Hongkong is the world's largest sludge incineration
facility with a capacity of 600 Mg of dry sludge per day. The facility adopts fluidized bed
incineration technology to decompose sewage sludge at 850°C. In Table 20, the selected
parameters of composite sludge feed to incinerator and sludge ash are presented.
SSA in the STF of Hongkong contains a phosphorus (P) concentration of around 4%, which,
compared to the mean phosphorus content in Germany of 8.9% (Krüger & Adam, 2015b) is
only half of the content. The concentrations of aluminum (Al) 3.3% and iron (Fe) 11.8% in
Hongkong are similar to the mean value in Germany, 5.2% and 9.9% respectively (Krüger &
Adam, 2014). For elementary white phosphorus P4 production with the Thermphos process
the molar ratio of Fe/P reaches about 0.6 in Hong Kong, exceeding the limit value of 0.2
(Petzet & Cornel, 2009). The high iron concentration in SSA increases the energy demand
and reduces the output of P4. Although approximately 2000 t P/a can be recovered in this
plant with the current available technology, the relatively low phosphorus concentration
should be considered to ensure the economic viability. The limitation of this option in China is
the low P concentration in sludge ash compared to Europe.
4.5.5 Option 5: Recovery from fertilizer industry wastewater
Various industries produce wastewater that contains a high concentration of phosphorus.
This includes fertilizer, semiconductor, phosphoric acid processing and swine wastewater
(Hao et al., 2011). The mentioned processes (StruviaTM, Crystallactor, Pearl®, AirPrex® etc.)
for sludge water are also applicable to industrial wastewater containing a significant
concentration of dissolved orthophosphate.
China is not only the largest phosphorus consumer but also the largest producer. There were
1,118 phosphate fertilizer enterprises in China in 2005 (Zhang et al., 2009), and in the plants,
a significant amount of wastewater containing phosphate and fluoride is generated. The use
of lime as a precipitating agent for fluoride and phosphate can be considered as the most
common technique for wastewater from phosphate fertilizer plants (Grzmil & Wronkowski,

Chapter 4: Phosphorus recovery from municipal and fertilizer wastewater: China's potential and perspective
79
2006). But the large amount of phosphorus in the wastewater cannot be directly recycled in
agriculture due to the low plant availability of fluorapatite (Manahan, 1997; Ndala et al., 2010).
A controlled phosphorus recovery with separate precipitation of fluorides and phosphates in
a two-stage process would be an adapted option. It was found that, by acting on precipitation
pH ranging from 2.6 to 3.7, a “selective” removal of 97–98% fluoride from phosphoric
acid/hydrofluoric acid mixture was possible while that of phosphate did not exceed 6–8%
(Gouider et al., 2009). It can also be observed that, using calcium, fluorides were mainly
separated (pH 3) in the first stage, and phosphates (pH 8) were mainly separated in the
second stage amounting to approx. 85–88% and approx. 63–73%, respectively. (Grzmil &
Wronkowski, 2006).
Table 21: Different streams and compositions of wastewater in a fertilizer plant in China a
Wastewater
flows
(m3/h)
COD
(mg/l)
NH4-N
(mg/l)
F-
(mg/l)
TP
(mg/l)
SS
(mg/l) pH
TN
(mg/l)
Ammonia
Wastewater 200 300 300 / / 200 8 300
Phosphate
fertilizer
Wastewater
200 / 50 80 240 100 5 50
a Data came from the operator of wastewater treatment plant
Table 21 shows the different streams and compositions of wastewater in a big fertilizer plant
in the east of China. The WWTP has two major types of wastewater: ammonia wastewater
with 300 mg/l ammonia-nitrogen from synthetic ammonia production and phosphorus-
containing wastewater with 240 mg/l total phosphorus from phosphate fertilizer production.
The high concentration of both components in the wastewater provides a good possibility for
producing magnesium ammonium phosphate. The excess ammonium in the wastewater,
with a molar ratio (N:P) of more than 1, is also beneficial for struvite precipitation
(Warmadewanthi and Liu 2009). For struvite formation in this fertilizer wastewater plant, an
additional magnesium source is needed. A high calcium content in wastewater resulted in
more calcium compounds rather than struvite in the precipitations (Hao et al., 2008). In this
wastewater treatment plant approximately 1,800 t of struvite can be recovered annually by
the technology currently available, and the product can be sold directly to customers. Unlike
in Europe, China is abundant in phosphate fertilizer plants, which produce a large amount of
wastewater with a high concentration of phosphate and ammonia. Wastewater treatment with
P recovery can provide a promising prospect for future P recovery in an ecologicallly and
economically efficient way.

Chapter 4: Phosphorus recovery from municipal and fertilizer wastewater: China's potential and perspective
80
4.6 Summary and perspective
Growing urbanization in China caused a rising trend in municipal wastewater and sewage
sludge discharges. The contained phosphorus is not yet recycled and ends up in water
bodies or landfills.
An analysis of the potential and limitations of existing P recovery technologies, taking into
account their applicability to different types of WWTPs in China, shows that a huge amount
of phosphorus is transferred to wastewater and sludge. However, some limitations should be
taken into consideration, e.g. the existing WWTP infrastructure and sludge disposal routes.
From a long-term perspective, anaerobic digestion followed by land application can be
considered as the main technical route of sludge disposal for large-scale and medium-scale
WWTPs. In this way, a large part of the phosphorus will be recycled in lands, gardens or
parks in China. However, the quality of biosolids for land application should be strictly
controlled. On sloping land there is the risk of runoff reaching watercourses and causing
water pollution. It is in this sense that a clean sludge also gives cleaner water.
For the WWTPs with struvite incrustations, the P recovery from sludge can be seen as the
best option to solve this problem instead of frequent mechanical cleaning. In most cases of
recovery from sludge water, dissolution of P from solid sludge into the aqueous phase is
needed. In special cases, sludge with an extremely high concentration of phosphorus
potentially provides positive outcomes for the recovery of phosphorus, such as in Yunnan
and Hongkong.
The average concentration of phosphorus in SSA in China is lower than that in Germany due
to the high sand content in sludge and a lack of separation of rain water and municipal
sewage.
Therefore, the ash option is limited due to the low rate of mono-incineration and the low P
concentration in SSA.
Therefore, the following suggestions for future P recovery in China are:
Increasing wastewater collection and improved the phosphorus removal
Promotion of sludge digestion and Bio-P and withdrawal from precipitation with iron
salts
A development strategy for a long-term perspective in sustainable P-recovery
A legal framework governing recycling and the market for fertilizers
Development of business models for companies utilizing P streams from wastewater
Encouragement of research and promotion of a new treatment technology for P rich
wastewater

Chapter 4: Phosphorus recovery from municipal and fertilizer wastewater: China's potential and perspective
81
4.7 Conclusion
There is no doubt that phosphorus is a finite resource. Most of the P recovery technical
options for municipal WWTPs face strong limitations in China, therefore, more efforts should
be taken to increase both energy and resource efficiency. The recovery from industrial
wastewater with a high concentration of phosphorus shows a higher potential than in
municipal WWTPs due to easier market access and benefits to its operators. With an
expected increasing percentage of municipal sewage sludge digestion and biological
phosphorus removal, P recovery as struvite and recycling as fertilizer is recommended as
one of the favorable options for P recycling.

Chapter 5: Phosphorus recovery from Chinese fertilizer industry wastewater
82
Chapter 5: Phosphorus recovery from Chinese fertilizer
industry wastewater
Graphical abstract
Highlights:
A new approach for the treatment of fertilizer wastewater with P-recovery was
developed
Jar-Test with synthetic and real wastewater were conducted
Design and dimensioning with P-recovery in a Chinese fertilizer plant
The economic feasibility with this new concept was proved
A modified preprint version of this chapter is submitted to Elsevier Journal “Journal of
Cleaner Production” (Date of submission 07 Nov 2017):
Zhou, K. *, Miehe, U., Kabbe, C., Barjenbruch, M., (2017): A new planning and design to
achieve sustainable resource recovery from fertilizer wastewater

Chapter 5: Phosphorus recovery from Chinese fertilizer industry wastewater
83
5.1 Phosphate fertilizer industry
There are large amounts of phosphate available in waste streams from e.g. agriculture,
sewage treatment and from industrial side streams. Unlike Europe, China is abundant in
phosphate rock deposits and is the world's largest producer of phosphate rock. China is also
the largest fertilizer producing and consuming country in the world. China produced and
consumed 28.1% of the world’s NPK fertilizer in 2014 (IFA, 2017).
Over the past decade, domestic phosphate rock production has increased dramatically in
China, from around 30 million tons in 2000, to approx. 70 million tons in 2010 and 120 million
tons in 2015 (USGS, 2016). Figure 36 gives an overview of the phosphate fertilizer
production in form of P2O5 in China and the rest of world from 1961 to 2014. China's share of
phosphate production increased from 2.0% in 1961 to 20.6% in 2000 and reached 37.9% in
2014. At the same time, the make-up of Chinese phosphate fertilizer demand has changed
significantly from relatively low-grade products like single super phosphate (SSP) and fused
magnesium phosphate (FMP) to higher grade products such as triple super phosphate (TSP),
monoammonium phosphate (MAP) and diammonium phosphate (DAP) (Xiu, 2013).
Figure 36: Phosphate fertilizer production in thousand tons P2O5 in China and the rest of
world from 1961 to 2014 (IFA, 2017)
In 2014, a total of 16,576,000 tons P2O5 were produced in China. Based on the production
process operated in fertilizer plant A, the plant creates 3.6 m3 of wastewater to make fertilizer
containing 1 ton of P2O5. It is estimated that 59,673,600 m3 of phosphate production
wastewater is produced in China per year. With a concentration of 200 mg/l phosphorus in
these wastewaters, the Chinese phosphate industry wastewater contained about 12,000 tons
P in 2014. This amount of P in wastewater is about 18% of the 65 000 t/a P (Adam et al.,
2015) contained in German sewage sludge.
0
5000
10000
15000
20000
25000
30000
35000
40000
45000
50000
196
1
196
3
196
5
196
7
196
9
197
1
197
3
197
5
197
7
197
9
198
1
198
3
198
5
198
7
198
9
199
1
199
3
199
5
199
7
199
9
200
1
200
3
200
5
200
7
200
9
201
1
201
3
Rest of the World Grand Total P2O5 in thousand metric tons
China Grand Total P2O5 in thousand metric tons

Chapter 5: Phosphorus recovery from Chinese fertilizer industry wastewater
84
With the rapid development of the phosphate fertilizer industry in China, the quantity of
industry sewage is also rapidly increasing. The new discharge standards of water pollutants
for the phosphate fertilizer industry (GB15580, 2011), implemented in 2011, have put forward
higher requirements for the fertilizer producers and encouraged them to develop cleaner
production technologies and recover resource recovery from wastewater internally. There
were 1118 phosphate fertilizer enterprises in China in 2005 (Zhang et al., 2009), and in these
plants, a significant amount of wastewater containing phosphate and fluoride is generated.
The use of lime as a precipitating agent for fluoride and phosphate can be considered as the
most common technique for the treatment of wastewater from phosphate fertilizer plants
(Grzmil & Wronkowski, 2006). But the large amount of phosphorus in the precipitate cannot
be directly recycled in agriculture due to the low plant availability of fluorapatite (calcium
fluorophosphate) (Manahan, 1997).
Several technologies have been developed in recent years to recovery phosphorous from
wastewater, e.g. AirPrex®, Crystallactor, Pearl®, Struvia™, etc. (Kraus et al., 2016b). Unlike
in Europe, most of the P recovery technical options for municipal WWTPs face strong
limitations in China (Zhou et al., 2017). The recovery from phosphate industry wastewater
with a high concentration of dissolved orthophosphate shows higher potential than in
municipal WWTPs due to easier market access and benefits to its operators in China.
Over the years research has been conducted on industry wastewater from semiconductor
and phosphoric acid processing wastewater that contains a high concentration of
phosphorus. It was found that, by acting on a precipitation pH range from 2.6 to 3.7, a
“selective” removal of 97–98% fluoride from phosphoric acid/hydrofluoric acid mixture was
possible while that of phosphate did not exceed 6–8% (Gouider et al., 2009). It can also be
observed that, using calcium, fluorides were mainly separated (pH 3) in the first stage, and
phosphates (pH 8) were mainly separated in the second stage amounting to approx. 85–88%
and approx. 63–73%, respectively. (Grzmil & Wronkowski, 2006). In the semiconductor
industry, a selective separation of phosphate and fluoride and recovery of phosphate and
ammonium as struvite were also studied (Warmadewanthi & Liu, 2009a; Warmadewanthi &
Liu, 2009b). For the treatment of wastewater from semiconductor manufacturers, the
presence of phosphate will compete with calcium ions and hinder the removal of fluoride
(Huang & Liu, 1999). Experimental results in electronic wastewater also show the inhibitory
effect of phosphate ion on fluoride removal not only through competition of calcium but also
through differential reaction kinetics that calcium salt forms calcium phosphate precipitate
faster than calcium fluoride under an alkaline pH (Yang et al., 2001). Consequently, higher
calcium dosage is needed when dealing with fluoride-containing wastewater that contains
phosphate (Huang & Liu, 1999).
The objective of this study is to identify the feasibility of phosphate recovery from fertilizer
wastewater. A controlled phosphorus recovery with separate precipitation of fluorides and
phosphates in a two-stage process were tested on a lab scale as an alternative option for the
future fertilizer wastewater treatment process. The precipitation conditions were simulated
with MINEQL+ software and the simulation results were compared with the results from the

Chapter 5: Phosphorus recovery from Chinese fertilizer industry wastewater
85
laboratory jar test experiments. The feasibility of phosphate recovery at fertilizer production
plant A is also discussed in this study.

Chapter 5: Phosphorus recovery from Chinese fertilizer industry wastewater
86
5.2 Fertilizer wastewater characterization and treatment
5.2.1 Phosphate fertilizer wastewater
The primary products of the phosphate fertilizers industry are phosphoric acid, ammonium
phosphate, and normal superphosphate. About 90% of the total world production of
phosphoric acid is by the “wet process”, which is based on the acidification of phosphate
ores using sulfuric acid (Aly et al., 2013). A simplified process flow sheet for phosphoric acid
production is shown in the Figure 37. The phosphate rock is mined, dried, crushed, and
continuously fed into the reactor along with sulfuric acid. The reaction combines calcium from
the phosphate rock with sulfate, forming calcium sulfate (CaSO4), commonly referred to as
gypsum and separated from the system by filtration. The separated crystals must be washed
thoroughly to yield at least a 99% recovery of the filtrated phosphoric acid.
Figure 37: Process diagram for wet process dihydrate phosphoric acid plant (Cheremisinoff &
Rosenfeld, 2010)
The major source of wastewater is pond water. Phosphoric acid production creates large
quantities of pond water for cooling, concentration of the product and for processing and
storage of the gypsum by product. Gypsum slurry water is decanted from the top of the
gypsum stacks and sent to the cooling pond through collection ditches (Cheremisinoff &
Rosenfeld, 2010). The wastewater is acidic and contains significant amounts of both fluoride
and phosphate.
The effluent wastewater from the phosphate acid production plant was not amenable to
biological treatment due to the low BOD and COD ratio and very low pH (Yapijakis & Wang,
2006). The most common method for removing phosphorus und fluoride is lime neutralization
and coagulation settling using lime, aluminum, Fe salts and polyaluminumchloride (PAC).

Chapter 5: Phosphorus recovery from Chinese fertilizer industry wastewater
87
5.2.2 Nitrogenous fertilizer wastewater
The major nitrogenous fertilizers include synthetic ammonia, ammonium nitrate, and urea.
Synthetic ammonia (NH3) is produced by reacting hydrogen with nitrogen at a molar ratio of
3:1. Nitrogen is obtained from the air, which is primarily comprised of nitrogen (78%) and
oxygen (21%). Hydrogen is obtained from either the catalytic steam reforming of natural gas
or naphtha, or as the byproduct from the electrolysis of brine at chlorine plants.
(Cheremisinoff & Rosenfeld, 2010)
Figure 38: Process diagram for ammonium nitrate and urea manufacturing (Cheremisinoff &
Rosenfeld, 2010)
The production of urea (NH2CONH2) is shown in Figure 38. Ammonia (NH3) reacts with
carbon dioxide (CO2) to form ammonium carbamate (NH2CO2NH4). The ammonium
carbamate is then dehydrated to yield 70%-77% aqueous urea solution. Urea solution can be
used as an ingredient of nitrogen fertilizer solutions, or it can be concentrated further to
produce solid urea (Cheremisinoff & Rosenfeld, 2010).
In ammonia production, wastewater is generated from process condensate stripping.
Ammonium nitrate manufacturing produces process water in the neutralization process, the
evaporation unit, and air cooling equipment. The vacuum condenser in urea plants is a
source of wastewater. Most scrubbing operations are also a source of wastewater. Stream
generated in nitrogenous fertilizer processing may contain ammonia, chemical oxygen
demand (COD), dissolved and suspended solids (SS), alkalinity, and hardness. The most
common methods for removing nitrogenous compounds include: biological nitrification and
denitrification, air stripping, ion exchange. In addition, carbon shortage is a problem for the
treatment of such water due to the effect on the denitrification efficiency (Bao et al., 2016).
5.2.3 Wastewater influent and effluent parameters at plant A
The fertilizer plant A is an important production base of phosphate fertilizer in China. In 2013
the fertilizer plant produced 2 million tons of phosphorus composite fertilizers, 18,000 tons of
industrial grade MAP, 427,500 tons of total ammonia, and 253,400 tons of urea.

Chapter 5: Phosphorus recovery from Chinese fertilizer industry wastewater
88
The Wastewater streams at this plant include 200 m3/h Ammonia wastewater from synthetic
ammonia production, 200 m3/h wastewater from phosphate fertilizer production and 50 m3/h
municipal wastewater. Table 22 shows the different streams and compositions of wastewater
in this fertilizer plant. The two major types of wastewater: ammonia wastewater with 300 mg/l
ammonia-nitrogen and phosphorus-containing wastewater with 240 mg/l total phosphorus.
The orthophosphate concentration is between 160 and 200 mg/l [PO4-P].
Table 22: Design parameters of wastewater quality at plant A
Wastewat
er flows
(m3/h)
COD
(mg/l)
NH4-N
(mg/l)
F-
(mg/l)
TP
(mg/l)
SS
(mg/l) pH
TN
(mg/l)
Ammonia
Wastewater 200 300 300 / / 200 8 300
Phosphate
fertilizer
Wastewater
200 / 50 80 240 100 5 50
Municipal
wastewater 50 400 40 / 5 200 6~9 60
Design Outlet
60 12 15 15 30 6~9 25
The high concentration of both components in the two major types of wastewater provides a
good basis for producing magnesium ammonium phosphate. The excess ammonium in the
wastewater, with a molar ratio (N:P) of more than 1, is also beneficial for struvite precipitation
(Warmadewanthi & Liu, 2009a).
Two more phosphate rich side- streams of water from the production process in fertilizer
plant A are described in Table 23: the circulating process water and gypsum stack
wastewater. The process water has a low pH of about 1 to 2 and contains a dilute mixture of
phosphoric, sulfuric, and fluosilicic acids. It is saturated with calcium sulfate and contains
numerous other ions found in the phosphate rock used as a raw material, as well as
ammonia from the solid fertilizer manufacturing process.
Table 23: Composition of process water in Chemical Plant A
Art Wastewater flows
(m3/h)
NH4-N
(mg/l)
F-
(mg/l)
TP
(mg/l) pH
Circulating
process water 6800 300
low
concentration
872-1308
(0.2%-0.3% P2O5)
Gypsum stack
wastewater 50 / 1000
4360
(1% P2O5) <2

Chapter 5: Phosphorus recovery from Chinese fertilizer industry wastewater
89
Phosphogypsum (PG) is a byproduct of the chemical reaction called “wet process”. To make
1 ton of commercial fertilizer, the phosphate industry creates 4.5-5.5 tons (Connett, 2003) of
contaminated phosphogypsum slurry (calcium sulfate). The typical ingredients of wastewater
from the gypsum stack are P2O5, F and some heavy metal ions. The wastewater from the
gypsum stack in this plant is mixed with process water, which has negative influence on the
production process. Some research has been done by this plant on the separate treatment of
these high-nutrient side streams.
The current Chinese standard “Discharge Standard of Water Pollutants for the Phosphate
Fertilizer Industry (GB15580, 2011)” in Table 24 is applicable to the management of
discharging water pollutants of existing phosphate fertilizer manufacturers or production
facilities in China. The treated wastewater at plant A is discharged directly into river, which
should meet the parameters marked in bold in Table 24.
Table 24: Discharge standard of water pollutants for phosphate fertilizer industry
No
.
Pollutant
s
Direct discharge
Indirect
discharg
e
calcium
superphosphat
e
calcium-
magnesiu
m
phosphate
ammoniu
m
phosphate a
triple-
superphosphat
e
compoun
d fertilizer
1 pH 6~9 6~9 6~9 6~9 6~9 6~9
2 CODCr 70 70 70 70 70 150
3 SS 30 30 30 30 30 100
4 Fluoride 15 15 15 15 15 20
5 TP 10 10 15 15 15 20
6 TN 15 15 20 15 20 60
7 Ammoni
a
10 10 15 10 15 30
8 Total
arsenic
0.3 0.3 0.3 0.3 0.3 0.3
Benchmark
effluent volume
per unit
product (m³/t)
0.3 0.4 0.2 0.15 0.15 the same
with
direct
discharg
e
12b
Units in milligrams per liter (mg/l), except pH
a Nitrophosphate production apply the same standard with ammonium phosphate
b suitable for fluorine production enterprises (calculated with Sodium fluorosilicate), unit in m³/t
5.2.4 Current wastewater treatment process in plant A
The current process of phosphate and ammonia wastewater treatment is shown in Figure 39.
The wastewater from the phosphate fertilizer production is mixed with municipal wastewater
and treated with a two-step precipitation process, step one mainly for fluoride removal and

Chapter 5: Phosphorus recovery from Chinese fertilizer industry wastewater
90
step two mainly for phosphorus treatment. The additional ammonia wastewater treatment is
designed based on the anoxic-aerobic-anoxic-aerobic (AOAO) biological process for
ammonia removal and carbon removal simultaneously. The quartz sand filter, used as
advanced treatment unit, can further remove SS and COD after biological treatment. After
tertiary treatment, the wastewater goes to the final pH adjustment tank together with the
treated phosphorus wastewater, and if necessary, it can be pumped directly into workshop
as reclaimed water. At present, the treated wastewater is discharged into the river and not
used for reclamation.
Figure 39: The current wastewater treatment scheme of plant A
Carbon source
200 m3/h
Ammonia
Wastewater
pH=8
Secondary
precipitation stage
Phosphate recovery
(pH=8-9)
Rapid filtration with
quartz sand
Primary precipitation
stage Fluoride,
Phosphate removal
(pH=4-5)
200 m3/h
Phosphate
Wastewater
pH=4-5
Sludge
treatment
Lime, PAC, PAM, HCl
Lime, MgCl2, NaOH
Final treatment
pH adjust, (pH=7)
Clean Water
50 m3/h
Municipal
Wastewater
pH=6-9
Sludge
treatment
Sludge
treatment
Biological stage
Ammonia removal
(pH=7-8)
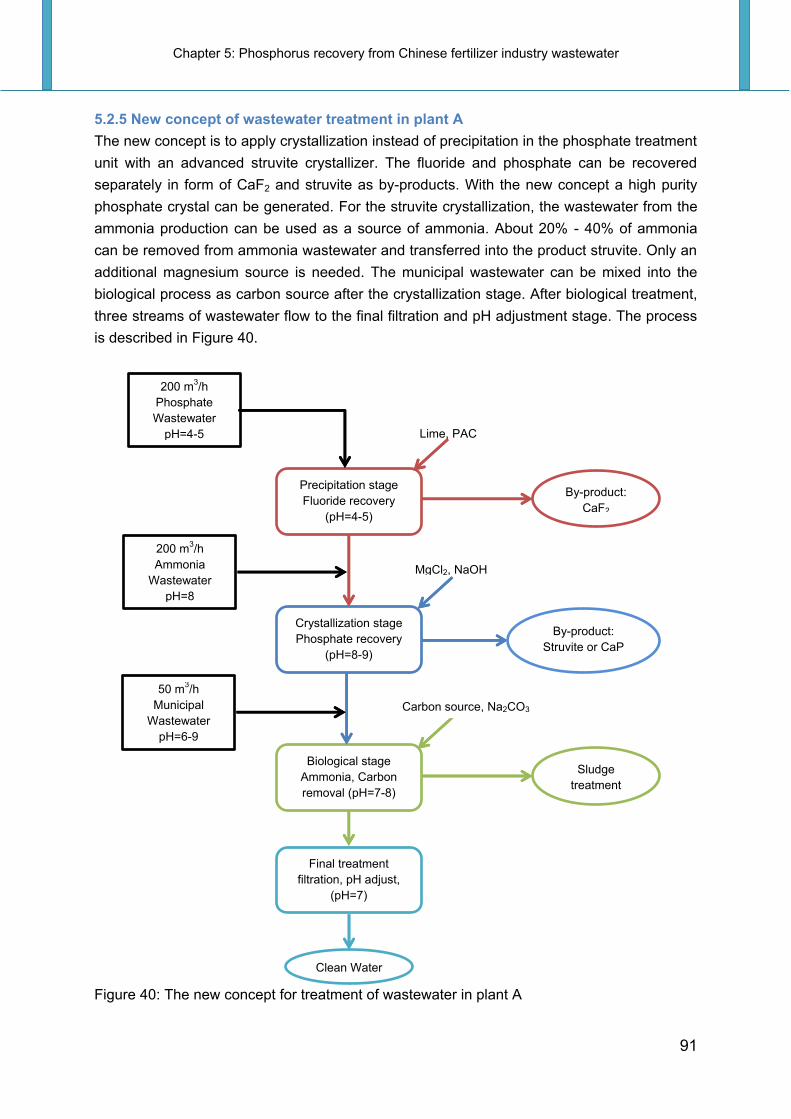
Chapter 5: Phosphorus recovery from Chinese fertilizer industry wastewater
91
5.2.5 New concept of wastewater treatment in plant A
The new concept is to apply crystallization instead of precipitation in the phosphate treatment
unit with an advanced struvite crystallizer. The fluoride and phosphate can be recovered
separately in form of CaF2 and struvite as by-products. With the new concept a high purity
phosphate crystal can be generated. For the struvite crystallization, the wastewater from the
ammonia production can be used as a source of ammonia. About 20% - 40% of ammonia
can be removed from ammonia wastewater and transferred into the product struvite. Only an
additional magnesium source is needed. The municipal wastewater can be mixed into the
biological process as carbon source after the crystallization stage. After biological treatment,
three streams of wastewater flow to the final filtration and pH adjustment stage. The process
is described in Figure 40.
Figure 40: The new concept for treatment of wastewater in plant A
200 m3/h
Ammonia
Wastewater
pH=8
Crystallization stage
Phosphate recovery
(pH=8-9)
Biological stage
Ammonia, Carbon
removal (pH=7-8)
Sludge
treatment
200 m3/h
Phosphate
Wastewater
pH=4-5
Precipitation stage
Fluoride recovery
(pH=4-5)
By-product:
CaF2
Lime, PAC
MgCl2, NaOH
Carbon source, Na2CO3
Final treatment
filtration, pH adjust,
(pH=7)
50 m3/h
Municipal
Wastewater
pH=6-9
Clean Water
By-product:
Struvite or CaP
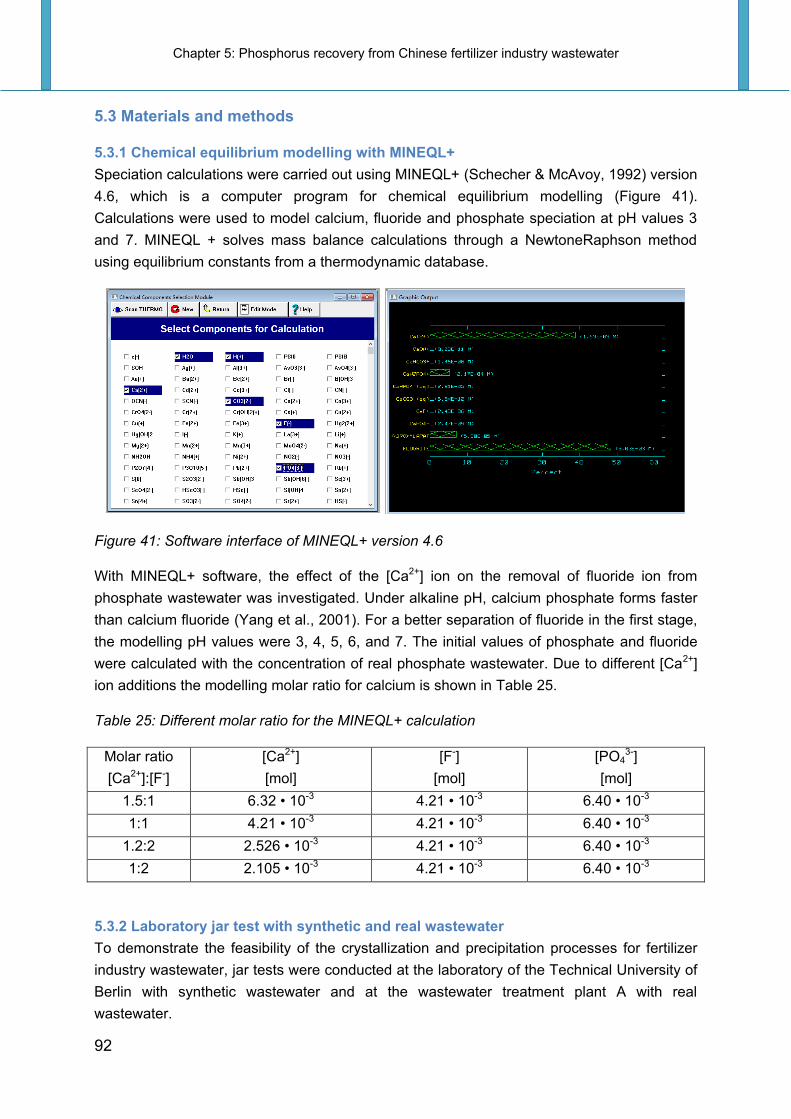
Chapter 5: Phosphorus recovery from Chinese fertilizer industry wastewater
92
5.3 Materials and methods
5.3.1 Chemical equilibrium modelling with MINEQL+
Speciation calculations were carried out using MINEQL+ (Schecher & McAvoy, 1992) version
4.6, which is a computer program for chemical equilibrium modelling (Figure 41).
Calculations were used to model calcium, fluoride and phosphate speciation at pH values 3
and 7. MINEQL + solves mass balance calculations through a NewtoneRaphson method
using equilibrium constants from a thermodynamic database.
Figure 41: Software interface of MINEQL+ version 4.6
With MINEQL+ software, the effect of the [Ca2+] ion on the removal of fluoride ion from
phosphate wastewater was investigated. Under alkaline pH, calcium phosphate forms faster
than calcium fluoride (Yang et al., 2001). For a better separation of fluoride in the first stage,
the modelling pH values were 3, 4, 5, 6, and 7. The initial values of phosphate and fluoride
were calculated with the concentration of real phosphate wastewater. Due to different [Ca2+]
ion additions the modelling molar ratio for calcium is shown in Table 25.
Table 25: Different molar ratio for the MINEQL+ calculation
Molar ratio
[Ca2+]:[F-]
[Ca2+]
[mol]
[F-]
[mol]
[PO43-]
[mol]
1.5:1 6.32 • 10-3 4.21 • 10-3 6.40 • 10-3
1:1 4.21 • 10-3 4.21 • 10-3 6.40 • 10-3
1.2:2 2.526 • 10-3 4.21 • 10-3 6.40 • 10-3
1:2 2.105 • 10-3 4.21 • 10-3 6.40 • 10-3
5.3.2 Laboratory jar test with synthetic and real wastewater
To demonstrate the feasibility of the crystallization and precipitation processes for fertilizer
industry wastewater, jar tests were conducted at the laboratory of the Technical University of
Berlin with synthetic wastewater and at the wastewater treatment plant A with real
wastewater.

Chapter 5: Phosphorus recovery from Chinese fertilizer industry wastewater
93
Synthetic wastewater
The synthetic wastewater was prepared by dissolving the chemicals into distilled water at
ambient temperature (25 ± 2 °C). The synthetic water sample volume was 1L for each jar test.
The appropriate amount of hydrochloric acid or sodium hydroxide was added to decrease or
raise the sample pH depending on the experiment. The synthetic wastewater represents
major classes of ions present in real wastewater, e.g. phosphate, fluoride and ammonia. The
components and concentration of synthetic wastewater is shown in Table 26.
Table 26: Components and concentration of synthetic wastewater
F-
(mg/l)
PO4-P
(mg/l)
NH4-N
(mg/l)
Synthetic phosphate wastewater 90 170 /
Synthetic ammonia wastewater / / 280
Synthetic wastewater was prepared by using the following chemicals listed in Table 27.
Calcium hydroxide and calcium chloride were used as sources of calcium for the pricipitation
of fluoride. Calcium fluoride and magnesium ammonium phosphate powder were prepared
as seeding product for the precipitation and crystillization.
Table 27: Used chemicals for the jar test experiments
Chemical name Chemical formula Molar weight [g/mol]
Calcium hydroxide Ca(OH)2 74.09
Sodium hydroxide 5 mol/l NaOH 40.00
Magnesium chloride 98.5% MgCl2 95.21
Hydrochloric acid HCL 36.46
Sodium fluoride NaF 41.99
Trisodium phosphate Na3PO4 163.94
Ammonium chloride NH4Cl 53.49
Calcium fluoride CaF2 78.07
Magnesium ammonium phosphate 98% MgNH4PO4•6H2O 245.41
Precipitation of fluoride
A jar test apparatus (Flocculator 200, Kemira KemWater) was used for chemical precipitation
experiments. Lime was added in the first stage of treatment to precipitate only fluoride from
wastewater. In the second stage of treatment, magnesium chloride and ammonia
wastewater were added to recover phosphate from wastewater.
As in example shown in Figure 42, the synthetic wastewater which contained phosphate and
fluoride was prepared in a 1 L test tube. The required dose of the selected solution
containing the calcium (usually calcium hydroxide or calcium chloride) was added. If required,

Chapter 5: Phosphorus recovery from Chinese fertilizer industry wastewater
94
the caustic soda solution or hydrochloric acid was immediately added increasing or
decreasing the pH to the desired target value. The injected volume of the solution was
recorded and it was mixed at 150 rpm for the required duration.
Figure 42: Jar test experiments to determine optimum operating conditions
After the fluoride precipitation experiment, the sample was mixed with ammonia wastewater
in the ratio of 1:1. The required dose of magnesium chloride was added and the pH adjusted
to the desired target value. The example was then mixed at 150 rpm for 1 min, slowly mixed
at 50 rpm for 5 min and left to settle for 30 min.
The concentrations of fluoride, orthophosphate, ammonia, calcium and magnesium were
measured using the Hach Lange (DR 5000) cuvette test LCK 323, LCK 049, LCK 302, LCK
327 and LCK 326 respectively. Due to the limitations of the local laboratory at plant A, the jar
test experiment was conducted without the measuring the fluoride concentration.
Crystallization of struvite
An additional experiment for the crystallization of struvite was conducted directly at plant A to
evaluate the optimum operating conditions for the struvite (MgNH4PO4, 6H2O) crystallization.
The objective of the trial was to characterize the effects associated with the variation of each
of the selected parameters. One parameter only varied from one jar to another while the
other parameters remained constant.
The following protocol was performed with only one parameter varying trial after trial:
I. Fill each beaker with 1L of effluent to be treated using a test tube.
II. Set the impellers into the solutions and start mixing with a speed of 150 rpm.
III. Add the required dose of the selected solution containing the magnesium (usually
magnesium chloride).
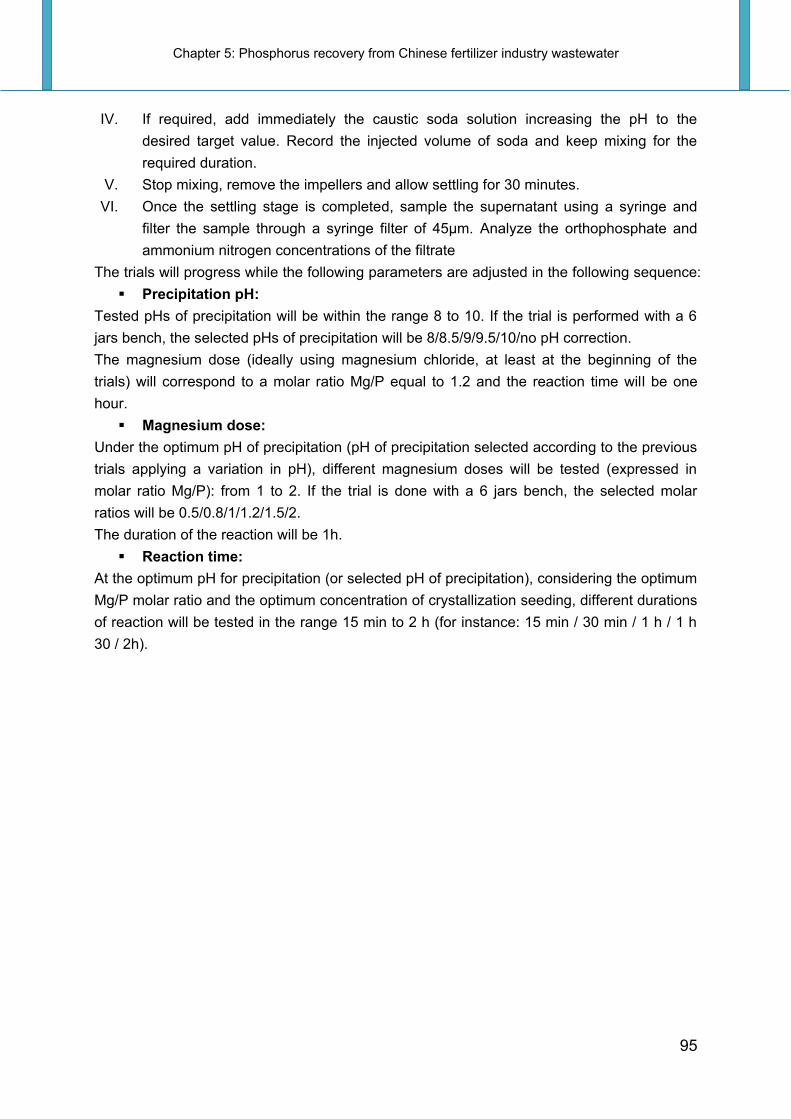
Chapter 5: Phosphorus recovery from Chinese fertilizer industry wastewater
95
IV. If required, add immediately the caustic soda solution increasing the pH to the
desired target value. Record the injected volume of soda and keep mixing for the
required duration.
V. Stop mixing, remove the impellers and allow settling for 30 minutes.
VI. Once the settling stage is completed, sample the supernatant using a syringe and
filter the sample through a syringe filter of 45μm. Analyze the orthophosphate and
ammonium nitrogen concentrations of the filtrate
The trials will progress while the following parameters are adjusted in the following sequence:
Precipitation pH:
Tested pHs of precipitation will be within the range 8 to 10. If the trial is performed with a 6
jars bench, the selected pHs of precipitation will be 8/8.5/9/9.5/10/no pH correction.
The magnesium dose (ideally using magnesium chloride, at least at the beginning of the
trials) will correspond to a molar ratio Mg/P equal to 1.2 and the reaction time will be one
hour.
Magnesium dose:
Under the optimum pH of precipitation (pH of precipitation selected according to the previous
trials applying a variation in pH), different magnesium doses will be tested (expressed in
molar ratio Mg/P): from 1 to 2. If the trial is done with a 6 jars bench, the selected molar
ratios will be 0.5/0.8/1/1.2/1.5/2.
The duration of the reaction will be 1h.
Reaction time:
At the optimum pH for precipitation (or selected pH of precipitation), considering the optimum
Mg/P molar ratio and the optimum concentration of crystallization seeding, different durations
of reaction will be tested in the range 15 min to 2 h (for instance: 15 min / 30 min / 1 h / 1 h
30 / 2h).

Chapter 5: Phosphorus recovery from Chinese fertilizer industry wastewater
96
5.4 Results and discussion
5.4.1 MINEQL+ Results
5.4.1.1 Calcium speciation
The calculation result of calcium speciation at pH 5, [Ca2+]:[F-] ratio 1:2, is presented as an
example in Figure 43. The vertical axis on the graph shows the different components of
calcium, while the horizontal axis represents the percentage of this component. According to
the calculations, at pH 5, 90% of calcium is in the form of insoluble fluorite (CaF2).
Figure 43: Calcium speciation calculation with MINEQL+ software at pH value 5, Ca:F ratio
1:2.
The effects of different pH values at 3, 4, 5, 6, 7 on the precipitation of calcium are shown in
Figure 44. The MINEQL+ model predicts that with the theoretical [Ca2+]:[F-] molar ratio of 1:2,
under pH range 3 to 5, and 80-90% of the calcium ions are precipitated with fluoride and
undissolved hydroxylapatite is not formed. Increasing the pH to 6 and 7, hydroxylapatite is
formed. At pH 6, about 80% of the calcium is precipitated as calcium fluoride. At pH 7, about
70% of the calcium is present in the form of hydroxylapatite. Thus, a pH between 4 and 5 is
the optional condition for fluoride precipitation under this condition, which corresponds to
meet the original pH value of phosphate wastewater from plant A.
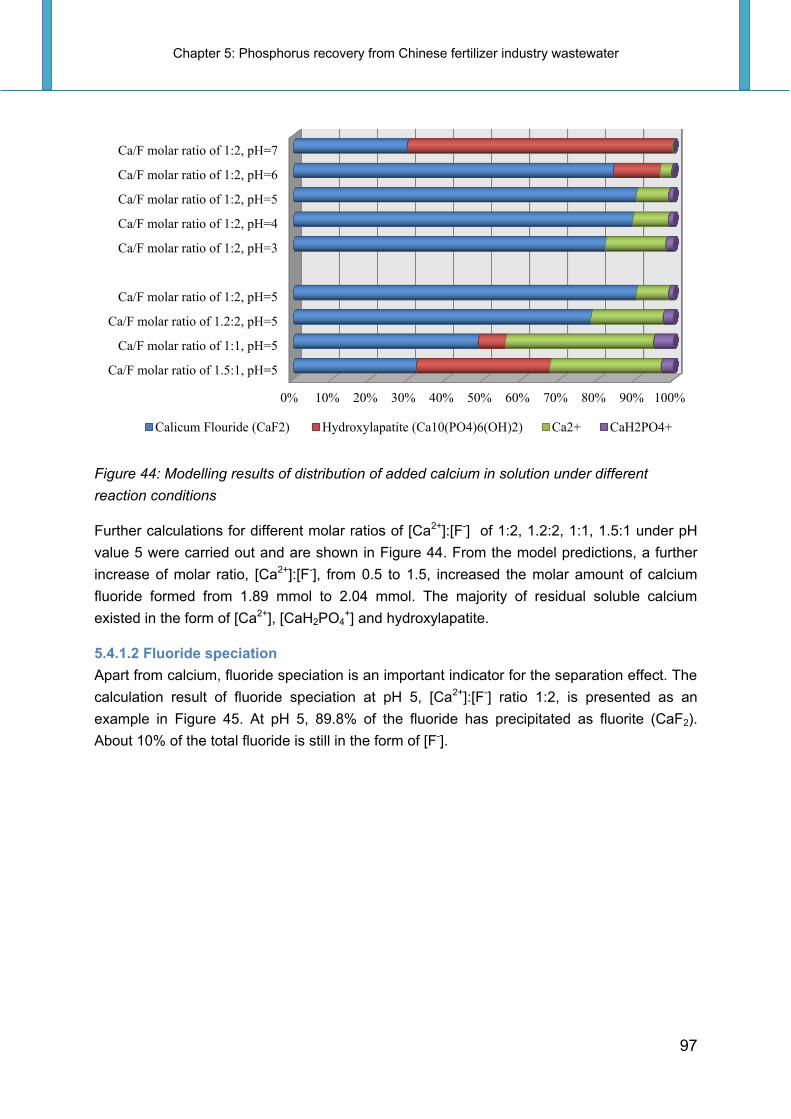
Chapter 5: Phosphorus recovery from Chinese fertilizer industry wastewater
97
Figure 44: Modelling results of distribution of added calcium in solution under different
reaction conditions
Further calculations for different molar ratios of [Ca2+]:[F-] of 1:2, 1.2:2, 1:1, 1.5:1 under pH
value 5 were carried out and are shown in Figure 44. From the model predictions, a further
increase of molar ratio, [Ca2+]:[F-], from 0.5 to 1.5, increased the molar amount of calcium
fluoride formed from 1.89 mmol to 2.04 mmol. The majority of residual soluble calcium
existed in the form of [Ca2+], [CaH2PO4+] and hydroxylapatite.
5.4.1.2 Fluoride speciation
Apart from calcium, fluoride speciation is an important indicator for the separation effect. The
calculation result of fluoride speciation at pH 5, [Ca2+]:[F-] ratio 1:2, is presented as an
example in Figure 45. At pH 5, 89.8% of the fluoride has precipitated as fluorite (CaF2).
About 10% of the total fluoride is still in the form of [F-].
0% 10% 20% 30% 40% 50% 60% 70% 80% 90% 100%
Ca/F molar ratio of 1.5:1, pH=5
Ca/F molar ratio of 1:1, pH=5
Ca/F molar ratio of 1.2:2, pH=5
Ca/F molar ratio of 1:2, pH=5
Ca/F molar ratio of 1:2, pH=3
Ca/F molar ratio of 1:2, pH=4
Ca/F molar ratio of 1:2, pH=5
Ca/F molar ratio of 1:2, pH=6
Ca/F molar ratio of 1:2, pH=7
Calicum Flouride (CaF2) Hydroxylapatite (Ca10(PO4)6(OH)2) Ca2+ CaH2PO4+
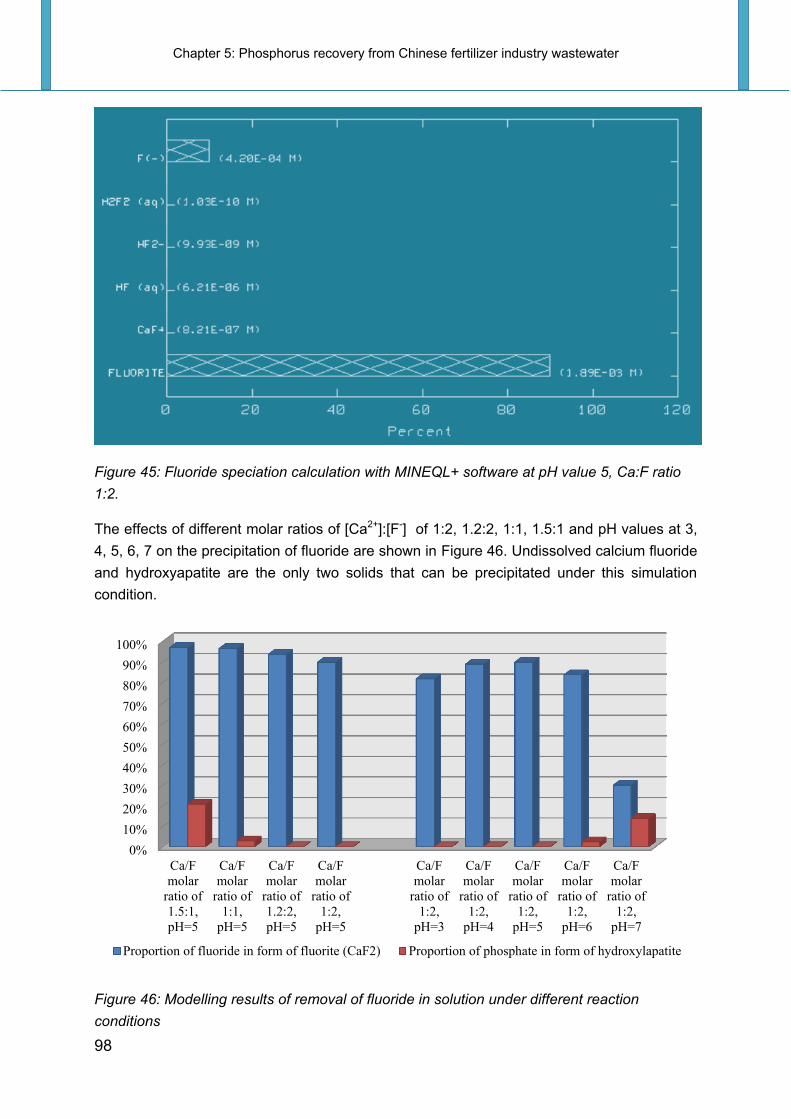
Chapter 5: Phosphorus recovery from Chinese fertilizer industry wastewater
98
Figure 45: Fluoride speciation calculation with MINEQL+ software at pH value 5, Ca:F ratio
1:2.
The effects of different molar ratios of [Ca2+]:[F-] of 1:2, 1.2:2, 1:1, 1.5:1 and pH values at 3,
4, 5, 6, 7 on the precipitation of fluoride are shown in Figure 46. Undissolved calcium fluoride
and hydroxyapatite are the only two solids that can be precipitated under this simulation
condition.
Figure 46: Modelling results of removal of fluoride in solution under different reaction
conditions
0%
10%
20%
30%
40%
50%
60%
70%
80%
90%
100%
Ca/F
molar
ratio of
1.5:1,
pH=5
Ca/F
molar
ratio of
1:1,
pH=5
Ca/F
molar
ratio of
1.2:2,
pH=5
Ca/F
molar
ratio of
1:2,
pH=5
Ca/F
molar
ratio of
1:2,
pH=3
Ca/F
molar
ratio of
1:2,
pH=4
Ca/F
molar
ratio of
1:2,
pH=5
Ca/F
molar
ratio of
1:2,
pH=6
Ca/F
molar
ratio of
1:2,
pH=7
Proportion of fluoride in form of fluorite (CaF2) Proportion of phosphate in form of hydroxylapatite

Chapter 5: Phosphorus recovery from Chinese fertilizer industry wastewater
99
Increasing the molar ratio of [Ca2+]:[F-] from 0.5 to 1.5, raised the removal efficiency of
fluoride (in form of CaF2) from 89.8% to 96.9%. At the pH value 4 and 5, the removal
efficiency of fluoride was better than at pH 3, 6 and 7.
To summarize, the MINEQL+ results indicated that selective separation of fluoride and
phosphate is possible with Ca2+ ion precipitation. According to the theoretical calculations,
fluoride removal from phosphate containing wastewater was efficient at pH 4 to 5, with a
molar ratio of [Ca2+]:[F-] from 0.5 to 1.
5.4.2 Jar-test results with synthetic wastewater
5.4.2.1 Separation of fluoride and phosphate
Influence of pH and reaction time
Figure 47: The influence of pH and reaction time on the fluoride removal with molar ratio
([Ca2+]:[F-]) of 0.5.
In Figure 47, different durations of reactions were tested ranging from 1 hour to 24 hours (for
instance: 1h / 3h / 6 h / 24h) under pH 4, 5 and 11. Experimental results showed that only a
limited amount (6.7% -11.1%) of fluoride was removed at pH 11. This result revealed that
calcium salt tended to react preferentially with phosphate rather than with fluoride at an
alkaline pH. At pH 6 and 7, the removal ratio was still quite low. It was found that, under
acidic conditions (pH= 4 and 5), 46% - 61% of the fluoride was removed by calcium
hydroxide as calcium fluoride at a molar ratio [Ca2+]:[F-] of 0.5. The removal of fluoride is
considerably lower than predicted by the MINEQL+ model. This is probably because
phosphate could have an inhibitive effect on fluoride precipitation. When comparing the pH
values 4 and 5, the lower pH value 4 has better removal efficiency (4 - 6%) of fluoride. The
reaction time has also an effect on the removal ratio of fluoride. For a longer reaction time, a
better fluoride removal was achieved. After 6 hours, the reaction time has an insignificant
effect: about 2-3% fluoride removal.
0%
10%
20%
30%
40%
50%
60%
70%
0 2 4 6 8 10 12 14 16 18 20 22 24
Re
mo
va
l ra
te o
f fl
uo
rid
e [
%]
Reaction time in h
F + Ca(OH)2 (pH=4)
F + Ca(OH)2 (pH=5)
F + Ca(OH)2 (pH=6)
F + Ca(OH)2 (pH=7)
F + Ca(OH)2 (pH=11)
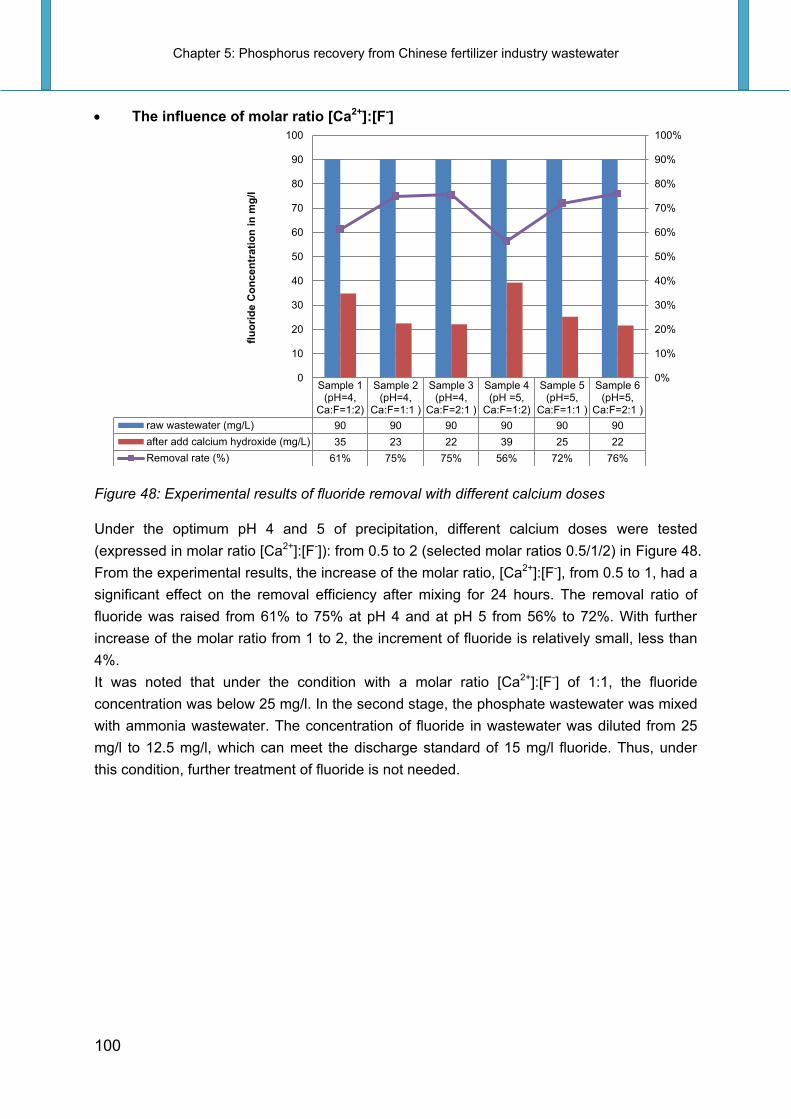
Chapter 5: Phosphorus recovery from Chinese fertilizer industry wastewater
100
The influence of molar ratio [Ca2+]:[F-]
Figure 48: Experimental results of fluoride removal with different calcium doses
Under the optimum pH 4 and 5 of precipitation, different calcium doses were tested
(expressed in molar ratio [Ca2+]:[F-]): from 0.5 to 2 (selected molar ratios 0.5/1/2) in Figure 48.
From the experimental results, the increase of the molar ratio, [Ca2+]:[F-], from 0.5 to 1, had a
significant effect on the removal efficiency after mixing for 24 hours. The removal ratio of
fluoride was raised from 61% to 75% at pH 4 and at pH 5 from 56% to 72%. With further
increase of the molar ratio from 1 to 2, the increment of fluoride is relatively small, less than
4%.
It was noted that under the condition with a molar ratio [Ca2+]:[F-] of 1:1, the fluoride
concentration was below 25 mg/l. In the second stage, the phosphate wastewater was mixed
with ammonia wastewater. The concentration of fluoride in wastewater was diluted from 25
mg/l to 12.5 mg/l, which can meet the discharge standard of 15 mg/l fluoride. Thus, under
this condition, further treatment of fluoride is not needed.
Sample 1(pH=4,
Ca:F=1:2)
Sample 2(pH=4,
Ca:F=1:1 )
Sample 3(pH=4,
Ca:F=2:1 )
Sample 4(pH =5,
Ca:F=1:2)
Sample 5(pH=5,
Ca:F=1:1 )
Sample 6(pH=5,
Ca:F=2:1 )
raw wastewater (mg/L) 90 90 90 90 90 90
after add calcium hydroxide (mg/L) 35 23 22 39 25 22
Removal rate (%) 61% 75% 75% 56% 72% 76%
0%
10%
20%
30%
40%
50%
60%
70%
80%
90%
100%
0
10
20
30
40
50
60
70
80
90
100
flu
ori
de C
on
ce
ntr
ati
on
in
mg
/l

Chapter 5: Phosphorus recovery from Chinese fertilizer industry wastewater
101
Figure 49: Experimental results of orthophosphate removal with different calcium doses
In the first stage, the goal is to remove only fluoride from wastewater and in the second stage,
as much phosphate as possible can be recovered. In Figure 49, the residual phosphate in
the treated effluent from the first stage reaction is presented. The overdose of calcium cased
also the removal of phosphate in the first stage. This has been confirmed by the MINEQL+
results showing that about 3% of phosphate is in the form of hydroxylapatite. With a molar
ratio [Ca2+]:[F-] of 1:1, 8% - 9% (13-15 mg/l) of orthophosphate was removed from
wastewater.
Sample 1(pH=4,
Ca:F=1:2)
Sample 2(pH=4,
Ca:F=1:1 )
Sample 3(pH=4,
Ca:F=2:1 )
Sample 4(pH =5,
Ca:F=1:2)
Sample 5(pH=5,
Ca:F=1:1 )
Sample 6(pH=5,
Ca:F=2:1 )
raw wastewater (mg/L) 173 173 173 173 173 173
after add calcium hydroxide (mg/L) 167 159 153 158 157 136
Removal rate (%) 3% 8% 12% 9% 9% 21%
0%
10%
20%
30%
40%
50%
60%
70%
80%
90%
100%
0
20
40
60
80
100
120
140
160
180
200
ph
os
ph
ate
co
nc
en
tra
tio
n i
n m
g/l

Chapter 5: Phosphorus recovery from Chinese fertilizer industry wastewater
102
5.4.2.2 Phosphate precipitation as struvite
Struvite precipitation from wastewater is influenced by a large number of parameters such as
pH of the reaction, molar ratio, interfering ions in the feed, reaction time, types of chemicals
added, types of the reactor used and temperature.
Influence of pH
The pH of the reaction plays a significant role during the struvite precipitation process, and
not only affects the amount of struvite precipitation, but also its purity. A variety of
magnesium and phosphate complex ions patterns in the reactor solution, including MgOH+,
Mg(OH)3-, MgH2PO4
+, MgHPO4, H3PO4, H2PO4-, HPO4
-2, MgPO4- can be formed when the pH
of the solution is varied (Bouropoulos & Koutsoukos, 2000).
Figure 50: Experimental results of orthophosphate removal efficiency with different pH values
Based on the jar test experiment, the optimum pH for phosphate precipitation was
investigated with a molar ratio Mg/P of 1. As shown in Figure 50, the optimal pH range of
phosphate removal was between 9 and 10. With a pH of less than 9, the removal efficiency
decreased significantly. The maximum removal efficiency of phosphate achieved was 96% at
pH 10.
Figure 51 gives the removal efficiency of orthophosphate in the two stages of the reaction. In
the first stage, under pH 4, only 4% of P was removed. By increasing the pH to 8, about 25%
P was precipitated. It has proved that, in the first stage, a lower pH 4-5 is more suitable.
0%
10%
20%
30%
40%
50%
60%
70%
80%
90%
100%
6 7 8 9 10 11 12
Re
mo
va
l ra
te o
f p
ho
sp
ha
te in
[%
]
pH Value

Chapter 5: Phosphorus recovery from Chinese fertilizer industry wastewater
103
Figure 51: Orthophosphate removal in the first and second stage of reaction
In the second stage, under the optimum condition, pH with 9 and 9.5, a molar ratio of Mg/P of
1 and 1.2 was tested. In this experiment, higher pH and Mg/P ratio increased the P removal
rate. The optimal condition was achieved at pH of 9.5 and Mg/P of 1.2 with 87%
orthophosphate removal. The residual concentration of 8.3 mg/l is below the discharge
standard of 15 mg/l.
Figure 52: Ammonium nitrogen removal in the second stage of the reaction
Sample 1 (stage1: pH =4,
Ca:F=1:2, stage2: pH =9,
Mg:P=1:1)
Sample 2 (stage1: pH =6,
Ca:F=1:2, stage2: pH =9,
Mg:P=1.2:1)
Sample 3 (stage1: pH =8,
Ca:F=1:2, stage2: pH =9.5,Mg:P=1.2:1)
raw wastewater 167 167 167
after stage 1 add Ca in [mg/l] 160.5 146 126
after stage 2 add Mg in [mg/l] 20.4 12.56 8.26
removal rate of stage 1 [%] 04% 13% 25%
removal rate of stage 2 [%] 75% 83% 87%
0%
10%
20%
30%
40%
50%
60%
70%
80%
90%
100%
0
20
40
60
80
100
120
140
160
180
ph
os
ph
ate
co
nc
en
tra
tio
n i
n m
g/l
Sample 1 (pH1=4, Ca:F=1:2,
pH 2=9,Mg:P=1:1)
Sample 2 (pH1=6, Ca:F=1:2,
pH 2=9,Mg:P=1.2:1)
Sample 3 (pH1=8, Ca:F=1:2,
pH 2=9.5,Mg:P=1.2:1)
raw wastewater 142.4 142.4 142.4
after stage 2 add Mg in [mg/l] 107.8 113.6 107.4
removal rate of stage 2 [%] 24% 20% 25%
0%
10%
20%
30%
40%
50%
60%
70%
80%
90%
100%
0
20
40
60
80
100
120
140
160
Am
mo
niu
m c
on
cen
trati
on
in
mg
/l

Chapter 5: Phosphorus recovery from Chinese fertilizer industry wastewater
104
Figure 52 shows the removal efficiency of ammonium nitrogen by struvite precipitation.
According to the calculation, the ammonium concentration is sufficient for the struvite
precipitation. A similar removal rate was observed in these three samples. There were about
100 mg/l still remaining in the wastewater for the biological treatment stage.
Figure 53: The removed molar concentration of orthophosphate, ammonium nitrogen and
magnesium in the second stage of reaction
Figure 53 shows the removed molar concentration of orthophosphate, ammonium nitrogen
and magnesium. Getting closer of these three molar ratios, a purer product can be formed.
The removed molar ratio of P:N:Mg in the second example was 2.0:2.1:1.9, Which is quite
close to the theoretical molar ratio of struvite Mg:N:P = 1:1:1. It can be inferred that, with a
pH value of 9, Mg:P ratio of 1.2:1, a pure struvite product (magnesium ammonium phosphate)
can be precipitated.
5.4.3 Jar-test results with wastewater from the fertilizer Industry
5.4.3.1 Raw wastewater concentration
Six raw wastewater samples were taken from the plant and were measured by local teams
from plant A. The phosphate concentration ranges quite a lot from 65 to 220 mg/l and
ammonia concentration ranges from 60 to 110 mg/l on different days. The ammonia
concentration is lower than the design parameters. A possible reason might be the weather
and construction work in this plant. According to the struvite solubility in water (around 200
mg/l), the struvite crystallization process is efficient for waste water containing more than 100
mg/l of soluble [PO4-P] and a soluble ammonia concentration higher than 50-70 mg/l. Under
this aspect, the wastewater in this plant contains enough phosphates and ammonium, which
is suitable for the struvite precipitation.
5.4.3.2 Results of Jar-Test 1
The main wastewater parameters of jar test 1 are shown in Table 28.
0.0
0.5
1.0
1.5
2.0
2.5
3.0
Sample 1 (stage 1: pH =4,Ca:F=1:2, stage 2: pH =9,
Mg:P=1:1)
Sample 2 (stage 1: pH =6,Ca:F=1:2, stage 2: pH =9,
Mg:P=1.2:1)
Sample 3 (stage 1: pH =8,Ca:F=1:2, stage 2: pH =9.5,
Mg:P=1.2:1)
rem
ova
l c
on
cen
tra
tio
n in
mm
ol
removal of ortho phosphate
removal of ammonium nitrogen
removal of magenesium
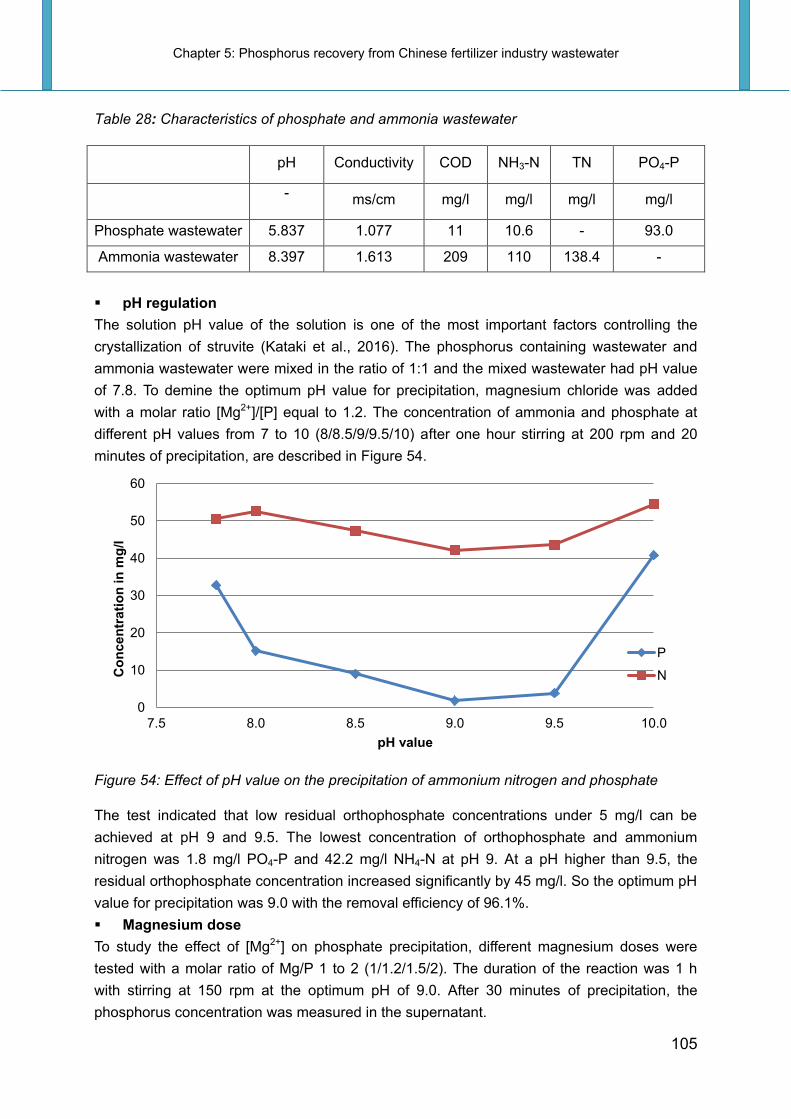
Chapter 5: Phosphorus recovery from Chinese fertilizer industry wastewater
105
Table 28: Characteristics of phosphate and ammonia wastewater
pH Conductivity COD NH3-N TN PO4-P
- ms/cm mg/l mg/l mg/l mg/l
Phosphate wastewater 5.837 1.077 11 10.6 - 93.0
Ammonia wastewater 8.397 1.613 209 110 138.4 -
pH regulation
The solution pH value of the solution is one of the most important factors controlling the
crystallization of struvite (Kataki et al., 2016). The phosphorus containing wastewater and
ammonia wastewater were mixed in the ratio of 1:1 and the mixed wastewater had pH value
of 7.8. To demine the optimum pH value for precipitation, magnesium chloride was added
with a molar ratio [Mg2+]/[P] equal to 1.2. The concentration of ammonia and phosphate at
different pH values from 7 to 10 (8/8.5/9/9.5/10) after one hour stirring at 200 rpm and 20
minutes of precipitation, are described in Figure 54.
Figure 54: Effect of pH value on the precipitation of ammonium nitrogen and phosphate
The test indicated that low residual orthophosphate concentrations under 5 mg/l can be
achieved at pH 9 and 9.5. The lowest concentration of orthophosphate and ammonium
nitrogen was 1.8 mg/l PO4-P and 42.2 mg/l NH4-N at pH 9. At a pH higher than 9.5, the
residual orthophosphate concentration increased significantly by 45 mg/l. So the optimum pH
value for precipitation was 9.0 with the removal efficiency of 96.1%.
Magnesium dose
To study the effect of [Mg2+] on phosphate precipitation, different magnesium doses were
tested with a molar ratio of Mg/P 1 to 2 (1/1.2/1.5/2). The duration of the reaction was 1 h
with stirring at 150 rpm at the optimum pH of 9.0. After 30 minutes of precipitation, the
phosphorus concentration was measured in the supernatant.
0
10
20
30
40
50
60
7.5 8.0 8.5 9.0 9.5 10.0
Co
nc
en
tra
tio
n in
mg
/l
pH value
P
N

Chapter 5: Phosphorus recovery from Chinese fertilizer industry wastewater
106
Figure 55: Effect of Mg/P molar ratio on precipitation of phosphate
It has been shown in Figure 55 that the removal efficiencies increased with the increase of
the Mg/P molar ratio from 1 to 1.5. With further increase of the Mg/P molar ratio, the
phosphate concentration increased in the supernatant. The lowest phosphorus concentration
was 9 mg/l with a molar ratio Mg/P of 1.5. The optimum molar ratio of Mg/P is 1.5 with the
removal efficiency of 81%.
Reaction time
At the optimum pH of precipitation 9.0, considering the optimum Mg/P molar ratio 1.5,
different durations of the reaction were tested ranging of 30 min to 2 h (for instance: 30 min /
1 h / 1 h 30 / 2h).
Figure 56: Efficiency of reaction time on precipitation of ammonium nitrogen and phosphate
The influence of the reaction time on the P and N removal efficiency is shown in Figure 56.
No significant changes were observed by increasing the reaction time. The lowest
concentration of ammonia and phosphorus was noticed in the 90 min reaction with 97% P
removal.
0
2
4
6
8
10
12
14
0.8 1.0 1.2 1.4 1.6 1.8 2.0 2.2
Co
nc
en
tra
tio
n in
mg
/l
Molar ratio of Mg:P
P
0
5
10
15
20
25
30
35
40
45
20 40 60 80 100 120
Co
nc
en
tra
tio
n in
mg
/l
Reaction time in [min]
P
N

Chapter 5: Phosphorus recovery from Chinese fertilizer industry wastewater
107
To summarize, in jar test 1, the optimum operating conditions leading to the precipitation of
the dissolved phosphate were determined. The jar tests showed a significant removal of
phosphate, more than 97% P-removal was achieved at the optimum condition (pH=9, molar
ratio of Mg/P 1.5; reaction time of 90 minutes). Under optimum conditions the P and N
removed from the solution was 1.44 and 0.91 mmol respectively. The molar ratio of the
removed P/N of 1.6 was more than the theoretical P/N molar ratio of struvite, i.e. 1. Therefore,
the precipitations did not consist of pure struvite.
5.4.3.3 Results of Jar-Test 2
In this experiment, different mixing ratios of two streams of wastewater were tested. In the
following Table 29 the key parameters of the wastewaters are analyzed.
Table 29: Characteristics of phosphate wastewater, ammonia wastewater and P-
concentrated process water
Water sample pH cond sCOD TOC NH3-N TN PO4-P TP
ms/cm mg/l mg/l mg/l mg/l mg/l mg/l
1 Phosphate wastewater 5.9 0.74 9.78 4.29 10.6 34.1 220 235
2 Ammonia wastewater 8.4 1.56 48.7 22.82 69.4 70.4 0.47 7.15
The phosphate wastewater and ammonia wastewater were mixed in the volume ratio of 1:1
and 2:1 under the optimum condition of Mg:P=1:1.2, pH= 9, reaction time of 60 min. The
concentration and removal rate of orthophosphate and ammonium nitrogen is given in Figure
57.
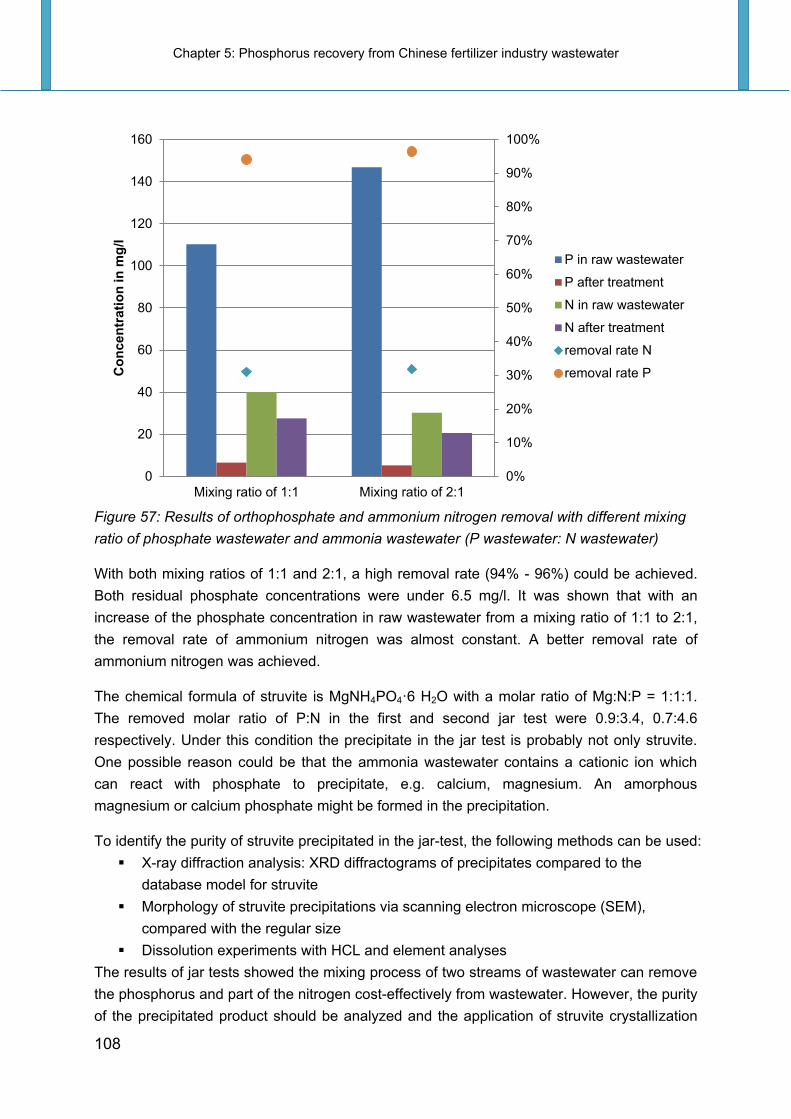
Chapter 5: Phosphorus recovery from Chinese fertilizer industry wastewater
108
Figure 57: Results of orthophosphate and ammonium nitrogen removal with different mixing
ratio of phosphate wastewater and ammonia wastewater (P wastewater: N wastewater)
With both mixing ratios of 1:1 and 2:1, a high removal rate (94% - 96%) could be achieved.
Both residual phosphate concentrations were under 6.5 mg/l. It was shown that with an
increase of the phosphate concentration in raw wastewater from a mixing ratio of 1:1 to 2:1,
the removal rate of ammonium nitrogen was almost constant. A better removal rate of
ammonium nitrogen was achieved.
The chemical formula of struvite is MgNH4PO4·6 H2O with a molar ratio of Mg:N:P = 1:1:1.
The removed molar ratio of P:N in the first and second jar test were 0.9:3.4, 0.7:4.6
respectively. Under this condition the precipitate in the jar test is probably not only struvite.
One possible reason could be that the ammonia wastewater contains a cationic ion which
can react with phosphate to precipitate, e.g. calcium, magnesium. An amorphous
magnesium or calcium phosphate might be formed in the precipitation.
To identify the purity of struvite precipitated in the jar-test, the following methods can be used:
X-ray diffraction analysis: XRD diffractograms of precipitates compared to the
database model for struvite
Morphology of struvite precipitations via scanning electron microscope (SEM),
compared with the regular size
Dissolution experiments with HCL and element analyses
The results of jar tests showed the mixing process of two streams of wastewater can remove
the phosphorus and part of the nitrogen cost-effectively from wastewater. However, the purity
of the precipitated product should be analyzed and the application of struvite crystallization
0%
10%
20%
30%
40%
50%
60%
70%
80%
90%
100%
0
20
40
60
80
100
120
140
160
Mixing ratio of 1:1 Mixing ratio of 2:1
Co
nc
en
tra
tio
n in
mg
/l
P in raw wastewater
P after treatment
N in raw wastewater
N after treatment
removal rate N
removal rate P

Chapter 5: Phosphorus recovery from Chinese fertilizer industry wastewater
109
processes still needs to overcome a constant wastewater concentration, different operating
factors such as Mg:P:N molar ratio, pH, aeration rate, reactor types, which can all have an
effect on the struvite quality.

Chapter 5: Phosphorus recovery from Chinese fertilizer industry wastewater
110
5.5 Dimensioning and design of a pilot plant
5.5.1 Process Description
Based on the jar test results, a pilot plant project was planned to be located in fertilizer plant
A. The project is based on the Struvia™ unit technology, which was developed by Veolia
France. The overall aim of this project is to develop a new method of wastewater treatment
technology with phosphorus recovery, combined with the local fertilizer production process.
The main pilot research topics in this project are crystallization processes, process reactor
and control.
The process flowsheet of the pilot is shown in Figure 58. The phosphate wastewater is first
treated in a reactor in order to remove fluoride. The two streams of wastewater are
proportional pumped into the regulation basin 2 and then in the main crystallization process
in the Struvia™ reactor. A magnesium source, usually liquid magnesium chloride with a
concentration of 33% is added. If the pH is not optimal, sodium hydroxide (NaOH) with a
concentration of 30% can also be added.
Figure 58: Flow of designed pilot system
An on-line [PO4-P], [NH4-N] and pH analyzer can be installed in the supernatant to check the
efficiency of the chemical precipitation in real time. As an option, an on-line turbidity analysis
of the supernatant allows checking the efficiency of the solid-liquid separation. Based on the
results, the operational conditions (mixing velocity, Mg/P ratio, TSS) can be adapted if
necessary.
The struvite crystals settle at the bottom of the Struvia™ reactor. A pump recirculates part of
the crystals into the reactor and another part of the struvite is drained in a gravity draining
system which allows dewatering struvite sludge. The struvite will be dried in the atmosphere
for several weeks and stored in a tank for the fertilizer production.

Chapter 5: Phosphorus recovery from Chinese fertilizer industry wastewater
111
Struvia™ Reactor
The crystallization reactor is the core of the pilot processing plant. In the Struvia™ reactor,
the two steps, crystallization and liquid/solid separation, take place in the same device. The
mixing zone is equipped with a vertical mixer, a draft tube and several baffles to optimize the
mixing and the chemicals injections. Above the mixing zone is an integrated lamellar settler
to ensure the separation of the treated effluent and the produced struvite particles. A
simplified scheme of the Struvia™ reactor is given in the Figure 59.
Figure 59: Simplified scheme of the Struvia™ reactor (source: Veolia)
In this pilot, the volume of the reactor in the pilot design is 1000 L with a daily treatment
capacity of 60 m³. With a hydraulic retention time (HRT) from 30 to 120 minutes under
optimum conditions, the removal rate of soluble [PO4-P] is about 90%.
5.5.2 Operating conditions
Based on the experience from the pilot installation of the Struvia™ process in Brussels, the
following operational parameters for the pilot plant are designed and listed in Table 30 and a
description of the designed parameters is given below:
Table 30: Design parameters of Struvia™ pilot plant (Stemann et al., 2014)
Characterisatio
n of pilot
Throughput of centrate [L/h] 500-2500 L/h
pH control by Caustis soda or lime
injection
Type of precipitation Struvite or CaP
Mixing velocity 30-300 rpm
Total reactor volume 1000 L
Liquor specific phosphorus yield [%] 80-95%
Operational
data obtained
from pilot study
Energy consumption [kWh per m³ wastewater] ≤ 0.3 (~0.2)
NaOH (30%) [kg/m3 wastewater] 0-0.6
Molar ratio of magnesium to phosphate [-] 1-2
Percentage of P in the product [weight %] 12-13

Chapter 5: Phosphorus recovery from Chinese fertilizer industry wastewater
112
The mixed water from regulation basin 2 is pumped into the mixing and reaction zone. In the
configuration magnesium chloride with a concentration of 33% is added. The molar ratio
Mg/P applied in the StruviaTM process varies from 1 to 2 according to the quality of the liquor
– in particular in term of TSS or calcium concentration - and the required quality of the
struvite product. The optimal pH is between 8 and 10, caustic soda or hydrochloric acid can
be added to control the pH value. The struvite crystals are retained directly in the reactor. A
certain concentration of struvite crystals or TSS is kept in the reactor to promote the crystals
growth and avoid nucleation. According to the data of the pilot installation of the StruviaTM
process in Brussels, electricity is consumed by the feed pump, which is estimated to
consume max. 0.1 kWh/m3 treated flow for an industrial unit, and by the reactor mixer which
consumes approximately 0.2 kWh/ m3.
The TSS concentration of the wastewater has an impact on the struvite crystallization.
Therefore, it should be less or equal to 1 g/l. In the case of fertilizer wastewater, the calcium,
carbonate, soluble COD or organic compounds contained there may have a negative effect
on struvite crystallization. In these cases, the operational conditions must be adapted for
struvite crystallization (i.e. the Mg/P ratio applied) and/or a specific pre-treatment may be
necessary.
Another option for the fertilizer industry may also be suitable: calcium phosphate precipitation
instead of struvite. By adding lime, the pH of wastewater raises and at the same time
provides calcium to precipitate phosphates. It is also possible to use caustic soda for pH
adjustment to approx. 8 and to use pricier calcium chloride as the precipitation agent. The
precipitated product Hydroxy Apatite (HAP) can be directly used as raw material for the
fertilizer production.
5.5.3 Cost estimation for the pilot plant
Principally, the total cost of the pilot plant can be categorized into two main types of costs:
construction costs and operation & maintenance cost.
5.5.3.1 Cost estimation for the construction of the pilot plant
The main components of the pilot plant are two equalization tanks, one fluidized bed reactor,
one Struvia™ reactor and a gravity draining system. The infrastructure systems include a
piping system, electrical system and site preparation etc. The estimated price for this pilot
plant in a container is about 123,998 € in total and the details are summarized in the
following Table 31.

Chapter 5: Phosphorus recovery from Chinese fertilizer industry wastewater
113
Table 31: Summary of construction cost for the pilot plant
Equipment Price Remark
Display module pH&Temp 1,100 €
pH (Temp) 270 €
pH instalation 400 €
NH4-N online 7,500 €
PO4-P online 7,500 €
Stamoclean 2,500 € sample preparation
Flowmeter 1 1,300 € feed for StruviaTM reator
Flowmeter 2 1,200 € recycle for StruviaTM reator
Flowmeter 3 1,300 € feed for fluoride removal reator
Pump 1, feed 3,000 € feed
Pump 2, recycle 2,500 € recycle
Pump 3, NaOH 2,000 € NaOH
Pump 4, MgCl2 2,000 € MgCL2
Pump 5, feed 3,000 € feed
Pump 6, feed 3,000 € feed
Pump 7, 2,000 € Ca(OH)2
Pump 8 2,000 € HCL
Pumpe 9 3,000 € feed
Engine 1 1,000 € Reactor
Mixer 600 €
Engine 2 1,000 € Reactor
Mixer 600 €
Engine 3 1,000 € Basin 3
Mixer 600 €
Engine 4 1,000 € Basin 4
Mixer 600 €
Level Control 1 100 € Regulation tank, feed pump off at low level
Level control 2 100 €
Switch Cabinett 12,000 € Including frequency converter etc
Computer 2,500 € Data storage and process control
UPS 1,000 € Uninterrupted power supply
Regulation basin 1 500 € 100 L, PE or similar
Regulation basin 2 800 € 200 L, PE or similar
StruviaTM reactor 10,000 € 500 L, stainless steel
Fluoride removal reactor 5,000 € 500 L, stainless steel
Lamella 1,500 €
Chemical basin 1 300 € 50 L, PE or similar, NaOH
Chemical basin 2 300 € 50 L, PE or similar, HCL

Chapter 5: Phosphorus recovery from Chinese fertilizer industry wastewater
114
Chemical basin 3 300 € 50 L, PE or similar, MgCl2
Chemical basin 4 300 € 50 L, PE or similar, Ca(OH)2
Programming 7,500 €
Wiring 5,000 €
Piping 8,000 € PE or similar
Container 7,500 € including heating, light
Total 104,200 €
With taxes 123,998 €
In Chinese CNY 954,784 CNY 1 EUR = 7.70 CNY, (on 1 July 2017)
5.5.3.2 Cost estimation for the operation and maintenance cost of the pilot plant
The operation and maintenance cost (O&M) is estimated based on the operation and
maintenance activities of the pilot plant in one year. The main operational costs for the
struvite unit are chemicals, electricity, labor and maintenance costs. The main O&M activities
of this pilot plant are summarized as follows in Table 32:
Table 32: Summary of operation and maintenance cost for the pilot plant
Operational costs for Struvite pilot Unit
Operational data
Market
Price
Costs for 50 t/d
Wastewater in
CNY
Cost
(CNY/year)
Magnesium powder
(46%)
0.75 kg m3treated flow
(Molar ratio
Mg:P=1.2)
500-800
CNY/t 18.75 - 30 8896
Sodium Hydroxide
(30% solution) 0.2 kg/ m3
treated flow 500-600
CNY/t 5 - 6 2008
Total electricity 0.5 kWh/m3treated flow
0.6
CNY/kWh 15 5474
Maintenance, labor
personal cost - - 100 36,500
Total - - 138.75-143.5 52,879

Chapter 5: Phosphorus recovery from Chinese fertilizer industry wastewater
115
5.6 Economic feasibility study for the new concept of wastewater treatment
5.6.1 Recovered product
The process for phosphorus recovery from wastewater provides a solid mineral phosphorus
product by precipitation or crystallization. If the phosphate rich stream is mixed with the
ammonium rich supernatant, there is a good chance of producing struvite, i.e. magnesium
ammonium phosphate (MgNH4PO4). If the phosphate wastewater or ammonia wastewater
contains a high content of potassium or calcium, the recovery of the phosphate can be done
through the formation of magnesium potassium phosphate (MKP or KMP, also K-Struvite) or
Calcium phosphate (CaP, HAP, DCPD).
B to B for selling to fertilizer plant as "ordinary fertilizers"
After having discussed the issue with the chief engineer of this fertilizer group, the company
is willing to buy the recovered product for the price of "ordinary fertilizers" and use it as a raw
ingredient in their product. To sell as phosphate fertilizer, the price of 1% P2O5 in one ton of
the product is between CNY 35.0 to 40.0 (EUR 5.0-5.7). The product should not be obtained
in very high purity but it should contain less than 2 percent of water. If needed, the surplus
heat in the factory can be used for drying the recovered product.
B to B for fertilizer manufacturers or distributors as “special fertilizers”
An alternative to supplying the product directly to end-users is to sell it to another slow-release
fertilizer manufacturer to sell the product separately or use it as an ingredient in their products.
If the recovered product can be registered by the Administration of Industry in China, the
product can be sold separately as special fertilizers at a higher price.
B to C as garden fertilizer
The product can also be sold in bulk as garden or landscapes fertilizer to costumers online.
In Germany, Berliner Wasserbetriebe sold part of the "Berliner Pflanze" fertilizer from sludge
in a transparent and recyclable plastic bucket (250 g net weight) at a price of 5.0 €/kg. Large
part of struvite was sold for farmers at a bulk price of 20 €/t.
5.6.2 Fertilizer industry analysis in China
Over the past decade, domestic phosphate rock production has increased dramatically in
China. At the same time, the five main production provinces in China, Hubei, Hunan, Sichuan,
Guizhou and Yunnan, have planned to reduce the number of phosphate producers by
shutting down operations under 150,000 tons and decreasing access to phosphate mining
rights (MLR, 2012b). The Chinese fertilizer industry has been experiencing a trend towards
fewer producers with larger herd sizes.
According to market research, there were in total 1,861 companies in fertilizer production and
the ammonia industry in China in 2015 (CNCIC, 2016). The fertilizer companies, which
produce water soluble fertilizers, e.g. NPK compound fertilizers, diammonium phosphate,
monoammonium phosphate, monopotassium phosphate, may have high concentrations of
phosphorus and ammonia in their wastewater. Based on the numbers of compound fertilizer,
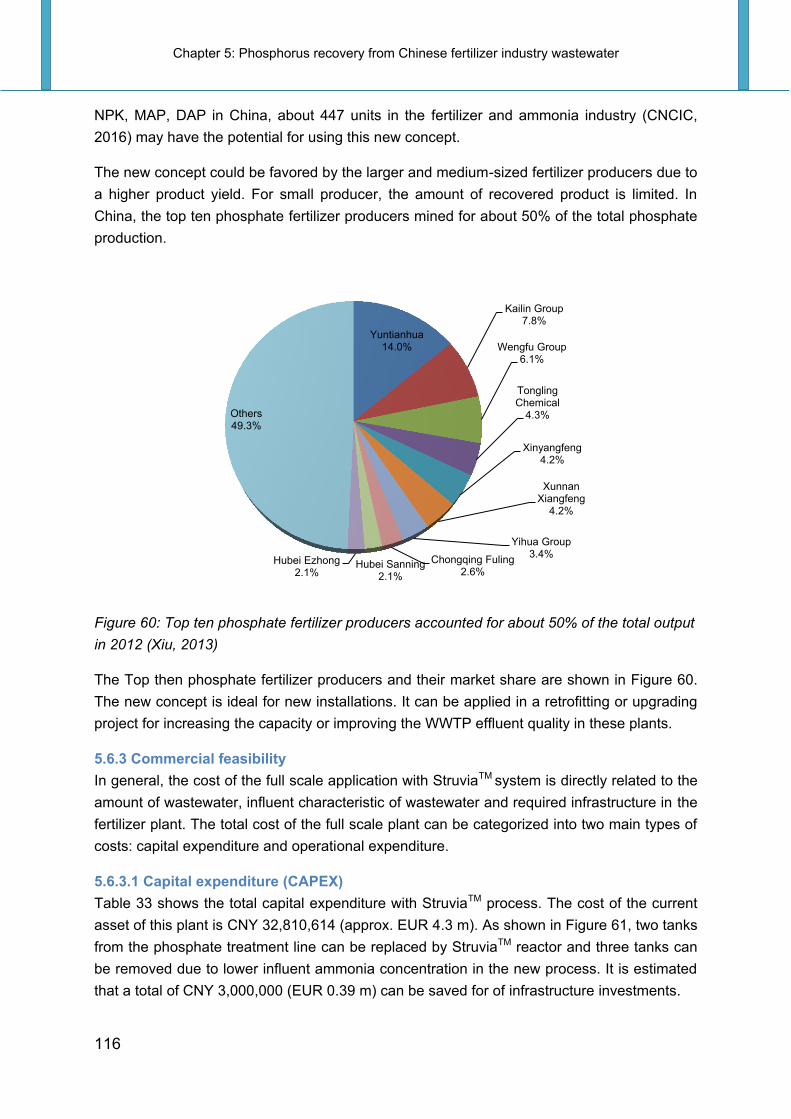
Chapter 5: Phosphorus recovery from Chinese fertilizer industry wastewater
116
NPK, MAP, DAP in China, about 447 units in the fertilizer and ammonia industry (CNCIC,
2016) may have the potential for using this new concept.
The new concept could be favored by the larger and medium-sized fertilizer producers due to
a higher product yield. For small producer, the amount of recovered product is limited. In
China, the top ten phosphate fertilizer producers mined for about 50% of the total phosphate
production.
Figure 60: Top ten phosphate fertilizer producers accounted for about 50% of the total output
in 2012 (Xiu, 2013)
The Top then phosphate fertilizer producers and their market share are shown in Figure 60.
The new concept is ideal for new installations. It can be applied in a retrofitting or upgrading
project for increasing the capacity or improving the WWTP effluent quality in these plants.
5.6.3 Commercial feasibility
In general, the cost of the full scale application with StruviaTM system is directly related to the
amount of wastewater, influent characteristic of wastewater and required infrastructure in the
fertilizer plant. The total cost of the full scale plant can be categorized into two main types of
costs: capital expenditure and operational expenditure.
5.6.3.1 Capital expenditure (CAPEX)
Table 33 shows the total capital expenditure with StruviaTM process. The cost of the current
asset of this plant is CNY 32,810,614 (approx. EUR 4.3 m). As shown in Figure 61, two tanks
from the phosphate treatment line can be replaced by StruviaTM reactor and three tanks can
be removed due to lower influent ammonia concentration in the new process. It is estimated
that a total of CNY 3,000,000 (EUR 0.39 m) can be saved for of infrastructure investments.
Yuntianhua 14.0%
Kailin Group 7.8%
Wengfu Group 6.1%
Tongling Chemical
4.3%
Xinyangfeng 4.2%
Xunnan Xiangfeng
4.2%
Yihua Group 3.4%
Chongqing Fuling 2.6%
Hubei Sanning 2.1%
Hubei Ezhong 2.1%
Others 49.3%

Chapter 5: Phosphorus recovery from Chinese fertilizer industry wastewater
117
Table 33: Summary of capital expenditure with StruviaTM process for the full scale application
Categories Facility Capacity Cost (CNY)
CAPEX basic Scenario
32,810,614
CAPEX savings on P
treatment line
Coagulation tank 2 100 m3
-1,400,000 Flocculation tank 2 100 m3
Final Clarifier 1600 m3
CAPEX savings on N
treatment line
Anoxic tank 2 1950 m3 -1,600,000
Aeration Tank 2 550 m3
Additional CAPEX for P
recovery
StruviaTM reactor 2*250 m3 6,000,000
P+N joint treatment
capacity increase
from 200 m3/h
to 450 m3/h 2,800,000
CAPEX P-recovery as
StruviaTM scenario
38,610,614
9.79 CNY/m3
treated
Increase of Investment 5,800,000
The additional construction and installation cost of one industry scale-design StruviaTM
reactor is estimated to be CNY 6,000,000 with a treatment capacity of 400 m³/h. The new
ammonia treatment line should increase its capacity from 200 m³/h to 450 m³/h. The
incensement of invest for such a new plant is in total about CNY 5,800,000, which is about
17% of the total investment in the basic scenario.

Chapter 5: Phosphorus recovery from Chinese fertilizer industry wastewater
118
①
②
Figure 61: The current wastewater treatment process (1) and the new process with struvite recovery (2)
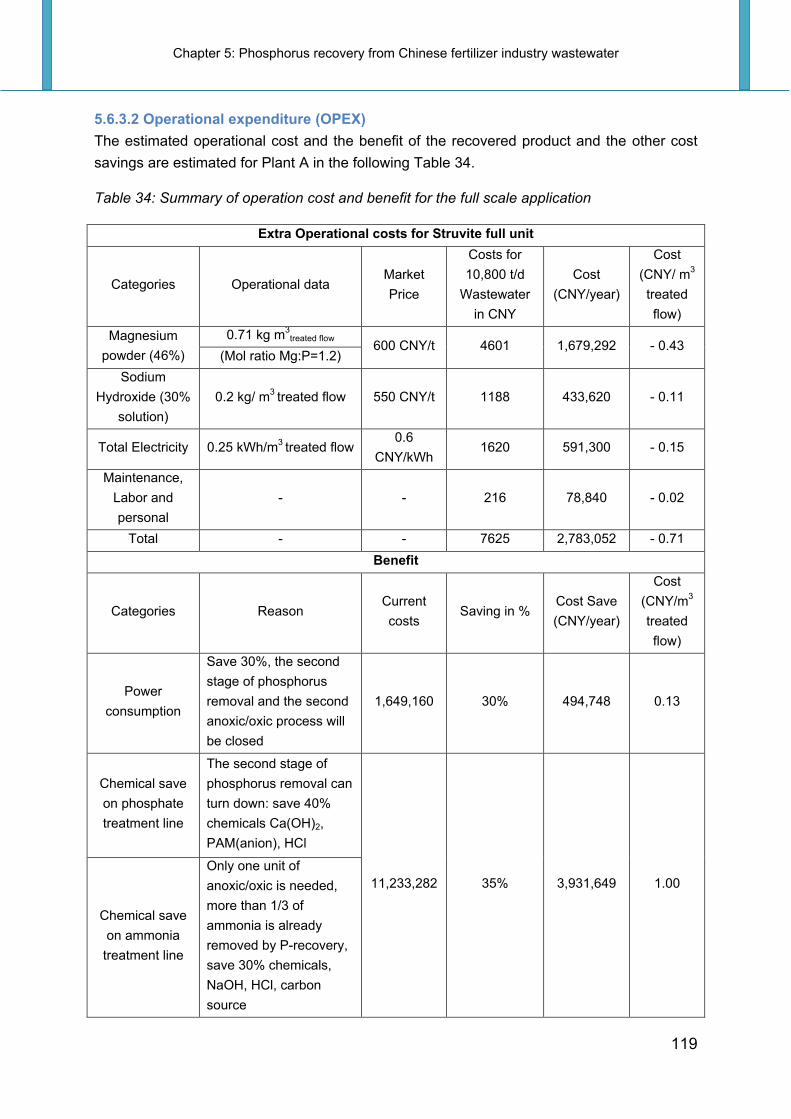
Chapter 5: Phosphorus recovery from Chinese fertilizer industry wastewater
119
5.6.3.2 Operational expenditure (OPEX)
The estimated operational cost and the benefit of the recovered product and the other cost
savings are estimated for Plant A in the following Table 34.
Table 34: Summary of operation cost and benefit for the full scale application
Extra Operational costs for Struvite full unit
Categories Operational data Market
Price
Costs for
10,800 t/d
Wastewater
in CNY
Cost
(CNY/year)
Cost
(CNY/ m3
treated
flow)
Magnesium
powder (46%)
0.71 kg m3treated flow
600 CNY/t 4601 1,679,292 - 0.43 (Mol ratio Mg:P=1.2)
Sodium
Hydroxide (30%
solution)
0.2 kg/ m3 treated flow 550 CNY/t 1188 433,620 - 0.11
Total Electricity 0.25 kWh/m3 treated flow
0.6
CNY/kWh 1620 591,300 - 0.15
Maintenance,
Labor and
personal
- - 216 78,840 - 0.02
Total - - 7625 2,783,052 - 0.71
Benefit
Categories Reason Current
costs Saving in %
Cost Save
(CNY/year)
Cost
(CNY/m3
treated
flow)
Power
consumption
Save 30%, the second
stage of phosphorus
removal and the second
anoxic/oxic process will
be closed
1,649,160 30% 494,748 0.13
Chemical save
on phosphate
treatment line
The second stage of
phosphorus removal can
turn down: save 40%
chemicals Ca(OH)2,
PAM(anion), HCl
11,233,282 35% 3,931,649 1.00
Chemical save
on ammonia
treatment line
Only one unit of
anoxic/oxic is needed,
more than 1/3 of
ammonia is already
removed by P-recovery,
save 30% chemicals,
NaOH, HCl, carbon
source

Chapter 5: Phosphorus recovery from Chinese fertilizer industry wastewater
120
other costs Administrative,
Personnel, Maintenance 707,805 10% 70,781 0.02
Total benefit without struvite 4,497,178 1.14
Potential for
additional
revenue: Sale
price for Struvite
0.45 kg Struvite/ m3
treated flow
1000 CNY/t
Struvite 4500 CNY/d 1,773,900 0.45
Total benefit including struvite 6,139,678 1.59
Total savings including struvite 3,488,026 0.88
Current operation costs 16,250,630 4.12
The estimated operational cost savings in plant A of the full scale application with a treatment
capacity of 10,800 m³/d is about CNY 0.88 per m3 treated wastewater with the sale of the
struvite product and CNY 0.43 per m3 treated wastewater without selling the product. The
current operational cost of the full scale plant is CNY 4.12 per m3 treated wastewater. This
means approximately 21% percent of OPEX saving can be achieved. A total cost saving of
CNY 3,488,026 (approx. EUR 0.45m) per year in this plant can be realized with this
innovative method, including the product sale, power and chemical save.
The cost for the magnesium chloride that has to be added is estimated to be around CNY
600 per t magnesium chloride powder and the cost for Sodium hydroxide (30% NaOH)
solution is CNY 550 per ton. To reduce this cost, waste streams from other industries
containing magnesium and sodium hydroxide can be sourced.
The full-scale unit with a throughput of 100,800 m³/d wastewater requires about 0.71 kg/m³ of
46% magnesium chloride powder (Mg:P=1.2), 0.2 kg/m³ of 30% sodium hydroxide. This
calculation is based on the mixed fertilizer wastewater containing 89 mg/l PO4-P mg/l soluble
phosphorus and with 80 % phosphorus removal by the StruviaTM Process.
Other operating costs (labor and electricity) are estimated to be:
• Labor: One person for one hour per day at a rate of CNY 100 per hour
• Electricity: 120 CNY per day (average industrial electricity price in China is estimated to
be CNY 0.6 per kWh, with energy consumption 0.25 kWh per m³ wastewater)
The total OPEX of the new concept include chemicals, operating and electricity without
selling struvite is estimated to be CNY 3.24 per ton of wastewater.
Sale price for fertilizer
According to the calculation about 4.5 t/d of struvite can be produced in this plant. The
potential selling price for CaP is lower than for struvite depending on the nutrient types and
content. Based on the phosphorus content alone, a sales price of recovered product CNY
1000 per ton is possible. This would be the price if the struvite was to be used in broad-scale
agriculture. However, the intention is to use struvite as a “boutique” fertilizer for specialized
applications. For those applications, a much higher sales price until CNY 3000-4000 per ton

Chapter 5: Phosphorus recovery from Chinese fertilizer industry wastewater
121
can be achieved. Based on the price of CNY 1000 per ton, the value of recovered product is
estimated at CNY 0.45 per ton of wastewater treatment.
Saving costs for chemicals The phosphate compound in the fertilizer wastewater is typically treated by neutralization,
coagulation, flocculation and precipitation with lime, PAC and PAM. An overall phosphate
removal of 80% can be achieved by this unit and thus part of the costs can be saved. On the
ammonia wastewater treatment line, about 1/3 of ammonia can be recovered in struvite. The
carbon source and other chemicals can be saved. According to the overall chemical use,
approximately 35% of the chemical costs for wastewater treatment can be saved, which
means saving about CNY 1.08 per ton of wastewater for the costs of chemicals.
Environmental benefits It is important to highlight that the recovery of phosphorus from wastewater involves
important environmental benefits because it prevents eutrophication in the receiving
environment, and increases the availability of non-renewable resource phosphorus.
Financial outcomes with different commercial scenarios The financial plan of this process includes revenues from the wastewater treatment service
provided and the sale of the fertilizer product. Expenditure is mainly centered on capital
acquisitions of P-recovery Process StruviaTM units, the actual costs of which may be less
than the current estimates used in these calculations, significantly increasing profits returned.
Table 35: Different business scenarios for the application of the new technology
Base scenario Commercial scenario 1 : Commercial scenario 2 :
A plant current Wastewater is treated at the
same price, struvite is given
back to the client for free
Wastewater is treated at a
lower price, struvite is
resold to the client at a low
market price
CNY/m3
CNY/m3
CNY/m3
OPEX 4.12 3.24 3.24
CAPEX
depreciation
(10 years
amortization)
0.83 0.98 0.98
Margin/Profit
0.99
20% of (OPEX
+ Depreciation)
1.72
Treatment price - OPEX -
CAPEX depreciation
0.84
20% of (OPEX +
Depreciation)
Treatment price for
the client 5.94 5.94 5.56
Profit A Plant in
CNY/a 36,441,256 63,404,883 31,048,531

Chapter 5: Phosphorus recovery from Chinese fertilizer industry wastewater
122
Different commercial scenarios are shown in Table 35. As compared with the base scenario,
scenario 1 seems to be the best option. Wastewater from the plant is treated at the same
price as before and the recovered product struvite is given back to the client for free, which
reveals a significant increase in annual profits of 74%.

Chapter 5: Phosphorus recovery from Chinese fertilizer industry wastewater
123
5.7 Conclusion
In this chapter, a promising new approach for the treatment of wastewater from the fertilizer
industry with phosphate recovery was developed. The major findings from this study are
summarized as follows.
Based on the jar test result with synthetic wastewater, an effective two stage process fluoride
removal and phosphate recovery has been found. In the first stage, it was observed that
under optimum conditions, with a pH between 4 and 5, and a molar ratio [Ca2+]:[F-] of 1:1, 75%
removal of fluoride can be achieved. The residual concentration of fluoride can meet the
discharge limits. In the second stage, 87% of orthophosphate and 25% ammonium nitrogen
were precipitated under the condition of pH 9.5, with a molar ratio Mg/P of 1.2.
The jar test with real wastewater shows similar results. A significant removal of soluble
phosphate, more than 97% P-removal was achieved by mixing of ammonia and phosphate
wastewater under the optimum condition (pH=9, molar ratio of Mg/P 1.5; reaction time of 90
minutes). However, the purity of the precipitated product still needs be analyzed. Different
operating factors with an impact on the struvite quality should be further optimized, such as
Mg:P:N molar ratio, pH, reactor types.
The feasibility of building a StruviaTM pilot plant and full scale plant for the fertilizer industry is
also discussed in this study. Results showed that mixing ammonia and phosphate
wastewater together with the production of struvite can be cost-effective. When fully
operational in this plant with this concept, the nutrient-recovery plant is expected to produce
about 1,643 tons of struvite per year. The recovered struvite can be used in the agriculture,
turf and ornamental markets. The operational cost savings are the highlight of this new
concept: approximately 21% of OPEX savings can be achieved in plant A.
The basic advantages/benefits of this new approach are:
Simple structures and flexibility in application, minimizing installation footprint
Saving operational costs, reducing the phosphorus and nitrogen load for the following
treatment
Yield of struvite (TURNING WASTE INTO FERTILIZER)
Lower demand for chemicals
Increase of the overall energy efficiency
Reducing emissions and improving the environment
Chapter 6: General discussion and outlook
124
Chapter 6: General discussion and outlook In this research, a variety of different approaches for phosphorus recovery and recycling
have been analyzed. As shown in Figure 6.1, at a municipal wastewater treatment plant,
phosphorus can be recovered and recycled from different locations.
The first option is direct land utilization of sewage sludge with 40% - 90% P recovery
potential with regards to the WWTP influent, mainly dependent on the plant availability of the
nutrient. This option is suitable for small and medium-sized WWTPs. It is considered as one
of the most economical ways for sludge disposal and phosphorus recycling, but the presence
of toxic heavy metals, organic contaminants and pathogens in the sewage sludge greatly
limits its direct use as a fertilizer. The regulations for the use of sewage sludge in agriculture
are different from country to country. In Europe, some countries have already banned or are
phasing out this traditional route, i.e. The Netherlands, Switzerland, Norway, and Belgium. In
China, the quantity, duration and quality of sludge applied to agriculture should meet the
requirements of relevant agricultural standards and regulations. However, many WWTPs in
China exceeded the concentration limits of heavy metals in sludge due to the wastewater
derived from high-density industrial zones, non-ferrous metal ores and anthropogenic
activities. To ensure the quality of sludge, the source control of wastewater, especially the
industry wastewater, and reduced use of chemicals in WWTPs are needed. P-recycling via
agricultural application of sludge may still be the dominant route for some countries within a
certain period, especially in developing countries. However, for reasons of human health, the
quality of biosolids for land application should be strictly controlled.
The second option includes recovery of the dissolved P in the aqueous sludge phase prior to
dewatering and sludge liquor after dewatering. The maximum recovery potential from the
aqueous phase and sludge phase without or with forced P dissolution is 25% and 50%
respectively. The phosphorus recovery as struvite is a mature technology, which is applied in
more than 40 full-scale plants worldwide. Due to the operational benefits and easy
integration within the existing infrastructure, the struvite processes will grow very fast, even
without law enforcement. The limitation of this option is only applicable to plants with an
EBPR system and recovery of only 25% of influent phosphorus. To overcome these
limitations, a forced P re-dissolution with acidic leaching or thermal hydrolysis pretreatment
of sludge can improve the P-recovery rate to 50% and is also suitable for the WWTPs with
chemical P elimination. The recovered product from sludge extraction is mainly in the form of
struvite, dicalciumphosphat and calciumphosphat.
The third option, P-recovery from ash provides the best opportunity for maximum phosphorus
recovery. More than 80% of influent P at WWTPs can be recovered by wet-chemical or
thermal processes from the mono-incineration ash. This option depends on existing mono-
incineration facilities or needs high capital investment on mono-incinerators. The favored
recovery product from ash tends to be H3PO4 and P4. The further promotion of this option will
depend on law enforcement, e.g. in countries like Switzerland and Germany.

Chapter 6: General discussion and outlook
125
Figure 62: Possibilities of phosphorus recovery from sewage sludge (modified) (Kabbe, 2015;
Schaum, 2016)
In Chapter 2, a starch-based biodegradable polymer was tested and examined to meet the
regulation of German Fertilizer Ordinance for agricultural use. A more stringent regulation of
German fertilizer ordinance requires the degradation of 20% of the synthetic additives like
polymeric substances within two years or with limitation of amount of 45 kg active substance
(AS) per hectare within three years. This chapter aimed at assessing the use of starch-based
polymers for full-scale dewatering of municipal sewage sludge. The successive approach
through lab-scale and pilot-scale trials paved the way for full-scale trials at three WWTPs in
Germany. The general feasibility to apply starch-based “green” polymers in full-scale
centrifugation was demonstrated. Depending on the sludge type and the following process
step, the substitution potential was up to 70%. The substitution of 20-30% of polyacrylamide-
>80% P
<25% P
Sludge metallurgic
Effluent
Sludge after dewatering
Sludge drying
ASH Acid leaching
Monoincineration
P precipitation
Thermochemical
treatment P product
Contaminated residues
Hygienisation
OMF production
P product
Sludge dewatering
Wastewater treatment Influent
100% P 10% P
90% P
Sludge digestion
P product
Sludge Wet chemical
treatment
Precipitation
Sludge liquid
Precipitation/
Crystallization
P product
P product
<50% P

Chapter 6: General discussion and outlook
126
based polymer was demonstrated achieving similar total solids of the dewatered sludge. The
optimization of operational parameters as well as machinery set up in WWTPs is
recommended in order to improve the shear stability of sludge flocs and to achieve higher
substitution potential. It is suggested that the starch-based biodegradable polymer has great
potential as an alternative polymers to synthetic polymer in sludge dewatering.
In Chapter 3, a comparative Environmental Life Cycle Assessment of phosphorus recovery
with 1-reactor system versus 3-reactor system of AirPrex® reactors at WWTP
Wassmannsdorf and Amsterdam West was investigated. The reference system is defined as
the sludge line treating the mixed sludge of WWTP Wassmannsdorf. Both AirPrex
configurations have positive energy benefits and better environmental credits for the GWP,
FEP, and MEP. The major contributors to the energy impacts in 3-reactor configuration are
electricity for AirPrex reactor (62.6%) and production of magnesium chloride (36.5%) while
the main energy benefits are from the heat for district heating to substitute natural gas
(40.2%), electricity production in mono-incineration (20.9%), reduced polymer demand
(17.5%), the substitution of conventional N and P-fertilizer (10%) and the reduced electricity
for return load (3.5%).
The 3-reactor configuration shows better results in cumulative energy demand with 35%
improvement of energy surplus, 36% reduction of global warming potential and less
eutrophication potential. The different results of both reactors are mainly caused by the
reactor design and the harvesting efficiency. It is suggested that, when installing a new
AirPrex reactor, the three-reactor system is recommended due to a higher struvite harvesting
and lower environmental impact and reasonable investment return. In WMD, the NH3
emissions into the air can be reduced by instilling of a biofilter. At the same time, it is also
important to realize that, the further development of technology, e.g. AirPrex®, can be
practiced not only in the laboratory or pilot plant but also in full-scale operation.
In Chapter 4, an analysis of the potentials and limitations of existing P recovery technologies,
taking into account their applicability to different types of WWTPs in China, shows that a
huge amount of phosphorus is transferred to wastewater and sludge. China's municipal
wastewater contains up to 293,163 Mg/a of phosphorus which equals approximately 5.5% of
chemical phosphorus fertilizer consumed in China. However, some limitations should be
taken into consideration, e.g. the existing WWTP infrastructure and sludge disposal routes.
With the increasing of sludge digestion in the future, P recovery from sludge with struvite can
be seen as the best option to solve the problem of struvite incrustations at WWTPS. In most
cases of recovery from sludge water, dissolution of P from solid sludge into the aqueous
phase is needed. In special cases, sludge with an extremely high concentration of
phosphorus potentially may provide positive economic effects for the recovery of phosphorus,
e.g. in Yunnan and Hong Kong. The average concentration of phosphorus in sludge and
sludge ash in China is lower than that in Germany due to the high sand content in sludge and
a lack of separation of rain water and municipal sewage. The recovery from industrial
wastewater with a high concentration of phosphorus e.g. fertilizer industry, milk production

Chapter 6: General discussion and outlook
127
industry, shows a higher potential than the municipal WWTPs due to easier market access
and benefits to its operators.
Unlike in Europe, phosphate rock deposits are abundant in China and the country is the
world’s largest producer (mining and processing) of phosphate rock. But China is also the
largest fertilizer producing and consuming country in the world. The Chinese fertilizer
wastewater contained about 12,000 Mg P in 2014. In Chapter 5, a promising new approach
for the treatment of fertilizer industry wastewater with high phosphate and fluoride
concentration was developed. According to jar test result with synthetic wastewater and real
wastewater from a Chinese fertilizer plant, an effective method of soluble phosphate
recovery and fluoride removal has been developed. The optimum operating conditions
leading to the precipitation of the dissolved orthophosphate and ammonium nitrogen were
determined. The jar tests showed a significant removal of phosphate, about 95% P-removal
and 30% N-removal was achieved at the optimum condition (pH=9, molar ratio of Mg/P 1.2;
reaction time of 60 minutes) with real fertilizer wastewater. Results show that the mixing of
ammonia and phosphate wastewater yielding struvite can be cost-effective. The feasibility of
phosphorus recovery at a Chinese fertilizer production plant has also been proven.
There is no doubt that phosphorus is a finite resource. In the past few years, the
development of P-recovery technologies is quite fast, from lab-scale to full-scale plants,
showing that P-recovery is technically feasible. The pioneer countries like Germany and
Switzerland already make phosphorus recycling from sewage sludge obligatory. However,
the economical feasibility for P-recovery from ash, the revision of the EC fertilizer regulation,
EC organic farming regulation and national polices still have an influence on the
implementation of the developed technologies. More efforts should be taken to increase both
energy and resource efficiency. The next generation competitive technologies should not
only focus upon the recovery of the single nutrient P in isolation, but rather more on
combined recovery of energy and nutrients, tapping synergies etc. The integrated solution
combining complementary struvite recovery processes and ash recovery processes can
reach the maximum P-recovery potential from wastewater and sludge.
P-recovery plants are currently mainly located on three continents: Europe, North America
and East Asia. There is no “one-fits-all” solution for phosphorus recovery for all countries.
The most appropriate way of P recovery and recycling may differ from region to region under
different national context. With an expected increasing percentage of municipal sewage
sludge digestion and biological phosphorus removal systems, P recovery as struvite and
recycling it as a next generation fertilizer is recommended as one of the favorable options for
all countries. The recovery from industrial wastewater with a high concentration of
phosphorus can also be promoted due to easier market access and benefits to its operators.
Based on the experience of leading countries in phosphorus recovery (Germany, The
Netherland, Switzerland, and Japan etc.), the following suggestions are given and can be
used as a reference for other countries.

Chapter 6: General discussion and outlook
128
Building a platform or a nation-wide association among industry, academia, and
government to promote sustainable P-management
Bringing together a wide range of stakeholders, filling knowledge and information
gaps between different sectors
Developing a strategy for a long-term perspective in sustainable P-recovery and raise
public awareness
Creating value chains bridging the gap between recovery and actual recycling for a
sustainable market and new business opportunities
Creating a legal framework to govern P recycling as a level playing field for primary
source and secondary (recovered) source nutrients

Reference
129
Reference Achat, D.L., Sperandio, M., Daumer, M.-L., Santellani, A.-C., Prud'Homme, L., Akhtar, M.,
Morel, C. 2014. Plant-availability of phosphorus recycled from pig manures and dairy
effluents as assessed by isotopic labeling techniques. Geoderma, 232, 24-33.
Adam, C., Krüger, O., Herzel, H. 2015. Phosphorus flows in German sewage sludge ashes
and potential recovery technologies. Mining the Technosphere 2015, Vienna.
Alexander, P., Brown, C., Arneth, A., Finnigan, J., Moran, D., Rounsevell, M.D.A. 2017.
Losses, inefficiencies and waste in the global food system. Agricultural Systems, 153,
190-200.
Aly, M.M., Ahmad, A.M., Khalifa, M.I., El-Asmy, A.A. 2013. Production of Calcium
monohydrogenphosphate from Sebaiya Phosphate Ore Leached by Nitric Acid.
European Chemical Bulletin, 2(10), 752-757.
Asimov, I. 1959. Life’s bottleneck. The Magazine of Fantasy and Science Fiction, 16(4), 31-
40.
AWA. 2017. Benefits of land application, Australian Water Association.
https://www.biosolids.com.au/info/benefits-of-land-application/.
BAFU. 2013. Sludge disposal in Switzerland, Swiss Federal Office for the Environment.
https://www.bafu.admin.ch/bafu/en/home/topics/waste/guide-to-waste-a-
z/biodegradable-waste/types-of-waste/effluent-sludge.html.
Bao, Y., Li, M., Zhang, Q. 2016. Research on the large-scale application of nitrogen removal
for the treatment of synthetic ammonia wastewater. Desalination and Water
Treatment, 57(27), 12763-12769.
Bergmans, B. 2011. Struvite recovery from digested sludge At WWTP West. in: Faculty of
Civil Engineering and Geosciences, Vol. Master of Science, Delft University of
Technology.
BGBL. 2017. Zweite Verordnung zur Änderung der Düngemittelverordnung. 20. April 2017
ed, Bundesgesetzblatt.
http://www.bgbl.de/xaver/bgbl/start.xav?startbk=Bundesanzeiger_BGBl&jumpTo=bgbl
117s0859.pdf.
BMEL. 2016. Second regulation amending the fertilizer regulation (in German), Federal
Ministry of Food and Agriculture (Germany).
BMLFU. 2017. Publication of the draft Federal Waste Management Plan 2017 and launch of
the public participation procedure (in German), The austrian federal ministry of
agriculture forestry environment and water management (BMLFUW).
BMUB. 2017. New sewage sludge ordinance for phosphorus recovery (in German), Federal
ministry for the environment nature conservation building and nuclear safety (BMUB).
Pressemitteilung Nr. 017/17 | Abfallwirtschaft.
Bouropoulos, N.C., Koutsoukos, P.G. 2000. Spontaneous precipitation of struvite from
aqueous solutions. Journal of Crystal Growth, 213(3), 381-388.
Budenheim. 2017. Inauguration of the ExtraPhos® pilot plant for the phosphorus recycling
from sewage sludge, Chemische Fabrik Budenheim KG. Budenheim, Germany.

Reference
130
Bundestag. 2017. Ordinance on the reorganization of sewage sludge recycling (in German).
24th May 2017 ed, Deutscher Bundestag Drucksache 18/12495.
http://dip21.bundestag.de/dip21/btd/18/124/1812495.pdf.
Butusov, M., Jernelöv, A. 2013. Phosphorus in the organic life: cells, tissues, organisms. in:
Phosphorus, Springer, pp. 13-17.
BWB. 2017a. The region is growing - the sewage treatment plant is also growing (in German),
Berliner Wasserbetriebe. http://www.bwb.de/content/language1/html/19149.php.
BWB. 2017b. Wastewater treatment plant Waßmannsdorf, State-of-the-art technology for
wastewater treatment in Berlin (in German), Berliner Wasserbetriebe.
http://www.bwb.de/content/language1/downloads/20170425_Datenblatt_KW-
Wassmannsdorf-DE_final.pdf.
Chen, Y. 2013. Key points of the process selection and design of the sludge anaerobic
digestion in wastewater treatment plant. Water & Wastewater Engineering, 39(10),
41-44.
Chen, Y., Peng, C., Wang, J., Ye, L., Zhang, L., Peng, Y. 2011. Effect of nitrate recycling
ratio on simultaneous biological nutrient removal in a novel anaerobic/anoxic/oxic
(A2/O)-biological aerated filter (BAF) system. Bioresource Technology, 102(10),
5722-5727.
Cheremisinoff, N.P., Rosenfeld, P. 2010. Handbook of Pollution Prevention and Cleaner
Production Vol. 3: Best Practices in the Agrochemical Industry: Best Practices in the
Agrochemical Industry. William Andrew.
Chiellini, E., Solaro, R. 1996. Biodegradable Polymeric Materials. Advanced Materials, 8(4),
305-313.
Childers, D.L., Corman, J., Edwards, M., Elser, J.J. 2011. Sustainability Challenges of
Phosphorus and Food: Solutions from Closing the Human Phosphorus Cycle.
BioScience, 61(2), 117-124.
CNCIC. 2016. 2016-2017 China fertilizer market annual report China National Chemical
Information Center (CNCIC). http://www.fertmarket.com/newsabout.aspx?id=158.
CNP. 2017a. CNP Technology Water And Biosolids: AirPrex slated for Q4 2017installation at
Liverpool Wastewater Treatment Plant, Medina County, Ohio. in: Water Online.
https://www.wateronline.com/doc/cnp-technology-water-biosolids-airprex-wastewater-
treatment-county-ohio-0001.
CNP. 2017b. Projekt list of AirPrex process, CNP-Technology Water and Biosolids
https://www.cnp-tec.com/de/unsere-projekte/.
Connett, M. 2003. The Phosphate Fertilizer Industry: An Environmental Overview, Fluoride
Action Network.
Cooper, J., Lombardi, R., Boardman, D., Carliell-Marquet, C. 2011. The future distribution
and production of global phosphate rock reserves. Resources, Conservation and
Recycling, 57, 78-86.
Cordell, D., Drangert, J.-O., White, S. 2009. The story of phosphorus: global food security
and food for thought. Global environmental change, 19(2), 292-305.

Reference
131
Cordell, D., Rosemarin, A., Schröder, J., Smit, A. 2011. Towards global phosphorus security:
A systems framework for phosphorus recovery and reuse options. Chemosphere,
84(6), 747-758.
Cornel, P., Schaum, C. 2009. Phosphorus recovery from wastewater: needs, technologies
and costs. Water Science and Technology, 59(6), 1069-1076.
Corominas, L., Foley, J., Guest, J., Hospido, A., Larsen, H., Morera, S., Shaw, A. 2013. Life
cycle assessment applied to wastewater treatment: state of the art. Water research,
47(15), 5480-5492.
Dai, W., Zhan, J., Mou, J., Liu, D., Liu, Y. 2008. The application of CWSBR process in
Xiajiahe WWTP. Water & Wastewater Engineering, 34(8), 38-41.
Dai, X., Zhao, Y., Sha, C., Dai, L., Dong, B. 2014. Investigation on the status and causes of
sludge sand content of wastewater treatment plants in China. Water & Wastewater
Engineering, 21(z1).
De Ridder, M., De Jong, S., Polchar, J., Lingemann, S. 2012. Risks and opportunities in the
global phosphate rock market: robust strategies in times of uncertainty. Hague Centre
for Strategic Studies.
De Vries, B. 1998. Umm el-Jimal: A Frontier Town and its Landscape in Northern Jordan,
Volume 1: Fieldwork 1972–1981. Portsmouth: Journal of Roman Archaeology
Supplementary Series, 26, 33-35.
Destatis. 2016. 64% of sewage sludge incinerated in 2015, The Federal Statistical Office
(Germany).
Directive, C. 1986. Council directive on the protection of the environment, and in particular of
the soil, when sewage sludge is used in agriculture. Offic. J. Eur. Comm, 181, 0006-
0012.
DüMV. 2012. BGBl. I S. 2482, Regulation of marketing of fertilizers, soil additives, crop
substrates, and plant additives (Düngemittelverordnung - DüMV).
DWA-A-131. 2016. Dimensioning of Single-Stage Activated Sludge Plants (in German),
German Association for Water, Wastewater and Waste. Hennef, Germany.
DWA-M-366. 2013. Mechanical Dewatering of Sewage Sludge, German Association for
Water, Wastewater and Waste.
DWA. 2016. 28. Leistungsvergleich kommunaler Kläranlagen 2015 (in German), Deutsche
Vereinigung für Wasserwirtschaft, Abwasser und Abfall e. V., DWA-Arbeitsgruppe
BIZ-1.1 „Kläranlagen-Nachbarschaften“.
http://de.dwa.de/tl_files/_media/content/PDFs/1_Aktuelles/leistungsvergleich_2015.p
df.
Egle, L. 2014. Phosphorus recovery from wastewater-Detailed process description, data
base and results AirPrex®. Vienna University of Technology.
EU-Commission. 2014. 20 critical raw materials - major challenge for EU industry, European
Commission. Brussels.
EurEau. 2016. Sewage Sludge Situation and Trends 2016-Answers to the Sewage Sludge
Questionnaire, (Eds.) E. Salminen, S. Toivikko/FIWA, European federation of national
associations of water services. http://www.eureau.org/index.php/reports.

Reference
132
Eurostat. 2016. Sewage sludge production and disposal, Statistical office of the European
Union.
http://appsso.eurostat.ec.europa.eu/nui/show.do?dataset=env_ww_spd&lang=en.
Fan, M., Shen, J., Yuan, L., Jiang, R., Chen, X., Davies, W.J., Zhang, F. 2011. Improving
crop productivity and resource use efficiency to ensure food security and
environmental quality in China. Journal of experimental botany, 63(1), 13-24.
Fang, P., Cen, C., Tang, Z., Tang, Z. 2012. Air pollutants emission and their control from
sludge incineration: A Review. Environmental Science & Technology, 1(5).
FAO. 2009. Can technology deliver on the yield challenge to 2050? in: How to Feed the
World in 2050, Food and Agriculture Organization of the United Nations. Rome.
Fijalkowski, K., Rorat, A., Grobelak, A., Kacprzak, M.J. The presence of contaminations in
sewage sludge – The current situation. Journal of Environmental Management.
Flynn, A., Hirvonen, T., Mensink, G.B., Ocké, M.C., Serra-Majem, L., Stos, K., Szponar, L.,
Tetens, I., Turrini, A., Fletcher, R. 2009. Intake of selected nutrients from foods, from
fortification and from supplements in various European countries. Food & Nutrition
Research, 53(1), 2038.
Forstner, G. 2015. AirPrex™: Biosolids Treatment Optimization Process with the option of
Phosphate Recovery. MWEA - Annual Biosolids Conference, March 2nd 2015, East
Lansing.
Fu, T., Chang, M., Zhong, L. 2008. Reform of China's Urban Water Sector, IWA Publishing,
pp. 26.
Garcia-Belinchón, C., Rieck, T., Bouchy, L., Galí, A., Rougé, P., Fàbregas, C. 2013. Struvite
recovery: pilot-scale results and economic assessment of different scenarios. Water
Practice & Technology, 8(1).
GB4284-84. Control standards for pollutants in sludges from agricultural use, Ministry of
Environmental Protection of the People's Republic of China. Beijing.
GB7478-87. Water quality- Determination of ammonium - Distillation and titration method,
Ministry of Environmental Protection of the People's Republic of China. Beijing.
GB11893-89. Water quality-Determination of total phosphorus-Ammonium molybdate
spectrophotometric method, Ministry of Environmental Protechtion of the People´s
Republic of China. Beijing.
GB15580. 2011. Discharge standard of water pollutants for phosphate fertilizer industry,
Ministry of Environmental Protection of the People´s Republic of China. Beijing.
GB18918-2002. Discharge standard of pollutants for municipal wastewater treatment plant,
Ministry of Environmental Protection of the People's Republic of China. Beijing.
Goedkoop, M., Heijungs, R., Huijbregts, M., De Schryver, A., Struijs, J., Van Zelm, R. 2009.
ReCiPe 2008. A life cycle impact assessment method which comprises harmonised
category indicators at the midpoint and the endpoint level, 1.
Gouider, M., Feki, M., Sayadi, S. 2009. Separative recovery with lime of phosphate and
fluoride from an acidic effluent containing H3PO4, HF and/or H2SiF6. Journal of
Hazardous Materials, 170(2–3), 962-968.
Grahl, B. 2009. Ökobilanz (lca): Ein leitfaden für ausbildung und beruf. John Wiley & Sons.
Reference
133
Grzmil, B., Wronkowski, J. 2006. Removal of phosphates and fluorides from industrial
wastewater. Desalination, 189(1–3), 261-268.
Guo, G.i., Chen, T., Yang, J., Zheng, G., Gao, D. 2014. Regional distribution characteristics
and variation of heavery metals in sewage sludge of China. Acta Scientiae
Circumstantiae, 34(10), 2455-2461.
Guo, G.i., Yang, J., Chen, T.i., Zheng, G., Gao, D., Song, B., Du, W. 2009. Concentrations
and variation of organic matter and nutrients in municipal sludge of China. China
Water & Wastewater, 25(13), 120-121.
Halling-Sørensen, B., Jorgensen, S.E. 1993. 2. Biological Nitrification and Denitrification. in:
Studies in Environmental Science, (Eds.) B. Halling-Sorensen, S.E. Jorgensen, Vol.
Volume 54, Elsevier, pp. 43-53.
Hao, X., Wang, C., Jin, W. 2011. Overview of phosphorus and phosphorus crisis recovery
technology Higher Education Publishing, China.
Hao, X.D., Wang, C.C., Lan, L., van Loosdrecht, M.C.M. 2008. Struvite formation, analytical
methods and effects of pH and Ca(2+). Water science and technology 58(8), 1687-
1692.
Heinzmann, B., Engel, G. 2006. Induced magnesium ammonia phosphate precipitation to
prevent incrustations and measures for phosphorus recovery. Water Practice and
Technology, 1(3), 51.
Heinzmann, B., Lengemann, A. 2011. State of phosphorus recovery in Berlin- From scientific
investigations to large-scale application. Internationales Symposium "Re-Water
Braunschweig", 21. & 22. November 2011, Braunschweig, Germany (in German).
HJ636-2012. Water quality-Determination of total nitrogen-Alkaline potassium persulfate
digestion UV spectrophotometric method Ministry of Environmental Protechtion of the
People´s Republic of China. Beijing.
Huang, C.J., Liu, J. 1999. Precipitate flotation of fluoride-containing wastewater from a
semiconductor manufacturer. Water Research, 33(16), 3403-3412.
Huang, L., Mao, X.-y., Wang, J., Chen, X., Wang, G.-h., Liao, Z.-w. 2014. The effect and
mechanism of improved efficiency of physicochemical pro-release treatment for low
grade phosphate rock. Journal of soil science and plant nutrition, 14, 316-331.
Huygens, D., Saveyn, H., Eder, P., Sancho, L.D. 2017. DRAFT STRUBIAS Technical
Proposals, (Ed.) C.E.a.I.L. Unit, Joint Research Centre - European Commission.
Brussels.
IFA. 2017. IFA Statistics, International Fertilizer Industry Association.
http://www.fertilizer.org/Statistics.
IFU. 2017. Ecoinvent LCA database in Umberto NXT, ifu Institut für Umweltinformatik
Hamburg GmbH. https://www.ifu.com/en/umberto/ecoinvent-database/.
ISO-14040. 2006. Environmental management - Life Cycle Assessment - Principles and
framework, International Standardisation Organisation. Geneva, Switzerland.
ISO-14044. 2006. Environmental management - Life cycle assessment - Requirements and
guidelines, International Standardisation Organisation. Geneva, Switzerland.
Reference
134
Jiang, L., Yang, C., Hu, Q., Li, Z., Guo, Z. 2013. Operation analysis of sludge anaerobic
digestion system at Bailonggang wastewater treatment plant. China Water &
Wastewater, 29(9).
Jiang, Q. 2014. Recovery operation of sludge anaerobic digestion system at Gaobeidian
WWTP. China Water & Wastewater, 30(2).
Jin, L., Zhang, G., Tian, H. 2014. Current state of sewage treatment in China. Water
Research, 66, 85-98.
Jossa, P. 2014. Phosphorus Recovery from Sewage Sludge: Comparison of Selected
Processes Through Life Cycle Assessment. in: Civil Engineering, Vol. Master,
Bauhaus-Universität Weimar. Weimar.
Kabbe, C. 2013a. The Limited Resources of Phosphorus and How to Close the Phosphorus
Cycle. in: Factor X - Re-source - Designing the Recycling Society Springer
Netherlands, pp. 261-273.
Kabbe, C. 2015. P-REX Introduction: Hot spots for P recovery from municipal wastewater.
Final International P-REX Workshop, Amsterdam.
Kabbe, C. 2017. P recovery from wastewater path in 2017 BatchGeo.
https://de.batchgeo.com/map/0f9d56a3aa57a51379a3cb23af27d202.
Kabbe, C. 2013b. Sustainable sewage sludge management fostering phosphorus recovery
and energy efficiency. Bluefacts (2013) 36-41.
Kabbe, C., Kraus, F. 2017a. P recovery: from evolution to revolution. in: Fertilizer
International, Vol. 479, Fertilizer International, pp. 37-41.
Kabbe, C., Kraus, F. 2017b. Phosphorus recovery to recycling in a circular economy.
Microbial Resources for Agricultural and Food Security, Belfast, Northern Ireland.
Kabbe, C., Remy, C., Kraus, F. 2015. Review of promising methods for phosphorus recovery
& recycling from wastewater. International Fertiliser Society.
Kataki, S., West, H., Clarke, M., Baruah, D.C. 2016. Phosphorus recovery as struvite: Recent
concerns for use of seed, alternative Mg source, nitrogen conservation and fertilizer
potential. Resources, Conservation and Recycling, 107, 142-156.
Kaur, R., Wani, S., Singh, A., Lal, K. 2012. Wastewater production, treatment and use in
India. National Report presented at the 2 nd regional workshop on Safe Use of
Wastewater in Agriculture.
Khachan, M., Bader, R., Bhatia, S., Maurer, B. 2011. Comparative dewatering performance
of slurries conditioned with synthetic polymers vs. eco-friendly polymers. Geo-
Frontiers 2011@ sAdvances in Geotechnical Engineering. ASCE. pp. 3050-3058.
Kirchmann, H., Börjesson, G., Kätterer, T., Cohen, Y. 2017. From agricultural use of sewage
sludge to nutrient extraction: A soil science outlook. Ambio, 46(2), 143-154.
Kong, X. 2012. The interpretation of policies on bioenergy from municipal waste in urban
area.
Kopp, J. 2013. Neue Verfahren zur Optimierung der Schlammstabilisierung und der
Klärschlammentwässerung. DWA Klärschlammforum, Bersteland/Spreewald. DWA
Landsverband Nord-Ost.

Reference
135
Kraus, F., Kabbe, C. 2017. Phosphorrückgewinnung in der Praxis – so funktioniert es in den
Niederlanden (in German). Korrespondenz Abwasser und Abfall, 64(2), 96-98.
Kraus, F., Kabbe, C., Remy, C., Lesjean, B. 2016a. Klärschlammmanagement und
Phosphorrecycling in Deutschland – Eine Abschätzung von Kosten,
Umweltauswirkungen und Konsequenzen der geplanten Novelle der AbfKlärV (in
German). Korrespondenz Abwasser und Abfall, 63(6), 528-537.
Kraus, F., Remy, C., Kabbe, C. 2016b. Phosphorus recycling: state of the art and
perspectives (in German). in: 34. Bochumer Workshop Siedlungswasserwirtschaft
Kläranlage der Zukunft, Ruhr Universität Bochum. Bochum.
Krüger, O., Adam, C. 2014. Monitoring von Klärschlammmonoverbrennungsaschen
hinsichtlich ihrer Zusammensetzung zur Ermittlung ihrer
Rohstoffrückgewinnungspotentiale und zur Erstellung von Referenzmaterial für die
Überwachungsanalytik (in German). Fachgebiet III 2.5 Überwachungsverfahren,
Abwasserentsorgung.
Krüger, O., Adam, C. 2015a. Recovery potential of German sewage sludge ash. Waste
Management.
Krüger, O., Adam, C. 2015b. Recovery potential of German sewage sludge ash. Waste
Management, 45(11), 400-406.
Kumar, D., Hiremath, A.M., Asolekar, S.R. 2014. Integrated Management of Wastewater
through Sewage Fed Aquaculture for Resource Recovery and Reuse of Treated
Effluent: A Case Study. APCBEE Procedia, 10, 74-78.
Lengemann, A. 2017. Laboratory measurement of digested sludge in WWTP Wassmansdorf,
Berliner Wasserbetriebe.
Li, H., Liu, J., Li, G., Shen, J., Bergström, L., Zhang, F. 2015. Past, present, and future use of
phosphorus in Chinese agriculture and its influence on phosphorus losses. Ambio,
44(2), 274-285.
Li, X., Li, G., Guo, S., Yan, B. 2007. Design and operation of sludge digestion in
Wangxinzhuang Wastewater Treatment Plant in Zhengzhou. Water & Wastewater
Engineering, 33(7), 13-14.
Li, Y., Chen, T., Luo, W., Huang, Q., Wu, J. 2003. Contents of organic matter and major
nutrients and the ecological effect related to land application of sewage sludge in
China. Acta Ecologica Sinica, 23(11), 2464-2474.
Lu, D., Xiao, C., Xu, S. 2009. Starch-based completely biodegradable polymer materials.
Express polymer letters, 3(6), 366-375.
Lu, R. 2004. Phosphorus resource of China and phosphate fertilizer production and
consumption Soils, 36(1), 1-4.
Manahan, S.E. 1997. Nitogen, Phosphorus, and Potassium in Soils. in: Environmental
Science and Technology, Press LLC. United States of America, pp. 358-361.
Matsubae-Yokoyama, K., Kubo, H., Nakajima, K., Nagasaka, T. 2009. A material flow
analysis of phosphorus in Japan. Journal of Industrial Ecology, 13(5), 687-705.

Reference
136
MEP. 2014. List of national commissioning urban sewage treatment facilities in 2013 (in
Chinese), Ministry of Environmental Protection of the People's Republic of China
(MEP) http://www.mep.gov.cn/gkml/hbb/bgg/201404/t20140415_270550.htm.
MEP. 2015. Notice of the State Council on Issuing the National Water Pollution Prevention
and Treatment Action Plan of China (in Chinese), Ministry of Environmental
Protection of the Government of the People's Republic of China. Beijing
MLR. 2012a. Evolution of the Phosphate rock industry in Hunan (in Chinese), Vol. 2016,
Ministry of Land and Resources of the People´s Republic of China (MLR).
http://www.mlr.gov.cn/kczygl/zhgl/201204/t20120411_1082843.htm.
MLR. 2012b. New Regulation for the development of phosphate rock resources in five main
production provinces (in Chinese). in: Jornal of China Mining Industry, Ministry of
Land and Resources of the People´s Republic of China.
http://www.mlr.gov.cn/xwdt/kyxw/201205/t20120503_1092722.htm.
MOHURD. 2016. China Urban-Rural Construction Statistical Yearbook 2013 (in Chinese),
Ministry of Housing and Urban-Rural Development
http://www.mohurd.gov.cn/xytj/tjzljsxytjgb/index.html
NCME. 2013. Environmental Impact Assessment of Jinnan sludge treatment. North China
Municipal Engineering Design & Research Institut.
Ndala, S.m., Claassens, A., Makaringe, P., Dube, B. 2010. Citro-Acidulation of Rock
Phosphates for Rapid Conversation of Fluorapatite to Hydroxyapatite. in:
Beneficiation of Phosphates: Technology Advance and Adoption, (Eds.) P. Zhang, K.
Swager, L.L. Filho, H. El-Shall, Society for Ming, Metallurgy & Exploration. USA, pp.
197-203.
Niewersch, C., Stemann, J., Ewert, W., Hermanussen, O., Kabbe, C., Mêlè, C., Paillard, H.,
Stössel, E. 2014. Description of sludge related processes.
Notenboom, G., Vergouwen, L., Morgenschweis, C., van Schöll, L., Postma, R. 2013.
Phosphorous products from the municipal waste water chain law and regulation,
market opportunities, processing concepts (in Dutch). STOWA.
Ohtake, H., Okano, K. 2015. Development and implementation of technologies for recycling
phosphorus in secondary resources in Japan. Global Environment Research, 19.
Ostara. 2017a. Brochure: Nutrient management solutions-recovering one precious resource
to protect another, Ostara Nutrient Recovery Technologies. http://ostara.com/nutrient-
management-solutions/.
Ostara. 2017b. Brochure: the only nutrient recovery solution -that prevents digester struvite
build-up, Ostara Nutrient Recovery Technologies. http://ostara.com/nutrient-
management-solutions/.
Ostara. 2017c. Brochure: Turn problematic struvite in to premium, high value, market-ready
fertiliser, Ostara Nutrient Recovery Technologies. http://ostara.com/nutrient-
management-solutions/.
Ostara. 2016. Metropolitan Water Reclamation District of Greater Chicago and Ostara Open
World’s Largest Nutrient Recovery Facility to Help Recover Phosphorus and Protect

Reference
137
Mississippi River Basin, Ostara Nutrient Recovery Technologies.
http://ostara.com/project/metropolitan-water-reclamation-district-greater-chicago/.
P-REX-Factscheets. 2015. P-REX Process Factscheets 2015. http://p-
rex.eu/index.php?id=11.
Pan, B., Lu, Z., Sun, C. 2006. Operational Analysis of Sludge Digestion in Wastewater
Treatment Plant in Haikou City. China Water & Wastewater, 22(24), 91-94.
Pareta, R., Edirisinghe, M.J. 2006. A novel method for the preparation of starch films and
coatings. Carbohydrate Polymers, 63(3), 425-431.
Peng, Z., Peng, Y., Gui, L., Liu, X. 2010. Competition for Single Carbon Source Between
Denitrification and Phosphorus Release in Sludge under Anoxic Condition. Chinese
Journal of Chemical Engineering, 18(3), 472-477.
Petzet, S., Cornel, P. 2009. P-recovery from sewage sludge and sewage sludge ashes.
Presentation in BALTIC, 21.
Qiu, G., Ting, Y.-P. 2014. Direct phosphorus recovery from municipal wastewater via osmotic
membrane bioreactor (OMBR) for wastewater treatment. Bioresource Technology,
170(0), 221-229.
Qiu, S., Ding, T. 2002. Explore the biological treatment of urban sewage effluent total
phosphorus compliance issues China Water and Wastewater, 18(9), 23-25.
Ragnarsdóttir, K.V., Sverdrup, H., Koca, D. 2011. Challenging the planetary boundaries I:
Basic principles of an integrated model for phosphorous supply dynamics and global
population size. Applied Geochemistry, 26, S303-S306.
Remy, C. 2012. Project CoDiGreen Work package 2: LCA study of sludge treatment line in
WWTP Berlin-Waßmannsdorf, Kompetenzzentrum Wasser Berlin
http://www.kompetenzwasser.de/index.php?id=504&type=0&jumpurl=fileadmin%2Fus
er_upload%2Fpdf%2Ffact_sheets%2Fcodigreen_D_a4_comp_20100517.pdf.
Remy, C., Jossa, P., Kabbe, C., Lesjean, B. 2015. P-REX Deliverable D 9.2 Life Cycle
Assessment of selected processes for P recovery from sewage sludge, sludge liquor,
or ash. in: Sustainable sewage sludge management fostering phosphorus recovery
and energy efficiency (P-REX). http://p-rex.eu/index.php?id=11.
Remy, C., Lesjean, B., Waschnewski, J. 2012. Identifying energy and carbon footprint
optimization potentials of a sludge treatment line with life cycle assessment. Water
Science and Technology, 67(1), 63-73.
Roland W. Scholz, A.H.R., Fridolin S. Brand,Deborah T. Hellums,Andrea E. Ulrich. 2014.
Sustainable Phosphorus Management: A Global Transdisciplinary Roadmap.
Römer, W. 2013. Phosphor-Düngewirkung von P-Recyclingprodukten (in German).
Korrespondenz Abwasser, Abfall, 60(3), 202-215
Ruiter, R.d. 2014. The Ecophos Technology: To close the P cycle and safeguard the world's
food chain. BAM Workshop: Waste Water - Phosphorus - Fertilizer, Berlin, Germany.
Ruiter, R.d. 2015. From Ash (SNB & HVC) to Fertiliser (ECOPHOS)-The Biggest step in P-
Recycling so far. European Sustainable Phosphorus Conference 2015, MAR 5, 2015,
Berlin. ESPC.

Reference
138
Rulseh, T.J. 2015. AirPrex Process Solves Struvite Problems. in: Treatment Plant Operator.
http://www.tpomag.com/editorial/2015/10/airprex_process_solves_struvite_problems.
Sanchez, P.A., Swaminathan, M. 2005. Hunger in Africa: the link between unhealthy people
and unhealthy soils. The Lancet, 365(9457), 442-444.
Schaum, C. 2016. Sewage treatment of the future: health, water and resource protection (in
German). Verein zur Förderung des Instituts der TU Darmstadt e.V., Darmstadt.
Schaum, C., Cornel, P., Jardin, N. 2008. Research on the recycling of phosphorus from
sewage sludge loop. Wasser und Abfall, 10(1-2), 18-21.
Schecher, W.D., McAvoy, D.C. 1992. MINEQL+: A software environment for chemical
equilibrium modeling. Computers, Environment and Urban Systems, 16(1), 65-76.
Schnee, R. 2016. BUDENHEIM EXTRAPHOS® Procedure - effectiveness of the carbonic
acid (in German). Kongress: Phosphor - Ein kritischer Rohstoff mit Zukunft -, 26 and
27. October 2016, Kursaal Stuttgart Bad Cannstatt.
Scott, G. 2000. ‘Green’ polymers. Polymer Degradation and Stability, 68(1), 1-7.
SCUUWE. 2013. Science for environment policy indepth report: sustainable phosphorus use,
Science Communication Unit, University of the West of England (UWE), Bristol.
Report produced for the European Commission DG Environment, October 2013.
Smit, A.L., Bindraban, P.S., Schröder, J., Conijn, J., Van der Meer, H. 2009. Phosphorus in
agriculture: global resoources, trends and developments: report to the Steering
Committee Technology Assessment of the Ministery of Agriculture, Nature and Food
Quality, The Netherlands, and in collaboration with the Nutrient Flow Task Group
(NFTG), supported by DPRN (Development Policy review Network). Plant Research
International.
Stark, K. 2004. Phosphorus recovery–Experience from European countries. Proceedings of
Polish-Swedish seminars, Stockholm June 6-8.
Stemann, J., Ewert, W., Hermanussen, O., Kabbe, C., Mélè, C., Niewersch, C., Paillard, H.,
Stössel, E., Wagenbach, A. 2014. D 5.1 P-REXDescription of sludge related
processes
Sun, C., Shi, Z., Shen, Z. 2008. Analysis of sludge disposal techniques in municipal sewage
plants of Hainan. Journal of Hainan normal university (natural science), 21(3), 303-
306.
UBA. 2015. Umweltbelastende Stoffeinträge aus der Landwirtschaft-Möglichkeiten und
Maßnahmen zu ihrer Minderung in der konventionellen Landwirtschaft und im
ökologischen Landbau (in German), Umweltbundesamt, Fachgebiet I 3.6
Landwirtschaft. http://www.umweltbundesamt.de/publikationen/umweltbelastende-
stoffeintraege-aus-der.
USGS. 2016. 2015 Minerals yearbook, phosphate rock, U.S. Geological Survey.
https://minerals.usgs.gov/minerals/pubs/commodity/phosphate_rock/.
USGS. 2017. Mineral commodity summaries 2017, Phosphate rock, U.S. Geological Survey
https://minerals.usgs.gov/minerals/pubs/commodity/phosphate_rock/mcs-2017-
phosp.pdf.

Reference
139
USGS. 2015. Phosphate rock: world mine production and reserves. in: Mineral commodity
summaries, U.S. Geological Survey. America.
van Dijk, K.C., Lesschen, J.P., Oenema, O. 2016. Phosphorus flows and balances of the
European Union Member States. Science of The Total Environment, 542, 1078-1093.
VDI. 2012. Cumulative energy demand-Terms, Definitions, Methods of Calculation. in: VDI-
Guideline 4600: 2012-01, Beuth Verlag Berlin, Germany.
Veltman, A. 2016. Phosphorus recovery from digested sewage sludge, Struvite as phosphate
fertilizer. ARREAU Struvite Recovery & Recycling Learning Alliance kick-off slides,
Amsterdam. http://p-
rex.eu/uploads/media/04_Waternet_Phosphorus_recovery_from_digested_sewage_s
ludge_june_16_2016.pdf.
Wang, F., Li, H., Chen, X. 2012. Mesophilic Sludge Digestion and Heat and Power Co-
generation in Qingdao Maidao WWTP. China Water & Wastewater, 28(2), 49-51.
Wang, X., Zhao, B., Zhang, A., Sha, Z. 2015. The Present Situation and Research Progress
of Treatment of Sludge from City Sewage Treatment Plant. Journal of Tianjin
University of Science & Technology, 30(4).
Warmadewanthi, Liu, J.C. 2009a. Recovery of phosphate and ammonium as struvite from
semiconductor wastewater. Separation and Purification Technology, 64(3), 368-373.
Warmadewanthi, B., Liu, J.C. 2009b. Selective separation of phosphate and fluoride from
semiconductor wastewater. Water Science and Technology, 59(10), 2047-2053.
WB. 2014. World Development Indicators: Rural environment and land use, The World Bank.
http://wdi.worldbank.org/table/3.1.
Wei, B., Yang, L. 2010. A review of heavy metal contaminations in urban soils, urban road
dusts and agricultural soils from China. Microchemical Journal, 94(2), 99-107.
Wendl, A.-T. 2013. Investigations on the technical and economic optimization of the
operation of the MAP plant in Waßmannsdorf wastewater treatment plant (in German).
in: Umweltwissenschaften und Verfahrenstechnik Studiengang
Umweltingenieurwesen, Vol. Master, Brandenburgische Technische Universität.
Wenzel, H., Larsen, H.F., Clauson-Kaas, J., Høibye, L., Jacobsen, B.N. 2008. Weighing
environmental advantages and disadvantages of advanced wastewater treatment of
micro-pollutants using environmental life cycle assessment. Water Science and
Technology, 57(1), 27-32.
Wiechmann, B., Dienemann, C., Kabbe, C., Brandt, S., Vogel, I., Roskosch, A. 2015.
Sewage sludge management in Germany.
Wilken, V., Zapka, O., Muskolus, A. 2015. Product quality: fertilizing efficiency, results of pot
and field tests. Final International Workshop Proceedings - P-REX Consortium,
Amsterdam.
Wiseman, N. 2015. Phosphorus recovery – variety of technologies emerging, Aquatech.
http://www.aquatechtrade.com/aquatech-news/phosphorus-recovery-variety-of-
technologies-emerging/.
Xiu, X. 2013. Development of the Chinese phosphate industry. 1st Global TraPs World
Conference, June 18 2012, Beijing.

Reference
140
Yang, G., Zhang, G., Wang, H. 2015. Current state of sludge production, management,
treatment and disposal in China. Water Research, 78(0), 60-73.
Yang, M., Zhang, Y., Shao, B., Qi, R., Myoga, H. 2001. Precipitative removal of fluoride from
electronics wastewater. Journal of Environmental Engineering, 127(10), 902-907.
Yapijakis, C., Wang, L.K. 2006. Treatment of phosphate industry wastes. Waste Treatment in
the Process Industries.
Yu, J. 2011. The foreground analysis of sewage sludge agriculture application in China.
Advanced Materials Research. Trans Tech Publ. pp. 1316-1320.
Zhang, F., Cui, Z., Fan, M., Zhang, W., Chen, X., Jiang, R. 2011. Integrated soil–crop system
management: reducing environmental risk while increasing crop productivity and
improving nutrient use efficiency in China. Journal of Environmental Quality, 40(4),
1051-1057.
Zhang, F., Zhang, W., Ma, W. 2009. China’s Phosphorus (P) Fertilizer Industry: Development
and Outlook. in: The Chemical Fertilizer Industry in China: A Review and its Outlook
International Fertilizer Industry Association.
Zhang, W., Qi, D., Wu, S., Dong, J., Zhao, W. 2014. Effect of Different Pretreatment Methods
on Sewage Sludge Anaerobic Digestion. Transactions of the Chinese Society for
Agricultural Machinery, 45(9), 187-198.
Zhang, X. 2009. The run and praetice of sludge anaerobic digestion treatment for the
sewage treatment plant of Jiguanshi. Automation & Instrumentation(4), 115-119.
Zhou, K., Barjenbruch, M., Kabbe, C., Inial, G., Remy, C. 2017. Phosphorus recovery from
municipal and fertilizer wastewater: China's potential and perspective. Journal of
Environmental Sciences, 52, 151-159.
Zhu, Y. 2009. Design of the sludge digestion system of Sanjintan Wastewater Treatment
Plant in Wuhan City. Water & Wastewater Engineering, 35(8), 40-43.