phosphorus removal - ohiowea.org
TRANSCRIPT
© 2012 O’Brien & Gere
Phosphorus Removal Chemical versus Biological Methods
86th Annual OWEA Conference & Exhibit Expo, Aurora, OH, June 20, 2012
Mark Greene, Ph.D., Senior Technical Director
[email protected] / (315) 956-6271

© 2012 O’Brien & Gere
Phosphorus Removal - Chemical versus Biological Methods
NOTICE
This material is protected by copyright. No other use, reproduction, or distribution of this material or of the approaches it contains, is authorized without the prior express written consent of O’Brien & Gere.
© Copyright, 2012 O’Brien & Gere Engineers, Inc., All Rights Reserved
2
All materials printed on recycled paper.
© 2012 O’Brien & Gere
Today’s presentation
Why is phosphorus important, a global perspective
Biological P removal methods
Chemical P removal methods
Case study comparison results
Phosphorus recovery
3
Phosphorus Removal - Chemical versus Biological Methods

© 2012 O’Brien & Gere
Sources of Phosphorus in Wastewater
Human excretion (urine): ~50%
Synthetic laundry detergents: ~30%
Food wastes
Household cleaners
Industrial and commercial discharges
4
© 2012 O’Brien & Gere
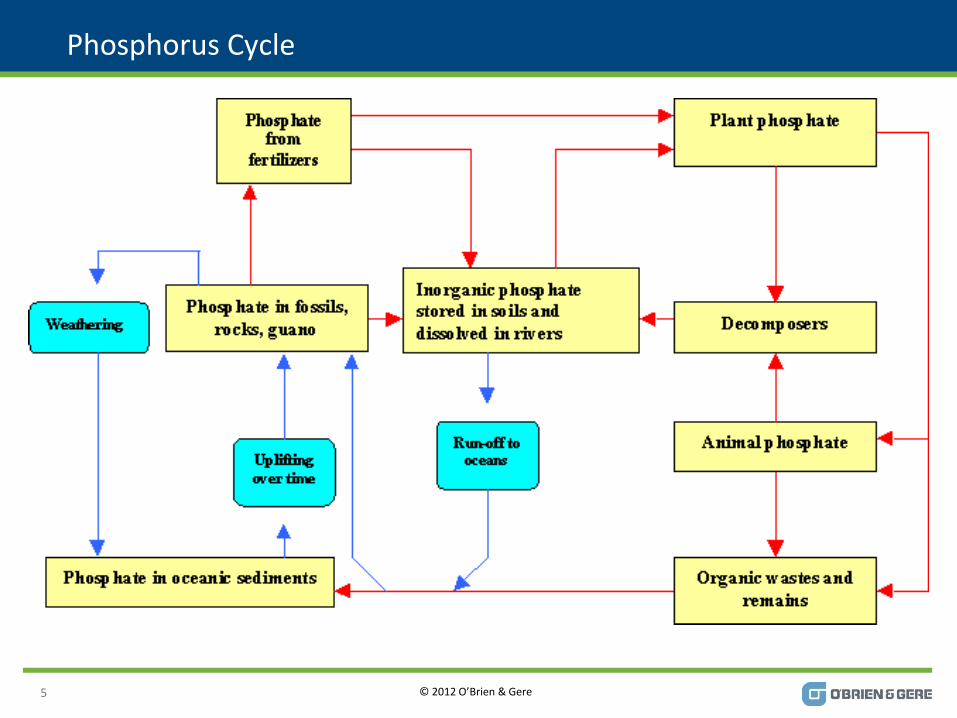
Phosphorus Cycle
5
© 2012 O’Brien & Gere
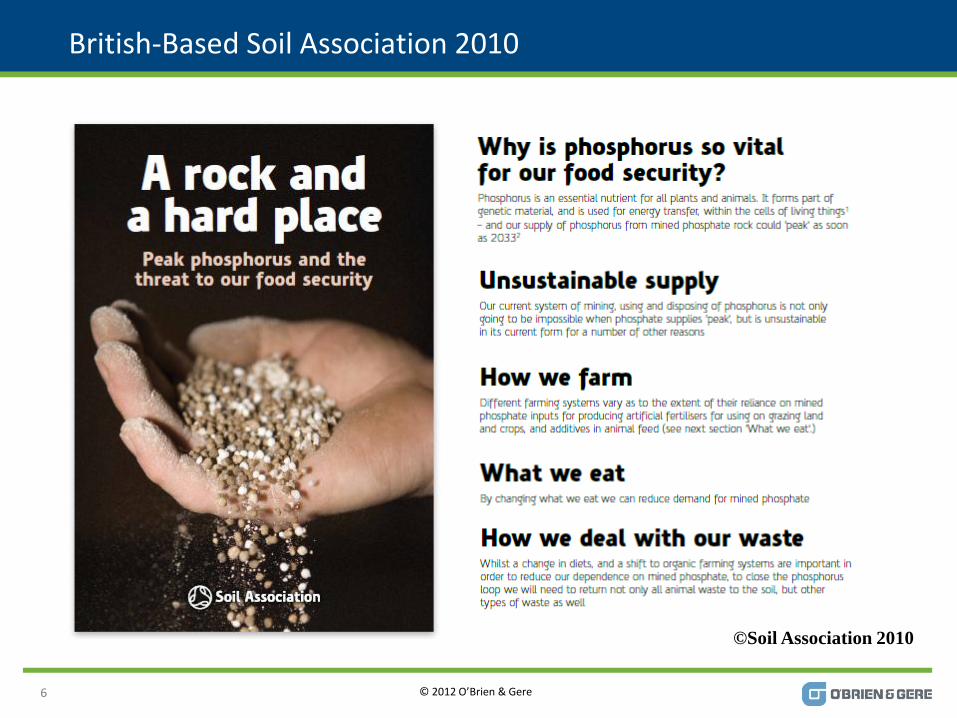
British-Based Soil Association 2010
6
©Soil Association 2010

© 2012 O’Brien & Gere
Phosphorus in the U.S.
7
US produces 25% of world resources
Huge deposits in FL and GA
Surplus production limited to a few countries
High grade ore is expected to run out in less than 50 years
U.S. may have enough P for 200 years at current rate of consumption
Morocco has 6 times the deposits as the U.S.

© 2012 O’Brien & Gere
Phosphorus Speciation
8
TOTAL INFLUENT PHOSPHORUS TPINF
ORTHOPHOSPHATE SPO4
ORGANICALLY BOUND PHOSPHORUS
BIODEGRADABLE POB
UNBIODEGRADABLE
SOLUBLE SPB
PARTICULATE XPB
SOLUBLE SPI
PARTICULATE XPI
Phytic acid

© 2012 O’Brien & Gere
Domestic Wastewater (Municipal)
9
Total P (5.7-8 mg/L)
Ortho P (3-4 mg/L)
Poly P (2-3 mg/L)
Organic P (0.7-1 mg/L)

© 2012 O’Brien & Gere
Industrial Wastewater
10
Pharmaceutical (15-300 mg/L)
Brewery (20 mg/L)
Ice Cream (80 mg/L)
Dairy (50-200 mg/L)

© 2012 O’Brien & Gere
Low Effluent TP
Solids removal is key to achieve very low effluent levels
11

© 2012 O’Brien & Gere
Biological vs Chemical P Removal
12
Chemical Precipitation
Up to 150 mg/L of metal salt
Dilute wastewater
Small muni-WWTPs
Complete mix biological process
Effluent limits 0.05-5 mg/L
Lower capital cost
Polishing for very low effluent limits
EBioP
Minimal metal salt addition
Biological activity
Enhanced WWT process performance
Effluent limits 0.5-1 mg/L
Lower operating cost
© 2012 O’Brien & Gere
BIOLOGICAL P REMOVAL
13

© 2012 O’Brien & Gere
EBioP – Phosphorus Removal
14
5% TP in TSS
0.5 mg/L in 10 mg/L TSS in clarifier effluent
0.1-0.2 mg/L TP in single stage filtration
AN WW OX CLARIFIER AX AX OX
RAS
© 2012 O’Brien & Gere
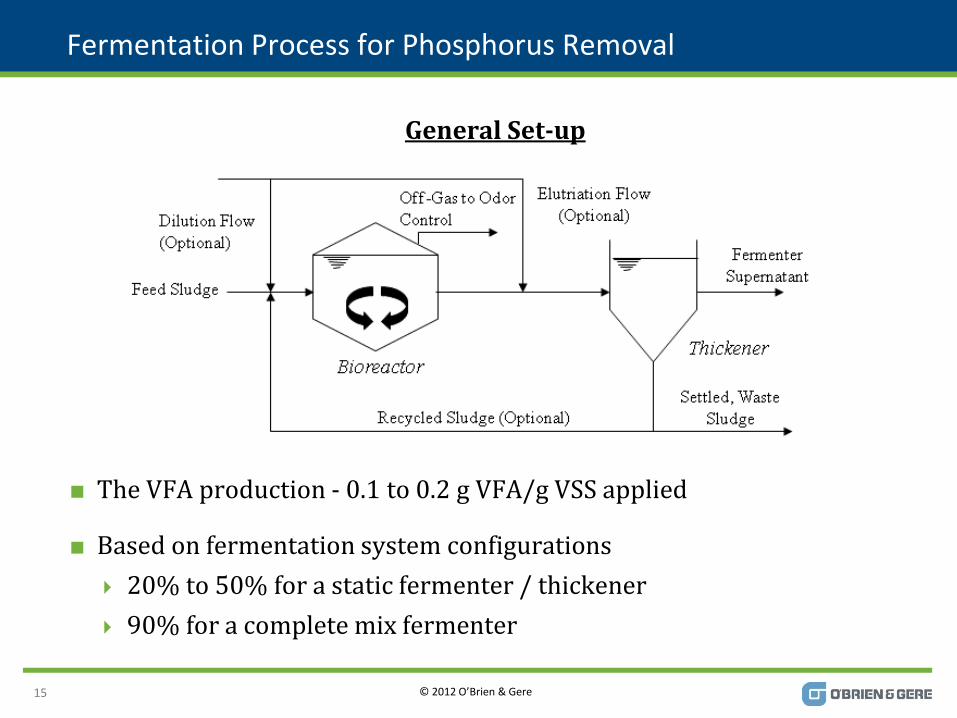
Fermentation Process for Phosphorus Removal
General Set-up
The VFA production - 0.1 to 0.2 g VFA/g VSS applied
Based on fermentation system configurations
20% to 50% for a static fermenter / thickener
90% for a complete mix fermenter
15

© 2012 O’Brien & Gere
Primary Sludge Static Fermenter (Thickeners)
Use gravity thickener for fermentation, supernatant (VFA) sent to BNR
A high-torque sludge scraper mechanism required, high thickener sludge concentration ~4 - 8%
Advantage
Independent operations and controls of the primary clarifier and fermenter / thickener
Disadvantage
Balancing sludge wastage and monitoring sludge blanket is very hard
16
© 2012 O’Brien & Gere
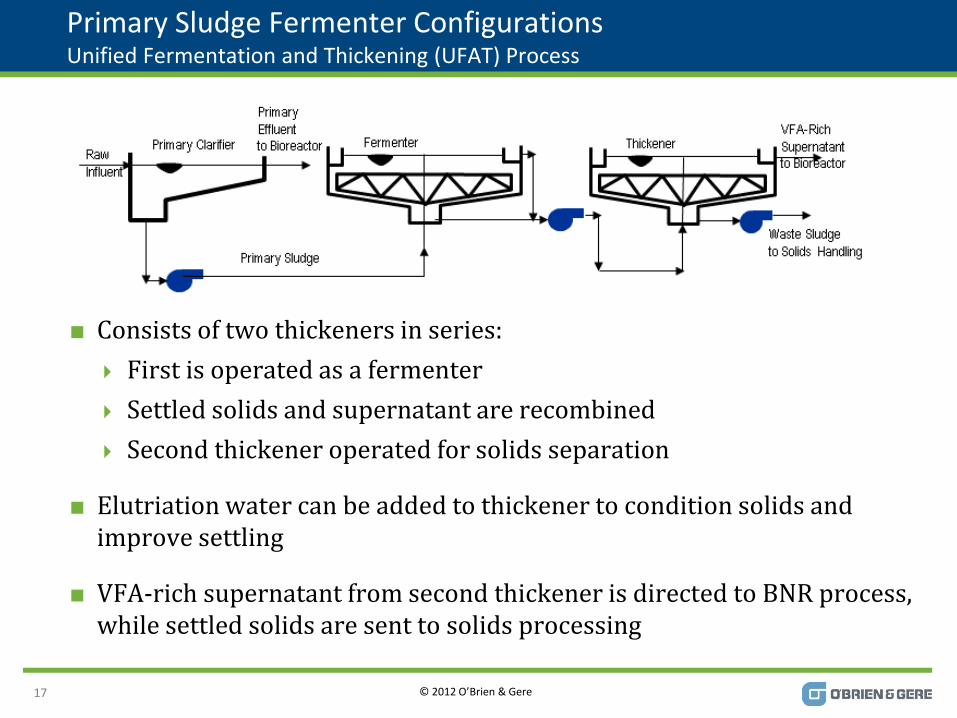
Primary Sludge Fermenter Configurations Unified Fermentation and Thickening (UFAT) Process
Consists of two thickeners in series:
First is operated as a fermenter
Settled solids and supernatant are recombined
Second thickener operated for solids separation
Elutriation water can be added to thickener to condition solids and improve settling
VFA-rich supernatant from second thickener is directed to BNR process, while settled solids are sent to solids processing
17

© 2012 O’Brien & Gere
VFA / Carbon Source
18
© 2012 O’Brien & Gere
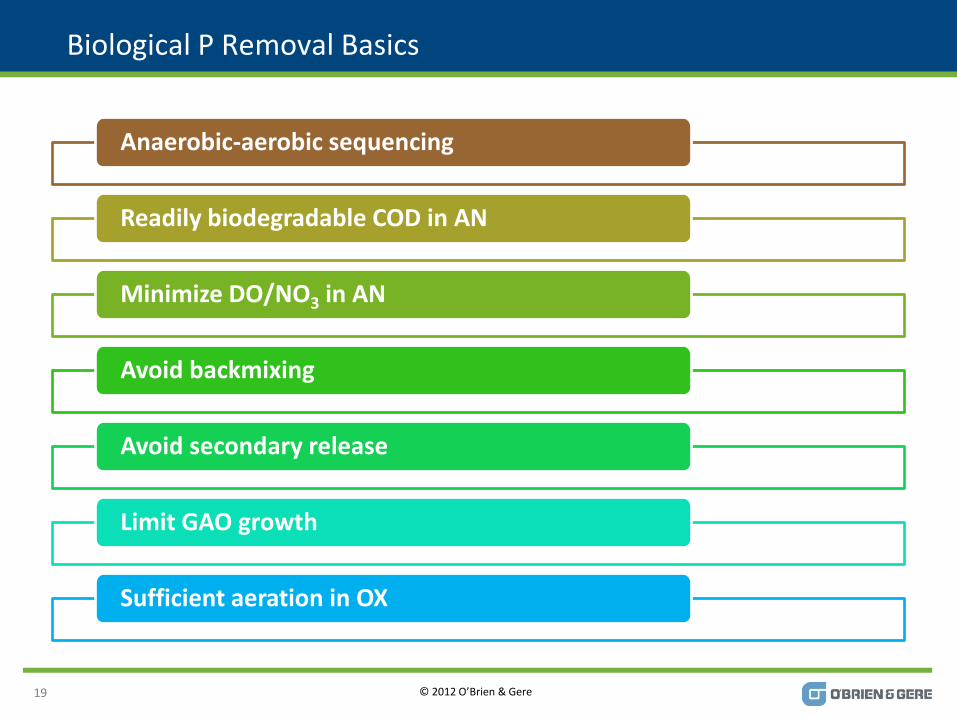
Biological P Removal Basics
19
Anaerobic-aerobic sequencing
Readily biodegradable COD in AN
Minimize DO/NO3 in AN
Avoid backmixing
Avoid secondary release
Limit GAO growth
Sufficient aeration in OX

© 2012 O’Brien & Gere
ENR Biological Process

© 2012 O’Brien & Gere
Advantages of EBioP
Elimination or reduction of chemical costs
Effluent Sol-P conc < 0.2 mg/L are possible
No increase in waste solids production
Provides better control of filamentous growths
Improves activated sludge settleability
Reduces oxygen transfer requirement in aeration basin for BOD removal
Improves oxygen transfer rate in aeration basin
Improves nitrification rate in aeration basin
21

© 2012 O’Brien & Gere
Disadvantages of EBioP
Requires modification of biological process
Anaerobic-aerobic sequencing
Modest additional capital expense
Effluent Sol-P conc determined by VFA:TP ratio in influent to anaerobic zone
Supplementation of VFAs may be necessary
May be affected by biological toxicity
Design and operation requirements are more sensitive
Requires more rigorous biological process control
WAS processing requirements are more complex
22

© 2012 O’Brien & Gere
CHEMICAL P REMOVAL
23

© 2012 O’Brien & Gere
Phosphorus Removal by Chemical Precipitation
Low effluent TP means high dose of chemicals
24
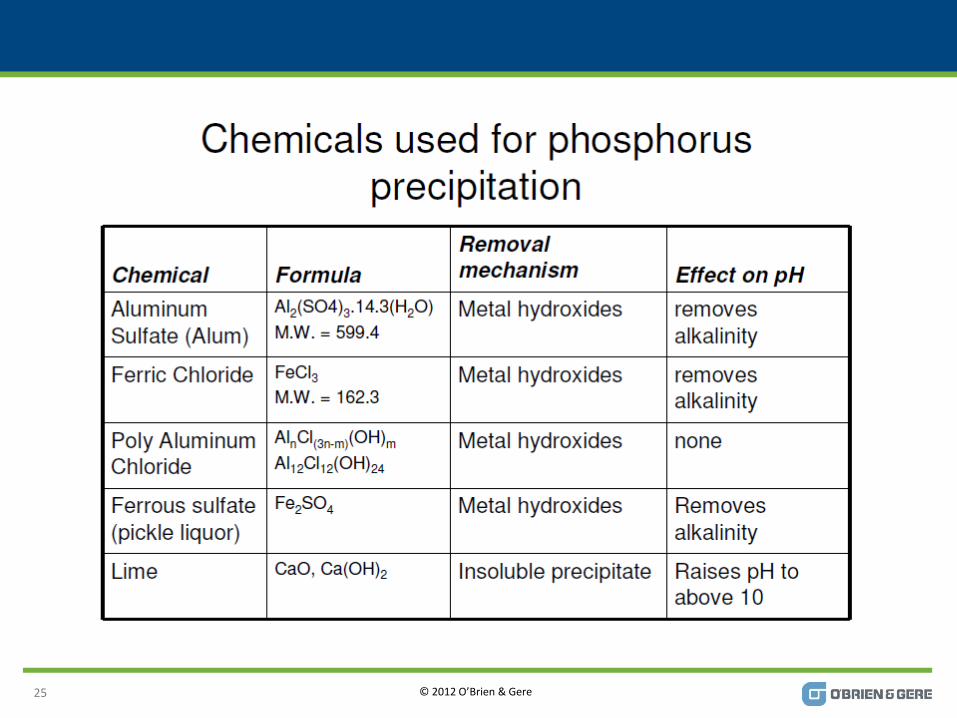
© 2012 O’Brien & Gere 25

© 2012 O’Brien & Gere 26
© 2012 O’Brien & Gere 27

© 2012 O’Brien & Gere
Chemical Dosing Points
Metal salts can be added in several location to precipitate P
Clarification or filtration is required to remove precipitant
28

© 2012 O’Brien & Gere
EFFLUENT CLARIFICATION
29

© 2012 O’Brien & Gere
Final Clarifier Upgrades
Process modeling
Dye testing
Short circuiting
Effluent baffles
Collection limitations
Transport limitations
Improved solids capture → lower effluent TP
30

© 2012 O’Brien & Gere
0.0
0.2
0.4
0.6
0.8
1.0
1.2
1.4
0 10 20 30 40 50 60
Tota
l Ph
osh
oru
s C
on
cne
trat
ion
(m
g/L)
TSS Concentration (mg/L)
Secondary Clarifier Effluent
Effluent TP and TSS
31

© 2012 O’Brien & Gere
High Rate Flocculation Settling (Ballasted Floc)
32

© 2012 O’Brien & Gere
CoMagTM Process (Phosphorus Removal)
33

© 2012 O’Brien & Gere
Effluent Filtration with Cloth Media Disk Filtration
Small footprint
Fine pore sizes
Reuse water applications
Limited competition
34

© 2012 O’Brien & Gere
Cloth Media Effluent Filters
35

© 2012 O’Brien & Gere
Hybrid Bio/Chem
36

© 2012 O’Brien & Gere
CASE STUDY
37

© 2012 O’Brien & Gere
Small Municipal WWTP
38
© 2012 O’Brien & Gere
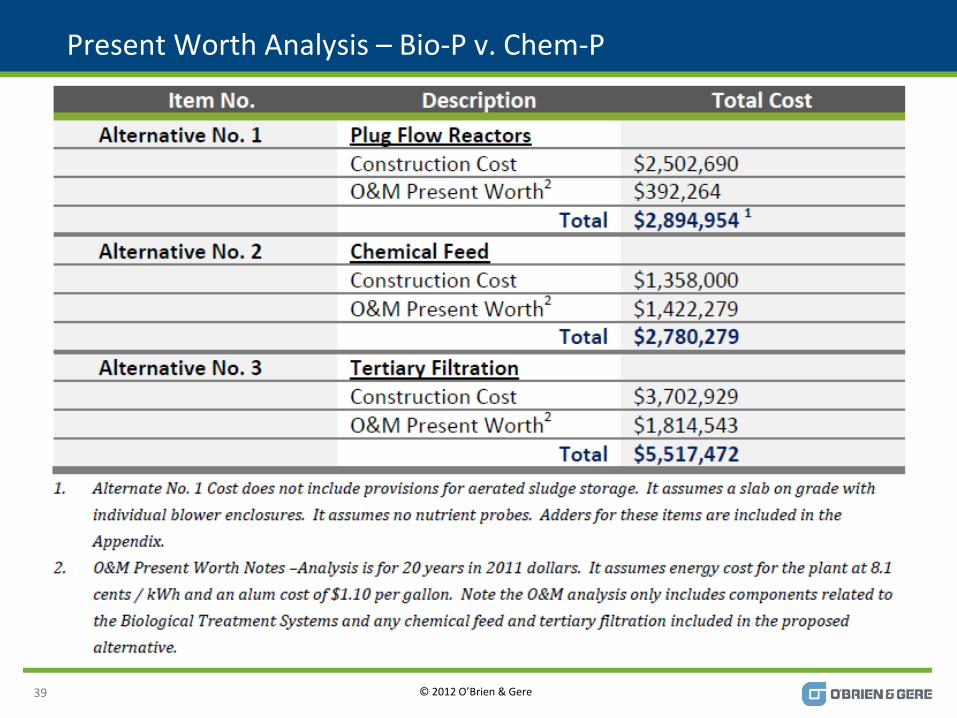
Present Worth Analysis – Bio-P v. Chem-P
39

© 2012 O’Brien & Gere
PHOSPHORUS RECOVERY
40

© 2012 O’Brien & Gere
Recycle Stream / Side Stream Treatment
41
Recycle stream rich in nutrient and increase nutrient load in plant headwork's (TN by 15 – 30 %, TP by up to 40 %)
Recycle stream treatment process

© 2012 O’Brien & Gere
Phosphorus
42
© 2012 O’Brien & Gere
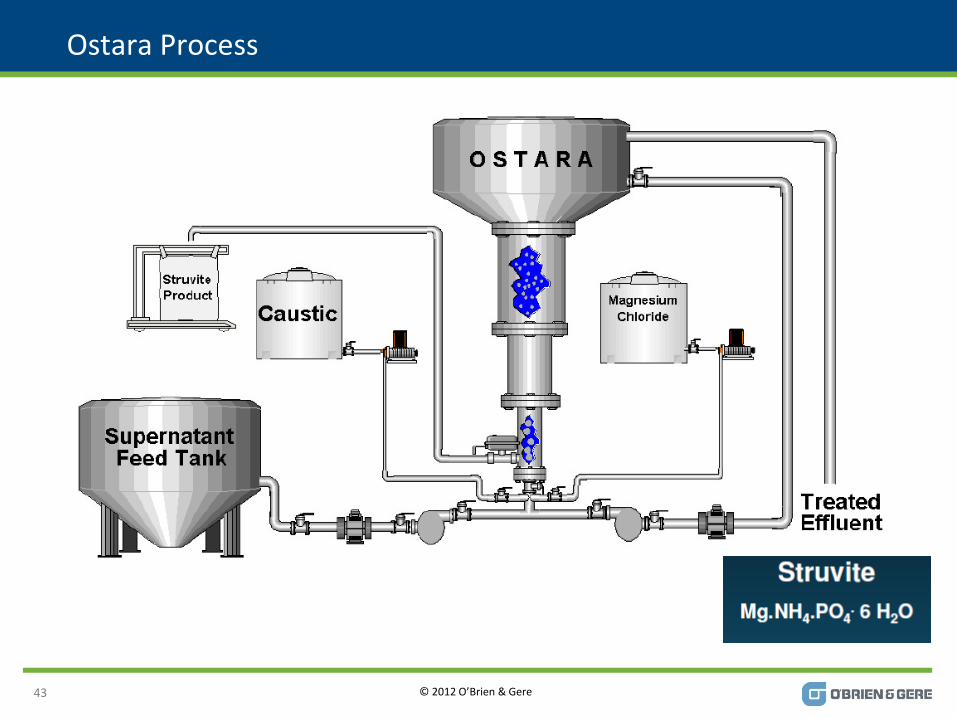
Ostara Process
43

© 2012 O’Brien & Gere
P-Removal Summary - Innovative Adsorptive Media
44
Adsorptive Media Chemistry Comments
Layne RTTM Nano iron oxide on IX resin Commercially available Arsenic removal media applied to P-removal
GeoBindTM Red mud – bauxite process waste
Commercially used for Hg and Arsenic removal as Bauxsol
Proprietary Metal Impregnated Filter Paper or I X Resin
Proprietary electrostatic technology for metal bonding
Improved, lower cost innovation of Rem-Nut IX European technology
Gypsum, Limestone, Calcium Hydroxide, Calcium Carbonate
Ca based chemistry – waste Gypsum
Calcium Hydroxide and Calcium Sulfate exhibit P adsorption/removal capabilities - Ca(OH)2 more so than CaSO4.
PhosphorReducTM Fe or Ca based chemistry –steel slag byproduct
Sourced from EAF or BF steel operations
Iron oxide nano composite materials
Proprietary blend of Nano iron oxide and other nano sized materials
UALR’s low cost production technique enables the application of unique blends of nanocomposites for cost effective P-removal

© 2012 O’Brien & Gere
The Power of Nano-Based Media
45
© 2012 O’Brien & Gere
P Removal Ion Exchange Chemistry
46
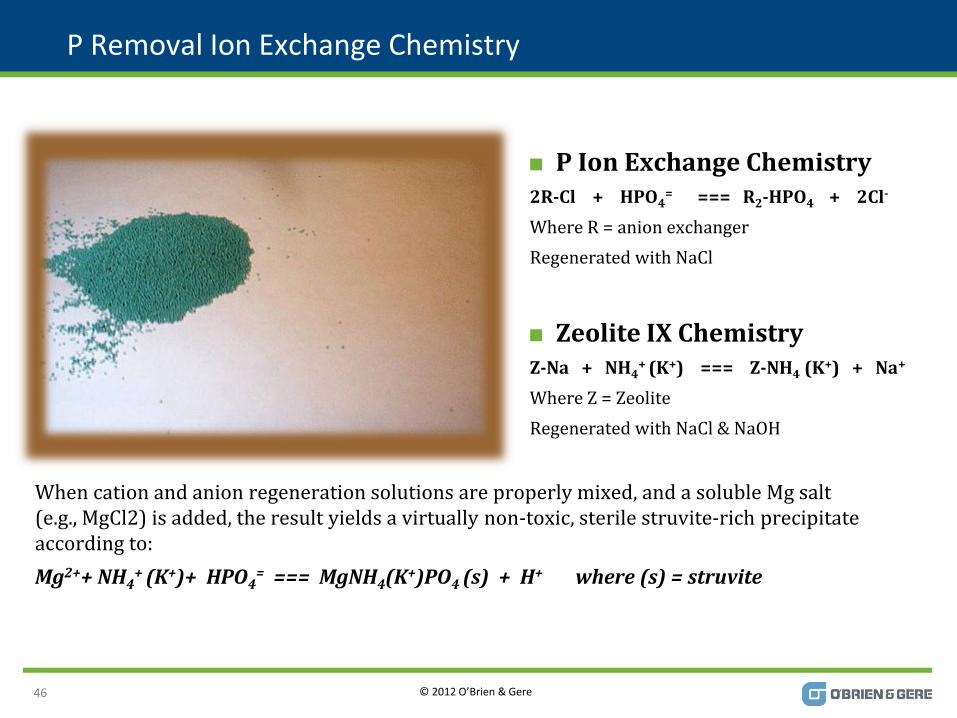
When cation and anion regeneration solutions are properly mixed, and a soluble Mg salt (e.g., MgCl2) is added, the result yields a virtually non-toxic, sterile struvite-rich precipitate according to:
Mg2++ NH4+
(K+)+ HPO4= === MgNH4(K+)PO4 (s) + H+ where (s) = struvite
P Ion Exchange Chemistry 2R-Cl + HPO4
= === R2-HPO4 + 2Cl-
Where R = anion exchanger
Regenerated with NaCl
Zeolite IX Chemistry Z-Na + NH4
+ (K+) === Z-NH4 (K+) + Na+
Where Z = Zeolite
Regenerated with NaCl & NaOH

© 2012 O’Brien & Gere
Nano Composite Materials - UALR
47
GG1-43-2B (C-Ni, solution method), BET surface area: approx. 400 m2/g
GG1-59-4 (C-Ni, powder method), BET surface area: approx. 425 m2/g

