photocatalysis of azo compounds on doped titanium dioxide
TRANSCRIPT

Republic of IraqMinistry of Higher Educationand Scientific ResearchAl-Nahrain UniversityCollege of ScienceDepartment of Chemistry
Photocatalysis of Azo Compoundson Doped Titanium dioxide
A Thesis
Submitted to the College of Science / Al-Nahrain University as a partialfulfillment of the requirements for the Degree of Master of Science in
Chemistry
By
Hussein Mohammed HadiB.Sc. Chemistry / College Science / Karbala University
Supervised by
Dr. Hilal S. Wahab
(Prof.)June 2015 Shaaban 1436

الكهفسورة الكهفسورة الكهفسورة

Acknowledgements
I thank God for the great and countless graces. It is the greatestblessing that gave me this opportunity to write this thesis, which is aresult of a research project in physical chemistry over three years tocontribute to enrich my knowledge in a specialized field and helped meto learn a lot about myself.
First of all, I earnestly like to thank and express my profoundappreciation to my supervisor Prof. Dr. Hilal S. Wahab who hascoordinated and administered with interest the improvement of this work.
Many thanks and deep gratitude goes to the Iraqi Ministry of HigherEducation and Scientific Research / Research and DevelopmentDirectorate for awarding me the financially supported research fellowship
for three months.
Special thanks to Prof. Dr. Igor. F. Perepichka, co-director of my workduring research scholarship period in the United Kingdom / School ofChemistry / Bangor University.
My thanks also go to Dr. David D. Hughes and Mr. ShrikanthKommana / School of Chemistry / Bangor University, Dr. Simon Curling/ Biocomposites Centre/ School of Chemistry / Bangor University, Dr.Jeffrey Kettle and Dr. Yanhua Hong / School of Electronic Engineering/Bangor University and Dr. Ridha Al-Bayati / Chemistry Department /College of Science / Al- Mustansiriya University.
My sincere thanks go also to Mr. Salama AlDouri and Ms. NoorAlZubaidi for their sustained assistance during my stay at Bangor.
My thanks and gratefulness to my research colleagues, Ahmed. A.Hussein, Atheer Fadhel and Ali Najah.
Special appreciation to Al-Nahrain University and all members of thedepartment of chemistry in College of Science for their help during myimplementation of this research work.
Finally, very special thanks to my family, parents and brothersbecause they are always the best hope in my life.

I
Table of Contents
No. Subject Page
Chapter One1 Introduction 1
1.1 Advanced oxidation processes for water
remediation
1
1.2 Heterogeneous photocatalysis process 5
1.3 Azo dyes 7
1.4 Surface modification 9
1.4.1 Nitrogen doped-TiO2 (N-TiO2) 14
1.5 Sol-gel method 18
1.6 The role and mechanisms of added oxidants 19
1.7 Literature Review 21
1.8 Scope of the project 22
Chapter Two2 Experimental part 24
2.1 Chemicals 24
2.1.1 Solid chemicals 24
2.1.2 Liquid chemicals 25
2.2 Procedures 26
2.2.1 Preparation of N-doped TiO2 catalyst by sol gel
method
26
2.2.2 Preparation of K3[Fe(C2O4)3]. 3H2O 26
2.2.3 Measurement of light intensity using actinometrical
method
28
2.2.4 Preparation of azo dyes solution 30

II
2.2.4.1 Preparation of methyl orange solution 30
2.2.5 Testing of degradation of azo dye under visible
light
32
2.2.6 Testing of degradation of azo dye by H2O2 and
visible light
32
2.2.7 Testing of degradation of azo dye by H2O2 in dark 33
2.2.8 Testing of degradation of azo dye by visible light in
presence of N-TiO2
33
2.2.9 Testing of degradation of azo dye by N doped-TiO2
in dark
34
2.2.10 Testing of degradation of azo dye by visible light in
presence of N-TiO2 and H2O2
34
2.2.11 Effect of added electron scavengers (O2, H2O2) 35
2.2.11.1 Effect of absence of scavengers on the degradation
of azo dye
35
2.2.11.2 Effect of H2O2 on the degradation of azo dyes 35
2.2.11.3 Effect of O2 on the degradation of azo dye 36
2.2.11.4 Effect of H2O2 and O2 on the degradation of azo
dye
46
2.2.12 Effect of pH on the degradation of azo dye 37
2.2.13 Effect of nitrogen content of N-TiO2 on the
degradation of azo dye
37
2.2.14 Effect of initial azo dye concentration on the rate of
reaction
38
2.2.15 Effect of N-TiO2 loading on the degradation of azo
dye
39
2.2.16 Effect of light intensity on the degradation of azo 39

III
dye
2.2.17 Effect of UV light on the degradation of azo dye 40
2.2.18 Effect of diluted H2O2 on the degradation of azo
dye
40
2.2.19 Effect of some oxidants on the degradation of azo
dye
41
2.2.20 Determination of H2O2 concentration 41
2.2.21 Influence of solar irradiation 42
2.2.22 2.2.2 General experimental procedure at optimized
conditions
43
2. 3 Instruments 44
2.3.1 Refrigerated circulating bath. Model (WCR-P12),
wisecircu.
44
2.3.2 Nanofiltered-deionized water supply unit. Model
(Sm-11), waterpia.
44
2.3.3 Centrifuge (K centrifuge PLC series.). 44
2.3.4 Muffle furnace (SX-5-12). 44
2.3.5 Drying cabinet (K Hot Air Sterilizer). 44
2.3.6 Apel PD-303 single beam spectrophotometer has
been used for visible light absorption
measurements.
44
2.3.7 Fourier Transform Infrared (FTIR) spectrometer
(IR Prestige-21 Shimadzu).
44
2.3.8 Double beam Shimadzu UV-VIS
spectrophotometer. Model (1650 PC) has also been
used throughout this work.
44
2.3.9 Photoreaction system 44
2.3.10 X-ray Spectrometer 45

IV
2.3.11 Scanning Electron Microscopy (SEM) 45
2.3.12 Photoluminescence (PL) 46
2.3.13 Diffused Reflectance UV-VIS Spectrometer 46
2.3.14 Brunauer Emmett Teller (BET) 46
2.3.15 Nuclear magnetic resonance (NMR) 46
2.3.16 Raman Spectrometer 46
2.3.17 High-Performance Liquid
Chromatography (HPLC)
46
2.3.18 Gas Chromatography–Mass Spectrometry (GC-
MS)
47
2.3.19 Time of Flight Secondary Ion Mass Spectrometry
(TOF- SIMS)
47
2.3.20 Energy Dispersive X-ray Spectrometer (EDXS) 47
2.3.21 Photolysis unit of UV source 47
Chapter Three3 Results and Discussion 48
3.1 Spectroscopic perspectives of azo group containing
dyes
48
3.2 Characterization of the synthesized anatase N-TiO2
nanoparticles
52
3.2.1 Characterization of morphological and structural
properties of N-TiO2 samples
52
3.2.2 Optical properties 55
3.2.2.1 UV–VIS diffused reflectance spectra of N-TiO2 55
3.2.3 Photoluminescence spectra 57
3.2.4 Phase , composition features and particle size of N-
TiO2
58
3.2.5 surface area analysis of N-doped TiO2 64

V
3.3 Control experiments 65
3.4 Experimental optimization of photocatalysis
parameters
67
3.4.1 Influence of initial pH on the degradation 67
3.4.2 Variation of pH and conductivity during
photocatalysis process
74
3.4.3 Effect of catalyst loading 75
3.4.4 Effect of initial dye concentration on the
degradation
77
3.4.5 Effect of H2O2 concentration variation 80
3.4.6 Effect of the presence of some oxidants 82
3.4.7 Effect of N doping on photocatalytic activity 84
3.4.8 Effect of radiation dose on dye removal 86
3.5 Kinetic study 89
3.5.1 Influence of irradiation time on the reaction
kinetics
89
3.5.2 Kinetic model 91
3.5.3 Determination of remaining amount of H2O2 at the
end of reaction
93
3.5.4 Langmuir-Hinshelwood kinetic model for the
Photocatalysis of azo dyes
94
3.6 Evaluation of the photodegradation system via
quantum yield calculations
96
3.7 Effect of temperature and thermodynamic
parameters
102
3.8 Comparison of photocatalytic activity of N-TiO2
nanoparticles under UV, VIS and Solar light
irradiation
106

VI
3.9 Suggested mechanism for azo dye photocatalytic
degradation in TiO2/VIS/H2O2 system
109
3.10 Comparison and evaluation of photocatalytic
degradation of methyl orange and congo red azo
dyes
120
3.11 General conclusions 120
3.12 Suggestions 122
4 References 123
Acceptance letter/ Al-Nahrain University
Journal for Science
Certificate of attendance/ Bangor university/
Wales/ UK
List of Figures
Figure
No.
Figure caption Page
No.1-1 Methanol as an example for mineralization by AOP 5
1-2 General mechanism of the photocatalysis on TiO2
nanomaterials
6
1-3 The molecular structures of (a) Methyl Orange, (b)
Congo Red, (c) Remazol Black B
9
1-4 Chemical structures of natural dyes (A) Fluorescein
Sodium and commercial dye (B) Anthocyanin
11
1-5 Visible light activation of a wide band gap
semiconductor by dye sensitization
11
1-6 Schematic illustration of charge transfer in a coupled
semiconductor
12

VII
1-7 Substitutional (a) and interstitial (b) location of N in
TiO2 lattice
16
1-8 Electronic structure computed for substitutional and
interstitial models
16
1-9 A possible mechanism of photocatalytic reactions of
O• − radical and the schematic band structure of N-
doped TiO2 under visible light irradiation
17
2-1 Calibration curve for Fe+2 30
2-2 Calibration curve for methyl orange 31
2-3 Calibration curve for congo red 32
3-1 UV-VIS spectrum for methyl orange 49
3-2 Protonation and tautomeric equilibrium of methyl
orange molecule in acidic solution
49
3-3 Standard scan of methyl orange at different pH values 50
3-4 UV-VIS spectrum for congo red 51
3-5 Standard scan of congo red at different pH values 51
3-6 Protonation and tautomeric equilibrium of congo red
molecule in acidic solution
52
3-7 SEM images for the (A) anatase TiO2; (B) 2.5% N-
TiO2 ; (C) 5% N-TiO2; (D) 7% N-TiO2
54
3-8 Three dimensional SEM images for the (A) 2.5% N-
TiO2; (B) 5% N-TiO2; (C) 7% N-TiO2
55
3-9 UV–vis diffused reflectance spectra of (B) undoped
TiO2 and (C) 2.5% N-dopedTiO2; (D) 5% N-
dopedTiO2; (E) N-dopedTiO2; (F) 7% N-dopedTiO2
57
3-10 PL spectra of (a) 2.5%N-TiO2, excitation (b) 5% N-
TiO2, (c) 7% N-TiO2 (Xenon lamp as source of λexc.=
340 nm
58

VIII
3-11 Raman spectra of anatase TiO2 and N-doped TiO2
with different starting N content TiO2 powders
60
3-12 XRD pattern for anatase TiO2 61
3-13 XRD pattern for prepared 2.5%N-TiO2 61
3-14 XRD pattern for prepared 5% N-TiO2 62
3-15 XRD pattern for prepared 7% N-TiO2 62
3-16 EDX analysis of 2.5% N-TiO2 63
3-17 TOF-MS of undoped TiO2 63
3-18 TOF-MS of 2.5% N-TiO2 63
3-19 Pore size distribution graphs for the N-TiO2 sample 65
3-20 Control experiments for the photodegradation of
methyl orange
67
3-21 1H-NMR spectra of congo red, red signals for
standard congo red and blue signals for congo red in
acidic medium using DMSO_d6 solvent
69
3-22 1H-NMR spectra of methyl orange, red signals for
standard methyl orange and blue signals for methyl
orange in acidic medium using DMSO_d6 solvent
70
3-23 Protonation of congo red 71
3-24 Protonation of methyl orange 72
3-25 Effect of initial solution pH on the rate of phocatalysis
of MO
73
3-26 Effect of initial solution pH on the rate of phocatalysis
of CR
73
3-27 Changes of pH and conductivity during the
photocatalysis process
75
3-28 Effect of N-TiO2 loading on the removal of methyl
orange
77

IX
3-29 Effect of N-TiO2 loading on the removal of congo red 77
3-30 Effect of initial methyl orange concentration on
photodegradation efficiency
79
3-31 Effect of initial congo red concentration on
photodegradation efficiency
79
3-32 Effect of different amount of H2O2 on degradation of
methyl orange at optimum conditions
82
3-33 Degradation of methyl orange at optimum condition at
different diluted amount of H2O2
83
3-34 Degradation of methyl orange at optimum conditions
using different types of oxidants
84
3-35 Relation of N doping with rate of photodecolorization
of MO; (1) 2.5% N-TiO2 ;(2) 5% N-TiO2; (3) 7% N-
TiO2: inset shows variation of rate constant (k) with N
doping content
86
3-36 Variation of the initial rates as function of light source
intensity
88
3-37 Degradation yield percent at different light intensities 88
3-38 Relationship between square root of light intensity and
reaction rate
89
3-39 Correlation of methyl orange concentration with
irradiation time
90
3-40 Correlation of congo red concentration with
irradiation time
91
3-41 Degradation rate of methyl orange at optimum
conditions
92
3-42 Degradation rate of congo red at optimum conditions 93

X
3-43 Langmuir-Hinshelwood model outcomes for the
photobleaching of congo red at different initial
concentrations; N-TiO2 loading = 40 mg; pH = 2.5
95
3-44 Langmuir-Hinshelwood model outcomes for the
photobleaching of methyl orange at different initial
concentrations; N-TiO2 loading = 50 mg; pH = 2.5
95
3-45 Effect of (a) N-TiO2 loading (b) methyl orange initial
concentration (c) pH and (d) percent of nitrogen
doping on the quantum yield of photocatalytic reaction
100
3-46 Effect of (a) N-TiO2 loading (b) congo red initial
concentration and (c) pH on the quantum yield of
photocatalytic reaction
101
3-47 Arrhenius plot of rate constant versus reciprocal of
reaction temperature for degradation of methyl orange
104
3-48 Arrhenius plot of rate constant versus reciprocal of
reaction temperature for degradation of congo red
105
3-49 Degradation rate of methyl orange using different
doping percents of N-TiO2 under solar light
107
3-50 Rate of photodegradation of methyl orange at
optimum conditions under visible light and ultra violet
light
108
3-51 Comparison between degradation percent of methyl
orange under VIS and UV light
109
3-52 UV-VIS spectra changes of methyl orange at varyingtimes
110
3-53 UV-VIS spectra changes of congo red at varyingtimes
110
3-54 HPLC chromatograms of CR degraded at (a) zero, (b) 112

XI
half time and (c) full time of irradiation.
3-55 HPLC chromotograms of MO degraded at (a) zero, (b)half time and (c) full time of irradiation
113
3-56 FT-IR spectra of (a) pure methyl orange and (b)degraded methyl orange
114
3-57 FT-IR spectra of (a) pure congo red and (b) degradedcongo red
115
3-58 Mass spectra of methyl orange after completedegradation
117
3-59 Mass spectra of congo red after complete degradation 117
3-60 Proposed pathway for the photocatalytic degradationof MO
118
3-61 Proposed pathway for the photocatalytic degradationof CR
119

XII
List of Tables
Table
No.
Table legend Page
No.1-1 Standard electrochemical reduction potentials of
common oxidants
2
1-2 List of typical AOP systems 3
3-1 Particle size of N-TiO2 samples 60
3-2 Degradation percent of methyl orange for control
experiments
67
3-3 Rate constants and adsorption coefficients of the
dyes
96
3-4 Thermodynamic parameters for the photocatalytic
degradation of methyl orange
105
3-5 Thermodynamic parameters for the photocatalytic
degradation of congo red
106
List of Schemes
Scheme
No.
Scheme caption Page
No.1-1 Process flow chart for the preparation of doped
TiO2-based photocatalysts by sol–gel method
19
Image
No.
Image caption Page
No.2-9 Photolysis unit 44
List of Images

XIII
Adsorbed species on a surfaceAdsAdvanced Oxidation ProcessAOPBrunauer, Emmett and TellerBETInitial concentrationCₒConcentration at any timeCtConduction bandCBCongo redCRDisinfection byproductsDBPsElectron formed upon illumination of asemiconductor
e_
Activation energyEaEnergy Dispersive X-ray spectroscopyEDXBand gap energyEgElectron Paramagnetic ResonanceEPRElectron Spin ResonanceESRHighest occupied molecular orbitalHOMO
Incident photon energyhνFourier transforms infrared spectrometryFTIR
Equilibrium adsorption constantKadsKinetic constantkApparent rate constantk app
kappLangmuir–HinshelwoodL-HLowest unoccupied molecular orbitalLUMOMethyl orangeMONano filtered deionized waterNFDWnanometernmNatural organic matterNOMSuperoxide ion radicalO-
2
Hydroxyl radicalOH-
PhotoluminescencePLParts per millionppm
Temperature (Kelvin)T
Time of Flight Secondary Ion MassSpectroscopy
TOF-SIMS
UltrasoundUS
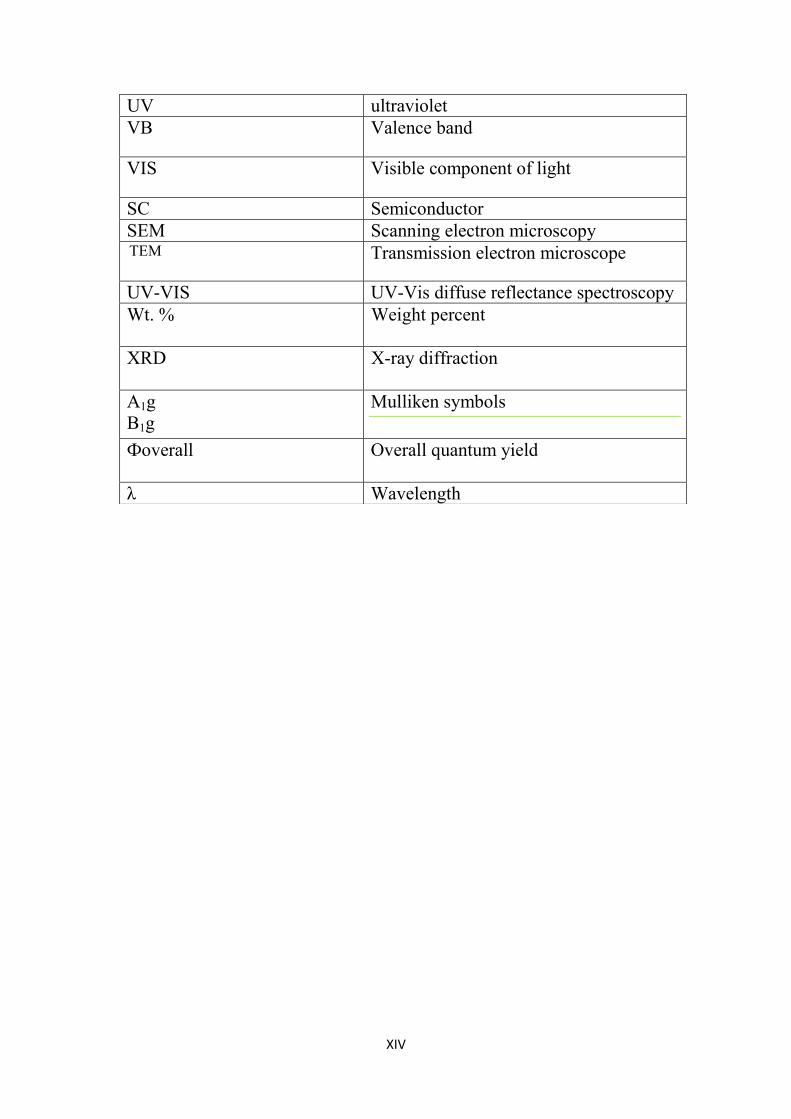
List of Abbreviations
XIV
ultravioletUVValence bandVB
Visible component of lightVIS
SemiconductorSCScanning electron microscopySEMTransmission electron microscopeTEM
UV-Vis diffuse reflectance spectroscopyUV-VISWeight percentWt. %
X-ray diffractionXRD
Mulliken symbolsA1gB1g
Overall quantum yieldФoverall
Wavelengthλ

XV
Summary
The photodegradation and degradation of two azo group containing
dyes namely; methyl orange (MO) as mono azo model and congo red
(CR) as di azo model moieties, have been investigated, throughout this
thesis, in aqueous medium. Three different nitrogen content (2.5%, 5%
and 7%) laboratory synthesized doped anatase TiO2 nano particles (N-
TiO2) have been employed as a photocatayst utilizing visible light
illumination. The N-TiO2 photocatalysts have been characterized
employing several spectroscopic and electronic tools encompassing.
Scanning Electron Microscope (SEM) which presented smooth and
ordered surfaces, Enegry Dispersive X-ray spectrometer (EDXS) and
Time of Flight Mass Spectrometer (TOF-MS) which focused on the
composition of various nitrogen doped TiO2 photocatalys, X-ray
Diffractometer (XRD) which presented via the pattern a neat anatase
allotrope without rutile diffraction peaks with particle sizes in the nano
range 52.4 nm, Diffused integrated sphere UV-VIS spectrophotometer
(DU-UV-VIS) which determined the band gap energies at visible region
of the electromagnetic spectrum where Eg of 2.5 % N-TiO2 was 3.02 eV
(410nm) compared with 3.26 eV (380nm) of anatase TiO2,
Photoluminescence (PLS) spectrometry for the recording of
recombination spectra which corroborated that 2.5% N-TiO2
photocatalyst contained the least recombination rate and finally
Brunauer–Emmett–Teller (BET) measurements which confirmed the
mesoporosity of all the prepared N-TiO2 nano catalysts with surface area
of 48.412 m2/g of 2.5% N-TiO2.
The effects of some experimental variables for the
photodegradation of the two azo dyes have been investigated including,
he

XVI
initial solution pH, initial dye concentration, N-TiO2 loading amount,
visible light intensity and role of some oxidants.
At optimum operational conditions for MO including pH = 2.5, 50
mg/l N-TiO2 loading, and 3.05 x 10⁻⁵mol/l (10 mg/l) methyl orange, the
value of the apparent rate constant, kapp , obtained has been 0.085 min-1 (
0.00141 sec-1) and the half life of the process, accordingly is equal to
0.133 hours. Whereas, for CR dye implying pH = 2.5, 40 mg/l N-TiO2
loading, and 2.15 x 10⁻⁵ mol/l ( 15 mg/l) , the value of the apparent rate
constant, kapp , obtained has been 0.034 min-1 (0.000305 sec-1) and the
half life of the process, accordingly is equal to 0.34 hours.
The kinetic studies for the photobleaching of MO and CR have
revealed that the process follows the pseudo first order pattern regardless
of reaction conditions. Moreover, the computed apparent quantum yields
for the photodecolorization process have been 0.077 and 0.0135 for MO
and CR, respectively.
The rate and yield results of the Photo oxidation process show that
both dyes are influenced massively by the addition of hydrogen peroxide
and other oxidants like persulfate, chlorate, bromate and iodate. The main
process activation thermodynamic parameters namely, Gibbs energy,
enthalpy and entropy were also deduced following the computation of
photolysis activation energy employing the well known Arrhenius
relation.
The mechanistic study employing GC-MS, NMR, FTIR and HPLC
techniques has revealed the probable pathways for the formation of
various degradation intermediates and mineralization products.

Chapter one
Introduction
And literature
review

1
1. Introduction1.1 Advanced oxidation processes for water remediation
Water is the most fundamental substance for all life on earth and a
valuable asset for human development. Dependable access to clean and
reasonable water is viewed as a standout amongst the most fundamental
compassionate objectives, and remains a major global challenge for the 21st
century [1]. Current water supply faces enormous challenges, both old and
new. Over worldwide, about 780 million people need access to enhanced
drinking water sources. It is pressing to implement basic water treatment in
the influenced areas (chiefly in developing countries) where water and
wastewater infrastructure often does not exist. In both developing and
industrialized countries, human activities play a great role in a massive water
scarcity by contaminating natural water sources [1].
The waste products generated from the textiles, chemicals, mining and
metallurgical industries are mainly responsible for contaminating the water.
This contaminated water contains non-biodegradable effluents, such as
heavy metal ions (arsenic, zinc, copper, nickel, mercury, cadmium, lead and
chromium…. etc.) and organic materials that are carcinogenic to human
beings and harmful to the environment [2].
There are many traditional treatment methods such as biological
treatment, air stripping, using of activated carbon and non photochemical
oxidation that are used to removal of resistance organic compounds.
But these processes are not destroyed; they only transfer the contaminants
from one phase to another [3].
Alternatively advanced oxidation processes (AOT) are considered as
one of the critical utilizations of photochemical process that depending on
hydroxyl radical formation using excitation sources [4]. The oxidation
2
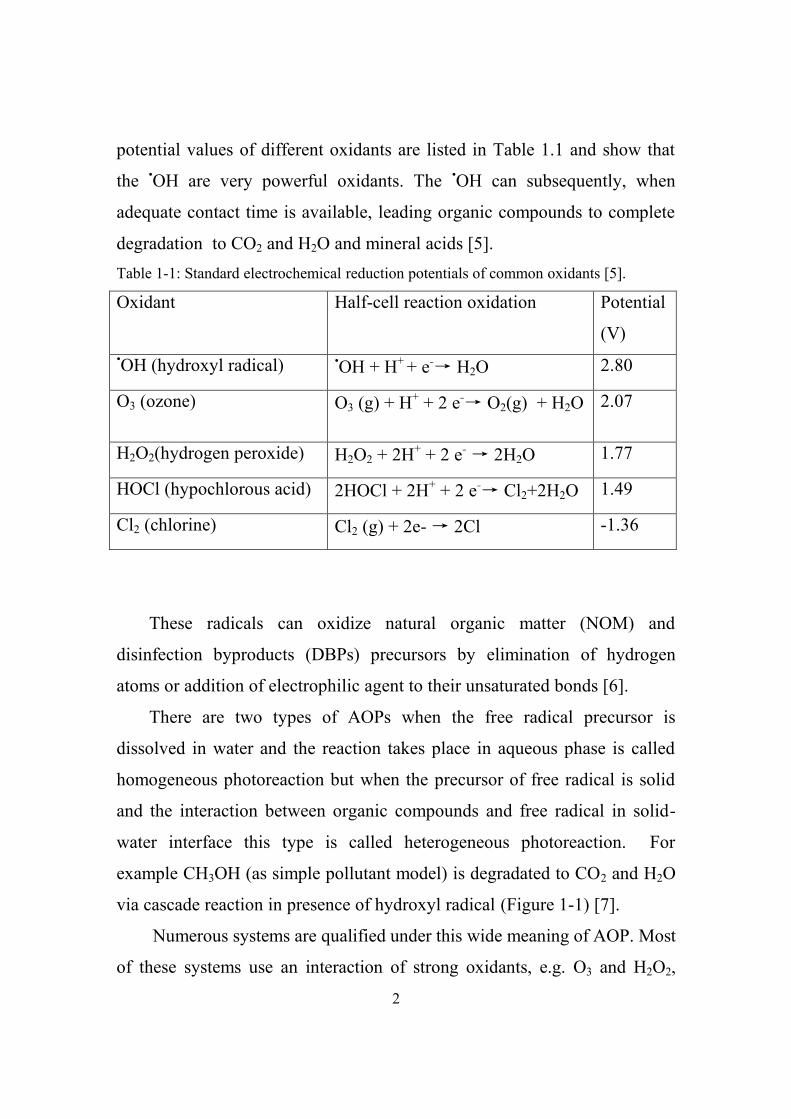
potential values of different oxidants are listed in Table 1.1 and show that
the •OH are very powerful oxidants. The •OH can subsequently, when
adequate contact time is available, leading organic compounds to complete
degradation to CO2 and H2O and mineral acids [5].Table 1-1: Standard electrochemical reduction potentials of common oxidants [5].
Oxidant Half-cell reaction oxidation Potential
(V)•OH (hydroxyl radical) •OH + H+ + e−→ H2O 2.80
O3 (ozone) O3 (g) + H+ + 2 e−→ O2(g) + H2O 2.07
H2O2(hydrogen peroxide) H2O2 + 2H+ + 2 e−→ 2H2O 1.77
HOCl (hypochlorous acid) 2HOCl + 2H+ + 2 e−→ Cl2+2H2O 1.49
Cl2 (chlorine) Cl2 (g) + 2e-→ 2Cl -1.36
These radicals can oxidize natural organic matter (NOM) and
disinfection byproducts (DBPs) precursors by elimination of hydrogen
atoms or addition of electrophilic agent to their unsaturated bonds [6].
There are two types of AOPs when the free radical precursor is
dissolved in water and the reaction takes place in aqueous phase is called
homogeneous photoreaction but when the precursor of free radical is solid
and the interaction between organic compounds and free radical in solid-
water interface this type is called heterogeneous photoreaction. For
example CH3OH (as simple pollutant model) is degradated to CO2 and H2O
via cascade reaction in presence of hydroxyl radical (Figure 1-1) [7].
Numerous systems are qualified under this wide meaning of AOP. Most
of these systems use an interaction of strong oxidants, e.g. O3 and H2O2,

3
catalysts, e.g. transition metal ions or photocatalyst, and excitation source,
e.g. ultraviolet (UV), ultrasonication or electron beam. Table 1-2 lists typical
AOP systems [8].
The key advantages of these processes are destructive nature and on-
site degradation of contaminants leading to mineralization.
Disadvantages of AOPs involve addition of inorganic oxidants,
illumination source requirement, control pH, presence of some species that
decrease the efficiency of process like carbonate which considered • OH
consuming and nitrate that adsorb UV light rather than catalyst and need for
removal of secondary contaminants in some cases [7].
Table 1-2: List of typical AOP systems
Non-photochemical PhotochemicalO3/ -OH H2O2/UVO3/H2O2 O3/UVO3/ ultrasonication O3/H2O2/UVO3 / granulated activatedcarbon
H2O2/Fe2+ (photo-Fenton)
Fe2+/H2O2 (Fenton system) UV/TiO2electro-Fenton H2O2/TiO2/UVelectron beam irradiation O2/TiO2/UVultrasound UV/ ultrasonicationH2O2/ ultrasonicationO3/ catalyst

4
Organic compounds CO2 + H2O +H+ 1.1i) TiO2
ii) O2iii) hν ≥ Eg
Intermediate(s)
CH3OH + • OH •CH2OH +H2O
O2
HCOH + HO2•
(Formaldehyde)
H2O
OH-CH2-OH
•OH
H2O + HO-•CH-OHO2
HCOOH + HO2•
( Formic acid)
•OH
(band gap energy)
hνTiO2 TiO2 (e-- h+ ) 1.2
h+ + -OH ads• OH ads 1.3
h+ + H2O ads • OH ads + H+ 1.4

5
1.2 Heterogeneous photocatalysis process
Water purification, water splitting and isotopic exchange are classified
as heterogeneous photocatalysis systems [9].
Semiconductors are characterized by having electronic band structure in
which the highest occupied band (the valence band) and lowest unoccupied
energy band (the conductance band) with energy gaps between them (Eg).
When light strikes the surface of semiconductor with energy equal to or
greater than energy gap, the electron is excited from (VB) to (CB) leaving
behind hole with positive charge. The recombination of e- - h+ pair takes in
few nanoseconds and the energy emits as light or heat, but in presence of
suitable scavenger the photo charge carriers are trapped and reduction-
oxidation (redo) reactions can be started (Figure 1-2) [10].
The most important features of this process making it applicable to the
treatment of contaminated aqueous effluents are [11]:
- The process does not need extreme conditions.
- Complete degradation of target materials into CO2, H2O and small
inorganic species.
- The oxygen necessary for free radical formation can be acquired from
atmosphere.
- The catalyst is photoactive, chemical inert, non-toxic, can be recycle and it
can be modified to improvement its properties.
- Sun can be used as excitation source.
•COOH 1.5
Figure 1-1: Methanol as an example for mineralization by AOP
CO2 + H2O

6
Many elementary mechanistic processes have been described in the
photocatalytic degradation of organic compounds over one of the very
common [9, 13]. The proposed mechanism is depicted as follow:
1. Formation of e- - h+ pair by absorption of photons
(TiO2) + hν→ e–CB + h+
VB 1.6
2. Production of superoxide anion
(O2)ads + e−
CB→ O2• − 1.7
3. reaction of −OH groups with hole to give•OH radical
(H2O H+ + −OH)ads + h+VB→ H+ + •OH
4. Hydroperoxyl radical formation
O2• − + H+→ HO2
•
5. Transformation of hydroperoxyl to hydrogenperoxide and oxygen
Figure 1-2: General mechanism of the photocatalysis on TiO2 nanomaterials ,reprinted and modified from ref. [12]
1.8
1.9

7
2HO2• −→ H2O2 + O2
6. Reduction of hydrogen peroxide by electron
H2O2 + e− → •OH + −OH
7. Oxidation of the organic compound by highly reactive •OH
R + •OH →R • + H2O
8. decomposition of organic compound by reaction with hole
R + h+→ R+ •→ degradation products
1.3 Azo dyes
Generally, dye structures contain two principal parts. The first one is
called chromophores which are unsaturated covalent groups responsible for
appearance of color while the second is saturated covalent group and called
(auxochrome) which enables the dye to dissolve in water and
produces a bathochromic shift [14].
Dyes have great significance in our lives. But unfortunately 12% of
these dyes are wasted during the coloring process and enters water resource
[15].The effect of these dyes on the environment is a great concern because
of the potentially cancer-causing and allergenic properties of these materials
especially when dyes suffer from anaerobic discolorations [16]. In addition,
these dyes can prevent both sunlight penetration and dissolved oxygen,
which are essential for aquatic life. Advanced oxidation technologies are the
most widely used approach that is employed for dye destruction process
[17]. On the other hand, the dyes are classified depending on their color,
structure, principle uses and chromophores groups [18].
1.10
1.12
1.13
1.11

8
Azo-dyes are characterized by nitrogen to nitrogen double bonds
(–N=N–) that are usually attached to two radicals of which at least one but
usually both are aromatic groups (benzene or naphthalene rings). The
presence of sulphonic acid groups in azo dyes improve their water solubility,
and the azo chromophoric ones gives resistance to the dyes against
biological treatment [19- 20].
Monoazo, diazo and triazo are various types of azo dyes based on the
number of azo group in the dyes [18, 21-24], as they are illustrated in
Figure 1-3.
Few azo dyes can be degraded by homogeneous system because of large
number of azo dyes are usually resistant to UV light and their solubility
decreases when molecular weight increases. A complete degradation is not
achieved due to the very low quantum yield of these systems [23, 25-26].
Therefore H2O2, O3, Fenton's reagent, and titanium dioxide are often added
to generate highly reactive radicals for azo dyes removal [12, 27].

9
1.4 Surface modificationAccording to flash photolysis measurements, the lifetimes of e- and h+
are only few nanoseconds. In order to inhibit the recombination process and
enhance redox reaction, the charge carriers must be trapped within about 20
picoseconds (ps) [28]. On the other hand, the efficiency of photocatalytic
process is evaluated through many factors including the resistance of the
semiconductor to photo corrosion, the nature of the end products and the
excitation wavelength [29]. For example, small band-gap semiconductors
such as CdS (2.4 eV) [30], ZnO (3.37 eV) [31] are active under illumination
Figure 1-3: The molecular structures of (a) Methyl Orange; (b) Congo red; (c) Direct Blue 71

10
by solar light but they usually suffer from photocorrosion induced by self
decomopsition [32-33].
These unfavorable reactions lead to lowered photoactivity and produce
toxic metal ions (e.g., Cd+2 ) into solution. Beside of that, anatase TiO2 is
photoactive, but its band gap energy is relatively large (Eg = 3.2 eV). it is
only active under UV light therefore UV source is needed and further, as it is
known that the ultraviolet light is ionizing and consequently, can cause
damage to the human body leading to cancer [9, 14, 34].
Coupling of TiO2 with other semiconductors (composite), adsorption
of dye on the surface of titania (sensitization) and formation of oxygen
vacancies can be shifted the excitation wavelength to the longer wavelength
(red shift) [35-36].
Physical adsorption of dyes on surface of titanium dioxide via weak Van
der Waals forces is considered successful method to expand the response of
TiO2 into visible light spectrum [37]. In this case the excitation process takes
place at the surface of dye rather than the surface of semiconductor where
the electron is promoted from the highest occupied molecular orbital
(HOMO) to the lowest unoccupied molecular orbital (LUMO) of a dye to
transfer directly to conduction band of TiO2 [38]. Using of sensitized TiO2
gives good results under solar light [39]. Various types of dyes such as
commercial dye sensitizers and natural dye sensitizers have been used to
CdS + 2h+ Cd 2+ + S 1.14
ZnO + 2h+ ZnO2+ + 1/2 O2 1.15

11
sensitize TiO2 particles to visible light (Figure 1-4) [40-41]. The scheme of
dye-sensitization of TiO2 is illustrated in Figure 1-5.
Coupling or composite is another way to suppress the e--h+
recombination process. This method involves combination between large
band gap semiconductor and narrow band gap semiconductor that can
absorb visible light (Figure 1-6) [42- 43]. Both semiconductors should be
Figure 1-5: Visible light activation of a wide band gap semiconductor by dyesensitization, adapted from [36]
Figure 1-4: Chemical structures of natural dye (A) Fluorescein Sodium and commercial dye(B) Anthocyanin

12
photostable, the CB energy of large band gap semiconductor should be more
than that of water oxidation to spilt water into H2 and O2 and more
electronegative than CB of low band gap semiconductor in order to be able
to trap electron from CB of low band gap semiconductor [44].
TiO2 has been coupled with low band gap semiconductors such as
Bi2S3/ TiO2, CdS/TiO2 [45]. Through electron spin resonance (ESR) studies,
the observed signal is attributed to Ti+3 which confirms electron transfer
from low band gap semiconductor to TiO2 [46].
Figure 1-6: Schematic illustration of charge transfer in a coupled semiconductorsystem, adapted from [46]

13
Doping or deposition of Both, metal and non-metal like N and S [47]
are effective way to increase spectral response of TiO2 into visible light
region through creating electronic states under CB of TiO2 leading to
lowering of its band gap energy [42, 48]. Among non-metals, N-doped TiO2
is the most effective in narrowing the band gap [42]. Noble metals, including
Pt [49] and Au [50], have been reported to be very active for development of
TiO2 photocatalysis. In this type of systems, the photoinduced electrons are
transferred from CB to metal particles deposited on the surface of TiO2,
while photogenerated VB holes stay on the TiO2 because of fact that the
Fermi energy of these metals are lower than that of TiO2 [51]. These
activities enormously inhibit the electron-hole recombination, resulting in
enhance separation and efficient photocatalytic reactions [51].
Impurity states M(n+1)+ and M(n−1)+ that responsible of absorption of
visible light are generated as result of incorporation of metal ion into the
lattice of TiO2 as indicated in equations 1.16 and 1.17 where M and Mn+
represent metal and metal ion dopant, respectively. Besides, the e− transfer
between Mn+ and TiO2 can suppress the recombination process, equations
1.18 and 1.19 [44, 51]. The energy level of the CB of TiO2 should be more
negative than that of Mn+/M(n-1)+ , while the energy level of the VB edge of
TiO2 should be more positive than that of Mn+/M(n+1)+ [5].
Mn+ + hν→ M(n+1)+ + e−CB 1.16
Mn+ + hν → M(n−1)+ + h+VB 1.17
Electron trap : Mn+ + e−CB → M(n−1)+ 1.18
Hole trap : Mn+ + hVB+ → M(n+1)+ 1.19
Thus modification of semiconductor by different strategies result in
important advantages [28, 52-55] as follows:

14
1- Recombination process is retarded by enhancing the charge carrier
separation and therefore increasing the activity of the photocatalytic process.
2- Shifting the excitation wavelength to visible light region.
3- Quantum yield and rates of photocatalytic reaction are increased.
4- Modification of catalyst surface increases surface reactivity.
5- Trapping of electron and/ or hole makes the photocatalysis process
smooth.
1.4.1 Nitrogen doped-TiO2 (N-TiO2)
One of the problematic features of anatase usage in water purification
application is its large band gap energy that needs ultra violet radiation to be
excited and one of the active tools to overcome this limitation is doping with
different types of transition metal, and /or doping with nonmetals to increase
the visible light absorption and to retard the recombination of photoinduced
charge carries [56-57]. To get efficient TiO2 in visible light region, Asahi et
al. [58], showed several terms, dopants should create intra band gap or
electronic states into the bandgap of TiO2 that absorb visible light, to make
sure the doped TiO2 is active in water splitting process, the energy of CB and
the electronic states that belong to dopants should be equal or higher than
water oxidation level (1.23 V) and in order to separate e- - h+ pair there must
be effective overlap between mid band gap of impurity states and the band
gap of TiO2. In spite of the widespread of cationic metal doped TiO2, there
are many problems including the cost of metal doped TiO2 synthesis
procedure, thermal instability, localized d state in the deep band gap of TiO2
that belong to metal dopant which behave as recombination center of charge
carriers [59-60].
Many reports showed that nitrogen is the best option among the
doping types like the transition metals and nonmetals due to its small

15
ionization energy, comparable atomic size and atomic radius with oxygen,
formation of meta stable center, thermal stability, low recombination centers
and can absorb visible light. Nitrogen is introduced into the lattice of
titanium dioxide by several ways such as ion implantation, magnetron
coating, titanium nitride oxidation and sol–gel [61-62].
Many physical and chemical properties is changed during the doping
of nitrogen into TiO2 but the significant changed property is the
photocatalytic activity toward visible light spectrum. Deposition of titania
with urea is the best procedure to form N doped TiO2 compared with heating
of TiO2 with molecular nitrogen gas or ammonia at high temperature which
is reduced the active sites on the surface of TiO2 [63-64,]. It is worth
mentioning that the mechanism of nitrogen incorporation is still unknown
[65].
There are many assumptions to explain the mechanism of
photocatalytic activity of N-TiO2. One of them suggest oxygen is replaced
by interstitial nitrogen via formation of Ti-O-N and then interaction between
nitrogen and O-2 to form (NO)3
- that induce oxygen vacancy formation [66].
In the case of interstitial nitrogen doped titania, 2p orbital of nitrogen
overlaps with 2p orbital of oxygen to give ᴨ* localized states under the
conduction band of TiO2 which lower the band gap energy of approximately
0.73 eV [67]. The other explanation suggests formation of one oxygen
vacancy when two nitrogen atoms introduced substitutionally into lattice of
TiO2 [68]. 2p orbital of substitutional nitrogen that located above VB is not
hybridized withy 2p orbital of oxygen and is responsible of visible light
absorption and reduce band gap energy about 0.14 eV [69]. High
concentration of nitrogen precursor during preparation of N-TiO2 leads to
interstitial nitrogen and vice versa [67]. Substitutional and interstitial

16
nitrogen doped TiO2 model and reduction of band gap energy are showed in
Figures 1-7 and 1-8 respectively.
Figure 1-8: Electronic structure computed for substitutional and interstitial models,
reprinted from ref. [68]
Figure 1-7: Substitutional (a) and interstitial (b) location of N in TiO2 lattice lattice,
reprinted [59]

17
According to reported data [70-72], the band gap narrowing due to
doping process results in large number of electrons and holes under
illumination and in absence of suitable scavenger it is possible to reduce
Ti+4 to Ti+3 and to generate 3d orbital under CB edge which subsequently
contributes to decrease the band gap energy, beside of nitrogen impurity role
as shown in Figure 1-9.
Serpone and co-worker [73-74] noted that there is what is known as
color center that forms during nitrogen incorporation that reacts with oxygen
vacancy to decrease band edge energy.
Figure 1-9: A possible mechanism of photocatalytic reactions of O• −
radical and the schematic band structure of N-doped TiO2 undervisible light irradiation, adapted from [70].
Sunlight

18
1.5 Sol-gel method
Sol-gel is simple and easy method to prepare three-dimensional metal
oxide network and does not require complicated equipment [75-76]. Sol–gel
processing allows to control of formats and shape of oxides [77]. Beside of
that, it enables to incorporate impurities into network of semiconductor
leading to the formation of materials with unique properties for different
applications [78].
By hydrolysis of metal alkoxide into three dimensional network, sol is
formed where often used such as Ti(IV) or Nb(V) because they are very
reactive towards hydrolysis [75,79]. Controlling of the reaction rate through
variation of some parameters like temperatre, acidic medium, alkoxide
nature and addition of some chemicals can prevent the dispersed sol particles
from agglomeration and solubility [80]. The hydrolysis, condensation and
general reaction are summarized in the following equations [79].
M-OH + HO-M M-O-M + H2O 1.20
By modifying the reactivity of the precursors, sequential formation of
sols and gels are allowed [75,79].
Hydrolysis: -MOR + H2O -MOH + ROH 1.21
Thus, it is possible to control subsequent condensation reactions
according to equations (1.20) or (1.22), preventing the primary particles
from further condensation (in an ideal case, a sol is formed):
Condensation: - MOH + ROM - -MOM- + ROH 1.22
Self-assemblies between metal alkoxide molecules are resulted from
interactions between them via hydrogen bonds; van der Waals forces
network [81-82]. Unfortunately, the sol-gel processing requires long time,
using high temperature for the crystallization and removal of organic part

19
and most metal precursor is sensitive to moisture [83-84]. Doped TiO2 can
be prepared by sol gel [63] according to the chart which is shown in Scheme
1-1 [85].
1.6 The role and mechanism of added oxidants
The presence of oxidant in photocatalytic suspension plays important
role in enhancement of photocatalytic efficiency [86]. This feature is the
result of several roles performed by the oxidant which can be summarized as
follows [20,87] :
1- It acts as scavenger of electron and holes and hence prevents
recombination process.
2- Generation of oxidizing agents and increasing their concentration
especially •OH leading to increase of reaction rate because of ability of these
reactive species to degrade organic substrate.
3- Increasing of quantum yield.
Drying /hydrothermaltreatment
Scheme 1-1: Process flow chart for the preparation of doped TiO2-based photocatalysts by sol–gel method,adapted from [85]
Titaniumprecursor
TiO2-alcoholate
Hydrolysisprocess
Sol- gel
Dopant precursor
alcoholicreagent
20
Oxygen is the most commonly used in photocatalytic system which
able to produce superoxide anion directly and then generate hydroxyl radical
according to the following equations [88].
(O2)ads + TiO2(e−)→TiO2 + O2• − 1.23
O2• − + 2H2O→ 2H2O2 1.24
H2O2→ 2•OH 1.25
The main and direct source to produce hydroxyl radical in adequate
amount is hydrogen peroxide (H2O2). In addition, hydrogen peroxide can be
trapped conduction band electron to contribute in inhibition of electron-hole
recombination as following [89-90].
H2O2 + O2−→ •OH + − OH + O2
• 1.26
H2O2 + hν→ 2•OH 1.27
H2O2 + e−→ OH− + •OH 1.28
Persulfate (S2O82−) is another free radical precursor which has many
advantages including high solubility, thermal stability, non expensive, it is
easy stored and its higher potential (Eo= 2.01 V) [91-92]. Persulfate can be
formed SO4• − by reaction with electron or exposure to direct photolysis
equations (1.29) and (1.30).
eaq− +S2O8
2−→SO4• − +SO4
2− 1.29
S2O82− + hν→SO4
• − +SO4• − 1.30
Inorganic oxidants that have three oxygen atoms and central halogen atom
are called oxyhalogen oxidants. Halogen atom has high electronegativity,

21
therefore they are capable to trap electron and give different radicals, despite
chlorate is not very active compared with bromate and iodate [93]. Their
activity could be understood through the following reactions:
IO4− +h+→ IO3
• +O• − 1.31O• − +H+→ •OH 1.32•OH + IO4
−→−OH + IO4• 1.33
BrO−3 + 6e−
CB + 6H+→ Br− + 3H2O 1.34
ClO3 + 6e−
CB + 6H+→ 3H2O + Cl− 1.35
1.7 Literature Review
Wide range contaminants in wastewater is degraded and removed using
advanced oxidation process that rely largely on the use of titanium dioxide
as catalyst [2,4]. One of the most dangerous pollutants is what is known as
azo dyes. Many researchers have worked to remove these compounds by
using UV or VIS light with pure or modified TiO2 [116, 142]. Employment
of N doped TiO2 in photocatalysis process showed a great activity under
visible light [58]. Sol-gel method is successful way to prepare N-TiO2 by
coprecipetation of urea and precursor of titanium dioxide that followed by
thermal treatment [63, 67, 70].
Several experimental parameters like amount of catalyst, concentration
of dye, pH, temperature and light intensity are studied to accomplish the
optimum conditions. Authors [56, 177] noted when pH decreased the
degradation percent of dye increased. Furthermore, as the dye initial
concentration increases the rate of photocatalytic reaction becomes low [22,
27]. Daneshvar et al. [123] reported that the number of reached photons

22
reduced when adding high catalyst amount that has negative effect on the
degradation percent of dyes. A major goal of the modification of TiO2 is to
extend the adsorption threshold wavelength from UV to the visible light
range in order to utilize solar light since the latter is one of the cleanest and
cheapest forms of energy [31, 121]. Different analytical techniques such as
high performance liquid chromatography (HPLC), gas chromatography–
mass spectrometry (GC–MS), 1H NMR, diffuse reflectance UV-VIS and
FTIR [174-176] were utilized to find out the intermediates of organic
compounds degradation.
1.8 Scope of the project
Azo group containing compounds are potential organic pollutants which
are usually characterized by the presence of one or more azo group bound to
aromatic rings and their release into the environment is intuitively of great
concern. Accordingly, the main purpose of this project is to build up an
optimum photocatalytic slurry reactor system based on the visible
illumination of three different contents (2.5%, 5% and 7%) of N-doped TiO2
nanoparticles, which presumably improve the photocatalytic activity by
nitrogen impregnated TiO2 nanostructure, aiming consequently to remove
the model dye pollutants (MO and CR) from aqueous media and further to
explore the mechanistic pathways of the photocatalytic degradation process.
This set up will absolutely allow exploration of the impacts of several
operational parameters on the rate and photoedegradation quantum yield of
nominated azo dyes. Among those parameters namely; initial concentration
of mono azo group (MO) and di azo group (CR) dyes, N- doped TiO2 dosage
with variable nitrogen content, visible light source intensity, initial pH of
photocatalysis media, illumination time and different added oxidants have

23
been intended to be extensively investigated. Moreover, the characterization
of the synthesized three level nano anatase N-TiO2 photocatalysts has been
another objective of this project encompassing structural (XRD, EDX,TOF-
MS and FTIR), morphological (SEM and BET) and optical (UV/VIS
reflection, PL and Raman) techniques. The kinetic, thermodynamic and
plausible photodegradation mechanism studies have also been one of the
objectives of this research work.

24
This chapter includes all the experimental activities done involvingsynthesis of catalyst, characterization devices and procedures, parameterseffect, experimental instruments and chemical materials utilized all throughthis work.
2.1 Chemicals2.1.1 Solid Chemicals
Material purity Source
FeSO4.7H2O 99% Riedel-Dehaen
H2C2O4.2H2O 99.6% HW
KBrO3 99.8% Merck
KClO3 99% Fluka
KIO3 Prolapo
KMnO4 99% BDH
Methyl Orange 99% Fisher Chemical
NaBH4 99% Aldrich
(NH4)2 SO4.FeSO4.6H2O 99.5% BDH
TiO2 99.7% Aldrich

25
Sodium acetate 98% Riedel-Dehaen
Congo red 99.8% Fisher Chemical
Urea 99.5% Fluka
1,10-phenanthroline 97% BDH
2.1.2 Liquid Chemicals
Material purity Source
acetone 99% Analyt
Ethanol 97% Fluka
HNO3 69.5% Medex
H2O2 50% wt/wt Scharlau
H2SO4 98% Himedih
Iso-propoxide 99.8% Riedel-Dehaen
Ti-isopropoxide 97% Aldrich

26
2.2 Procedures
2.2.1 Preparation of N-doped TiO2 catalyst by sol gel method
1- Ten grams of urea was dissolved in 200 milliliter nano filtered deionized
water (NFDW) with stirring.
2- Ten milliliters of titanium isopropoxide was added dropwise at room
temperature, with rate of 2 milliliter/minutes, onto the above solution with
vigorous stirring, meanwhile, a few extra milliliters of isopropanol was
added.
3- The solution was stirred further for 2 hrs after completion of titanium
isopropoxide and isopropanol additions to achieve complete hydrolysis.
4- Solution was left for 20 hrs in dark for aging.
5- Solution was filtered by Buchner (solution was neglected), the
precipitation was dried at 60 °C for 2 hrs.
6- The solid filtrate was calcined for 4 hrs at 400 °C to remove organic part.
7- A yellow product of N-TiO2 appeared after calcination, which assigned
as 2.5% N-TiO2
Note: Two other N- doped TiO2 were prepared following similar procedure
that stated above. The only difference was addition of 20.8g and 30g urea to
200 milliliter NFDW in the first step, which assigned as 5% and 7% N-TiO2,
respectively.
2.2.2 Preparation of K3[Fe(C2O4)3]. 3H2O
1- Approximately 5g of Fe(NH4)2(SO4)2.6H2O was weighed in a 125
milliliter Erlenmeyer flask and dissolved in 20 milliliter hot NFDW and
finally 1 milliliter of 3M H2SO4 was added.
DMSO-D6 99.8% Apollo Scientific
27
2- 2.5g of oxalic acid (H2C2O4) was dissolved in 25 milliliter of NFDW,
afterwards, this solution was added to the above solution, mentioned in step
1, and heated to boiling while stirring constantly to prevent bumping.
3- The Erlenmeyer flask was removed from the heat source and allowed the
yellow precipitate of FeC2O4 to settle for 10 minutes.
4- The supernatant liquid was decanted (poured the liquid away from the
solid) and the precipitate was washed using 15 milliliter of hot NFDW. The
mixture was swirled and filtered.
5- Ten milliliters of hot NFDW that contains 3.5g of K2C2O4 was added to
the precipitate, then was stirred and heated to 40°C. While the temperature
was at 40°C, immediately, 8 milliliter of H2O2 was added dropwise and
stirred continuously. Periodically the temperature of the solution was
checked and made sure that it was at least 40°C (but not >50°C) during the
addition of H2O2. (Some brown Fe (OH)3 may precipitate at this time).
6- The resulting solution was heated to boiling. 20 milliliter of H2C2O4 was
added (prepared by dissolving 1g in 30 milliliter of NFDW). It was stirred
continuously and the last 10 milliliter of H2C2O4 was added dropwise,
while maintaining the temperature near boiling. The solution was turned
clear green.
7- Twenty milliliters of ethanol was added to solution of neglected
precipitate (when crystals were formed, it was dissolved by heating in water
bath).
8- The solution was left in dark about 24 hrs.
9- The solution was filtered under vacuum and washed with 10 milliliter of
1:1 ethanol / NFDW solution.
10- Finally, the precipitate was washed using 10 milliliter of acetone.

28
2.2.3 Measurement of light intensity using actinometrical method
The intensity measurement of the incident light was carried out with a
potassium ferrioxalate actinometer as described by Hatchard and Parker [94]
and examined extensively through a previous work in our laboratory [95].
This method is usually used to determine the number of quanta entering the
reaction vessel and consequently, the apparent quantum yields for the
photocatalytic reaction will be estimated. The actinometer solution (6×10⁻³
mol/L) was prepared by dissolving 2.947g of K3Fe(C2O4)3.3H2O in 800
milliliter of NFDW.
One hundred milliliter of 1N H2SO4 was added and the whole solution was
diluted to one liter with NFDW.
The method used for the determination of light intensity involves
irradiation of actinometer solution for known period time (1 hour).
A calibration curve for Fe+2 was drawn using the following solutions:
1- 4×10⁻⁴ mol.L-1 of FeSO4 in 0.1 N H2SO4.
2- 0.1% w/v phenanthroline monohydrate in water.
3- Buffer solution was prepared by mixing 600 milliliter of 1N sodium
acetate and 360 milliliter of 1N H2SO4 then diluted to one liter.
Different concentrations of Fe+2 solutions were prepared by further
dilution of solution (1) above in 25 milliliter volumetric flask. Then after,
the followings are added to each flask;
a- Two milliliter phenanthroline solution.
b- Five milliliter of buffer solution.
c- Different volumes of 0.1N H2SO4 solution were used to make equivalent
to 10 milliliter 0.1 N H2SO4 and finally dilute the whole solution to 25
milliliter with NFDW.

29
The volumetric flask was covered with aluminum foil and kept in the
dark for 30 minutes. Then the optical densities at wavelength of 510 nm
were measured.
A blank solution was used as reference which contained all the liquids
except the ferrous ion solution.
Plot the optical density versus ferrous ion concentration, Figure 2-1. The
slope of the straight line gives the extinction coefficient (absorptivity) of
FeSO4 solution.
In order to determine the light intensity, 100 milliliter of actinometer
solution was irradiated in the irradiation cell. Post illumination, one milliliter
of the irradiated solution was transferred into 25 milliliter volumetric flask,
two milliliter of phenanthroline solution and 0.5 milliliter of buffer solution
were added to the flask, and then it was diluted to 25 milliliter using NFDW.
A Blank solution was prepared by mixing one milliliter of unirradiated
potassium ferrioxalate solution with other components. The optical density
was measured.
The incident light intensity was calculated as follows:
Io= A × V1 × 10-3 × V3 / Qy × € × V2 × t
Where:
Io = photo flow (incident light intensity)
A= optical density (absorbance) at 510 nm
V1 = initial volume (50 milliliter)
V3 = final volume (25 milliliter)
Qy = quantum yield at 365 nm which equals to 1.21 [58]
€=extinction coefficient = slope of calibration curve (1.112×10⁴ L mol-1
cm-1 )
V2 = volume taken from irradiated solution (1 milliliter).

30
t = irradiation time in seconds
The apparent quantum yield is calculated using the following expression :
ɸapp = rate of reaction / rate of absorbed photons (Io)
Y2 – Y1 = 0.8 – 0.4 = 0.4
X2 – X1 = 18 – 9 = 9 ppm / 278000 = 0.00003237 mol/L
Slope = 0.4 / 0.00003237 = 1.235×10⁴ L mol-1 cm-1
2.2.4 Preparation of azo dyes solution
2.2.4.1 Preparation of methyl orange solution
1- A stock solution of methyl orange of 10 ppm was prepared by dissolving
0.01g of MO dye into 1 liter NFDW.
Figure 2-1: Calibration curve for Fe+2
Concentration, ppm
Abs
orba
nce

31
2- Different concentrations (2, 4, 6, and 8 ppm) of methyl orange were
prepared from stock solution by a series of dilution in order to prepare the
calibration curve.
3-The calibration curve was drawn by measuring absorbance at 465 nm for
all prepared methyl orange solutions mentioned previously in steps 1 and 2,
as shown in Figure 2-2.
2.2.4.2 Preparation of Congo red solution
1- A stock solution of Congo red of 15 ppm was prepared by dissolving
0.015g of CR dye into 1 liter NFDW.
2- Different concentrations (2, 4, 6, 8, 10, 12 ppm) of Congo red were
prepared from stock solution by a series of dilution in order to prepare the
calibration curve.
3- The calibration curve was drawn by measuring absorbance at 564 nm for
all prepared Congo red solutions mentioned previously in steps 1 and 2, as
shown in Figure 2-3.
Figure 2-2: Calibration curve for methyl orange
Abs
orba
nce
Concentration, ppm

32
2.2.5 Testing of degradation of azo dye under visible light
The effect of visible light on degradation of azo dye was studied as
follows;
1- 100 milliliter of azo dye (10 mg/L) aqueous solution was illuminated
using 500W halogen lamp (Philips) at high intensity with stirring for 4 hrs.
2- At every 60 minutes of irradiation time, samples of 4 milliliter was
withdrawn for analysis.
3- The disappearance of azo dye was monitored using the visible absorbance
feature at λ= 465 nm as function of irradiation time.
2.2.6 Testing of degradation of azo dye by H2O2 and visible light
1- 100 milliliter of aqueous solution of azo dye (10 mg/L) was mixed with 2
milliliter of H2O2.
2- The mixture was illuminated by 500W halogen lamp (Philips) at high
intensity with stirring for 4 hrs.
Figure 2-3: Calibration curve for Congo red
Concentration, ppm
Abs
orba
nce

33
3- Four milliliters were drawn every 60 minutes of irradiation time for
analysis.
4- Absorbance of azo dye was measured at 465 nm with the visible
spectrophotometer to detect the remained concentration of remaining of the
dye.
2.2.7 Testing of degradation of azo dye by H2O2 in dark
1- 100 milliliter of aqueous solution of azo dye (10 mg/L) was mixed with 2
milliliter of H2O2.
2- The mixture was stirred for 4 hrs.
3- 4 milliliters were drawn every 60 minutes of illumination time for
analysis.
4- Absorbance of azo dye was measured at 465 nm with visible
spectrophotometer to survey the remained concentration of methyl orange,
mono azo dye.
2.2.8 Testing of degradation of azo dye by visible light in presence of
N-TiO2
1- 100 milliliter of azo dye (10 mg/L) was taken and its pH was adjusted to
2.5 using diluted HNO3.
2- A mass of 50 mg of powder (7% N-TiO2) was contacted with 100
milliliter of azo dyes aqueous solution.
3- The water suspension of azo dye and nanosized N-TiO2 powder were
stirred in the dark for 20 min to ensure the adsorption equilibrium was
established prior to irradiation.
4- The sample was irradiated with a 500W halogen lamp (Philips) at high
intensity with stirring for 4 hrs.
5- About 4 milliliter was withdrawn after every 60 minute of irradiation
time.

34
6- The catalyst (N-TiO2) was separated from the suspension by centrifuge
for 10 minutes using 3000 RPM.
7- Absorbance of azo dye was measured to estimate the degradation percent.
2.2.9 Testing of degradation of azo dye by N doped-TiO2 in dark
1- 100 milliliter was taken and its pH was adjusted to 2.5 with diluted
HNO3.
2- A mass of 50 mg of powder (7% N-TiO2) was contacted with 100
milliliter of azo dye aqueous solution.
3- The water suspension of azo dye and nanosized N-TiO2 powder were
stirred in the dark for 4 hrs.
4- About 4 milliliter was withdrawn after every 60 minutes of stirring time.
5- The catalyst (N-TiO2) was separated from the suspension by centrifuge
for 10 minutes using 3000 RPM.
6- Absorbance of azo dye was measured to estimate the degradation percent.
2.2.10 Testing of degradation of azo dye by visible light in presence of
N-TiO2 and H2O2
1- 100 milliliter of azo dye (10 mg/L) was taken and 2 milliliter of H2O2 was
added.
2-The pH of above solution was adjusted to 2.5 with diluted HNO3, then 50
mg of the doped powder (7% N-TiO2) was added.
3- The solution in the dark was stirred for 20 min to ensure the adsorption
equilibrium which was established prior to irradiation.
4- The sample was Irradiated using a 500W halogen lamp (Philips) at high
intensity with stirring for 4 hrs.
5- About 4 milliliter was withdrawn after every 60 minutes of irradiation
time.

35
6- The catalyst (N-TiO2) was separated from the suspension by centrifuge
for 10 minutes using 3000 RPM.
7- The absorbance of azo dye was measured to estimate the degradation
percent.
2.2.11 Effect of added electron scavengers (O2, H2O2)
2.2.11.1 Effect of absence of scavengers on the degradation of azo dye
1- 100 milliliter of azo dye (10 mg/L) was taken and adjusted to pH of 2.5
using diluted HNO3
2- A mass of 50 mg of powder (7% N-TiO2) was contacted with 100
milliliter of azo dyes aqueous solution.
3- The water suspension of azo dye and nanosized N-TiO2 powder was
stirred in the dark for 20 min to ensure the adsorption equilibrium that was
established prior to irradiation.
4- The sample was irradiated using a 500W halogen lamp at high intensity
with stirring (Philips) for 4 hrs.
5- About 4 milliliter was withdrawn after every 60 minutes of irradiation
time.
6- The catalyst (N-TiO2) was separated from the suspension by centrifuge
for 10 minutes using 3000 RPM.
7- Absorbance of azo dye was measured to estimate the degradation percent.
2.2.11.2 Effect of H2O2 on the degradation of azo dyes
1- 100 milliliter of azo dye (10 mg/L) was mixed with different volumes 0.5,
1, 2, 3, 4 and 5 milliliter of H2O2 then adjusted to pH of 2.5.
Note: Each volume refers to stand alone experiment.
2- 50 mg of powder (2.5% N-TiO2) was added to above solutions.
3- The solution was stirred with O2 bubbling in the dark for 20 minutes to
ensure the adsorption equilibrium that was established prior to irradiation.

36
4- The sample was irradiated with a 500W halogen lamp (Philips) at high
intensity with stirring for 1 hr.
5- About 4 milliliter was withdrawn after every 15 minutes of irradiation
time.
6- The catalyst (N-TiO2) was separated from the suspension by
centrifugation for 10 minutes using 3000 RPM.
7- Absorbance of azo dye was measured to estimate the degradation percent.
2.2.11.3 Effect of O2 on the degradation of azo dye
1- 100 milliliter of azo dye (10 mg/L) was taken and adjusted to pH of 2.5
with diluted HNO3.
2- 50 mg of powder (7% N-TiO2) was added to above solution.
3- The solution was stirred with O2 bubbling (Note : the flow rate of O2 is 30
ml/min) in the dark for 20 minutes.
4- The sample was irradiated with a 500W halogen lamp (Philips) at high
intensity with stirring for 4 hrs.
5- About 4 milliliter was withdrawn after every 60 minutes of irradiation
time.
6- The catalyst (N-TiO2) was separated from the suspension by
centrifugation for 10 minutes using 3000 RPM.
7- Absorbance of azo dye was measured to estimate the degradation percent.
2.2.11.4 Effect of H2O2 and O2 on the degradation of azo dye
1- 100 milliliter of azo dye (10 mg/L) was taken and 2 milliliter of H2O2 was
added.
2-The pH of above solution was adjusted to 2.5 with diluted HNO3, then 50
mg of powder (7% N-TiO2) was added.
3- The solution was stirred with O2 bubbling in the dark for 20 minutes.

37
4- The sample was irradiated with a 500W halogen lamp (Philips) at high
intensity with stirring for 4 hrs.
5- About 4 milliliter was withdrawn after every 60 minutes of irradiation
time.
6- The catalyst (N-TiO2) was separated from the suspension by
centrifugation for 10 minutes using 3000 RPM.
7- Absorbance of azo dye was measured to estimate the degradation percent.
2.2.12 Effect of pH on the degradation of azo dye
1- 100 milliliter of azo dye (10 mg/L) was taken and 2 milliliter of H2O2 was
added.
2- The pH of above solution was changed as follows (1.0, 2.0, 2.5, 3.0, 4.0,
5.0, 7.0, 9.0) using diluted HNO3, then 50 mg of powder (7% N-TiO2) was
added.
3- The solution was stirred with O2 bubbling in the dark for 20 minutes.
4- The sample was irradiated with a 500W halogen lamp (Philips) at high
intensity with stirring for 4 hrs.
5- About 4 milliliter was withdrawn after every 60 minutes of irradiation
time.
6- The catalyst (N-TiO2) was separated from the suspension by
centrifugation for 10 minutes using 3000 RPM.
7- The absorbance of azo dye was measured to estimate the degradation
percent.
2.2.13 Effect of nitrogen content of N-TiO2 on the degradation of azo
dye
1- 100 milliliter of azo dye (10 mg/L) was mixed with 2 milliliter of H2O2
then adjusts pH to 2.5.
2- 50 mg of powder (N-TiO2) was added to above solution.

38
a- 2.5% N-TiO2
b- 5% N-TiO2
c- 7% N-TiO2
Note: Every single N-TiO2 powder refers to separate experiment.
3- The solution was stirred with O2 bubbling in the dark for 20 minutes to
ensure the adsorption equilibrium which was established prior to irradiation.
4- The sample was irradiated with a 500W halogen lamp (Philips) at high
intensity with stirring for 1 hr.
5- About 4 milliliter was withdrawn after every 15 minutes of irradiation
time.
6- The catalyst (N-TiO2) was separated from the suspension by centrifuge
for 10 minutes using 3000 RPM.
7- The absorbance of azo dye was measured to estimate the degradation
percent.
2.2.14 Effect of initial azo dye concentration on the rate of reaction
1- 100 milliliter of various initial concentrations of azo dye ( 5, 10, 15, 20,
25, 30) ppm were taken and 2 milliliter of H2O2 was added to each
concentration then adjust pH to 2.5.
2- 50 mg of 2.5% N-TiO2 powder was added to above solution.
3- The solution was stirred with O2 bubbling in the dark for 20 minutes to
ensure the adsorption equilibrium which was established prior to irradiation.
4- The sample was irradiated with a 500W halogen lamp (Philips) at high
intensity with stirring for 1hr.
5- About 4 milliliter was withdrawn after every 15 minutes of irradiation
time.
6- The catalyst (N-TiO2) was separated from the suspension by centrifuge
for 10 minutes using 3000 RPM.

39
7- The absorbance of azo dye was measured to estimate the degradation
percent.
2.2.15 Effect of N-TiO2 loading on the degradation of azo dye
1- 100 milliliter of azo dye (10 mg/L) was mixed in case of MO and (15
mg/L) in case of CR with 2 milliliter of H2O2 then adjusted to pH of 2.5.
2- 50 mg of 2.5% N-TiO2 powder was added to above solution.
3- The solution was stirred with O2 bubbling in the dark for 20 minutes to
ensure the adsorption equilibrium that was established prior to irradiation.
4- The sample was irradiated with a 500W halogen lamp (Philips) at high
intensity with stirring for 1 hr.
5- About 4 milliliter was withdrawn after every 15 minutes of irradiation
time for analysis.
6- The catalyst (N-TiO2) was separated from the suspension by centrifuge
for 10 minutes using 3000 RPM.
7- The absorbance of azo dye was measured to estimate the degradation
percent.
Note: all the operational conditions were fixed and replaced 50 mg N-TiO2
by (20, 40, 60, 80, 100) mg of 2.5% N-TiO2.
2.2.16 Effect of light intensity on the degradation of azo dye
1- 100 milliliter of azo dye (10 mg/L) was mixed with 2 milliliter of H2O2
then adjusts pH to 2.5.
2- 50 mg of 2.5% N-TiO2 powder was added to above solution.
3- The solution was stirred with O2 bubbling in the dark for 20 minutes to
ensure the adsorption equilibrium which was established prior to irradiation.
4- The sample was irradiated with a 500W halogen lamp (Philips) at high
intensity with stirring for 1 hr.

40
5- About 4 milliliter was withdrawn after every 15 minutes of irradiation
time.
6- The catalyst (N-TiO2) was separated from the suspension by
centrifugation for 10 minutes using 3000 RPM.
7- The absorbance of azo dye was measured to estimate the degradation
percent.
2.2.17 Effect of UV light on the degradation of azo dye
1- 100 milliliter of azo dye (10ppm) was taken and 2 milliliter H2O2 was
added, then adjusted to pH=2.5 using dilute HNO3.
2- 50 mg of 2.5% N-TiO2 nano powder was added to the cell.
3- The solution was stirred with O2 bubbling in the dark for 20 minutes to
ensure the adsorption equilibrium that was established prior to irradiation.
4- The solution was irradiated by ultraviolet light for 1 hr at 14 cm cell-light
source distance in the presence of O2.
5- At one hour intervals, 4 milliliter of irradiated azo dye was taken;
centrifuge for 10 minutes at 3000 RPM, then the absorbance was measured.
2.2.18 Effect of diluted H2O2 on the degradation of azo dye
1- 100 milliliter of azo dye was taken (10ppm) and add:
a- 1 milliliter of (0.0135N) H2O2
b- 2 milliliter of (0.0135N) H2O2
c- 3 milliliter of (0.0135N) H2O2
d- 4 milliliter of (0.0135N) H2O2
e- 5 milliliter of (0.0135N) H2O2
2- pH was adjusted to 2.5 using dilute HNO3.
3- 50 mg of 2.5% N-TiO2 powder was added to the cell.
4- The solution was stirred with O2 bubbling in the dark for 20 minutes to
ensure the adsorption equilibrium which was established prior to irradiation.

41
5- The sample was irradiated with a 500W halogen lamp (Philips) at high
intensity with stirring for 1 hr.
6- About 4 milliliter was withdrawn after every 15 minutes of irradiation
time for analysis.
7- The catalyst (N-TiO2) was separated from the suspension by
centrifugation for 10 minutes using 3000 RPM.
8- The absorbance of azo dye was measured to estimate the degradation
percent.
2.2.19 Effect of some oxidants on the degradation of azo dye
1- 100 milliliter of azo dye (10ppm) was taken and 4 milliliter of 0.3 M of
the oxidants ( H2O2, KClO3, KBrO3 and KIO3) was added.
Note: each type of oxidant has been employed in a separate experiment.
2- The pH was adjusted to 2.5 using dilute HNO3.
3- 50 mg of 2.5% N-TiO2 powder was added to the cell.
4- The solution was stirred with O2 bubbling in the dark for 20 minutes to
ensure the adsorption equilibrium that was established prior to irradiation.
5- Sample was irradiated with a 500W halogen lamp (Philips) at high
intensity with stirring for 1 hr.
6- About 4 milliliter was withdrawn after every 15 minutes of irradiation
time.
7- The catalyst (N-TiO2) was separated from the suspension by centrifuge
for 10 minutes using 3000 RPM.
8- The absorbance of azo dye was measured to estimate the degradation
percent.
2.2.20 Determination of H2O2 concentration [96]
1- At first, a burette was rinsed with few milliliters of permanganate
solution.
42
2- Burette was filled with (0.1N) permanganate solution.
3- 5 milliliter of fresh H2O2 was transferred to volumetric flask (250
milliliter volume) and the flask was filled with NFDW to the mark.
4- 20 milliliter of (2N) H2SO4 was added to Erlenmeyer flask, then 10
milliliter of H2O2 was added to the flask
5- The titration was conducted by adding potassium permanganate solution
from a 50 milliliter glass burette until the first appearance of a faint pink
color that persists for 30 seconds.
6- The volume was recorded and computed according to the following
expression;
(N X V)KMnO4 = (N X V)H2O2
2.2.21 Influence of solar irradiation
1- 2 milliliter of H2O2 was added to 100 milliliter of (10 ppm) dye solution.
2- The pH was adjusted to 2.5 using dilute HNO3.
3- 50 mg of N-TiO2 nanoparticles was added to the solution.
a- 2.5% N-TiO2
b- 5% N-TiO2
c- 7% N-TiO2
Note: (each type is used in a separate experiment).
4- The solution was stirred upon reaching equilibrium (20 minutes in dark).
5- It was irradiated by direct sun light.
(N X V)KMnO4
NH2O2 =VH2O2

43
6- At given irradiation time intervals, samples of 4 milliliter of the
suspension were withdrawn and filtered post centrifugation for 10 minutes
using 3000 RPM to remove the catalyst.
7- The dye concentration was determined by measuring its absorbance using
a UV-VIS spectrophotometer.
Note: The sunlight experiments were carried out at 11: 15 am during August
(summer season) in Baghdad city.
2.2.22 General experimental procedure at optimized conditions
Photodegradation experiments were conducted in a photoreactor
(Image 2-1). This small-scale system consisted of a cylindrical Pyrex-glass
cell with 150 milliliter capacity. A 500 W halogen lamp has been used as
illumination source. The photocatalytic decomposition of methyl orange dye
was investigated under optimum conditions: pH = 2.5, catalyst loading 50
mg and 2 ml of H2O2. The pH was adjusted using diluted HNO3. For Congo
Red degradation the optimum conditions was pH = 2.5, catalyst amount= 40
mg and 2 milliliter of H2O2. The suspension was first stirred in the dark to
reach the equilibrium adsorption. All the experiments were carried out in the
presence of O2 as a scavenger for ecb-. During irradiation period, samples of
4-5 milliliter were collected at regular times, centrifuged and filtered. The
discolouration was monitored spectrophotometrically by measuring the
absorbance at λmax. In most of the experiments, the photocatalytic process
was continued until complete mineralization of the compound was achieved.

44
2.3 Instruments2.3.1 Refrigerated circulating bath. Model (WCR-P12), wisecircu.
2.3.2 Nanofiltered-deionized water supply unit. Model (Sm-11),
waterpia.
2.3.3 Centrifuge (K centrifuge PLC series.).
2.3.4 Muffle furnace (SX-5-12).
2.3.5 Drying cabinet (K Hot Air Sterilizer).
2.3.6 Apel PD-303 single beam spectrophotometer has been used forvisible light absorption measurements.
2.3.7 Fourier Transform Infrared (FTIR) spectrometer (IR Prestige-21
Shimadzu).
2.3.8 Double beam Shimadzu UV-VIS spectrophotometer. Model (1650
PC) has also been used throughout this work.
2.3.9 Photoreaction systemThe Photoreaction configuration shown in Image (2-1), was locally
made. It consists of halogen lamp 500W (Philips) which is vertically fixed
Image (2-1): Photolysisunit

45
into stainless steel hollow cylinder of 10 cm in diameter and 27 cm in height.
The heating effect emerged by the lamp was minimized by circulating water
in the hollow cylinder through outlet and inlet slots in cylinder using
circulating thermostat water bath, type Wirecircu. The internal walls of the
cylinder were covered with aluminum foil to avoid radiation losses and
temperature rising. Lens is used for light collection and focusing. The
solutions/suspensions of azo dye and other materials (N-TiO2, H2O2….etc)
according to experiment were magnetically stirred. Typical irradiation done
in cell (it is made of a pyrex cylindrical flask containing cover with
provision for gas inlet and outlet and to withdraw samples at specific time
intervals), which proved to supply enough oxygen for oxidative
photodegradation (the flow rate of O2 is 30 mL /min) with continuous
stirring using a hot plate-stirrer to keep the catalyst aqueous suspension in
homogeneous form during the experiments. The concentration of azo dye
was determined from its visible absorbance characteristic and calibration
curve method at the wavelength of maximum absorption. A single beam,
Apel PD- 303 visible spectrophotometer was used through out the work.
2.3.10 X-ray Spectrometer
The X-ray diffraction (XRD) patterns were obtained on a Philips X-pert
3040/60 XRD machine using a Cu target Ka radiation (λ= 1.541A )̊ to
determine the crystalline size. The accelerating voltage and the applied
current were 40 kV and 30 mA, respectively. The XRD patterns was at the
scanning range 2θ from 20 o to 60 o.
2.3.11 Scanning Electron Microscopy (SEM)
The Phenom™ SEM was used to characterize the morphological and
structural properties of the samples. Nearly 1 mg of a sample was mounted

46
on a SEM sample holder and was sputtered with gold prior to analysis for
better conductivity and resolution of the sample.
2.3.12 Photoluminescence (PL)
The PL spectra of the samples were measured at room temperature
using a Horiba Fluoromax-4 spectrophotometer. The spectrophotometer has
a 450W xenon lamp as the excitation light source (λ= 340 nm).
Photoluminescence (PL) spectroscopy can provide information regarding the
energy levels of different aqueous and suspended specimen.
2.3.13 Diffused Reflectance UV-VIS Spectrometer
The band gap energies of the products were determined by diffuse
reflectance spectra of the samples measured using an UV–VIS
spectrophotometer (Shimadzu UV-3600). The UV–VIS absorbance spectra
were obtained for the dry pressed disk samples equipped with an integrating
sphere assembly, using BaSO4 as reflectance reference sample.
2.3.14 Brunauer Emmett Teller (BET)
Surface area and pore distribution of the samples were determined using
nitrogen adsorption/desorption isotherm. Analysis was carried out on dried
degassed samples using a Micromeritecs gemini surface area analyser with
nitrogen as the adsorbate, and liquid nitrogen as the sample coolant (to
ensure temperature stability).
2.3.15 Nuclear magnetic resonance (NMR)Bruker ultrashield 400 plus.
2.3.16 Raman Spectrometer
Renishaw ramanscope 1000.
2.3.17 High-Performance Liquid Chromatography (HPLC)
HPLC analysis was carried out at 21.6 Co by using Dionex-UltiMate
3000 equipped with dual wavelength UV-Vis detector and C18 column

47
symmetry, (4.6 x 150 mm). A sample (10 µL) was injected and dye products
were allowed to separate for 29 min at flow rate 1 ml/min. Mobile phase
used was methanol/H2O. The UV-VIS detector was set at 280 and 254 nm
for the study of methyl orange and Congo red, respectively.
2.3.18 Gas Chromatography–Mass Spectrometry (GC-MS)
GC-MS analysis was carried out using a Thermo Trace 1300, equipped
with an intergrated gas chromotograph having a column (RXi®-5ms).
Helium was used as a carrier gas at the flow rate of 1.5 mL/min. The injector
temperature was maintained at 30 oC.
2.3.19 Time of Flight Secondary Ion Mass Spectrometry (TOF- SIMS)Analysis was conducted using a Ga+ ion beam, which was optimized to
ensure maximum mass resolution. To ensure no fragmentation, a low current
pulsed beam was used in measurements (<1013 ions/cm2), which is known
not to degrade polymer samples during measurements.
2.3.20 Energy Dispersive X-ray Spectrometer (EDXS)
(X Flash 6110) Bruker EDX coupled with (Inspect SS0) SEM (physics
dept. / College of science / AL-Nahrain University) has been exploited for
the sample content of the doped TiO2.
2.3.21 Photolysis unit of UV source
The photolysis unit is laboratory-built (local market) system consisting
of ultraviolet light source (125 W) medium pressure mercury lamp (MPML)
fitted with a focusing lens to assure parallel beam of light.

48
3. Results and Discussion3.1 Spectroscopic perspectives of azo group containing dyes
Methyl Orange (C14H14N3SO3Na), mono azo dye was chosen as a
simple model of a series of common azo-dyes largely used in the industry.
This compound, which is a well known acid-base indicator, is orange in
basic medium and red in acidic medium. Its structure, shown in Figure 1-3 is
characterized by a sulfonate group, which is responsible for the high
solubility of these dyes in water. When dissolved in distilled water, the UV–
visible spectrum of methyl orange showed two absorption maxima [97]. The
first band observed at wavelength of 271 nm and the second band with
higher intensity, at wavelength of 465 nm as presented in Figure 3-1. The
latter band was used to monitor the photocatalytic degradation of methyl
orange. The molar extinction coefficient (absorptivity, ᶓ) of 10 ppm of
methyl orange in NFDW was measured at the maximum absorption
wavelength, 465 nm, using Beer-lambert equation (A= ᶓbc), where A=
absorbance, b = absorption light path, 1 cm and c = molar concentration of
methyl orange. The absorptivity (ᶓ) has been 2.206 x 10+4 mol-1.L.cm-1 for
molar concentration of 3.055 x10⁻⁵ mole/L.
Upon variation of solution pH towards lower values (protonation), with
increasing the pH of solution, there exists a tautomeric equilibrium (Figure
3-2), between the ammonium form (red form) and azonium, form (yellow
form) emerges that consequently lead to increase in the absorbed wavelength
due to the red shift [98] . Figure 3-3 shows the standard UV-VIS scan for
methyl orange at different pH.

49
NCH3
CH3
NN SO3Na
- +H
+
NSO3Na
- +H
NNCH3
CH3
+
Figure 3-2: Protonation and tautomeric equilibrium of methyl orange moleculein acidic solution
Figure 3-1: UV-VIS spectrum for methyl orange
Wavelength, nm
Abs
orba
nce
465
271

50
This corresponds largely with behavior of congo red
(C32H22N6Na2O6S2), Figure 1-3, the highly water-soluble diazo dye which
has a molar extinction coefficient equals to 1.979 x 10+4 mol-1.L.cm-1 for
molar concentration of 1.435 x 10⁻⁵ mole/L. congo red has a strong affinity
to cellulose fibers and thus is employed in textile industries and used as an
indicator of pH too [99] . Up on comparison of the UV-Vis absorption
spectra for congo red at its natural pH, Figure 3-4, with the absorption
spectra of congo red in aqueous solution at different pH’s, Figure 3-5, the
results exhibits that congo red posses important spectrophotometric
properties where there is intense peak around 498 nm which is shifted to 564
nm due to the two tautomeric equilibrium forms of the protonated congo red
molecule (in acidic medium), an ammonium form with the proton attached
to the amino nitrogen and an azonium form, where the proton is added to
the azo nitrogen, Figure 3-6 [100].
Wavelength, nm
Abs
orba
nce
Figure 3-3: Standard scan of Methyl Orange at different pH values

51
Figure 3-5: Standard scan of Congo Red at different pH values
Wavelength, nm
Abs
orba
nce
Wavelength, nm
Abs
orba
nce
Figure 3-4: UV-VIS spectrum for Congo Red
498
342238

52
3.2 Characterization of the synthesized anatase N-TiO2 nanoparticles3.2.1Characterization of morphological and structural properties of N-TiO2 samples
Scanning electron microscope (SEM) images of undoped TiO2 particles
(anatase) revealed very smooth and homogeneous surfaces formed by very
fine aggregated particles, image (A) in Figure (3-7). Whereas the N-TiO2
particles showed slightly more compacted surface structures. Morphologies
of synthesised catalysts were strongly dependent on the percent of nitrogen
dopant [101-102]. In addition, the surface of the N- doped samples become a
little coarser in comparison with the undoped sample, which might be due to
the fact that N element was incorporated into TiO2 lattice and led to
the lattice collapse partially which is in good agreement with other reported
data [103]. The surface morphology of 2.5% N-TiO2 is characterized by
N NN N
NH2
SO3Na
NH2
SO3Na- + - +
H H
+ +
- + - +
H H
N N N
NH2
SO3Na
N
NH2
SO3Na
+ +
Figure 3-6: Protonation and tautomeric equilibrium of congo red molecule in acidic solution

53
SEM, and shown in Figure 3-7, image (B). The highly ordered TiO2
nanoparticles show that the ordered structure can sustain the impact of
doping process. It also can be observed that the surface of the nanoparticles
has uniform interior channels arranged parallel to each other and
perpendicular to the outer surface are seen in whole material. These open
ended ordered channels provide routes for light transfer and higher surface
area for better adsorption, while image (C) in Figure 3-7 shows less
regularly channels with holes on the surface of 5% N-TiO2. It can be seen
that there are damage of the channels and many holes or caves for 7% N-
TiO2, image (D), which mainly resulted from the increase of doping percent.
These differences in the morphology of N-TiO2 samples is reflected most
clearly in the three-dimensional images in Figure 3-8.

54
DC
A B
Figure 3-7: SEM images for the (A) anatase TiO2; (B) 2.5% N-TiO2 ; (C) 5% N-TiO2; (D) 7% N-TiO2

55
3.2.2 Optical properties
3.2.2.1 UV–VIS diffused reflectance spectra of N-TiO2
The UV–VIS diffuse reflectance spectra (DRS) were employed to
determine the effects of N doping on the light absorption of N-TiO2
samples. Figure 3-9 shows the UV–VIS DRS spectra of the N doped TiO2
(A) (B)
(C)
Figure 3-8: Three dimensional SEM images for the (A) 2.5% N-TiO2; (B)5% N-TiO2; (C) 7% N-TiO2

56
and the undoped TiO2 samples. As shown, the undoped TiO2 sample depicts
absorption feature in the UV region due to the inter band electronic
transitions. In comparison with undoped TiO2, all of N doped samples show
light absorption band and have apparent absorption in the visible region. It is
observed that with increasing nitrogen content, the band gap was narrowed.
This narrowed band gap will facilitate excitation of electrons from the
valence band to the conduction band in the doped oxide semiconductor
under visible light illumination, which can result in higher photocatalytic
activities [104]. The reduction in the band gap energy of the N-doped TiO2
sample was determined by the following equation [105]
Eg = hν= h c/ λ
Eg = 6.6 x 10⁻³⁴ J.s x 3 x 10⁸ m.s-1/ λ (nm)
Eg = 1239.8 / λ
where Eg is the band gap (eV), h is Planck's constant, c is speed of light
and λ is the wavelength (nm) of the absorption edge in the spectrum. The
results show a clear red shift in the light absorption threshold from UV
region (380) to visible region (415 nm) for 2.5% N-TiO2.

57
3.2.3 Photoluminescence spectra
Photoluminescence (PL) emission spectra have been widely used to
investigate the recombination rate of electrons and holes [106]. To study the
effect of dopants on the separation efficiency of photoinduced charges, PL
spectra of as-prepared samples were investigated. Figure 3-10 illustrates PL
spectra of TiO2 nano powders doped with different amounts of N using the
excitation wavelength of 340 nm. All the samples exhibit similar curve
shape of PL spectra at the wavelength range from 350 to 600 nm. In
general, a lower PL intensity suggests an enhanced separation and transfer of
photogenerated electrons trapped in TiO2 [103]. PL intensity obtained on
2.5% N-doped TiO2 is lower than that on 5% and 7% N-TiO2, indicating that
N doping markedly enhances the charge separation of photogenerated
200 300 400 500 600 700 800-0.2
0.0
0.2
0.4
0.6
0.8
1.0
1.2
1.4
1.6Ab
s.
Wavelength nm
BCDEF
Wavelength, nm
Abs
orba
nce
Figure 3-9: UV–vis diffused reflectance spectra of (B) undoped TiO2 and(C) 2.5% N-dopedTiO2; (D) 5% N-dopedTiO2; (E) N-dopedTiO2; (F) 7%
N-dopedTiO2
415380

58
carriers of TiO2. This phenomenon can be interpreted as the result of an
appropriate content of N introbucing into the lattice of TiO2, which formed
the electron trap as mentioned in the work of Xiaoqi et al [107]. Such a
structure enhanced the transfer of the energy from the matrix to the
luminescence centers. The band seen around 395 nm could be assigned to
the band edge emission of TiO2 samples. The PL broad band ranging from
440 nm to 480 nm is attributed to oxygen vacancies on the surface of the
N-TiO2 while the peaks locating at 580 nm could be assigned to defect
emission [103, 108].
3.2.4 Phase , composition features and particle size of N-TiO2
Due to strong scattering properties of TiO2, Raman analysis gives
special spectrum of vibrational bands in which they can diagnose the
Figure 3-10: PL spectra of (a) 2.5%N-TiO2, excitation (b) 5% N-TiO2, (c)7% N-TiO2 (Xenon lamp as source of λexc.= 340 nm
Wavelength (nm)
Inte
nsity

59
component phase of TiO2 [109]. Figure 3-11 shows the vibrational bands of
naked and N-dpoed TiO2 at 400 cm-1, 520 cm-1 and 640 cm-1 corresponding
to Raman modes of B1g, (A1g + B1g ) and Eg, respectively, which are
characteristic of anatase phase of TiO2 [55, 70]. The correspondence
between the spectrum of anatase TiO2 and doped samples confirms that there
is not any rutile phase in our samples.
To find out Mueller Indices of prepared samples and for comparison
with standard sample (anatase TiO2), X-ray diffraction is considered useful
characterized tool for this purpose [78]. Spectrum of The XRD of TiO2 and
N-TiO2 samples are shown in Figures 3-12, 3-13,3-14 and 3-15 respectively.
As expected, the comparison with naked anatase TiO2, did not exhibit any
new XRD peak of N-TiO2, indicating that no new phase emerged. The XRD
peak at 2θ =25.4o (101) is often taken as the characteristic peak of anatase
crystal phase. The average crystallite sizes for the doped samples were
estimated using the Scherrer equation [110];
Particle Size = B x λ / F x cosθ 3.1
where λ is the Cu Kα (0.1541 nm) radiation wavelength, F is the full
width at half maximum (FWHM) of the (1 0 1) peak, θ is the half angle of
the diffraction peak on the 2Theta scale [109] and B is the shape factor of
the particle whose value is computed as follows[111];
3.2
The crystallite size of all samples was shown in Table 3-1.
= 2 = 2 . . = 0.94
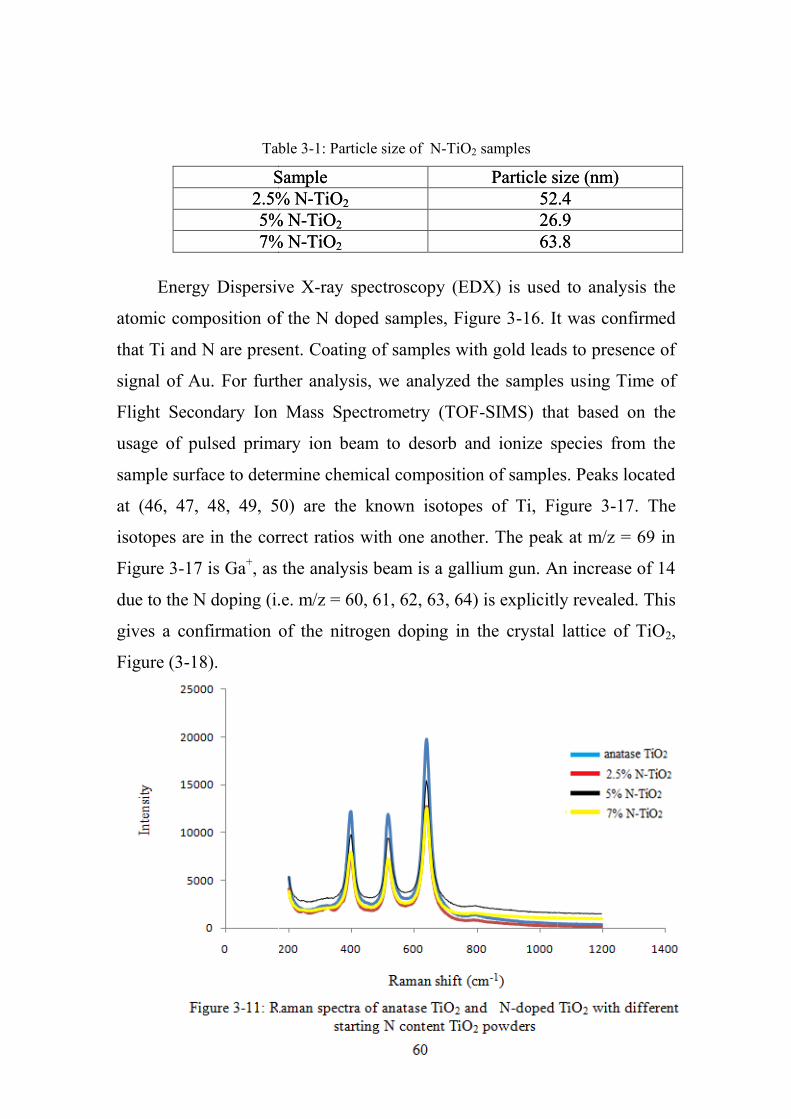
60
Table 3-1: Particle size of N-TiO2 samples
Particle size (nm)Sample52.42.5% N-TiO226.95% N-TiO263.87% N-TiO2
Energy Dispersive X-ray spectroscopy (EDX) is used to analysis the
atomic composition of the N doped samples, Figure 3-16. It was confirmed
that Ti and N are present. Coating of samples with gold leads to presence of
signal of Au. For further analysis, we analyzed the samples using Time of
Flight Secondary Ion Mass Spectrometry (TOF-SIMS) that based on the
usage of pulsed primary ion beam to desorb and ionize species from the
sample surface to determine chemical composition of samples. Peaks located
at (46, 47, 48, 49, 50) are the known isotopes of Ti, Figure 3-17. The
isotopes are in the correct ratios with one another. The peak at m/z = 69 in
Figure 3-17 is Ga+, as the analysis beam is a gallium gun. An increase of 14
due to the N doping (i.e. m/z = 60, 61, 62, 63, 64) is explicitly revealed. This
gives a confirmation of the nitrogen doping in the crystal lattice of TiO2,
Figure (3-18).

61
504030
2 oTheta
Inte
nsity
0
400
1000
2000
Figure 3-13: XRD pattern for prepared 2.5 % N-TiO2
Figure 3-12: XRD pattern for anatase TiO2
504030
0
400
1000
2000
6400
2 oTheta
Inte
nsity

62
Figure 3-14: XRD pattern for prepared 5 % N-TiO2
Figure 3-15: XRD pattern for prepared 7 % N-TiO2

63
Figure 3-18: TOF-MS of 2.5% N-TiO2
m/z
Inte
nsity
Figure 3-17: TOF-MS of undoped TiO2
Inte
nsity
m/z
Inte
nsity
Figure 3-16: EDX analysis of 2.5% N-TiO2

64
3.2.5 surface area analysis of N-doped TiO2
The surface area of the prepared N-TiO2 specimen has been determined
based on the Brunauer, Emmett and Teller (BET) theory. The analysis
scheme relies on using adsorption of molecular nitrogen gas on the surface
of TiO2. A Kaolinite calibration standard was used to calibrate the machine
while the Micromeritecs Stardriver software was used to calculate surface
area, through computing the volume of nitrogen adsorbed at different partial
pressures. The BET surface area was increased from 41.824 to 48.412 m2/g
when increasing the nitrogen content from 0.0% to 2.5%. However, BET
surface area decreased from 48.412 to 28.816 m2/g and to 15.187 m2/g for
samples of 5% and 7% N-TiO2, respectively. The pore diameter of the
mesoporous N-TiO2 structure was determined from the BET isotherms to be
9.966 nm compared with 6.248 nm of bare anatase TiO2. This indicates that
the surface is still of mesoporus nature. 5% and 7% of N-TiO2 pore sizes are
not known which is attributed to the machine is old and can not detect the
small pore size. Some authors have reported that using of large amounts of
nitrogen leads to blockage of TiO2 pores and reduce the surface area [112-
113]. Figure 3-19 shows the pore size, which verifies the mesoporosity of
the prepared nano N-doped TiO2 nanoparticles.

65
3.3 Control experiments
Control experiments were carried out to verify that the color removal
of the dye was truly photocatalytic and not just due to photolysis and/or
ordinary adsorption. The photolysis experiments, in the absence of N-TiO2
photocatalyst at room temperature for 240 minutes and the pH of the dye
around 2.5. revealed that the self-degradation of MO was almost negligible
under visible illumination and this clearly showed that homogeneous
photochemical processes did not occur under the on going experimental
conditions. On the other hand, the reaction of dye with peroxide in the
presence of irradiation showed the signifigant role of hydrogen peroxide
where the degradation percent was 34.6%. Under similar experimental
conditions but in the dark, there is no change in the concentration of the dye
with time, indicating that the observed changes are due to a photo-induced
process. The percent was convergent when dye was mixed with catalyst
Figure 3-19: Pore size distribution graphs for the N-TiO2 sample
0
0.0001
0.0002
0.0003
0.0004
0.0005
0.0006
0.0007
0.0008
0.0009
0 10 20 30 40 50 60 70
Pore
dist
ribut
ion
(dV/
dD)c
m3 /
g/nm
Mean pore diameter (nm)
Sample 3

66
under irradiation at acidic pH = 2.5. The color removal of MO pollutant was
almost complete in 60 min under halogen lamp illumination and at optimum
conditions pH = 2.5, 50 mg N-TiO2 and 2 milliliter of hydrogen peroxide.
The last experiment in the absence of irradiation and presence of catalyst
at pH = 2.5 illustrated little adsorption of the dye onto N-TiO2. This might
be interpreted by the relative easiness of subsequent desorption due to
adsorption-desorption equilibrium and migration of the substrate molecules
from adsorption sites to the photoactive sites [114]. However, To assess the
efficiency of photocatalytic reaction the extent of adsorption is very
important [115]. As a result, the oxidation of the dye molecules could be
only effective when the catalyst, light and hydrogen peroxide exist at
optimum pH. Figure 3-20 and Table 3-2 display photodegradation
experiments for the control tests listed below;
a = MO (10 ppm) +Vis light + duration 4h + pH=2.5
b = MO (10 ppm) +2 milliliter (0.675 N) H2O2 + duration 4hrs in dark +
pH=2.5
(absence of light)
c = MO (10 ppm) + 2 milliliter (0.675 N) H2O2 + Vis light + duration 4hrs +
pH= 2.5
d = MO (10 ppm) +50 mg N-TiO2 + 2 milliliter (0.675 N) H2O2 + pH =
2.5 + duration 4hrs (absence of light)
e = MO (10 ppm) + 50 mg N-TiO2 + Vis light + pH =2.5 + duration 4hrs
f = MO (10 ppm) + 50 mg N-TiO2 + pH=2.5 + duration 4hrs in dark

67
3.4 Experimental optimization of photocatalysis parameters
3.4.1 Influence of initial pH on the degradation
The solution’s initial pH value can directly affect the nature of the
charge carried by the catalyst surface and the adsorption behavior of the
pollutant on the catalyst surface. In addition, the initial solution pH also
fedca+bTime/ min.
000000
2.688.2582.78.2060
5.892297.520.50120
8.3127.698.929.10180
9.383098.934.60240
Table 3-2: Degradation percent of methyl orange for each control experiments
Figure 3-20: Degradation percent of methyl orange for control experiments
0
20
40
60
80
100
120
0 50 100 150 200 250 300
a+b
c
d
e
f
Deg
rada
tion
%
Time, min.

68
further affects the aggregation of the semiconductor catalyst in the solution
[86,116]. The isoelectric point of N-doped TiO2 particle is 6.25 [86] and
accordingly, the following equations, 3.3 and 3.4, may occur on the surface
of N-doped TiO2 at different pH values:
TiOH + H+ → TiOH2+ 3.3
TiOH + OH−→ TiO−+ H2O 3.4
According to above reactions, TiO2 is carrying positive charge in acidic
medium and negative charge in basic medium [62, 27, 56]. The presence of
sulfonate groups that carry negative charge in methyl orange and Congo red
in addition to their high electronic density because of conjugated system
between π electrons in aromatic rings, it make the dyes behave as ligand that
strongly attack on TiO2 which has empty d orbital that is capable of
receiving of electrons from azo dyes [18]. NMR spectrum assured this
reason. The 1H NMR spectrum of the Congo red salt, Figure 3-21, shows a
signal at 7.75 ppm which is attributed to the amino group. When Congo red
present in acidic medium, this signal disappears [100]. For methyl orange,
Figure 3-22, the shifting of signals towards left of spectrum illustrate the
impact of acidic hydrogen which consequently suggests that the dyes are
protonated in acidic medium according to the pathways shown in Figures 3-
23 and 3-24 for CR and MO, respectively [98, 117].
Both dyes showed better degradation results at lower pH where the rate
constant of methyl orange was 0.039 min-1 at pH 2.5 while it was 0.021 min-1
for Congo red at the same pH value (Figure 3-25 and 3-26).

69
Figure 3-21: 1H-NMR spectra of congo red, red signals for standard congo red andblue signals for congo red in acidic medium using DMSO_d6 solvent
0.00.51.01.52.02.53.03.54.04.55.05.56.0f1 (ppm)
-500
0
500
1000
1500
2000
2500
3000
3500
4000
4500
5000
5500
6000
6500

70
Figure 3-22: 1H-NMR spectra of methyl orange, red signals for standard methyl orangeand blue signals for methyl orange in acidic medium using DMSO_d6 solvent

71
N NN N
NH2NH2
SO3SO3
- -
H+
N NN N
SO3SO3
NH3+
- -
NH3+
- -
H H
N N N
NH2
SO3
N
NH2
SO3
+ +
- -
H H
N NN
SO3
NH2
N
NH2
SO3
+ +
Figure 3-23: Protonation of congo red
2 H+

72
NCH3
CH3
NN SO3
-
+ H+
NCH3
CH3
NN SO3
-H
NSO3
-H
NNCH3
CH3
+
NCH3
CH3
NN SO3
-H
+
Figure 3-24: Protonation of methyl orange
+

73
.
Figure 3-25: Effect of initial solution pH on the rate of phocatalysis of MO
0
0.01
0.02
0.03
0.04
0.05
k, m
in-1
1 2 2.5 3 4 5 7 9
Initial pH
pHk, min-1
90.00170.00250.00840.01330.023
2.50.03920.0310.026
0
0.005
0.01
0.015
0.02
0.025
2.5
Initial pH
k, m
in-1
Figure 3-26: Effect of initial solution pH on the rate ofphocatalysis of CR
pHk, min-1
2.50.02130.016
40.00750.005
70.002
90.002
73
.
Figure 3-25: Effect of initial solution pH on the rate of phocatalysis of MO
0
0.01
0.02
0.03
0.04
0.05
k, m
in-1
1 2 2.5 3 4 5 7 9
Initial pH
pHk, min-1
90.00170.00250.00840.01330.023
2.50.03920.0310.026
2.5 3 4 5 7 9Initial pH
k, m
in-1
Figure 3-26: Effect of initial solution pH on the rate ofphocatalysis of CR
pHk, min-1
2.50.02130.016
40.00750.005
70.002
90.002
73
.
Figure 3-25: Effect of initial solution pH on the rate of phocatalysis of MO
0
0.01
0.02
0.03
0.04
0.05
k, m
in-1
1 2 2.5 3 4 5 7 9
Initial pH
pHk, min-1
90.00170.00250.00840.01330.023
2.50.03920.0310.026
Initial pH
k, m
in-1
Figure 3-26: Effect of initial solution pH on the rate ofphocatalysis of CR
pHk, min-1
2.50.02130.016
40.00750.005
70.002
90.002

74
3.4.2 Variation of pH and conductivity during photocatalysis process
The pH of the MO dye solutions before and after exposure was
monitored to study the change in pH as a function of the irradiation time.
The time variation of pH value of samples is shown in Figure 3-27, which
indicates that the pH value of the samples slightly increases with increasing
reaction time. However, no significant changes in pH were observed after 60
min of irradiation, but it can be considered that the trend of the pH change is
consistent with the decolorization efficiency and indicated the organic
pollutants were continuously decomposed forming simple inorganic ions,
which is in accordance with the photocatalytic degradation in the presence of
N-TiO2 catalyst [118].
The conductivity or electrical current estimates the amount of
dissolved ions in solution. This current depends on the temperature of the
solution, ion mobility and concentration or numbers of ion present [119].
The initial conductivity was recorded prior to the irradiation of the sample
and the other conductivity values were recorded after each 15 minutes of
irradiation time. These results could be used to predict the degree of
mineralization of the dye. Figure 3-27 shows the time variation of
conductivity of dyes. It can be seen that the conductivity of dyes increases
with increasing reaction time and climbs up more quickly in the first 15
minutes of the process, and the change trend is consistent with the
decolorization efficiency, which means that ions in the solution augment
with increasing reaction time and the dye molecules have been decomposed
to ions and other substances [120].
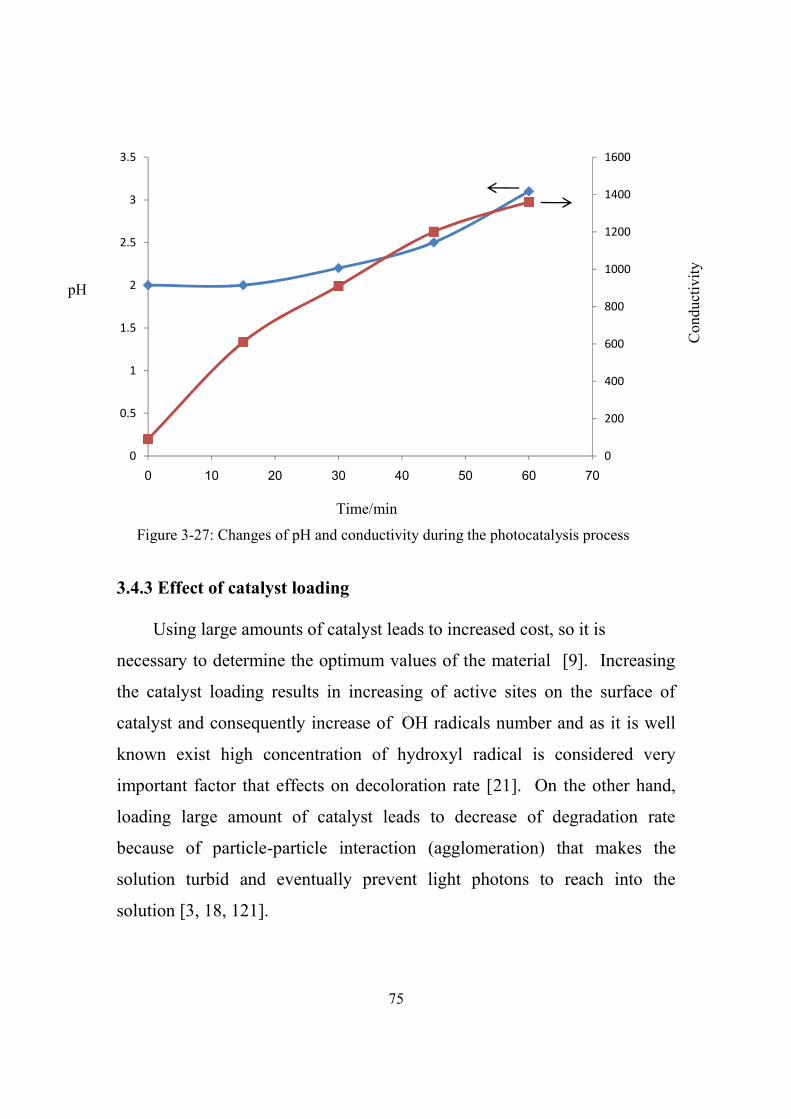
75
3.4.3 Effect of catalyst loading
Using large amounts of catalyst leads to increased cost, so it is
necessary to determine the optimum values of the material [9]. Increasing
the catalyst loading results in increasing of active sites on the surface of
catalyst and consequently increase of •OH radicals number and as it is well
known exist high concentration of hydroxyl radical is considered very
important factor that effects on decoloration rate [21]. On the other hand,
loading large amount of catalyst leads to decrease of degradation rate
because of particle-particle interaction (agglomeration) that makes the
solution turbid and eventually prevent light photons to reach into the
solution [3, 18, 121].
pH
Con
duct
ivity
pH
Conductivity
0
200
400
600
800
1000
1200
1400
1600
0
0.5
1
1.5
2
2.5
3
3.5
0 10 20 30 40 50 60 70
Figure 3-27: Changes of pH and conductivity during the photocatalysis process
Time/min

76
Different amounts of catalyst from 20 mg to 100 mg were used to
know the effect of loading on the reaction rate and degradation percent.
From Figures 3-28 and 3-29 one could conclude that the degradation of both
dyes increased significantly with increasing of catalyst concentration and
then decreased with further increase of the catalyst concentration due to light
scattering and screening effect. Some researchers suggest that there is no
significant affect on the dye degradation at higher addition of photocatalyst
quantities [122]. This agrees well with our results of Congo red. It is also
noted by others [122-123] that there is fluctuation of degradation percent
with further increases of catalyst concentration. Wang et al. [118] reported
that with ascending added amount of catalyst lead to gradual increase in the
degradation ratio due to the increase of the surface area and then high
adsorbability of dye in case of rutile and even though we used anatase, but
this may be the reason. Therefore, the existence of an optimum value in this
reaction system is essential. The observed optimum concentration of the
catalyst has been about 50 mg for a given concentration of 10 ppm of methyl
orange solution and 40 mg for 15 ppm of Congo red. From a practical
application point of view, the concentration of 50 mg and 40 mg are
moderate quantities.

77
3.4.4 Effect of initial dye concentration on the degradation
The effect of initial methyl orange concentration in water on the
photocatalytic effectiveness of the process was examined. The photocatalytic
86
88
90
92
94
96
98
0 20 40 60 80 100 120
Deg
rada
tion
%
mg of N-TiO2
Figure 3-29: Effect of N-TiO2 loading on the removal of congo red
Degradation%N-TiO2loading(mg)/L
92.420
9740
9450
86.660
9180
89.5100
mg of N-TiO2
Deg
rada
tion
%
84
86
88
90
92
94
96
98
100
0 20 40 60 80 100 120
Figure 3-28: Effect of N-TiO2 loading on the removal of methyl orange
Degradation%N-TiO2loading(mg)/L
91.420
95.640
9850
9660
90.680
86.2100

78
decomposition of the dye was studied by varying the initial concentration
from 5 to 30 mg. L-1. For the concentration of 15 mg/L complete
discolouration of the solution was observed (98-97%) after 60 min of
illumination. For concentration of methyl orange below 15 mg/L, practically
the totality of the dye disappeared with 97.4 % and the solution becomes
completely transparent. Similar observations are made in the case of congo
red and the results are shown in Figures 3-30 and 3-31 for MO and CR,
respectively. At initial dye concentration of 30 mg/L, the rate of elimination
reached hardly 50% for a total time of 60 min. However better results can be
obtained by extension of reaction time. Beyond 20 mg/L, degradation
becomes very slow. The rate of degradation relates to the probability of •OH
radicals formation on the catalyst surface and to the probability of •OH
radicals reacting with dye molecules [27]. Once the concentration of dye is
increased; firstly, the adsorption amounts of catalyst attain the saturation for
superfluous dye. Secondly, the mutual screens among dye molecules also
increase along with the concentration rising of dye. Thus, once the
concentration of dye is increased, it also causes the dye molecules to absorb
light and the photons never reach the photocatalyst surface and therefore less•OH are formed, thus resulting in less degradation percentage [122, 124].
Additionally, according to Beer–Lambert law, by increasing the molecules
of the dye, penetration of photons into the solution decreases, which causes
lower photonic adsorption on the nano photocatalyst and consequently a
reduction in the efficiency of (e-CB/h+VB) pair formation [22].

79
0
20
40
60
80
100
5 10
Deg
rada
tion
%
Initial concentration of methyl orange (ppm)
Figure 3-30: Effect of initial methyl orange concentration on photodegradation efficiency
Degradation%Conc.of MO(ppm)
96.65
9810
87.515
75.620
6325
49.930
0
20
40
60
80
100
5 10
degradation%Conc.of C.R(ppm)
95.35
96.710
9715
90.320
85.225
7830
Deg
rada
tion
%
Initial concentration of congo red (ppm)
Figure 3-31: Effect of initial congo red concentration on photodegradationefficiency
79
15 20 25 30
Deg
rada
tion
%
Initial concentration of methyl orange (ppm)
Figure 3-30: Effect of initial methyl orange concentration on photodegradation efficiency
Degradation%Conc.of MO(ppm)
96.65
9810
87.515
75.620
6325
49.930
10 15 20 25 30
degradation%Conc.of C.R(ppm)
95.35
96.710
9715
90.320
85.225
7830
Deg
rada
tion
%
Initial concentration of congo red (ppm)
Figure 3-31: Effect of initial congo red concentration on photodegradationefficiency
79
Deg
rada
tion
%
Initial concentration of methyl orange (ppm)
Figure 3-30: Effect of initial methyl orange concentration on photodegradation efficiency
Degradation%Conc.of MO(ppm)
96.65
9810
87.515
75.620
6325
49.930
degradation%Conc.of C.R(ppm)
95.35
96.710
9715
90.320
85.225
7830
Deg
rada
tion
%
Initial concentration of congo red (ppm)
Figure 3-31: Effect of initial congo red concentration on photodegradationefficiency

80
3.4.5 Effect of H2O2 concentration variation
The effective prevention of photogenerated electrons and holes
recombination is of critical importance to improve photocatalytic ability of
N-TiO2 catalyst [125-126]. In most cases, dissolved oxygen is used as
electron scavenger in these processes and several works have been
implemented on its efficiency as oxidant agent to complete organic matter
mineralization [127-128]. Nevertheless, it has been demonstrated that only
low mineralization is reached when dissolved oxygen is used as oxidant
agent in, for example, the photoassisted degradation of pesticide [127],
suggesting that the decoloration reaction can be further promoted by the
addition of hydrogen peroxide. The improvement of photocatalytic rates
using H2O2 has been attributed to many factors, mainly: hydrogen peroxide
is better electro acceptor than oxygen; its potential for reduction is 1.76 V
while this value for oxygen reduction is -0.13 V. This simple peroxide is
considered as environmentally friendly and of great interest for “green”
chemistry and engineering applications [125, 129]. Addition of hydrogen
peroxide will increase the rate of decoloration because of increasing of
hydroxyl radical concentration through three main reactions. Either through
reaction with conduction band electron, equation 3.5, or reaction with
superoxide anion, equation 3.6, or by direct photolysis of H2O2 at low
concentration, equation 3.7, [126, 129].
eCB− + H2O2 → OH− + •OH 3.5
O2• −+ H2O2 → OH− + •OH + O2 3.6
H2O2 + hν → 2•OH 3.7

81
Using high concentration of H2O2 plays negative role in photocatalytic
process where H2O2 can scavenge •OH, equations 3.8 and 3.9, and trap the
holes that formed from illumination of catalyst, equation 3.10. Despite of
formation of superoxide anion and hydroperoxyl radical at high
concentrations of H2O2, but these radicals are not compared with •OH that
has oxidation potential equal to +3.06 V [125-126, 130- 131].
•OH + H2O2 → H2O + HO2•/O2
• − 3.8•HO2 + •OH → H2O + O2 3.9
hCB+ + H2O2 → H+ + •HO2 3.10
In order to deepen our understanding, various volumes of hydrogen
peroxide were added to the dye solution in the concentration of 0.675N and
the photocatalytic studies were performed after each addition of hydrogen
peroxide. The results are presented in Figure 3-32. Complete degradation
has been achieved within 60 min irradiation in the presence of 2 milliliter of
hydrogen peroxide. A quantitative degradation (98.8%) of MO has been
found to be possible in the presence of hydrogen peroxide in comparison
with the results in the absence of hydrogen peroxide.

82
3.4.6 Effect of the presence of some oxidants
As expected, oxygen showed low activity where the reaction needs 60
min in order to reach 9.3% of dye degradation. This behavior can be
ascribed to the low reduction potential value of oxygen (–0.13V), therefore
low mineralization is reached when dissolved oxygen is used solely as
oxidant agent [127]. Accordingly, the impact of diluted hydrogen peroxide
has been studied using 0.0135N mol/l of peroxide. The degradation percent
attained 57.1 % at 4 milliliter addition of diluted H2O2 as explicitly shown in
Figure 3-33. Based on the results, the impact of other oxidants has been
investigated using the same concentration of hydrogen peroxide.
Deg
rada
tion
%
Milliliter of hydrogen peroxide
Figure (3-34): Effect of different amount of H2O2 on degradation of methylorange at optimum conditions
Degradation%Milliliter ofconc. H2O2
93.60.596.71982983
94.93.594.7492.95
Figure 3-32: Effect of different amount of H2O2 on degradation of MOat optimum condition

83
From Figure 3-34, it is noted that the decoloration of MO increased in
the presence of S2O82- more than that attained by H2O2. This could be due to
the effect of SO3 in which the O–O bond is longer and consequently the
bond energy is less. The bond distance of the O–O in H2O2 and S2O82− are
1.460 and 1.497Å, respectively. The bond energy in S2O82- is estimated as
140 kJ/mol, while in H2O2 is 213 kJ/mol [132]. This suggests that
persulphate is cleaved more easily than hydrogen peroxide, and thus the
resulting sulphate radicals might be formed more readily than hydroxyl
radicals. Additionally, persulfate (S2O82−) has higher potential (Eo= 2.01 V)
than H2O2 (Eo = 1.76 V) [132]. This interpretation is in a geed accordance
with other reported conclusions [95, 133].
The effectiveness of the inorganic oxidants (KClO3, KBrO3, KIO3)
tested in our system (VIS/TiO2). Halogen atom in these compounds can act
as electron trapping because of it's high electropositivity [134]. BrO3- was
the best oxidant compared with ClO3- and IO3
- where about 94% of MO was
Figure 3-33: Degradation of methyl orange at optimum condition at different diluted
amount of H2O2
0
10
20
30
40
50
60
1
Milliliter of diluted Hydrogen peroxide
%D
egra
datio
n
83
From Figure 3-34, it is noted that the decoloration of MO increased in
the presence of S2O82- more than that attained by H2O2. This could be due to
the effect of SO3 in which the O–O bond is longer and consequently the
bond energy is less. The bond distance of the O–O in H2O2 and S2O82− are
1.460 and 1.497Å, respectively. The bond energy in S2O82- is estimated as
140 kJ/mol, while in H2O2 is 213 kJ/mol [132]. This suggests that
persulphate is cleaved more easily than hydrogen peroxide, and thus the
resulting sulphate radicals might be formed more readily than hydroxyl
radicals. Additionally, persulfate (S2O82−) has higher potential (Eo= 2.01 V)
than H2O2 (Eo = 1.76 V) [132]. This interpretation is in a geed accordance
with other reported conclusions [95, 133].
The effectiveness of the inorganic oxidants (KClO3, KBrO3, KIO3)
tested in our system (VIS/TiO2). Halogen atom in these compounds can act
as electron trapping because of it's high electropositivity [134]. BrO3- was
the best oxidant compared with ClO3- and IO3
- where about 94% of MO was
Figure 3-33: Degradation of methyl orange at optimum condition at different diluted
amount of H2O2
2 3 4
Milliliter of diluted Hydrogen peroxide
%D
egra
datio
n
83
From Figure 3-34, it is noted that the decoloration of MO increased in
the presence of S2O82- more than that attained by H2O2. This could be due to
the effect of SO3 in which the O–O bond is longer and consequently the
bond energy is less. The bond distance of the O–O in H2O2 and S2O82− are
1.460 and 1.497Å, respectively. The bond energy in S2O82- is estimated as
140 kJ/mol, while in H2O2 is 213 kJ/mol [132]. This suggests that
persulphate is cleaved more easily than hydrogen peroxide, and thus the
resulting sulphate radicals might be formed more readily than hydroxyl
radicals. Additionally, persulfate (S2O82−) has higher potential (Eo= 2.01 V)
than H2O2 (Eo = 1.76 V) [132]. This interpretation is in a geed accordance
with other reported conclusions [95, 133].
The effectiveness of the inorganic oxidants (KClO3, KBrO3, KIO3)
tested in our system (VIS/TiO2). Halogen atom in these compounds can act
as electron trapping because of it's high electropositivity [134]. BrO3- was
the best oxidant compared with ClO3- and IO3
- where about 94% of MO was
Figure 3-33: Degradation of methyl orange at optimum condition at different diluted
amount of H2O2
5
Milliliter of diluted Hydrogen peroxide
%D
egra
datio
n
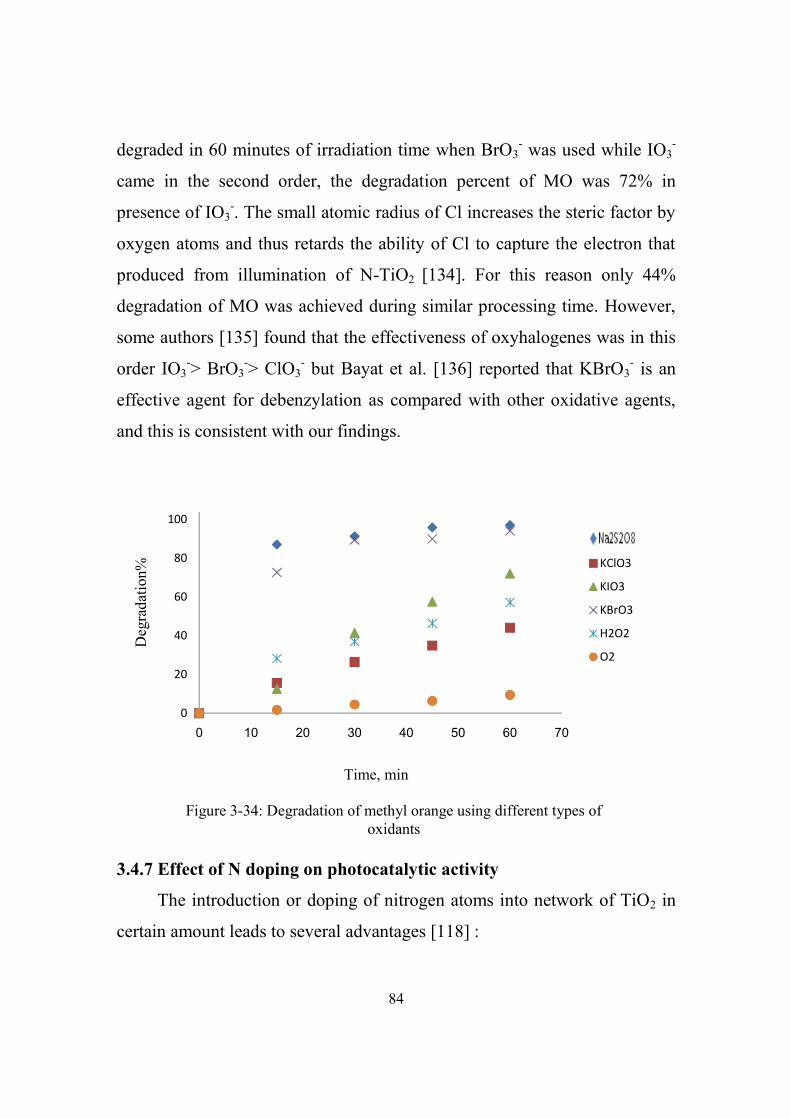
84
degraded in 60 minutes of irradiation time when BrO3- was used while IO3
-
came in the second order, the degradation percent of MO was 72% in
presence of IO3-. The small atomic radius of Cl increases the steric factor by
oxygen atoms and thus retards the ability of Cl to capture the electron that
produced from illumination of N-TiO2 [134]. For this reason only 44%
degradation of MO was achieved during similar processing time. However,
some authors [135] found that the effectiveness of oxyhalogenes was in this
order IO3-> BrO3
-> ClO3- but Bayat et al. [136] reported that KBrO3
- is an
effective agent for debenzylation as compared with other oxidative agents,
and this is consistent with our findings.
3.4.7 Effect of N doping on photocatalytic activity
The introduction or doping of nitrogen atoms into network of TiO2 in
certain amount leads to several advantages [118] :
Time, min
0
20
40
60
80
100
120
0 10 20 30 40 50 60 70
KClO3
KIO3
KBrO3
H2O2
O2
Deg
rada
tion%
Figure 3-34: Degradation of methyl orange using different types ofoxidants

85
1- Dopants act as active sites of substrate that leads to increase of
adsorption capacity and then increase of reaction rate.
2- Narrowing of band gap energy and region of space-charge,
consequently, enhancement of electron-hole separation.
Using excess amount of dopant results in reduction of activity of catalyst
because of:
1- Prevention of oxygen adsorption on TiO2 and thus precludes trapping
of electron by oxygen so decreasing of oxidizing agent number
according to what Yong et al reported [137].
2- Akpan et al. [89] mentioned that increasing of dopant content creates
recombination centers of e--h+ and thus causes screening of the
catalyst.
3- More reduction of band gap energy and further reduction of space-
charge layer with increase of photoinduced charge carrier and hence
inducement recombination process because there is no driving force to e--
h+ separation [78]. Figure 3-35 shows the relationship between
concentration of N and rate of degradation percent of the dye. It is
observed that the decolorization rate decreases with the increase of the
amount of doping .
In this study, the optimal nitrogen content has been 2.5%. The maximal
degradation efficiency of MO is up to 98% within 60 minute. The apparent
rate constants kapp (Figure 3-35) of 2.5% N-iO2, 7% N-TiO2, and 30% N-
TiO2 samples are 0.085 min-1, 0.064 min-1 and 0.035 min-1 respectively. It
can be seen that the apparent rate constant of 2.5% N doped TiO2 sample is
higher than others. This could be explained concurrently via the results of N-
doped samples characterization, as previously mentioned in SEM, BET and
PL, and photocatalytic activity of N-TiO2 samples. 2.5% N-TiO2 revealed

86
lower PL intensity, that means it is most photo efficient compared with 5%
N-TiO2 and 7% N-TiO2. On the other side, the surface feature of 2.5% N-
TiO2 was more ordered than that of the other samples as SEM presented.
Finally, 2.5% N-TiO2 has higher surface area according to BET.
3.4.8 Effect of radiation dose on dye removal
Photocatalytic reaction rate depends largely on the radiation absorption
of the photocatalyst [9]. As would be expected, increasing the radiation dose
dramatically increases the rate of dye degradation. At a higher radiation
dose, number of photons increases to reach the active site of catalyst so
number of excited catalyst molecules increases and consequently the number
of hydroxyl radicals and rate of degradation of dye molecules also increase
[129, 138-139]. It has been shown [18] that at low light intensities (0–20
mW/cm2), the rate would increase linearly with increasing light intensity
(first order), whereas at intermediate light intensities (25 mW/cm2) the rate
y = 0.0855x - 0.3564R2 = 0.9773
y = 0.0646x - 0.1558R2 = 0.9846
y = 0.0351x - 0.4043R2 = 0.9747
-2
0
2
4
6
8
10
12
14
0 20 40 60 80 100 120 140 160
Time, min.
lnC
o/ C
t
Figure 3-35: Relation of N doping with rate of photodecolorization ofMO; (1) 2.5% N-TiO2 ;(2) 5% N-TiO2; (3) 7% N-TiO2: inset shows
variation of rate constant (k) with N doping content
12
3
S10
0.010.020.03
0.04
0.05
0.06
0.07
0.08
0.09
1
2
3

87
would depend on the square root of the light intensity (half order), and at
high light intensities the rate is independent of light intensity. The authors
[18] stated that at low light intensity, reactions involving electron–hole
formation are predominant and electron–hole recombination is negligible.
As the intensity of light increases the competition between separation and
recombination of electron and hole increases too [27, 140]. Mechanism of
reaction is not affected by light type [9]. The influence of visible-lamp
power on methyl orange decoloration in 60 minutes is shown in Figure (3-
36). The degradation rate was appreciably higher under higher intensity of
halogen lamp (5.55 x 10⁻⁷ mol l-1 sec-1) than of an intermediate and low
intensities of visible light (2.3 x 10⁻⁷ mol l-1 sec-1) and (2.1 x 10⁻⁷ mol l-1sec-
1), respectively. Increase the intensity of the light increases the number of
photons and the number of photogenerated species and consequently
increasing of oxidizing agent number according to theoretical study [125].
Therefore, it is expected that the kinetic rate constant k for methyl orange
degradation is directly proportional to the light intensity Io. The calculated
first-order rate constant, k, of methyl orange degradation under high
intensity of a halogen-lamp, 3.9 x 10⁻⁷ mol / L min, is significantly higher
than that under the intermediate and low intensities of the visible lamp 5 x
10-9 mol /L.min and 10-9 mol /L.min, respectively validating the theoretical
reasoning above. Additionally, Figure 3-37 reveals stand alone ratification
for the better degradation yield percent in case of high incident light
intensity comparing to the intermediate and low visible light intensities. The
relation between degradation rate and square root of intensity is showd in
Figure (3-38).

88
Degradation%Intensity,Ein/sec.L
985.55
53.72.3
12.42.19
Figure 3-37: Degradation yield percent at different light intensities
Time, min
Deg
rada
tion
%
0
20
40
60
80
100
120
0 20 40 60 80
high intensity
intermediate intensity
low intensity
Time, min.
Degradation%Intensity,Ein/sec.L
985.55
53.72.3
12.42.19
Rat
e x
10-9
mol
/L.m
in
Intensity of VIS-light x 10-7, Ein/sec.L
Figure 3-36: Variation of the initial rates as function of light source intensity
0
0.5
1
1.5
2
2.5
3
3.5
0 1 2 3 4 5 6
Rate,mol/L.min
Intensity,Ein/sec.L
3.9 x 10-85.55
5 x 10-92.3
1 x 10-92.19

89
3.5 Kinetic study3.5.1 Influence of irradiation time on the reaction kinetics
Figures 3-39 and 3-40 show the effect of light irradiation time on the
decline of azo dyes concentration. 98% of the methyl orange and 97% of
congo red were degraded, after an irradiation time of 60 minutes, 90
minutes, respectively. It is also evident that the percentage of decolorization
and photodegradation increases with increasing irradiation time. The
photocatalytic decolourisation of the dye occurs on the surface of N-TiO2,
where the •OH and O2•- radicals are trapped by the holes of the reactive
species, as oxygen and water are essential for photocatalytic decolourisation.
The •OH radicals are strong enough to break the bonds of the dye molecules
absorbed on the surface of N-TiO2. When the intensity of light and dye
concentration are constant, the number of •OH and O2•- radicals increases
with an increase in the irradiation period, and hence, the dye molecules are
completely decolorized [141].
The reaction rate decreases with irradiation time since it follows
apparent first-order kinetics and additionally a competition for degradation
may occur between the reactant and the intermediate products. The slow
0
1
2
3
4
5
6
7
8
0 10 20 30 40 50 60 70
020406080
100120
0 50 100
Time,min
Figure 3-38: relationship between square root of light intensity andreaction rate
(I)1/2 of VIS light, Ein/sec .L
Rat
e m
ol/L
0
5E-09
1E-08
1.5E-08
2E-08
2.5E-08
3E-08
3.5E-08
4E-08
4.5E-08
0 0.5 1 1.5 2 2.5

90
kinetics of dyes degradation after certain time limit is due to: (a) the
difficulty in converting the N-atoms of dye into oxidized nitrogen
compounds, (b) the slow reaction of short chain aliphatic moieties with •OH
radicals, and (c) the short life-time of photocatalyst because of active sites
deactivation by strong by-products deposition [18, 27, 142- 143].
Figure 3-39: Correlation of methyl orange concentration with irradiation time
Time, min.

91
3.5.2 Kinetic model
In order to investigate the overall order of reaction with respect to the
initial dye concentration, it was necessary to determine the kinetic order and
apparent rate constant for the degradation of the methyl orange. The
degradation experiments by visible irradiation of azo dye aqueous solution
containing N-TiO2 follow the pseudo-first-order kinetics with respect to the
concentration of the dye.
r = - dC/dt = kappC
Integration of this equation (with the same restriction of C = Co at t = 0,
with Co being the initial concentration of dye and t the reaction time) will
lead to the expected relation:
ln Co/Ct = kappt
in which Co is the initial concentration of the reactant, Ct is the concentration
of the reactant at any time, t the irradiation time and kapp is the apparent
pseudo-first-order rate constant and is affected by dye concentration. A plot
of ln (Co/Ct) versus time, Figures 3-41 and 3-42, exhibit a straight line, the
0
2
4
6
8
10
12
14
16
18
0 20
Ct
Figure 3-40: Correlation of congo red concentration with irradiation time
Time, min.
%D
egra
datio
n
91
3.5.2 Kinetic model
In order to investigate the overall order of reaction with respect to the
initial dye concentration, it was necessary to determine the kinetic order and
apparent rate constant for the degradation of the methyl orange. The
degradation experiments by visible irradiation of azo dye aqueous solution
containing N-TiO2 follow the pseudo-first-order kinetics with respect to the
concentration of the dye.
r = - dC/dt = kappC
Integration of this equation (with the same restriction of C = Co at t = 0,
with Co being the initial concentration of dye and t the reaction time) will
lead to the expected relation:
ln Co/Ct = kappt
in which Co is the initial concentration of the reactant, Ct is the concentration
of the reactant at any time, t the irradiation time and kapp is the apparent
pseudo-first-order rate constant and is affected by dye concentration. A plot
of ln (Co/Ct) versus time, Figures 3-41 and 3-42, exhibit a straight line, the
40 60 80
Ct
Figure 3-40: Correlation of congo red concentration with irradiation time
Time, min.
%D
egra
datio
n
0
50
100
150
0 50
Time,min.
91
3.5.2 Kinetic model
In order to investigate the overall order of reaction with respect to the
initial dye concentration, it was necessary to determine the kinetic order and
apparent rate constant for the degradation of the methyl orange. The
degradation experiments by visible irradiation of azo dye aqueous solution
containing N-TiO2 follow the pseudo-first-order kinetics with respect to the
concentration of the dye.
r = - dC/dt = kappC
Integration of this equation (with the same restriction of C = Co at t = 0,
with Co being the initial concentration of dye and t the reaction time) will
lead to the expected relation:
ln Co/Ct = kappt
in which Co is the initial concentration of the reactant, Ct is the concentration
of the reactant at any time, t the irradiation time and kapp is the apparent
pseudo-first-order rate constant and is affected by dye concentration. A plot
of ln (Co/Ct) versus time, Figures 3-41 and 3-42, exhibit a straight line, the
100
Ct
Figure 3-40: Correlation of congo red concentration with irradiation time
Time, min.
%D
egra
datio
n
100
Time,min.

92
slope of which upon linear regression equals the apparent first-order rate
constant kapp [144]. One of the most useful indications to evaluate the
reaction rate of first order kinetic is the calculation of half-life time reaction
which is calculated as follows;
t1/2 = 0.693/ kapp
here, t1/2 is the half-life time of reaction calculated from kapp. t1/2 equals to 8
minutes for methyl orange and 33 minutes for congo red.
y = 0.085x - 0.385R² = 0.970
-1
0
1
2
3
4
5
6
0 10 20 30 40 50 60 70
Figure 3-41:Degradation rate of methyl orange at optimum conditions
lnC
o/Ct
Time, min
ln Co/CtTime
000.70315
1.796303.29545
5.12860

93
3.5.3 Determination of remaining amount of H2O2 at the end of reaction
The remaining amount of H2O2 at the end of reaction was determined
using a titration method as described in chapter two. The color of the sample
changed to light pink with the first drop. The volume of the titrating solution
was recorded and the remaining amount of H2O2 was calculated based on the
following chemical equation;
5H2O2 + 2KMnO4 (aq) + 3H2SO4 → 5O2 + 2MnSO4 (aq) + K2SO4 + 8H2O
This result indicates that the treatment associating VIS/N-TiO2/H2O2 has
consumed the added peroxide completely. Furthermore, the VIS/N-
TiO2/H2O2 treatment has the advantage of leads to a final nontoxic residue
due to the absence of residual peroxide. This confirms that the interaction
actually goes through the pseudo first order as stated previously in this work.
Similar results have also been made by Garcia et al. [145] in their work on
the comparative study of the degradation of real textile effluents by
photocatalytic reactions involving UV/TiO2/H2O2 and UV/Fe+2/H2O2
systems.
3.11
y = 0.021x + 0.25R² = 0.959
0
0.5
1
1.5
2
2.5
0 20 40 60 80 100
Figure 3-42: Degradation rate of congo red at optimum conditions
Time, min
lnC
o/Ct
lnCo/CtTime00
0.707151.006301.3545
1.648601.857752.08990
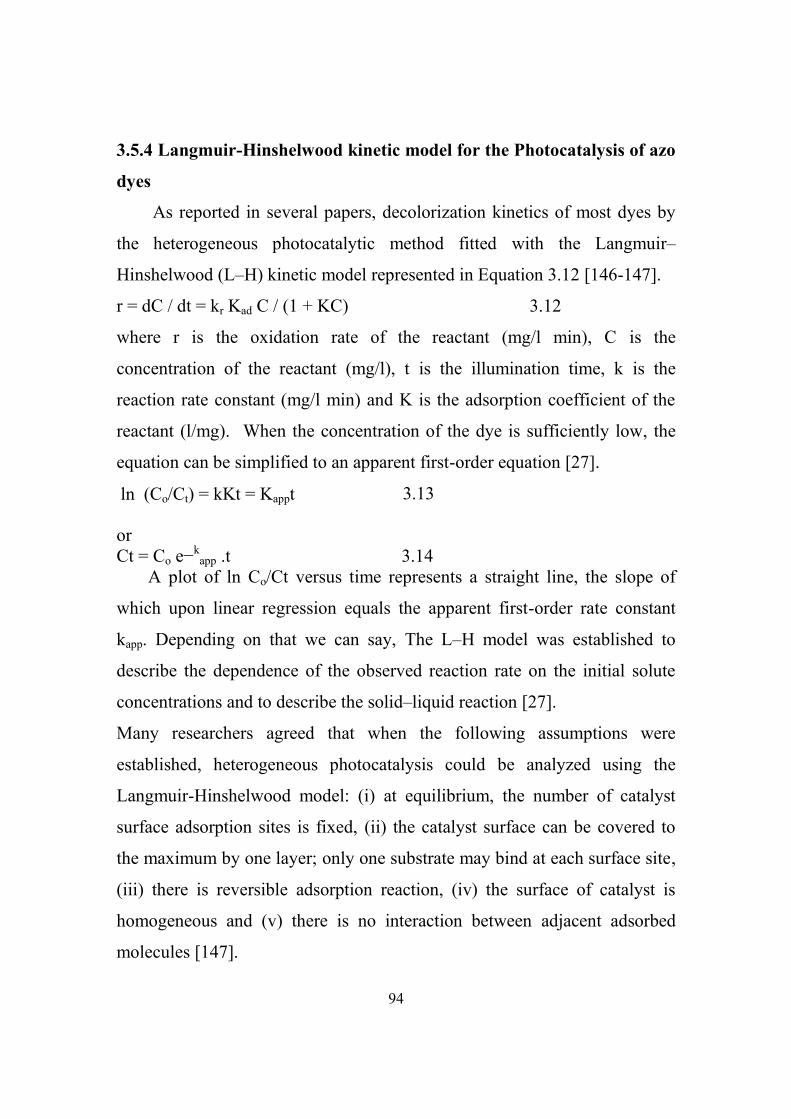
94
3.5.4 Langmuir-Hinshelwood kinetic model for the Photocatalysis of azo
dyes
As reported in several papers, decolorization kinetics of most dyes by
the heterogeneous photocatalytic method fitted with the Langmuir–
Hinshelwood (L–H) kinetic model represented in Equation 3.12 [146-147].
r = dC / dt = kr Kad C / (1 + KC) 3.12
where r is the oxidation rate of the reactant (mg/l min), C is the
concentration of the reactant (mg/l), t is the illumination time, k is the
reaction rate constant (mg/l min) and K is the adsorption coefficient of the
reactant (l/mg). When the concentration of the dye is sufficiently low, the
equation can be simplified to an apparent first-order equation [27].
(3.11) 3.13
orCt = Co e−k
app .t 3.14A plot of ln Co/Ct versus time represents a straight line, the slope of
which upon linear regression equals the apparent first-order rate constant
kapp. Depending on that we can say, The L–H model was established to
describe the dependence of the observed reaction rate on the initial solute
concentrations and to describe the solid–liquid reaction [27].
Many researchers agreed that when the following assumptions were
established, heterogeneous photocatalysis could be analyzed using the
Langmuir-Hinshelwood model: (i) at equilibrium, the number of catalyst
surface adsorption sites is fixed, (ii) the catalyst surface can be covered to
the maximum by one layer; only one substrate may bind at each surface site,
(iii) there is reversible adsorption reaction, (iv) the surface of catalyst is
homogeneous and (v) there is no interaction between adjacent adsorbed
molecules [147].
ln (Co/Ct) = kKt = Kappt

95
From Figures 3-43 and 3-44 one could determine rate constants of
adsorbed dyes and the adsorption constants Kads. These values are reported
in Table 3-12.
Figure 3- 43: Langmuir-Hinshelwood model outcomes for the photobleaching of congored at different initial concentrations; N-TiO2 loading = 40 mg; pH = 2.5
Figure 3- 44: Langmuir-Hinshelwood model outcomes for thephotobleaching of methyl orange at different initial concentrations; N-
TiO2 loading = 50 mg; pH = 2.5

96
From Table 3-3, one could observe the higher adsorption coefficient
value for CR in comparison to that of MO. This observation is ascribed to
the higher electron density of aromatic ring due to extended conjugation in
CR and further the existence of diazo groups which increase the chelation
and lead consequently to stronger adsorption onto (Ti+4 ) sites at the N-TiO2
surface [148]. Correspondingly, one might conclude that the relatively high
value of adsorption coefficient, K, reflects the importance of the direct
photolytic reaction of the adsorbed CR moiety on the photocatalyst surface,
beside its oxidation by hydroxyl radical and superoxide anion radical
(generated on photocatalyst surface) in solution bulk. However and also
from Table 3-2 , the lower k value for CR relatively to that of MO could be
attributed to higher number of produced intermediates which contribute
significantly in the consumption of incident photons and active adsorption
sites on the photocatalyst on one hand, and the large moieties need normally
longer time for decomposition, on the other hand [17].
3.6 Evaluation of the photodegradation system via quantum yield
calculations
The quantum yield, Ф, is defined as the number of moles of the
reacted species via photophysical or photochemical process divided by the
number of moles of photons that actually contributed in promotion of
Dye Kads (µM-1) k (µM. sec-1)
Methyl orange 0.007 0.025
Congo red 0.0569 0.0135
Table 3-3: Rate constants and adsorption coefficients of the dyes

97
molecules. Also, it could be translated as the rate of photochemical reaction
divided by the light intensity [149];
Ф = number photoreacted or photoproduced molecules/ number of absorbed
photons
= process rate / light intensity
For several photochemical reactions, the high quantum yield is 106 and
low quantum yield is 10-2 [150]. Quantum yield or quantum efficiency is
considered as a substantial quantity in photochemistry, because it provides
essential information regarding the nature and mechanism of the
photochemical reaction. Hence, it is necessary to measure quantum yield in
the studies of photochemical reactions [150] in order to explore the
efficiency of a photodegradation reaction and to have an idea about the
number of photons which are really involved in the transformation process
[123].
Any chemical compound that possess known quantum yield, do not
suffer side reaction, not sensitive to presence of oxygen or impurity, stable
thermally during reaction and insensitive to wavelength change can be used
to determine light intensity [151-152]. In this work Ferrioxalate
[Fe(C2O4)3]3- is used as actinometer. This actinometer is the most common
actinometer and most accurate which cover wide range of wavelength from
250 nm to 577 nm [150].
In heterogeneous semiconductor photocatalysis, the measurement of
Фoverall is very difficult and, as a consequence is rare. The most obvious
reason is that the rate of absorption of photons is very difficult to assess, as
long as the semiconductor particles absorb, scatter, reflect and transmit the
light. It is usually assumed that all the light is absorbed and the efficiency is
quoted as an apparent quantum yield [52, 151-153].

98
Effect of several factors on the quantum yield was studied to investigate
of photocatalytic efficiency. Figures 3-45a and 3-46a show quantum yields
increase with increasing N-TiO2 dose, but beyond the optimum value of
catalyst amount it decreases because of aggregation of catalyst particles that
decrease the number of active sites and on the other side increase the
turbidity of solution and light scattering and then diminishing the quantum
yield value.
Quantum yield decreases from 0.038 to 0.029 when the concentration of
MO increases from 5 ppm to 30 ppm as shown in Figure 3-45b. This may
be due to lowering of the number of reached photons into solution because
of screening effect as the concentration of dyes increases and eventually Ф
decreases [154]. However, in case of CR, the results were different where
the quantum yield increased from 0.0073 to 0.0181 with increasing the CR
initial concentration from 5 ppm to 30 ppm, Figure 3-46b. This can be
interpreted on the basis of that with the increase in initial concentration of
dye, while the Visible light irradiation period and catalyst dose are kept
constant, more dye molecules are adsorbed onto the surface of catalyst and
hence the amount of decomposed dye has increased [95, 123].
The initial solution pH is another important variable in the evaluation of
photocatalytic efficiency. The relationship between pH and Ф is shown in
Figures 3-45c and 3-46c. It could be concluded that the pH variation could
result in enhancement of the efficiency of photo removal of organic
pollutants in presence N-TiO2 [155].
Finally, the quantum yield of 2.5% N-TiO2 is much higher than that of
5% and 7% N-TiO2. The photocatalytic performance of N-doped TiO2
revealed dependence of Ф on the N dopant amount as shown in Figure 3-
45d. This is a stand alone verification for our previous observation in which

99
the increase of the nitrogen content lowers the quantum yield under
illumination, and further is consistent with other reported data [156].
0
0.01
0.02
0.03
0.04
0.05
0.06
0.07
0.08
0 5
Qua
ntum
yie
ld
(b)
Methyl orange initial conc., mg/l
Quantumyield
initial conc.(ppm)
0.0385
0.07610
0.05715
0.04520
0.03825
0.02930
0
0.005
0.01
0.015
0.02
0.025
0.03
0.035
0.04
0
Qua
ntum
yie
ld
pH
Quantumyield
pH
0.0231
0.0272
0.0352.5
0.023
0.0114
0.0075
0.0017
0.00089
99
the increase of the nitrogen content lowers the quantum yield under
illumination, and further is consistent with other reported data [156].
10 15 20 25 30
Qua
ntum
yie
ld
(b)
Methyl orange initial conc., mg/l
Quantumyield
initial conc.(ppm)
0.0385
0.07610
0.05715
0.04520
0.03825
0.02930
2 4 6 8
Qua
ntum
yie
ld
pH
(c)
Quantumyield
pH
0.0231
0.0272
0.0352.5
0.023
0.0114
0.0075
0.0017
0.00089
99
the increase of the nitrogen content lowers the quantum yield under
illumination, and further is consistent with other reported data [156].
35
Qua
ntum
yie
ld
(b)
Methyl orange initial conc., mg/l
Quantumyield
initial conc.(ppm)
0.0385
0.07610
0.05715
0.04520
0.03825
0.02930
10
Qua
ntum
yie
ld
pH
Quantumyield
pH
0.0231
0.0272
0.0352.5
0.023
0.0114
0.0075
0.0017
0.00089

100
0
0.01
0.02
0.03
0.04
0.05
0.06
0.07
0.08
0 1
Qua
ntum
yie
ld
Percent of nitrogen doping
(d)
Figure 3-45: Effect of (a) N-TiO2 loading (b) methyl orange initial
concentration (c) pH and (d) percent of nitrogen doping on the quantum
yield of photocatalytic reaction
dopingpercent %
Quantumyield
2.5 0.076
5 0.058
7 0.031
0
0.002
0.004
0.006
0.008
0.01
0.012
0.014
0.016
0 20
(a)
Qua
ntum
yie
ld
N-TiO2 dosage, mg
Quantumyield
N-TiO2loading, mg
0.00840120
0.0135740
0.0122560
0.012980
0.0122100
100
2 3 4 5 6 7
Qua
ntum
yie
ld
Percent of nitrogen doping
(d)
Figure 3-45: Effect of (a) N-TiO2 loading (b) methyl orange initial
concentration (c) pH and (d) percent of nitrogen doping on the quantum
yield of photocatalytic reaction
dopingpercent %
Quantumyield
2.5 0.076
5 0.058
7 0.031
40 60 80 100
Qua
ntum
yie
ld
N-TiO2 dosage, mg
Quantumyield
N-TiO2loading, mg
0.00840120
0.0135740
0.0122560
0.012980
0.0122100
100
7 8
Qua
ntum
yie
ld
Percent of nitrogen doping
(d)
Figure 3-45: Effect of (a) N-TiO2 loading (b) methyl orange initial
concentration (c) pH and (d) percent of nitrogen doping on the quantum
yield of photocatalytic reaction
dopingpercent %
Quantumyield
2.5 0.076
5 0.058
7 0.031
120
Qua
ntum
yie
ld
N-TiO2 dosage, mg
Quantumyield
N-TiO2loading, mg
0.00840120
0.0135740
0.0122560
0.012980
0.0122100

101
(b)
00.0020.0040.0060.008
0.010.0120.0140.0160.018
0.02
0 5
Congo red initial conc., mg/l
Qua
ntum
yie
ld
Q-YIELD Conc.
0.007318 5
0.009463 10
0.01375 15
0.01637 20
0.01723 25
0.01809 30
Figure 3-46: Effect of (a) N-TiO2 loading (b) congo red initial
concentration and (c) pH on the quantum yield of photocatalytic
reaction
(c)
Figure (3-46): Effect of (a) N-TiO2 loading (b) congo red initial
concentration and (c) pH on the quantum yield of photocatalytic
reaction
101
(b)
5 10 15 20 25 30
(b)
Congo red initial conc., mg/l
Qua
ntum
yie
ld
Q-YIELD Conc.
0.007318 5
0.009463 10
0.01375 15
0.01637 20
0.01723 25
0.01809 30
Figure 3-46: Effect of (a) N-TiO2 loading (b) congo red initial
concentration and (c) pH on the quantum yield of photocatalytic
reaction
(c)
Figure (3-46): Effect of (a) N-TiO2 loading (b) congo red initial
concentration and (c) pH on the quantum yield of photocatalytic
reaction
101
(b)
35
Congo red initial conc., mg/l
Qua
ntum
yie
ld
Q-YIELD Conc.
0.007318 5
0.009463 10
0.01375 15
0.01637 20
0.01723 25
0.01809 30
Figure 3-46: Effect of (a) N-TiO2 loading (b) congo red initial
concentration and (c) pH on the quantum yield of photocatalytic
reaction
(c)
Figure (3-46): Effect of (a) N-TiO2 loading (b) congo red initial
concentration and (c) pH on the quantum yield of photocatalytic
reaction

102
3.7 Effect of temperature and thermodynamic parameters
Although the temperature influences the e--h+ separation and the
adsorption process of organic substrate, but it can not affect seriously the
photocatalytic reaction [157, 158-159]. Dependence of methyl orange
photodegradation on temperature was studied in the range of 20 Co to 45Co.
From Figure 3-47 we can conclude that the degradation percent increases
with the increased temperature.
The reaction rate constant, kapp, can be derived from the Arrhenius equation
as follows [160];
Kapp= A e-Ea/RT 3.15
where kapp is the apparent rate constant; A is pre exponential factor ; Ea
is the activation energy; R is the universal gas constant (8.314 J/mol. K) and
T is temperature (K). The activation energy (Ea) was obtained from a plot of
ln kapp versus 1/T as shown in Figures 3-47 and 3-48 for MO and CR,
respectively. Linearization of equation 3.15 resulted in the following
expression;
lnkapp = lnA - Ea /RT 3.16
The other thermodynamic parameters, free energy, enthalpy and
entropy of activation were calculated as presented in Tables 3.3 and 3.4 for
MO and CR, respectively. The value of ΔG# (the free energy of activation)
may be determined from following equations [161]:
kapp = kBT/h exponential (-∆G#/RT) 3.17
∆G# = RT x [ln (kBT/h) − ln kapp] 3.18
where kB is Bolzmann constant (1.3805x 10⁻²³ J K-1) and h is Planckconstant. The introduction of the constant values, leads to:

103
∆G# = RT x (23.76 + lnT − lnkapp) 3.19
The enthalpy (∆H#) and entropy (∆S#) of activation are derived fromequations 3.17 and 3.18, leading to the final relations;
lnkapp = lnA − Ea /RT 3.20
d(ln kapp) / dT = Ea / RT2 3.21
likewise, equation (3.19) is rewritten as:
ln kapp = ln (kBT/h) - ∆H# / RT + ∆S# / R 3.22
d(ln kapp) / dT = 1 / T +∆H# / RT2 = (∆H# + RT) / RT2 3.23
Solving equations 3.21 and 3.23for the activation enthalpy gives∆H# = Ea – RT 3.24
finally giving access to the entropy of activation
∆S# = (∆H# − ∆G# ) / T 3.25
From Tables 3-4 and 3-5, it can be concluded that the higher temperature
can increase the degradation rate. This fact indicates that the mobility of dye
molecules increased with the temperature [162] that leads to increase
collision frequency of molecules in solution due to molecules possessing
more kinetic energy and moving faster. Additionally, the number of
molecules possessing enough energy to overcome the activation energy is
also increased [163] and according to collision theory, the rate of change in
the molar concentration of a molecule is the product of the collision density
and the probability that a collision occurs with sufficient energy [149]. Most
authors stated that the optimum temperature is generally between 20 and 80
Co [11, 135] and this agrees well with our results.

104
The desorption of adsorbed substrate and recombination process are so
affected by temperature change because of Ea barrier presence in a
photocatalytic process [155, 164]. According to literature, when
temperature becomes close to the water boiling temperature, the adsorption
of substrate is lowered and the process becomes exothermic. [11].
The positive values of ∆G# gives an indication of non-spontaneous
process as one expected. The process was endothermic due to positive
values of ∆H# i.e., that higher temperatures are favored for enhanced
removal of organic pollutant. The negative values of ∆S# suggest the
decreased randomness at the solid/ solution interface during the adsorption
of azo dye on catalyst and further ratification for the non spontaneous
process.
The relatively higher activation energy of CR (33.8 kJ/mol) in
comparison to that of MO (25.8 kJ/mol) could be, most likely, another
endorsing sign for the lower degradation rate of CR which was observed and
reported earlier in this thesis.
-3.5
-3
-2.5
-2
-1.5
-1
-0.5
00.0031 0.0032
ln kapp
1/T, K-1
Figure 3-47: Arrhenius plot of rate constant versus reciprocal of reactiontemperature for degradation of methyl orange
lnk1/T,K-1
-3.1230.00341
-2.9370.00335
-2.8130.0033
-2.4760.00324
-2.4650.00319
-2.3020.00314
104
104
The desorption of adsorbed substrate and recombination process are so
affected by temperature change because of Ea barrier presence in a
photocatalytic process [155, 164]. According to literature, when
temperature becomes close to the water boiling temperature, the adsorption
of substrate is lowered and the process becomes exothermic. [11].
The positive values of ∆G# gives an indication of non-spontaneous
process as one expected. The process was endothermic due to positive
values of ∆H# i.e., that higher temperatures are favored for enhanced
removal of organic pollutant. The negative values of ∆S# suggest the
decreased randomness at the solid/ solution interface during the adsorption
of azo dye on catalyst and further ratification for the non spontaneous
process.
The relatively higher activation energy of CR (33.8 kJ/mol) in
comparison to that of MO (25.8 kJ/mol) could be, most likely, another
endorsing sign for the lower degradation rate of CR which was observed and
reported earlier in this thesis.
0.0032 0.0033 0.0034 0.0035
ln kapp
1/T, K-1
Figure 3-47: Arrhenius plot of rate constant versus reciprocal of reactiontemperature for degradation of methyl orange
lnk1/T,K-1
-3.1230.00341
-2.9370.00335
-2.8130.0033
-2.4760.00324
-2.4650.00319
-2.3020.00314
104
104
The desorption of adsorbed substrate and recombination process are so
affected by temperature change because of Ea barrier presence in a
photocatalytic process [155, 164]. According to literature, when
temperature becomes close to the water boiling temperature, the adsorption
of substrate is lowered and the process becomes exothermic. [11].
The positive values of ∆G# gives an indication of non-spontaneous
process as one expected. The process was endothermic due to positive
values of ∆H# i.e., that higher temperatures are favored for enhanced
removal of organic pollutant. The negative values of ∆S# suggest the
decreased randomness at the solid/ solution interface during the adsorption
of azo dye on catalyst and further ratification for the non spontaneous
process.
The relatively higher activation energy of CR (33.8 kJ/mol) in
comparison to that of MO (25.8 kJ/mol) could be, most likely, another
endorsing sign for the lower degradation rate of CR which was observed and
reported earlier in this thesis.
0.0035
ln kapp
1/T, K-1
Figure 3-47: Arrhenius plot of rate constant versus reciprocal of reactiontemperature for degradation of methyl orange
lnk1/T,K-1
-3.1230.00341
-2.9370.00335
-2.8130.0033
-2.4760.00324
-2.4650.00319
-2.3020.00314
104

105
T (K) Ea (kJ mol−1) ∆G# (kJ mol−1) ∆H# (kJ mol−1) ∆S# (JK−1 mol−1)293 25.8 89.298 23.363 -225.03
298 90.404 23.322 -225.107
303 91.649 23.28 -225.64
308 92.341 23.239 -225.356
313 93.864 23.197 -225.77
318 94.975 23.156 -225.845
Table 3-4: Thermodynamic parameters for the photocatalytic degradation of methylorange
-5
-4.5
-4
-3.5
-3
-2.5
-2
-1.5
-1
-0.5
00.0031 0.00315
1/T, K-1
ln kapp
Figure 3-48: Arrhenius plot of rate constant versus reciprocal of reactiontemperature for degradation of congo red
1/k1/T,K-1
-4.340.00341
-4.340.00335
-3.9120.00324
-3.270.00314
105
T (K) Ea (kJ mol−1) ∆G# (kJ mol−1) ∆H# (kJ mol−1) ∆S# (JK−1 mol−1)293 25.8 89.298 23.363 -225.03
298 90.404 23.322 -225.107
303 91.649 23.28 -225.64
308 92.341 23.239 -225.356
313 93.864 23.197 -225.77
318 94.975 23.156 -225.845
Table 3-4: Thermodynamic parameters for the photocatalytic degradation of methylorange
0.00315 0.0032 0.00325 0.0033 0.00335 0.0034 0.00345
1/T, K-1
ln kapp
Figure 3-48: Arrhenius plot of rate constant versus reciprocal of reactiontemperature for degradation of congo red
1/k1/T,K-1
-4.340.00341
-4.340.00335
-3.9120.00324
-3.270.00314
105
T (K) Ea (kJ mol−1) ∆G# (kJ mol−1) ∆H# (kJ mol−1) ∆S# (JK−1 mol−1)293 25.8 89.298 23.363 -225.03
298 90.404 23.322 -225.107
303 91.649 23.28 -225.64
308 92.341 23.239 -225.356
313 93.864 23.197 -225.77
318 94.975 23.156 -225.845
Table 3-4: Thermodynamic parameters for the photocatalytic degradation of methylorange
0.0034 0.00345
1/T, K-1
ln kapp
Figure 3-48: Arrhenius plot of rate constant versus reciprocal of reactiontemperature for degradation of congo red
1/k1/T,K-1
-4.340.00341
-4.340.00335
-3.9120.00324
-3.270.00314

106
3.8 Comparison of photocatalytic activity of N-TiO2 nanoparticles under
UV, VIS and Solar light irradiation
The photocatalytic activity of N-TiO2 catalyst was estimated by
measuring the decomposition rate and degradation percent of the dye under
sun light. All the experiments were performed on the days when the intensity
of sunlight was relatively high during the period between 11:15 am to 12:00
am during the days of August (summer season). It was noticed that N-TiO2
2.5% and 5% N-TiO2 achieved 94.5% and 91.1% degradation for methyl
orange within 15 minutes, while 7 % N doped TiO2 degraded about 92% of
methyl orange during 35 minutes.
Figure 3-49 shows photodegradation rate of methyl orange under sun light
and in presence of 2.5, 5, 7 % N-doped TiO2. This faster degradation rate of
methyl orange under sun light irradiation using N-doped TiO2 is attributed
mainly to the existence of about 5% UV light within the solar light in
addition to previous reported reasons in this thesis regarding N occurrence in
the photocatalyst powder.
Table 3-5: Thermodynamic parameters for the photocatalytic degradation of congo red
T (K) Ea (kJ mol−1) ∆G# (kJ mol−1) ∆H# (kJ mol−1) ∆S# (JK−1 mol−1)293 33.8 92.276 31.539 -207.907
298 93.893 31.318 -209.983
308 96.019 31.235 -210.337
318 98.737 31.332 -211.965

107
2.5% N-TiO2 was chosen as a comparison model for the photobleaching
under three UV, VIS and solar radiation sources. N doped TiO2 shows lower
photodegradation efficiency of methyl orange under UV light exposure as
compared to its efficiency under sun light or visible light by using halogen
lamp due to the faster recombination of electron–hole pair as a result of the
absorption characteristics caused by the N doping [131, 165]. Under UV
light irradiation, a large amount of electrons and holes were generated in
short time because the energy of UV irradiation is large compared to band
gap energy of the catalysts., meaning high recombination rate of electrons
and holes [31, 156]. N-TiO2 nanoparticles conferred significantly higher
photocatalytic activity under visible compared to UV light towards the
photocatalytic degradation of methyl orange. It is considered that nitrogen
modification is responsible for lowering the bandgap energy of N-TiO2
nanoparticles (red-shift of the energy band gap to the visible range),
y = 0.218x + 0.197R² = 0.957
y = 0.147x + 0.157R² = 0.977
y = 0.078x - 0.151R² = 0.980
-1
0
1
2
3
4
5
6
7
8
9
0 10 20 30 40
2.5% N-TiO2
5%N-TiO2
7%N-TiO2
lnC
o/Ct
Time,min
Figure 3-49: Degradation rate of methyl orange using different doping percents of
N-TiO2 under solar light
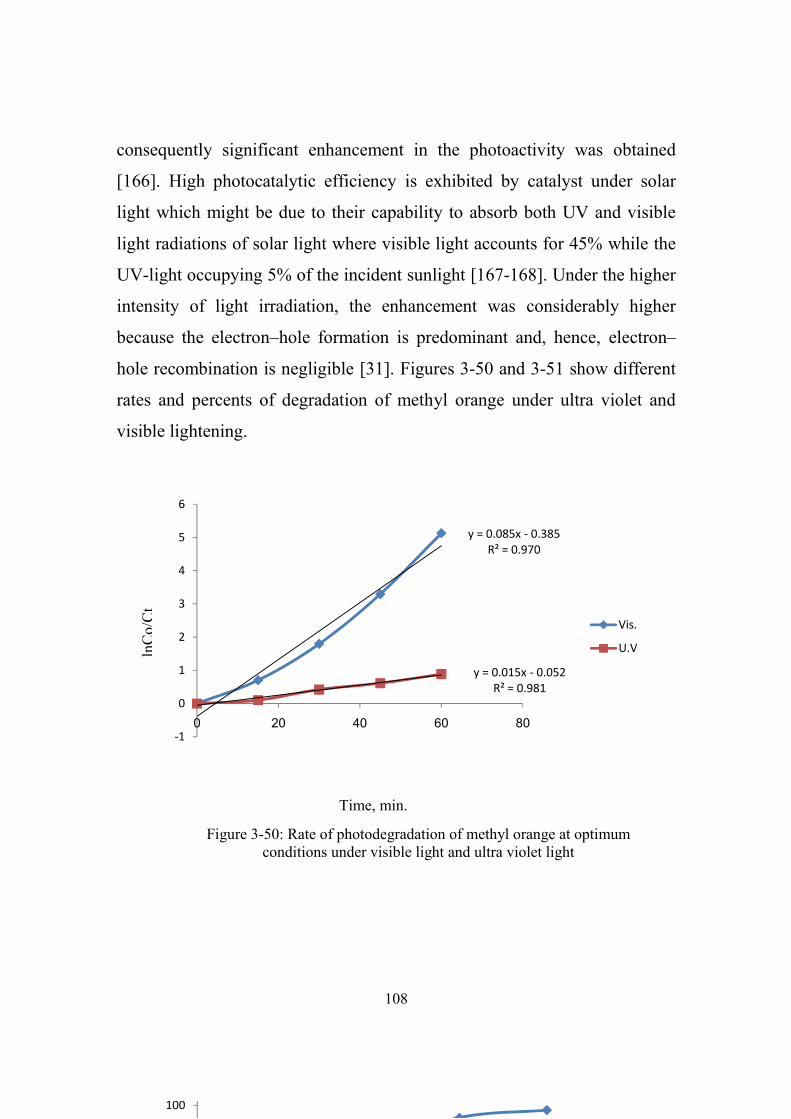
108
consequently significant enhancement in the photoactivity was obtained
[166]. High photocatalytic efficiency is exhibited by catalyst under solar
light which might be due to their capability to absorb both UV and visible
light radiations of solar light where visible light accounts for 45% while the
UV-light occupying 5% of the incident sunlight [167-168]. Under the higher
intensity of light irradiation, the enhancement was considerably higher
because the electron–hole formation is predominant and, hence, electron–
hole recombination is negligible [31]. Figures 3-50 and 3-51 show different
rates and percents of degradation of methyl orange under ultra violet and
visible lightening.
y = 0.085x - 0.385R² = 0.970
y = 0.015x - 0.052R² = 0.981
-1
0
1
2
3
4
5
6
0 20 40 60 80
Vis.
U.V
Time, min.
lnC
o/C
t
Figure 3-50: Rate of photodegradation of methyl orange at optimumconditions under visible light and ultra violet light
0
20
40
60
80
100
120
0 10 20 30 40 50 60 70
Vis.
U.V
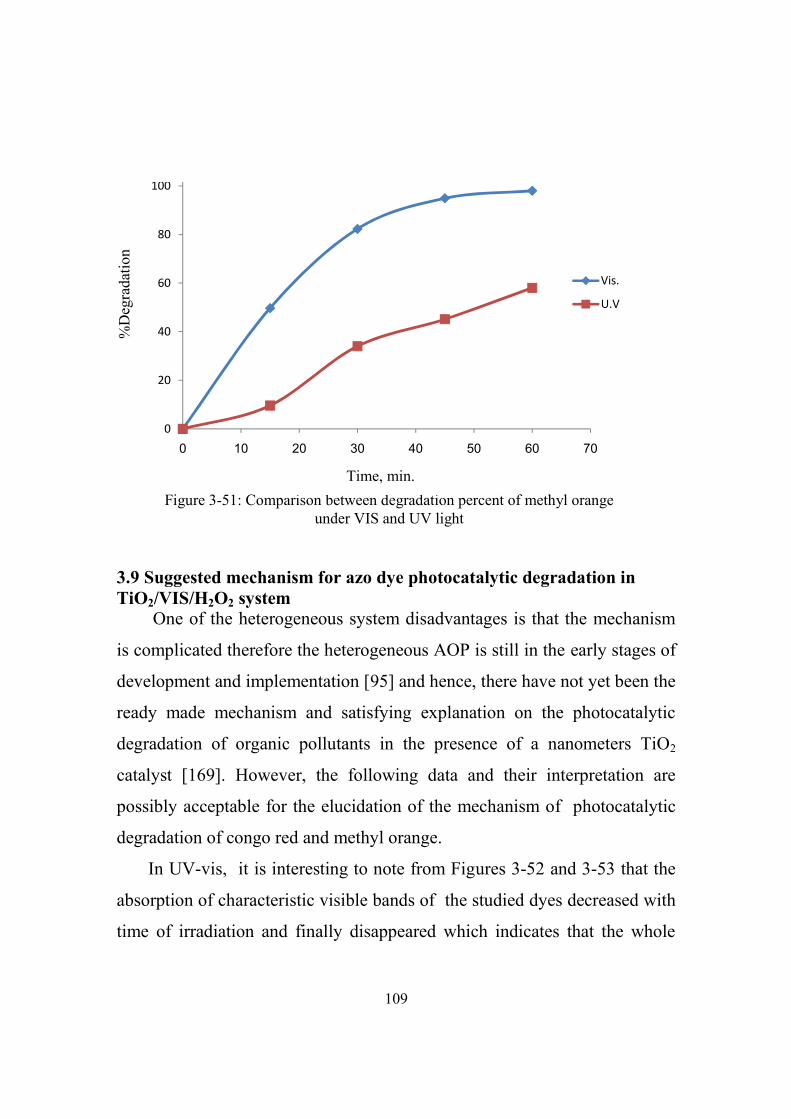
109
3.9 Suggested mechanism for azo dye photocatalytic degradation inTiO2/VIS/H2O2 system
One of the heterogeneous system disadvantages is that the mechanism
is complicated therefore the heterogeneous AOP is still in the early stages of
development and implementation [95] and hence, there have not yet been the
ready made mechanism and satisfying explanation on the photocatalytic
degradation of organic pollutants in the presence of a nanometers TiO2
catalyst [169]. However, the following data and their interpretation are
possibly acceptable for the elucidation of the mechanism of photocatalytic
degradation of congo red and methyl orange.
In UV-vis, it is interesting to note from Figures 3-52 and 3-53 that the
absorption of characteristic visible bands of the studied dyes decreased with
time of irradiation and finally disappeared which indicates that the whole
Figure 3-51: Comparison between degradation percent of methyl orangeunder VIS and UV light
Time, min.
0
20
40
60
80
100
120
0 10 20 30 40 50 60 70
Vis.
U.V
%D
egra
datio
n

110
dye in aqueous solution are degraded completely. Furthermore, no new
absorption bands appeared in either the visible or the UV spectra region.
The chromatograms of dyes are consistent dramatically with UV-VIS
Wavelength, nm
Abs
orba
nce
15 min30 min45 min60 min75 min90 min
Figure 3-53: UV-VIS spectra changes of congo red at varying times
Abs
orba
nce
Wavelength, nm
15 min30 min45 min60 min
Figure 3-52: UV-VIS spectra changes of methyl orange at varying times

111
The chromatograms of dyes are consistent dramatically with UV-VIS
results. Figures 3-54 and 3-55 report the HPLC profiles corresponding to
solutions of congo red and methyl orange degraded at zero time, half time
and full time of degradation, respectively. The chromatograms show clearly
the appearance of peaks corresponding to the by-products of the degradation
of the parent dye. As can be seen from Figures 3-56 and 3-57, the peaks of
parent dyes are disappeared and many new peaks of the intermediates are
appeared due to irradiation. At the end of illumination no peaks are
observed which indicates that the dyes are completely degraded.
The FTIR spectrum obtained from the azo dyes powder are shown in
Figures 3-56 and 3-57. Several bands can be distinguished in the region of
2000–1000 cm−1, which can be assigned as follows, the intense bands at
1519 cm−1(CR) and 1607 cm-1 (MO) are attributed to the –N=N– bond
vibrations or to aromatic ring vibrations sensitive to the interaction with the
azo bond [170]. The bands located at (1000-1300) cm-1 are assigned to S=O
stretching [170-171]. This distinctive bands disappear after irradiation of
dyes with appearance of new band at 2084 cm-1 for degraded MO and at
2093 cm-1for degraded CR which are attributed to N≡N group [172].
Simultaneously, there is a broad band above 3400 cm-1 for both degraded
dyes that is assigned to OH group [173].

112
(b)
(a)
(b)
(c)
Figure 3-54: HPLC chromatograms of CR degraded at (a) zero,(b) half time and (c) full time of irradiation.

113
(a)(a)
(b)
(b)
Figure 3-55: HPLC chromotograms of MO degraded at (a) zero, (b) half time and (c) fulltime of irradiation
(c)

114
dyes that is assigned to OH group [233].3438
2902
1607
1519
1367
1191
`
1121
1039
(a)
2084
16413431
(b)
Figure 3-56: FT-IR spectra of (a) pure methyl orange and (b) degraded methylorange

115
1585
1448
1361
1225
1178
1060
4365
642
(a)
3400
2093 1635
(b)
Figure 3-57: FT-IR spectra of (a) pure congo red and (b) degraded congo red

116
In order to broaden our insight on the degradation pathway of the dyes,
mass spectroscopic the analysis was conducted. Based upon the m/z values,
some intermediates have been identified and are presented in Figures 3-58
and 3-59.The degradation of MO is initiated, most by the probably, attack of.OH radicals resulting in aromatic substitution with hydroxyl group in acidic
medium to show a compound at 355 m/z. Some researchers [174-175] have
mentioned that there is a demethylation reaction which occurrsduring
degradation of methyl orange, therefore the product that has m/z = 327 may
be formed by cleaving a methyl group from the MO molecule. Further, there
are cleavage of azo bond and N-C bond to give rise other intermediates. The
progress of illumination would definitely results in further degradation of the
intermediates leading to lower molecular weight degradation products and
afterwards to complete mineralization. The possible species formed after
degradation of congo red suggest that the degradation of congo red follows
the cleavage of azo linkage and also the cleavage of various C-C and C-N
bonds of CR as a result of crucial effect of OH radical ending eventually
with evolution of CO2 and H2O [176]. The most possible and
photodegradation pathways for MO and CR are proposed as shown in
Figures 3-60 and 3-61, respectively.

117
Figure 3-58: Mass spectra of methyl orange after complete degradation
Figure 3-59: Mass spectra of congo red after complete degradation

118
m/z= 81
Figure 3-62: Proposed pathway for the photocatalyticdegradation of MO
++•OH+ H+
Demethylation
NHO3S
OH
NN
OHOH
CH3
CH3
HH
H+
NCH3
CH3
NN SO3
-
NHO3S
OH
NH3N
OHOHHH
S O 3 H
SO3H
(OH)4
CH3
N
NCH3
N+
N
NO
O
O
-O
C H 3CH 3
N+
SO3
O3SN
OH
NH+
CH3-CH2-COOH
CO2 +H2O
+
Low molecular weight degradation products such as
m/z= 147
m/z= 207
m/z= 353
m/z= 327
m/z= 221m/z= 281
m/z= 73
+•OH
+•OH+•OH+ SO3
-H
+•OH
+•OH
Cleavage of C-Nbond
H2SO3
m/z= 77

119
-خخ
Cleavage of C-Nbond
Cleavage of azobond
-NH2
+•OH
+•OH
N NN N
NH2NH2
SO3 SO3
- -
NNH
O
N+
NH3+
SO3H
SO3H
COOH
O
O H
Low molecular weight degradation products such as
CH3-CH2-COOH
CO2 +H2O
Figure 3-61: Proposed pathway for the photocatalytic degradationof CR
m/z= 73
m/z= 149
m/z= 207
m/z= 225
m/z= 95
m/z=133
+•OH
+•OH

120
3.10 Comparison and evaluation of photocatalytic degradation of
methyl orange and congo red azo dyes
Methyl orange and congo red showed high tendency to degrade at acidic
pH depending on the principle that supposed to occur strong adsorption
between titanium dioxide that carries positive charge at acidic medium and
anionic azo dyes [177]. Congo red needed more irradiation time compared
with that of methyl orange. This behavior mat be attributed to complicated
structure of congo red [17]. The high value of activation energy of congo red
compared with that of methyl orange means the degradation rate of CR is
slow and it requires longer time to decompose relative to methyl orange. In
other words there are large number of formed intermediates that result from
CR photocatalytic degradation. This explanation is in an accordance with
wheland principle [178, 179] of the stability of mechanism paths and
intermediates. Furthermore, The faster decolorization of monoazo dye than
diazo dye is another indication that, the number of azo and sulphonate
groups in the dye molecule may be a determining factor for increasing the
degradation rates [180]. Finally, although the final photo-mineralization
products of organic dyes are CO2, H2O and mineral acids, but the
photodegradation paths are not necessarily analogous as it is explictitly
illustrated illustrated with CR and MO model dye pollutants.
3.11 General ConclusionsXRD analysis of the synthesized N-doped TiO2 confirmed the neat
anatase phase without rutile diffraction peaks. Images of SEM showed
smooth and highly orderd surface. The excitation wavelength as determined
from the integrated sphere UV-VIS spectrometer located at 410 nm. EDX

121
measurement revealed the atomic composition of all samples consist of
nitrogen and titanium.
The impacts of many experimental parameters namely; initial solution
pH, azo dye initial concentration, N-TiO2 dosage and visible light intensity
on the photodegradation of MO and CR dyes have been evaluated. The
photocatalytic reaction is favored at relatively low photolysis solution pHs
(2.5), a high visible light intensity, 40-50 mg/l N-TiO2 dosages and 10-15
mg/l of initial dye concentrations.
Furthermore, the apparent quantum yield was also explicitly influenced by
photolysis solution pH, TiO2 dosage and initial dye concentration. Under
optimum operational conditions, the solar photodecomposition of methyl
orange attained better process rate and yield in comparison to the laboratory
outcomes.
The kinetics and thermodynamics of the photocatalytic bleaching of
both dyes employing N-TiO2 nanocatalyst have also been investigated. The
kinetics of the photocatalytic oxidation follows the well known Langmuir–
Hinshelwood model which demonstrates the pseudo first order within the
studied dye initial concentrations. The rate of the photocatalytic degradation
was enhanced by the addition of H2O2 as well. Hydroxyl radicals played an
appreciable role, other than O2 gas, in the photobleaching process indicating
the remarkable role of hydroxyl type chemistry mechanism in the process.
On the other hand, an increase of the temperature has exhibited a positive
impact on the kinetics of the process following the Arrhenius relation. The
activation energies of the degradation for methyl orange and congo red azo
dyes were found to be 25.8 and 33.7 kJ mol−1, respectively.
Plausible pathways for the degradation of the concerned dyes were
followed by HPLC, MS, NMR and FTIR. The photodegradation profile

122
houses several smaller aromatic and nitridated moieties as hydroxyl radical
initiated primary oxidation intermediates which eventually renders into
carbon dioxide and water.
3.12 SuggestionsIn the light of the present research work, several suggestions for the
future research activities can be reported:
1- Since the solar photocatalytic process has exhibited stimulating results, it
would suggest employing immobilized nano TiO2 units, for the
photodetoxification of organic dyes under solar irradiation.
2- The study of the photocatalytic decontamination of the persisting organic
pollutants in aqueous media together with computational authentication
could be an interesting extension of this work.
3- The noble metal, Pt, Ag and Au, doping methodology of nano TiO2
photocatalyst could also participate in the green chemistry strategy.
Accordingly, we consolidate such line of research work to be adopted for the
photomineralization of persisting organic moieties like poly aromatic
hydrocarbons (PAH) and azo pollutants.
4-Adoption of semiconductor sensitization by means of dyes and coupling
via other low band gap photocatalyst strategies could also be a good
progressive pace for future work research.

123
References
[1] X. Qu, P. J. J. Alvarez, Q. Li, "Applications of nanotechnology in water andwastewater treatment", Water Res. 47 ( 2013) 3931-3946.
[2] S.Singh, K. C. Barick, D. Bahadur, "Functional oxide nanomaterials andnanocomposites for the removal of heavy metals and dyes", Nanomater.Nanotechnol. 3 (2013) 1-19.
[3] F. Kiriakidou, D. I. Kondarides, X.E. Verykios, "The effect of operationalparameters and TiO2-doping on the photocatalytic degradation of azo-dyes"Catal. Today 54 (1999) 119–130.
[4] W. H. Calze, J. W. Kang, D. H. Chapin, "The chemistry of water treatmentprocesses involving ozone, hydrogen peroxide and ultraviolet radiation",Ozone Sci. Eng. 9 (1987) 355-352.
[5] M. Pelaeza, N. T. Nolan, S.C. Pillai, M. K. Seeryce, P. Falarasd, A. G.Kontosd, P. S. M.Dunlope, J. W. J. Hamilton, j. A. Byrnee, K. O'Sheaf, M. H.Entezaring, D. D. Dionysiou, "A review on the visible light active titaniumdioxide photocatalysts for environmental applications" Appl. Catal. B:Environ. 125 (2012) 331-349.
[6] R. Toor, M. Mohseni, "UV-H2O2 based AOP and its integration withbiological activated carbon treatment for DBP reduction in drinking water"Chemosphere 66 (2007) 2087-2095.
[7] B. Grote, "Application of advanced oxidation processes (AOP) in watertreatment" 37th Annual Qld Water Industry Operations Workshop (2012)17-23.
[8] A. Goi, "Advanced oxidation processes for water purification and soilremediation" Ph. D. thesis, Tallinn University Of Technology, 2005, pp. 15-16.
[9] U. I. Gaya, A. H. Abdullah, " Heterogeneous photocatalytic degradation oforganic contaminants over titanium dioxide: A review of fundamentals,progress and problems" J. Photochem. Photobiol., C: Photochem Rev. 9 (2008)1–12.
[10] M. I. Litter, " Heterogeneous photocatalysis Transition metal ions inphotocatalytic systems" Appl. Catal., B: Environ. 23 (1999) 89–114.
[11] S. Malato , P. F. Ibanez, M.I. Maldonado, J. Blanco , W. Gernjak, "Decontamination and disinfection of water by solar photocatalysis: Recentoverview and trends" Catal. Today 147 (2009) 1–59.
[12] A.R. Khataeea, M.B. Kasiri, " Photocatalytic degradation of organic dyes inthe presence of nanostructured titanium dioxide: Influence of the chemicalstructure of dyes" J. Mol. Catal. A: Chem. 328 (2010) 8–26.
[13] A. Houas, H. Lachheb, M. Ksibi, E. Elaloui, C. Guillard, J. M.Herrmann, " Photocatalytic degradation pathway of methylene blue in water"Appl. Catal., B: Environ. 31 (2001) 145–157.

124
[14] V.K. Gupta, Suhas, " Application of low-cost adsorbents for dye removal Areview" J. Environ. Manage. 90 (2009) 2313–2342.
[15] P. Bansal, D. Sud, " Photodegradation of commercial dye, Procion BlueHERD from real textile wastewater using nanocatalysts" Desalination 267(2011) 244–249.
[16] B. J. Bruschweiler, S. Kung, D. Burgi, L. Muralt, E. Nyfeler, "Identification of non-regulated aromatic amines of toxicological concernwhich can be cleaved from azo dyes used in clothing textiles" Regul.Toxicol. Pharm. 69 (2014) 263–272.
[17] Z. Zainal, L. K. Hui, M. Z. Hussein, Y. H. Taufiq-Yap, A. H. Abdullah, I.Ramli, " Removal of dyes using immobilized titanium dioxide illuminated byfluorescent lamps" J. Hazard. Mater. B 125 (2005) 113–120.
[18] M.A. Rauf, M.A. Meetani, S. Hisaindee, " An overview on the photocatalyticdegradation of azo dyes in the presence of TiO2 doped with selectivetransition metals" Desalination 276 (2011) 13–27.
[19] M. Isik, D. T. Sponza, " Fate and toxicity of azo dye metabolites under batchlong-term anaerobic incubations" Enzyme Microb. Technol. 40 (2007) 934–939.
[20] H. B. Mansour, D. Corroler, D. Barillier, K. G. L. Chekir, R. Mosrati, "Evaluation of genotoxicity and pro-oxidant effect of the azo dyes: Acidsyellow17, violet 7 and orange 52, and of their degradation products byPseudomonas putida mt-2" Food Chem. Toxicol. 45 (2007) 1670–1677.
[21] M. A. Rauf, S. S. Ashraf, " Fundamental principles and application ofheterogeneous photocatalytic degradation of dyes in solution" Chem. Eng. J.151 (2009) 10–18.
[22] J. Saien, A.R. Soleymani " Degradation and mineralization of Direct Blue71 in a circulating upflow reactor by UV/TiO2 process and employing a newmethod in kinetic study" J. Hazard. Mater. 144 (2007) 506–512.
[23] C. C. Hsueh, B. Y. Chen, "Exploring effects of chemical structure on azo dyedecolorization characteristics by Pseudomonas luteola" J. Hazard. Mater. 154(2008) 703–710.
[24] H. Lachheb, E. Puzenat, A. Houas, M. Ksibi, Elimame Elaloui, C.Guillard, J. M. Herrmann, "Photocatalytic degradation of various types ofdyes (Alizarin S, Crocein Orange G, Methyl Red, Congo Red, MethyleneBlue) in water by UV-irradiated titania" Appl. Catal., B: Environ. 39 (2002)75–90.
[25] V. Augugliaro, C. Baiocchi, A. B. Prevot, E. G. Lopez, V. Loddo, S.Malato, G. Marci, L. Palmisano, M. Pazzi, E. Pramauro. "Azo-dyesphotocatalytic degradation in aqueous suspension of TiO2 under solarirradiation" Chemosphere 49 (2002) 1223–1230.
[26] S. M. Tsui, W. Chu "The reaction mechanisms and kinetics of removing azoreactive dye by indirect photolysis approaches"Water Environ. Res 74 (2002) 488-493.

125
[27] I. K. Konstantinou, T. A. Albanis, " TiO2-assisted photocatalytic degradationof azo dyes in aqueous solution: kinetic and mechanistic investigations Areview" Appl. Catal., B: Environ. 49 (2004) 1–14.
[28] M. A. Fox, M. T. Dulay, "Heterogeneous photocatalysis", Chem. Rev. 93(1993) 341-357.[29] K. S. Yu, J. Y. Shi, Z. l. Zhang, Y. M. Liang, W. Liu, " Synthesis,
characterization, and photocatalysis of ZnO and Er-doped ZnO" J. Nanomater.Article ID 372951 (2013) 1-6.
[30] W. Yaoa, X. Songa, C. Huangb, Q. Xua, Q. Wu, " Enhancing solar hydrogenproduction via modified photochemical treatment of Pt/CdS photocatalyst"Catal. Today 199 (2013) 42– 47.
[31] B. Neppolian, H.C. Choi, S. Sakthive, B. Arabindoo, V. Murugesan, "Solar/UV-induced photocatalytic degradation of three commercial textiledyes" J. Hazard. Mater. B89 (2002) 303–317.
[32] G. C. Lakshmi1, S. Ananda, R. Somashekar, " Semiconductor-assistedphotodegradation of dye and pesticide by ZnO: Ru and ZnO/RuO2/AgOnanocomposites, synthesised by electrolytic method" Int. J. Ad. Sci.Technol. 5 (2012) 40-53.
[33] B. Pant, H. R. Pant, M. Park, Y. Liu, J. W. Choi, " Electrospun CdS–TiO2doped carbon nanofibers for visible-light-induced photocatalytic hydrolysis ofammonia borane" Catal. Commun. 50 (2014) 63–68.
[34] L. Fass, " Imaging and cancer: A review" Mol. Onol. 2 (2008) 115–152.[35] M. B. Radoicic, I. A. Jankovic, V. N. Despotovic, D. V. Sojic, Tatjana D.
Savic, Zoran V. Saponjic, B. F. Abramovic, M. I. Comora, " The role ofsurface defect sites of titania nanoparticles in the photocatalysis: aging andmodification" Appl. Catal., B: Environ.138– 139 (2013) 122– 127.
[36] S. Rehman, R. Ullah, A. M. Butt, N. D. Gohar, " Strategies of making TiO2and ZnO visible light active" J. Hazard. Mater. 170 (2009) 560–569.
[37] D. Chatterjee, S. Dasgupta, " Visible light induced photocatalyticdegradation of organic pollutants" J. Photochem. Photobiol., C: Photochem.Rev. 6 (2005) 186–205.
[38] J. Zhao, C. Chen, W. Ma, " Photocatalytic degradation of organic pollutantsunder visible light irradiation" Top. Catal. 35 (2005) 269-278.
[39] H. Parka, Y. Parkb, W. Kimb, W. Choib, " Surface modification of TiO2photocatalyst for environmental applications" J. Photoch. Photobiol. C:Photochem. Rev. 15 (2013) 1– 20.
[40] B. Basheer, D. Mathew, B. K. George, C.P. R. Nair, " An overview on thespectrum of sensitizers: The heart of dye sensitized solar cells" Sol. Energy108 (2014) 479–507.
[41] C. Y. Chien, B. D. Hsu, " Optimization of the dye-sensitized solar cell withanthocyanin as photosensitizer" Sol. Energy 98 (2013) 203–211.
[42] M. Tahir, N. S. Amin, " Advances in visible light responsive titaniumoxide- based photocatalysts for CO2 conversion to hydrocarbon fuels" Energy

126
Convers. Manage.76 (2013) 194–214.[43] G. S. Mital, T. Manoj, " A review of TiO2 nanoparticles" Chinese Sci.
Bull. 56 (2010) 1639–1657.[44] A. Matsuda, S. Sreekantan, W. Krengvirat, " Well-aligned TiO2 nanotube
arrays for energy-related applications under solar irradiation" J. AsianCeramic Societies 1 (2013) 203–219.
[45] Y. Bessekhouad, D. Robert, J.V. Weber, " Bi2S3/TiO2 and CdS/TiO2heterojunctions as an available configuration for photocatalytic degradationof organic pollutant" J. Photoch. Photobiol. A: Chem.163 (2004) 569–580.
[46] R.M. Mohamed, D.L. McKinney, W. M. Sigmund, "Enhanced nanocatalysts"Mater. Sci. Eng., R 73 (2012) 1-13.
[47] K. Nishijima, B. Ohtani, X. Yan, T. a. Kamai, T. Chiyoya, T. Tsubota, N.Murakami, T. Ohno, " Incident light dependence for photocatalyticdegradation of acetaldehyde and acetic acid on S-doped and N-doped TiO2photocatalysts" Chem. Phys. 339 (2007) 64–72.
[48] R. Marschall, L. Wang, " Non-metal doping of transition metal oxides forvisible-light photocatalysis" Catal. Today 225 (2014) 111– 135.
[49] D. W. Kwon, P. W. Seo, G. J. Kim, S. C. Hong, "Characteristics of theHCHO oxidation reaction over Pt/TiO2 catalysts at room temperature: Theeffect of relative humidity on catalytic activity" Appl. Catal., B: Environ.163 (2015) 436–443.
[50] Q. Huang, T. Gao, F. Niu, D. Chen, Z. Chen, L. Q, X. Sun, Y. Huang, K.Shu, "Preparation and enhanced visible-light driven photocatalytic propertiesof Au-loaded TiO2 nanotube arrays" Superlattices Microstruct. 75 (2014)890–900.
[51] M. Ni, M. K. H. Leung, D. Y. C. Leung, K. Sumathy, "A review and recentdevelopments in photocatalytic water-splitting using TiO2 for hydrogenproduction" Renewable and Sustainable Energy Reviews 11 (2007) 401–425.
[52] A. L. Linsebigler, G. Lu. J. T. Yastes, Jr, " Photocatalysis on TiO2 surfaces:principles, mechanisms, and selected results" Chem. Rev. 95 (1995) 735-758.
[53] S. G. Kumar, L. G. Devi, " Review on modified TiO2 photocatalysis underUV/Visible light: selected results and related mechanisms on interfacialcharge carrier transfer dynamics" J. Phys. Chem. A 115 (2011) 13211–13241.
[54] E. J. Park, B. Jeong, M. G. Jeong, Y. D. Kim " Synergetic effects ofhydrophilic surface modification and N-doping for visible light response onphotocatalytic activity of TiO2" Current Appl. Phys. 14 (2014) 300-305.
[55] A. Subrahmanyam, K. P. Biju, P. Rajesh, K. J. Kumar, M. R. Kiran,"Surface modification of sol-gel TiO2 surface with sputtered metallic silver
for Sun light photocatalytic activity: Initial studies" Sol. Energy Mater. Sol.Cells 101 (2012) 241–248.
[56] Y. K. Laia, J. Y. Huang, H. F. Zhanga, V. P. Subramaniam, Y. X. Tang,D. G. Gong, L. Sundar, L. Sun, Z. Chen, C. J. Lin, "Nitrogen-doped TiO2nanotube array films with enhanced photocatalytic activity under various

127
light sources" J. Hazard. Mater. 184 (2010) 855-863.[57] W. X. Liu, P. Jiang, W. N. Shao, J. Zhang, W. B. Cao, "A novel approach
for the synthesis of visible-light-active nanocrystalline N-doped TiO2photocatalytic hydrosol" Solid-State Sci. 33 (2014) 45-48.
[58] R. Asahi, T. Morikawa, T. Ohwaki, K. Aoki, Y. Taga, "Visible-lightphotocatalysis in nitrogen-doped titanium oxides" Sci 293 (2001) 269-271.
[59] D. Mitoraj, "Origin of visible light activity in urea modified titaniumdioxide" Ph.D thesis, Alexander university (2009) pp. 18-19.
[60] C. M. Teh, A. R. Mohamed, "Roles of titanium dioxide and ion-dopedtitanium dioxide on photocatalytic degradation of organic pollutants(phenolic compounds and dyes) in aqueous solutions: A review" J. AlloysCompd. 509 (2011) 1648–1660.
[61] L. Jinlong, M. Xinxin, S. Mingren, X. Li, S. Zhenlun, "Fabrication ofnitrogen-doped mesoporous TiO2 layer with higher visible photocatalyticactivity by plasma-based ion implantation" Thin Solid Films 519 (2010) 101–105.
[62] J. Xu, F. Wang, W. Liu, W. Cao, "Nanocrystalline N-doped TiO2 Powders:mild hydrothermal synthesis and photocatalytic degradation of phenol undervisible light irradiation" Int. J. Photoenergy (2013) Article ID 616139.
[63] M. Factorovich, L. Guz, R. Candal1, "N-TiO2: Chemical Synthesis andPhotocatalysis" Adv. Phys. Chem. (2011) Article ID 821204.
[64] J. Yuan, M. Chen, J. Shi,W. Shangguan, "Preparations and photocatalytichydrogen evolution of N-doped TiO2 from urea and titanium tetrachloride"Int. J. Hydrogen Energy 31 (2006) 1326 – 1331.
[65] A. Zaleska, "Doped-TiO2: A Review" Recent Patents on Engineering 2(2008) 157-164.
[66] M. J. Powell, C. W. Dunnill, I. P. Parkin, "N-doped TiO2 visible lightphotocatalyst films via a sol–gel route using TMEDA as the nitrogen source"J. Photochem. Photobiol. A: Chem. 281 (2014) 27–34.
[67] F. Peng, L. Cai, H. Yu, H. Wang, J. Yang, "Synthesis and characterization ofsubstitutional and interstitial nitrogen-doped titanium dioxides with visiblelight photocatalytic activity" J. Solid State Chem. 181 (2008) 130–136.
[68] C. Di Valentin, E. Finazzi, G. Pacchioni, A. Selloni, S. Livraghi, M. C.Paganini, E. Giamello, "N-doped TiO2: Theory and experiment" Chem. Phys.339 (2007) 44–56.
[69] Q. Wu, W. Li, D. Wang, S. Liu, "Preparation and characterization of N-doped visible-light-responsive mesoporous TiO2 hollow spheres" Appl. Surf.Sci. 299 (2014) 35–40.
[70] G. Yang, Z. Jiang, H. Shi, T. Xiao, Z. Yan, "Preparation of highly visible-light active N-doped TiO2 photocatalyst" J. Mater. Chem. 20 (2010) 5301–5309.
[71] N. T. Nolan, D. W. Synnott, M. K. Seery, S. J. Hinder, A. V.Wassenhoven, S. C. Pillai, "Effect of N-doping on the photocatalytic

128
activity of sol–gel TiO2" J. Hazard. Mater. 211-212 (2012) 88– 94.[72] Z. Zhang, J. Long, X. Xie, H. Zhuang, Y. Zhou, H. Lin, R. Yuan, W. Dai,
Z. Ding, X. Wang, X. Fu, "Controlling the synergistic effect of oxygenvacancies and N dopants to enhance photocatalytic activity of N-doped TiO2by H2 reduction" Appl. Catal., A: Gen. 425– 426 (2012) 117– 124.
[73] V. N. Kuznetsov, N. Serpone, "Visible light absorption by various titaniumdioxide specimens" J. Phys. Chem. B 110 (2006) 25203-25209.
[74] N. Serpone, "Is the band gap of pristine TiO2 narrowed by anion- andcation-doping of titanium dioxide in second-generation photocatalysts?" J.Phys. Chem. B 110 ( 2006) 24287-24293.
[75] D. A. Ward, E. I. KO, "Preparing catalytic materials by the sol-gelmethod" Ind. Eng. Chem. Res. 34 (1996) 421-433.
[76] O. J. d. Lima, A. T. Papacidero, L. A. Rocha, H. C. Sacco, E. J. Nassar, K.J. Ciuffi, L. A. Bueno, Y. Messaddeq, S. J. L. Ribeiro, "Sol–gel entrapped
cobalt complex" Mater. Charact. 50 (2003) 101– 108.[77] V. Lafond, P.H. Mutin, A. Vioux, "Non-hydrolytic sol–gel routes based on
alkyl halide elimination: toward better mixed oxide catalysts and newsupports application to the preparation of a SiO2–TiO2 epoxidation catalyst"J. Mol. Catal. A: Chem. 182–183 (2002) 81–88.
[78] O. Carp, C.L. Huisman, A. Reller, "Photoinduced reactivity of Titaniumdioxide" Prog. Solid State Chem. 32 (2004) 33–177.
[79] F. Barbieri, D. Cauzzi, F. D. Smet, M. Devillers, P. Moggi, G. Predieri, P.Ruiz, "Mixed-oxide catalysts involving V, Nb and Si obtained by a non-hydrolytic sol–gel route: preparation and catalytic behaviour in oxidativedehydrogenation of propane" Catal. Today 61 (2000) 353–360.
[80] S. Rudiger, U. Grob, E. Kemnitz, "Non-aqueous sol–gel synthesis of nano-structured metal fluorides" J. Fluorine Chem. 128 (2007) 353–368.
[81] J. Livage, F. Beteille, C. Roux, M. Chatry, P. Davidson, "Sol-gel synthesisof oxide materials" Acta. mater. 46 (1998) 743-750.
[82] L. Bourget, R. J. P. Corriu, D. Leclercq, P. H. Mutin, A. Vioux, "Non-hydrolytic sol-gel routes to silica" J. Non-Cryst. Solids 242 (1998) 81-91
[83] A.B. Kashyout, M. Soliman, M. Fathy, "Effect of preparation parameters onthe properties of TiO2 nanoparticles for dye sensitized solar cells"Renewable Energy 35 (2010) 2914-2920.
[84] Damien P. Debecker, Vasile Hulea, P. Hubert Mutin, "Mesoporous mixedoxide catalysts via non-hydrolytic sol–gel: A review" Appl. Catal., A: Gen.451 (2013) 192– 206.
[85] U.G. Akpan, B.H. Hameed, "The advancements in sol-gel method ofdoped-TiO2 photocatalysts" Appl. Catal. A: General 375 (2010) 1–11.
[86] W. Bahnemann, M. Muneer, M.M. Haque, "Titanium dioxide-mediatedphotocatalysed degradation of few selected organic pollutants in aqueoussuspensions" Catal. Today 124 (2007) 133–148.
[87] H. Kim, H. Y. Yoo, S. Hong, S. Lee, S. Lee, B. S. Park, H. Park, C. Lee, J.

129
Lee, "Effects of inorganic oxidants on kinetics and mechanisms of WO3-mediated photocatalytic degradation" Appl. Catal., B: Environ. 162 (2015)
515–523.[88] H. C Liang, X. Z. Li, Y. H. Yang, K. H. Sze, "Effects of dissolved oxygen,
pH, and anions on the 2,3-dichlorophenol degradation by photocatalyticreaction with anodic TiO2 nanotube films" Chemosphere 73 (2008) 805–812.
[89] U. G. Akpan, B. H. Hameed, "Parameters affecting the photocatalyticdegradation of dyes using TiO2-based photocatalysts: A review" J. Hazard.Mater. 170 (2009) 520–529.
[90] M. Y. Ghaly, J. Y. Farah, A. M. Fathy, "Enhancement of decolorization rateand COD removal from dyes containing wastewater by the addition ofhydrogen peroxide under solar photocatalytic oxidation" Desalination 217
(2007) 74–84.[91] X. R. Xu, X. Z. Li, "Degradation of azo dye Orange G in aqueous solutions
by persulfate with ferrous ion" Sep. Purif. Technol. 72 (2010) 105–111.[92] M. C. Yeber, L. Diaz, J. Fernindez, "Catalytic activity of the SO4
.- radicalfor photodegradation of the azo dye Cibacron Brilliant Yellow 3 and 3,4-dichlorophenol: Optimization by application of response surfacemethodology" J. Photochem. PhotobiolA: Chem. 215 (2010) 90–95.
[93] J. B. Galvez, S. M. Rodraguez, "Solar detoxification" Published by theUnited Nations Educational, Scientific and Cultural Organization, India(2003) pp 86-88.
[94] C. G. Hatchard, C. A. Parker, "A new sensitive chemical actinometer. II.potassium ferrioxalate as a standard chemical actinometer" Math. Phys. Sci.235 (1956) 518-536.
[95] A. A. Hussain, " Photocatalytic oxidation of phenol red on nanocrystallineTiO2 particles" M.Sc. thesis, AL-Nahrain university (2014) pp.14 ,27, 78.
[96] A. H. Alwash, " Preparation and characterization of zeolite y – basedcatalyst for sonocatalytic degradation of organic dyes in water" Ph.D thesis,Sains Malaysia University (2013) pp. 65.
[97] S. K. Kansal, M. Singh, D. Sud, "Studies on photodegradation of twocommercial dyes in aqueous phase using different photocatalysts" J. Hazard.Mater. 141 (2007) 581–590.
[98] A. A. M. Prabhu, G. Venkatesh, R. K. Sankaranarayanan, S.Siva, N.Rajendiran. "Azonium-ammonium tautomerism and inclusion complexation
of 4-amino-2',3 dimethylazobenzene" Indian. J. Chem. (2010) 407-417.[99] Sandeep Keshari Bhoi, "Adsorption charecterstics of congo red dye onto pac
and gac based on S/N ratio: a taguchi approach" National Institute ofTechnology, Rourkela, Bachelor Project (2010) pp. 10-11.
[100] E. Pioorsch, A. Elhaddaou S. Turrixll, "Spectroscopic study of pH andsohrent effects on the structure of Congo red and its binding mechanism to
amyloid-like proteins" Spectrochim. Acta., 50 (1994) 2145-2152.[101] J. Ananpattarachai, P. Kajitvichyanukul, S. Seraphin, " Visible light
130
absorption ability and photocatalytic oxidation activity of various interstitialN-doped TiO2 prepared from different nitrogen dopants" J. Hazard.Mater.168 (2009) 253–261.
[102] W. Guo, Y. Shen, G. Boschloo, A. Hagfeldt, T. Ma, " Influence of nitrogendopants on N-doped TiO2 electrodes and their applications in dye-sensitizedsolar cells" Electrochim. Acta 56 (2011) 4611–4617.
[103] L. Sun, J. Cai, Q. Wu, P. Huang, Y. Su, C. Lin, " N-doped TiO2 nanotubearray photoelectrode for visible-light-induced and photoelectrocatalyticactivities" Electrochim. Acta 108 (2013) 525– 531.
[104] V. J. Babu, M. K. Kumar, A. S. Nair, T. L. Kheng, S. I. Allakhverdiev, S.Ramakrishna, "Visible light photocatalytic water splitting for hydrogenproduction from N-TiO2 rice grain shaped electrospun nanostructures" Inter.J. hydrogen energy 37 (2012) 8897-8904.
[105] H. Sun, Y. Bai, W. Jin, N. Xu, "Visible-light-driven TiO2 catalysts dopedwith low-concentration nitrogen species" Sol. Energy Mater. Sol. Cells 92(2008) 76–83.
[106] K. M. Parida, S. Pany, B. Naik, "Green synthesis of fibrous hierarchicalmeso macroporous N doped TiO2 nanophotocatalyst with enhancedphotocatalytic H2 production" Int. J. Hydrogen energy 38 (2013) 3545-3553.
[107] M. Xiaoqi, L. Lianqiang, Z. Kaishun, L. Juncheng, " The effect of SiO2 onTiO2 up-conversion photoluminescence film" Opt. Mater. 37 (2014) 367–370.
[108] J. Jayabharathi, C. Karunakaran, V. Thanikachalam, P. Ramanathan"Binding and fluorescence enhancing behaviour of phenanthrimidazolewith different phases of TiO2" New J. Chem. 38 (2014) 432-4335.
[109] S. G. Ghugal, S. S. Umare, R. Sasikala, " Enhanced photocatalytic activityof TiO2 assisted by Nb, N and S multidopants" Mater. Res. Bull. 61 (2014)298–305.
[110] J. Senthilnathan, Ligy Philip " Photocatalytic degradation of lindane underUV and visible light using N-doped TiO2" Chem. Eng. J. 161 (2010) 83–92.
[111] A. I. Gusev, S.V. Rempel, "X-Ray diffraction study of the nanostructureresulting from decomposition of (ZrC) (NbC) solid solutions, Inorg. Mater.39 (2003) 43-47.
[112] J. Fan, Z. Zhao, J. Wang, L. Zhu, " Synthesis of Cr, N-codoped titaniananotubes and their visible-light-driven photocatalytic properties" Appl.Surf. Sci.324 (2015) 691–697.
[113] S. Hu, A. Wang, X. Li , H. Lowe, " Hydrothermal synthesis of well-dispersed ultra fine N-doped TiO2 nanoparticles with enhancedphotocatalytic activity under visible light" J. Phys. Chem. Solids 71 (2010)156–162.
[114] P. Guo, X. Wang, H. Guo , "TiO2/Na-HZSM-5 nano-compositephotocatalyst: Reversible adsorption by acid sites promotes photocatalyticdecomposition of methyl orange" Appl. Catal. B: Environmental 90 (2009)

131
677–687.[115] S. Parra ,J. Olivero, C. Pulgarin, "Relationships between physicochemical
properties and photoreactivity of four biorecalcitrant phenylurea herbicidesin aqueous TiO2 suspension" Appl. Catal. B: Environmental 36 (2002) 75–85.
[116] H. X. Guo, K. L. Lin, Z. S. Zheng, F. B. Xiao, S. X. Li, " Sulfanilic acid-modified P25 TiO2 nanoparticles with improved photocatalytic degradationon Congo red under visible light" Dyes and Pigments 92 (2012) 1278-1284.
[117] M. Movahedi, A. R. Mahjoub, S. J. Darzi "Photodegradation of congo redin aqueous solution on ZnO as an alternative catalyst to TiO2" J. Iran. Chem.Soc.6 (2009) 570-577.
[118] J. Wanga, T. Ma, Z. Zhang, X. Zhang, Y. Jiang, Z. Pan, F. Wen, P. Kang,P. Zhang, "Investigation on the sonocatalytic degradation of methyl orangein the presence of nanometer anatase and rutile TiO2 powders andcomparison of their sonocatalytic activities" Desalination 195 (2006) 294–305.
[119] A. K. Mohammed, K. T. Mekenzie, "Photocatalytic degradation of ChicagoSky Blue 6B and Benzopurpurin 4B using titanium dioxide thin film" J.Environ. Sci. 17 (2005) 869-872.
[120] J. Mitrović, M. Radović, D. Bojić, T. Anđelković, M. Purenović, A. Bojić," Decolorization of the textile azo dye Reactive Orange 16 by the UV/H2O2process" J. Serb. Chem. Soc. 77 (4) (2012) 465–481.
[121] B. Neppolian, H.C. Choi, S. Sakthivel, B. Arabindoo, V. Murugesan,"Solar light induced and TiO2 assisted degradation of textile dye reactiveblue 4" Chemosphere 46 (2002) 1173–1181.
[122] M. Nikazar, K. Gholivand, K. Mahanpoor, " Photocatalytic degradation ofazo dye Acid Red 114 in water with TiO2 supported on clinoptilolite as acatalyst" Desalination 219 (2008) 293–300.
[123] N. Daneshvar, S. Aber, M. S. Seyed Dorraji, A. R. Khataee, and M. H.Rasoulifard, "Preparation and investigation of photocatalytic properties ofZnO nanocrystals: effect of operational parameters and kinetic study" Int. J.Chem. Nuclear, Metallurgical Mater. Eng.1 (2007) 1-6.
[124] N. A. Jamalluddin, A. Z. Abdullah, "Reactive dye degradation bycombined Fe(III)/TiO2 catalyst and ultrasonic irradiation: Effect of Fe(III)loading and calcination temperature" Ultrason. Sonochem. 18 (2) (2010)669-678.
[125] J. Q Chen, D. Wang, M. X Zhu, C. J. Gao, "Photocatalytic degradation ofdimethoate using nanosized TiO2 powder" Desalination 207 (2007) 87–94.
[126] Z. Sun , Y. Chen, Q. Ke, Y. Yang, J. Yuan, "Photocatalytic degradation ofcationic azo dye by TiO2/bentonite nanocomposite" J. Photochem.Photobiol. A: Chem.149 (2002) 169–174.
[127] M. A. Quiroz, E. R. Bandala, C. A. Martinez-Huitle, "Advanced oxidationprocesses (AOPs) for removal of pesticides from aqueous media" Published

132
by Intech, China (2011) pp 692-694.[128] M. A. Rauf, S. S. Ashraf, "Radiation induced degradation of dyes-An
overview" J. Hazard. Mate.166 (2009) 6-16.[129] M. R. Hoffmann, S. T. Martin, W. Choi, D. W. Bahnemann,
"Environmental applications of semiconductor photocatalysis" Chem. Rev.95 (1995) 69-96.
[130] L. Xu, J. Wang, "A heterogeneous Fenton-like system with nanoparticulatezero-valent iron for removal of 4-chloro-3-methyl phenol" J. Hazard. Mate.186 (2011) 256-264.
[131] R. Chauhan , A. Kumar , R. P. Chaudhary, "Structural andphotocatalytic studies of Mn doped TiO2 nanoparticles" SpectrochimicaActa Part A: Molecular and Biomolecular Spectroscopy 98 (2012) 256–264.
[132] S. Yanga, P. Wang, X. Yang, L. Shan, W. Zhang, X. Shao, Rui Niu,"Degradation efficiencies of azo dye Acid Orange 7 by the interaction of
heat, UV and anions with common oxidants: Persulfate, peroxymonosulfateand hydrogen peroxide" J. Hazard. Mater. 179 (2010) 552–558.
[133] V. Augugliaro, C. Baiocchi, A. B. Prevot, E. G. Lopez, V. Loddo, S.Malato, G. Marci, L. Palmisano, M. Pazzi, E. Pramauro, " Azo-dyesphotocatalytic degradation in aqueous suspension of TiO2 under solarirradiation" Chemosphere 49 (2002) 1223–1230.
[134] S. Irmak, E. Kusvuran, O. Erbatur, "Degradation of 4-chloro-2-methylphenol in aqueous solution by UV irradiation in the presence oftitanium dioxide" Appl. Catal., B: Environ.54 (2004) 85–91.
[135] R. S.Thakur, R. Chaudhary, C. Singh, "Fundamentals and applications ofthe photocatalytic treatment for the removal of industrial organic pollutantsand effects of operational parameters: A review" J. Renew SustainableEnergy 2 (2010) 1-37.
[136] Y. Bayat, F. Hajighasemali, M. Zarandi, " Novel approach trough TADBdebenzylation by application of potassium bromate and cerium (IV)ammonium nitrate (CAN)" Am. J. Chem. Appl. 2 (2015) 28-31.
[137] Y. N. Tan, C. L. Wong, A. R. Mohamed, "An overview on thephotocatalytic activity of nano-doped-TiO2 in the degradation of organicpollutants" isrn mater. sci.(2011) 1-18.
[138] A. D. Paolaa, E. G. López,, G. Marcì, L. Palmisano, "A survey ofphotocatalytic materials for environmental remediation" J. Hazard Mater.211– 212 (2012) 3– 29.
[139] Swati, Munesh, R. C. Meena, " Photocatalytic degradation of textile dyethrough an alternative photocatalyst methylene blue immobilized resindowex 11 in presence of solar light " Archives Appl. Sci. Research, 4 (1):(2012) 472-479.
[140] R.C. Meena, R. B. Pachwarya, V. K. Meena, S. Arya, "Degradation oftextile dyes ponceau-s and sudan iv using recently developed photocatalyst,immobilized resin dowex-11" Am. J. Environ. Sci. 5 (2009) 444-450.

133
[141] C. Mathivathana, V. Balasubramanian, K. Pandian, "The influence of theoxidizing agents on the rates of degradation of Rose bengal using titaniumoxide nanoparticles" Elixir Dye Chem. 56 (2013) 13510-13518.
[142] E. M. Saggioro, A. S. Oliveira, T. Pavesi, C. G. Maia, L. F. V. Ferreira, J. C. Moreira "Use of titanium dioxide photocatalysis on the remediation ofmodel textile wastewaters containing azo dyes" Molecules 16 ( 2011) 10370-
10386.[143] S. N. H. B. Yahya, "Solar photocatalytic degradation of textile dye direct
blue 86 in ZnO suspension" Bachelor project University of TeknologiPetronas (2013) 1-57 p.23.
[144] S. Moziaa, A. W. Morawski, M. Toyoda, M. Inagaki, " Application ofanatase-phase TiO2 for decomposition of azo dye in a photocatalyticmembrane reactor" Desalination 241 (2009) 97-105.
[145] J. C. Garcia, J. L. Oliveira, A.E.C. Silva, C.C. Oliveira, J. Nozaki , N.E. deSouza "Comparative study of the degradation of real textile effluents byphotocatalytic reactions involving UV/TiO2/H2O2 and UV/Fe+2/H2O2systems" J. Hazard. Mater. 147 (2007) 105–110.
[146] S. M. Ghoreishian, K. Badii, M. Norouzi, A. Rashidi, M. Montazer, M.Sadeghi, M. Vafaee, " Decolorization and mineralization of an azo reactivedye using loaded nano-photocatalysts on spacer fabric: Kinetic study andoperational factors" J. Taiwan. Inst. Chem. Eng. 45 (2014) 2436–2446.
[147] K. hezrianjoo, H. Revanasiddappa "Langmuir-hinshelwood kineticexpression for the photocatalytic degradation of metanil yellow aqueoussolutions by ZnO catalyst" Chem. Sci. J. Vol. 2012: CSJ-85.
[148] C. Oprea, P. Panait, J. Lungu, D.Stamate, A. Dumbravs,F. Cimpoesu, M. A. Gîruu, "DFT study of binding and electron transferfrom a metal-free dye with carboxyl, hydroxyl, and sulfonic anchors to atitanium dioxide nanocluster" Int. J. Photoenergy Article ID 893850 (2013)1-15.
[149] P. Atkins, J. D. Paula, "Atkins' Physical Chemistry" 8 edition (2006) PP.877-880.
[150] A. L. Gupta, "Photochemistry" Published by Pragati Prakashan, India 5edition (2011) pp. 63-66.
[151] N. Serpone, A. Salinaro, "Terminology, relative photonic efficiencies andquantum yields in heterogeneous photocatalysis. Part I: Suggested Protocol"Pure. Appl. Chem. 71 (1999) 303–320.
[152] F. Machuca, J. C. Márquez, M. Mueses, " Determination of quantum yieldin a heterogeneous photocatalytic system using a fitting-parameters model"J. Adv. Oxid. Technol. 11 (2008) 1-8.
[153] A. Mills, S. L. Hunte, "An overview of semiconductor photocatalysis, " J.Photochem. Photobiol. A: Chem. 108 (1997) 1-35.
[154] D. M. Fouad, M. B. Mohamed " Comparative study of the photocatalyticactivity of semiconductor nanostructures and their hybrid metal

134
nanocomposites on the photodegradation of malathion" J. Nanomater.Article ID 524123 (2012) 1-8.
[155] J. C. Colmenares, R. Luque , J. M. Campelo, F. Colmenares, Z. Karpiński,A. A. Romero, " Nanostructured photocatalysts and their applications in thephotocatalytic transformation of lignocellulosic biomass: an overview" Mate.2 (2009) 2228-2258.
[156] B. Tian, C. Li, F. Gu, H. Jiang, "Synergetic effects of nitrogen doping andAu loading on enhancing the visible-light photocatalytic activity of nano-TiO2" Catal. Commun.10 (2009) 925–929.
[157] N. Barka, A. Assabbane, A. Nounahb, Y. A. Ichou, " Photocatalyticdegradation of indigo carmine in aqueous solution by TiO2-coated non-woven fibres" J. Hazard. Mater. 152 (2008) 1054–1059.
[158] R. Jain, S. Sikarwar "Photodestruction and COD removal of toxic dyeerioglaucine by TiO2-UV process: influence of operational parameters"Inter. J. Phys. Sci. 3 ( 2008) 299-305.
[159] L. B. Reutergradh, M. Iangphasuk "Photocatalytic decolourization ofreactive azo dye: A compare between TiO2 and CdS photocatalysis"Chemosphere 35 (1997) 585-596.
[160] L. O. B. Benetoli, B. M. Cadorin,a C. S. Postiglione, I. G. Souza, N. A.Debache " Effect of temperature on methylene blue decolorization inaqueous medium in electrical discharge plasma reactor" J. Braz. Chem.Soc., 22 (2011) 1669-1678.
[161] T. Lonhienne, C. Gerday, G.Feller, " Psychrophilic enzymes: revisiting thethermodynamic parameters of activation may explain local fexibility"Biochim. Biophys. Acta 1543 (2000) 1-10.
[162] Z. Shahryari, A. S. Goharrizi, M. Azadi, "Experimental study of methyleneblue adsorption from aqueous solutions onto carbon nano tubes" Inter. J.Water Resour Environ. Eng. 2 (2010) 016-028.
[163] S. Zhu, X. Yang, W. Yang, L. Zhang, J. Wang, M. Huo, " Application ofporous nickel-coated TiO2 for the photocatalytic degradation of aqueousquinoline in an internal airlift loop reactor" Int. J. Environ. Res. PublicHealth 9 (2012) 548-563.
[164] A. F. Alkaim, T. A. Kandiel, F. H. Hussein, R. Dillert, D. W.Bahnemanna, " Solvent-free hydrothermal synthesis of anatase TiO2nanoparticles with enhanced photocatalytic hydrogen production activity"Appl. Catal. A: General 466 (2013) 32– 37.
[165] R. Ullah, J. Dutta " Photocatalytic degradation of organic dyes withmanganese-doped ZnO nanoparticles" J. Hazard. Mater. 156 (2008) 194–
200.[166] T. Fotiou, T. M. Triantis, T. Kaloudis, A. Hiskia, " Evaluation of the
photocatalytic activity of TiO2 based catalysts for the degradation andmineralization of cyanobacterial toxins and water off-odor compounds
under UV-A, solar and visible light" Chem. Eng. J. 261 (2015) 17–26.

135
[167] A. Khanna, V. K. Shetty, " Solar light induced photocatalytic degradationof Reactive Blue 220 (RB-220) dye with highly efficient Ag@TiO2 core–shell nanoparticles: A comparison with UV photocatalysis" Solar Energy 99(2014) 67–76.
[168] J. Lim, D. M. Satoca, J. S. Jang, S. Lee, W. Choi, " Visible lightphotocatalysis of fullerol-complexed TiO2enhanced by Nb doping" Appl.Catal. B: Environ. 152–153 (2014) 233–240.
[169] J. Wang, Y. Jiang, Z. Zhang, G. Zhao, G. Zhang, T. Ma, W. Sun"Investigation on the sonocatalytic degradation of congo red catalyzed by
nanometer rutile TiO2 powder and various influencing factors" Desalination216 (2007) 196–208.
[170] J. Sathiyabama, S. Rajendran, J. A. Selvi, A. J. Amalraj "Methyl orange ascorrosion inhibitor for carbon steel in well water" Ind. J. Chem. 15 (2008)462-466.
[171] H. Hou, R. Zhou, P. Wua, L. Wua "Removal of congo red dye from aqueoussolution with hydroxyapatite/chitosan composite " Chem. Eng. J. 211–212(2012) 336–342.
[172] M. Mina, G. S. Bang, H. Lee, B. C. Yu, " A photoswitchable methylene–spaced fluorinated aryl azobenzene monolayer grafted on silicon" Chem.Commun., 46 (2010) 5232-5234.
[173] D. L. Pavia, G. M. Lampman, G. S. Kriz "Introduction to spectroscopy" 3rdedition, Published by Thomas learning, USA (2001) pp.25-27.
[174] J. Kaur, S. Singhal, "Facile synthesis of ZnO and transition metal dopedZnO nanoparticles for the photocatalytic degradation of Methyl Orange"Ceram. Int. 40(2014)7417–7424.
[175] C. Baiocchi, M. C. Brussinoa, E. Pramauro, Al. B. Prevot, L. Palmisanob,G. Marc "Characterization of methyl orange and its photocatalyticdegradation products by HPLC/UV–VIS diode array and atmosphericpressure ionization quadrupole ion trap mass spectrometry" Int. J. MassSpectrom. 214 (2002) 247–256.
[176] M. Bhaumik, R. I. Mccrindle, A. Maity, " Enhanced adsorptive degradationof Congo red in aqueous solutions using polyaniline/Feo compositenanofibers" Chem. Eng. J. 260 (2015) 716–729.
[177] K.Tanaka, K. Padermpole, T. Hisanaga "Photocatalytic degradation ofcommercial azo dyes" Wat. Res. 34 (2000) 327-333.
[178] H. S. Wahab, "Molecular modeling of the adsorption and initialphotocatalytic oxidation step for para-nitrophenol on nano-sized TiO2surface" Surf. Sci. 206 (2012) 624-633.
[179] H. S. Wahab, A. D. Koutselos "A computational study on the adsorptionand .OH initiated photochemical and photocatalytic primary oxidation ofaniline" Chem. Phys. 238 (2009) 171-176.
[180] S. A. Abo-Farha "Photocatalytic degradation of monoazo and diazo dyes inwastewater on nanometer-sized TiO2" Researcher 2 (2012) 1-20.

136
الملخص
المثیل البرتقالي والذي اختیر كنموذج تيّ نجزت عملیة التحطیم الضوئي في الوسط المائي لصبغاُ
من ملوثات تعتبرانواللتان ئیة انكنموذج لأصباغ الأزو الثحمرلاالأزوالأحادیة و الكونكوالأصباغ
. المیاه
و % ٥، % ٢.٥(بكمیات مختلفة من ذرات النتروجین ةثنائي اوكسید التیتانیوم المشوبمساحیقإن
. وئیة في المنطقة المرئیةالمحضرة مختبریا أظھرت فعالیة ض%) ٧
العدید من التقنیات باستخدامبذرات النتروجین ةثنائي أوكسید التیتانیوم المشوبمساحیقخصت شُ
الماسح لدراسة شكل السطح والذي الالكترونيفقد استخدمت تقنیة المجھر .والالكترونیةالطیفیة
المنتشرة ومنظومة الأشعة السینیة ذو الطاقة ز فحصيّ في حین ركّ .أظھر سطوحا سویة ومنتظمة
كما أظھرت . المساحیقوجود النتروجین في إثباتعلى ) من التطایر للأیوناتز-مطیاف الكتلة(
ي حین لم تظھر اي قمة حیود لطور الانتیز فنقي من طور تقنیة حیود الأشعة السینیة وجود طور
.المدى النانويضمنالروتایل كما وجد ان الحجم الحبیبي
ستخدمت تقنیة التحلیل الطیفي في مجال الأشعة المرئیة وفوق فقد اُ مساحیقلأحتساب طاقات الفجوة لل
.رومغناطیسيھالمنطقة المرئیة من الطیف الألكالبنفسجیة والتي ظھرت في
بذرات النتروجین ةثنائي اوكسید التیتانیوم المشوبعیناتكذلك دراسة طیف التألق الضوئي لتتم
ظھر اقل سرعة لعملیة اعادة من ذرات النتروجین یُ % ٢.٥حیث تبین ان النموذج الحاوي على
ت ان جمیع نماذج ثنائي اوكسید التیتانیوم المشوبة بالنتروجینااثبتم اخیراً .الكترون-ةاتحاد الفجو
.السطحیةالمساحةقیاسوذلك من خلال تقنیة مسامیة متوسطةذات
التي تضمنت تم دراسة المؤثرات التشغیلیة الرئیسة على عملیة القصر الضوئي لصبغتي الازو و
شدة الضوء ودور بعض ، تركیز المحفز، التركیز الابتدائي للصبغة، تأثیر الدالة الحامضیة
.المؤكسدات
الدالة : عند الظروف التجریبیة المثلى لعملیة التفكك الضوئي للمثیل البرتقالي والتي كانت كالآتي
لتر وبوجود/ملغم٥٠كمیة المحفز مساویة الى و٢,٥الحامضیة مساویة الى
لكل ثانیة وعمر ٠.٠٠١٤١لكل دقیقة و ٠.٠٨٥لتر من الصبغة كانت قیمة ثابت السرعة /مول
لاحمر مساویة الى الكونكو لساعة بینما كانت الدالة الحامضیة ٠.١٣٣نصف العملیة مساوي الى
مساوي لتر من الصبغة وثابت السرعة /مول، لتر من المحفز/ملغم٤٠، ٢.٥
٣,٠٥x ٥-١٠
٢,١٥x ٥-١٠

137
.ساعة٠.٣٤٠دقیقة وعمر نصف العملیةلكل٠.٠٣٤لكل ثانیة و ٠.٠٠٠٣٠٥الى
العملیة إنحمرلأاالمثیل البرتقالي والكونكوتيّ لعملیة القصر الضوئي لصبغةدراسة الحركیبینت
علاوة على ذلك فأن منتوج الكم لعملیة . بغض النظر عن ظروف التفاعلوقانون المرتبة الأولى تبعت
على الأحمرللمثیل البرتقالي والكونكو٠,٠١٣٥و ٠,٠٧٧الى الضوئیة للون مساويإلازالة
.التوالي
ومنتوج الكم لعملیة الأكسدة الضوئیة ان كلا الصبغتین تتأثر بصورة سرعة التفاعل نتائج كشفت
البرومات والكلوراتوكبیرة بأضافة بیروكسید الھیدروجین والمؤكسدات الأخرى مثل البیرسلفات
.والایودات
تین المشار الیھما اسیة لعملیة التفكك الضوئي للصبغوتم كذلك احتساب الدوال الثرمودینامیكیة الأس
.مثل طاقة التنشیط وطاقة جبس والانثالبي والانتروبياعلاه


جمھوریة العراق
وزارة التعلیم العالي والبحث العلمي
جامعة النھرین
كلیة العلوم
قسم الكیمیاء
الآزو باستخدام ثنائي لمركبات التحفیز الضوئي المشوبأوكسید التیتانیوم
رسالة
جامعة النھرین/ مقدمة إلى كلیة العلوم
الكیمیاءعلوممن متطلبات لنیل درجة الماجستیر فيجزء ك
من قبل
حسین محمد ھادي2009بكالوریوس
شرافإ
الأستاذ الدكتور
ھلال شھاب وھاب
حزیران شعبان
م٢٠١٥ه١٤٣٦