photochemical degradation of triclosan: a comparison ... · photochemical degradation of triclosan:...
TRANSCRIPT
Ana Cristina Rocha da Silva Cortez das Neves
Licenciada em Ciências de Engenharia do Ambiente
Photochemical degradation of triclosan: a comparison between different light
sources
Dissertação para obtenção do Grau de Mestre em Engenharia do Ambiente, perfil Engenharia Sanitária
Orientador: Profª. Doutora Ana Isabel Espinha da Silveira, Professora Auxiliar, Faculdade de Ciências e Tecnologias – Universidade Nova de Lisboa
Co-orientador: Prof. Doutor Roberto Raga, Assistant Professor, DII – Università degli Studi di Padova
Júri:
Presidente: Profª. Doutora Maria da Conceição Raimundo dos Santos Arguente: Doutor Eduardo Manuel Hipólito Pires Mateus Vogal: Profª. Doutora Ana Isabel Espinha da Silveira
Dezembro 2014

v
Photochemical degradation of triclosan: a comparison between different light sources
Copyright© 2014 em nome de Ana Cristina Rocha da Silva Cortez das Neves, da FCT/UNL e
da UNL
A Faculdade de Ciências e Tecnologia e a Universidade Nova de Lisboa têm o direito, perpétuo
e sem limites geográficos, de arquivar e publicar esta dissertação através de exemplares
impressos reproduzidos em papel ou de forma digital, ou por qualquer outro meio conhecido ou
que venha a ser inventado, e de a divulgar através de repositórios científicos e de admitir a sua
cópia e distribuição com objectivos educacionais ou de investigação, não comerciais, desde
que seja dado crédito ao autor e editor.

vi
vii
“Valeu a pena? Tude vale a pena se a alma não é pequena.”
Fernando Pessoa

viii
ix
Acknowledgments
Firstly I would like to thank Professor Ana Silveira the initial stimulus to embark in this
adventure. Again to Professor Ana Silveira and Professor Roberto Raga I thank for the
opportunity to accomplish this investigation and thesis on an international context, invaluable for
my Academic and Human formation.
To Professor Roberta Bertani a special thanks for all the guidance and advice throughout the
elaboration of the thesis, for the tireless support and attention given even in busy times. The
remarkable passion for Chemistry and work is evident and contagious.
A special note of appreciation to my teachers in FCT/UNL who have contributed to my
academic accomplishment.
I would also like to thank the wonderful welcome to the Italian laboratory and the technical
support from Paolo, Fabio and Flavio. To Riccardo, Luca and Ivo, thank you for the contribution
given to this work. To my Italian friends a special thank you, to Elisa Burigo and Bianca Bresolin
for all the good and fun times. Also to my ERASMUS and Residenzia Colombo friends, you
have been my family during this endeavour.
To all my friends that direct and indirectly contributed to this work. Additionally Gil Gonçalves
and João Lourenço thank you for the fellowship during these years of Academia and for the
ever growing friendship.
A special thank you note to Tiago Nunes for the infinite love and patience; for the support,
advice and motivation, in particular for reviewing the English of this thesis.
Finally to my family, a very special token of gratitude and appreciation, you have always primed
for the best in my education. To Filipa we are more than friends we are sister`s. To my Father
that does not ever let me give up of anything and always seems to find the right combination of
support and independence that I need to carry on and to my Mother whom has always revealed
to be a great woman especially during the bleaker of times, you are my inspiration.

x
xi
Resumo
O surgimento de novos contaminantes pode representar um perigo para o ambiente e para a
Humanidade com repercussões ainda desconhecidas. Uma das maiores produções mundiais
de produtos farmacêuticos e de higiene pessoal são produtos antimicrobianos. Triclosan é um
agente antimicrobiano presente na maioria dos produtos. Apesar da alta eficiência de remoção
de triclosan nas Estações de Tratamento de Águas Residuais, os seus níveis estão em franco
aumento nos ecossistemas, através de descargas de efluentes domésticos e lamas utilizadas
em aplicações no terreno. Regulado pela norma EC/1272/2008 (anexo VI, tabela 3.1), este
composto é considerado muito tóxico para a vida aquática com efeitos a longo prazo, tendo
também sido reportado que a sua transformação fotoquímica deriva em dioxinas.
Neste trabalho foram definidos três objectivos. Determinar o processo fotoquímico mais
eficiente na degradação do triclosan, comparando diversas fontes de luz; identificação dos
subprodutos principais que se formam durante a degradação do triclosan e por último o estudo
da influência das reacções Fenton e foto-Fenton.
Foram comparados métodos de degradação fotoquímica tais como: fotocatálise com recurso a
luz ultravioleta (UV), fotocatálise com recurso a luz solar, fotocatálise com recurso a LEDs,
reacção Fenton e foto-Fenton. A degradação do triclosan foi observada através de
cromatografia de gás/espectrometria de massa (GC/MS).
Os resultados obtidos com a reacção foto-Fenton demonstram sucesso na oxidação do
triclosan em H2O e CO2 sem a formação de nenhum subproduto ao fim de duas horas. Foi
possível a foto degradação do triclosan com recurso a dióxido de titânio (TiO2) e LEDs, obtendo
uma taxa de degradação de 53% num ensaio com a duração de 8 horas. A taxa de degradação
da reacção Fenton, luz UV e luz solar demonstraram uma degradação entre os 90% e 95%. Os
resultados são reportados aos dados observados sem suporte estatístico, uma vez que tal não
foi possível no decorrer do período do trabalho. Foram identificados subprodutos como
hidroquinona e 2,4-diclorofenol durante a primeira hora de reacção de fotocatálise por UV. Um
composto identificado possivelmente como C7O4H estava transversalmente presente na
degradação por UV, luz solar e LEDs concluindo-se que se tratava de um contaminante.
Estudos futuros sobre a utilização de LEDs devem ser considerados, não só pelas suas
vantagens de longa durabilidade e baixo consumo energético, mas também em substituição às
lâmpadas UV. O potencial de contaminação ambiental das lâmpadas UV levou a que estas
estejam a ser progressivamente retiradas dos mercados pelos governos. As reacções Fenton e
foto-Fenton não são alternativa pois são processos custosos devido aos reagentes envolvidos.
Palavras-chave: Triclosan, dióxido de titânio, fotoquímico, fotocatálise, foto degradação, luz
fluorescente, LEDs, foto-Fenton.

xii

xiii
Abstract
New emerging contaminants could represent a danger to the environment and Humanity with
repercussions not yet known. One of the major worldwide pharmaceutical and personal care
productions are antimicrobials products, triclosan, is an antimicrobial agent present in most
products. Despite the high removal rate of triclosan present in wastewater treatments, triclosan
levels are on the rise in the environment through disposal of wastewater effluent and use of
sewage sludge in land application. Regulated in the EC/1272/2008 (annex VI, table 3.1), this
compound is considered very toxic to aquatic life and it has been reported that photochemical
transformation of triclosan produces dioxins.
In the current work it was defined three objectives; determination of the most efficient process in
triclosan degradation, recurring to photochemical degradation methods comparing different
sources of light; identification of the main by-products formed during the degradation and the
study of the influence of the Fenton and photo-Fenton reaction.
Photochemical degradation methods such as: photocatalysis under florescent light (UV),
photocatalysis under visible light (sunlight), photocatalysis under LEDs, photo-Fenton and
Fenton reaction have been compared in this work. The degradation of triclosan was visualized
through gas chromatography/mass spectrometry (GC/MS).
In this study photo-Fenton reaction has successfully oxidized triclosan to H2O and CO2 without
any by-products within 2 hours. Photocatalysis by titanium dioxide (TiO2) under LEDs was
possible, having a degradation rate of 53% in an 8 hours essay. The degradation rate of the
Fenton reaction, UV light and sunlight showed degradation between 90% and 95%. The results
are reported to the data observed without statistic support, since this was not possible during
the work period. Hydroquinone specie and 2,4-dichlorophenol by-products were identified in the
first hour of photocatalysis by UV. A common compound, possibly identified has C7O4H , was
present at the degradation by UV, sunlight and LEDs and was concluded to be a contaminant.
In the future more studies in the use of LEDs should be undertaken given the advantages of
long durability and low consumption of energy of these lamps and that due to their negative
impact on the environment fluorescent lamps are being progressively made unavailable by
governments, requiring new solutions to be found. Fenton and photo-Fenton reactions can also
be costly processes given the expensive reagents used.
Keywords: Triclosan, titanium dioxide, photochemical, photocatalysis, photodegradation,
fluorescent light, LEDs, photo-Fenton.

xiv
xv
Contents List
1 Introduction .......................................................................................................................... 1
1.1 Thesis Objectives ............................................................................................................ 2
1.2 Thesis Organization ........................................................................................................ 2
2 Literature Review ................................................................................................................. 3
2.1 The compound triclosan .................................................................................................. 3
2.1.1 Physico-chemical properties ..................................................................................... 4
2.1.2 Antibacterial properties .............................................................................................. 5
2.2 The environmental problem of triclosan .......................................................................... 5
2.2.1 Sources of contamination .......................................................................................... 5
2.2.2 Environmental fate ..................................................................................................... 6
2.2.3 Toxicity....................................................................................................................... 7
2.3 Different processes studied for degradation. Triclosan case studies ........................... 10
2.3.1 Photocatalysis perform under ultraviolet light (UV) ................................................. 11
2.3.2 Sunlight .................................................................................................................... 13
2.3.3 Fenton and photo-Fenton reaction .......................................................................... 13
2.4 Mechanism of photocatalysis. The catalyst TiO2 .......................................................... 16
3 Methodology ....................................................................................................................... 21
3.1 Experimental setup ....................................................................................................... 21
3.1.1 Rhodamine B as operational control ....................................................................... 24
3.1.2 Photocatalysis by UV light ....................................................................................... 25
3.1.3 Photocatalysis by sunlight ....................................................................................... 27
3.1.4 Photocatalysis by LEDs ........................................................................................... 28
3.1.5 Photo-Fenton reaction ............................................................................................. 29
3.1.6 Fenton Reaction ...................................................................................................... 29
3.2 Determination of phenols and TCS by GC/MS ............................................................. 31
3.3 Instruments ................................................................................................................... 32
3.3.1 GC/MS: Gas chromatography/mass spectrometer ................................................. 32
3.3.2 ESI–MS: Electrospray ionization mass spectrometry ............................................. 34
3.3.3 UV-Vis spectrophotometer: Ultraviolet–Visible Spectrophotometer ........................ 35
3.3.4 1H NMR Spectrometry: Proton Nuclear Magnetic Spectrometry ............................. 36
3.3.5 Liquid/liquid extraction ............................................................................................. 37
4 Results and discussion ..................................................................................................... 39
4.1 Characterization of the TCS standard solution by analytical instruments .................... 39
4.2 TCS degradation and by-products by GC/MS .............................................................. 43
4.2.1 Rhodamine B as operational control ....................................................................... 43
4.2.2 Photocatalysis by UV light ....................................................................................... 44
4.2.3 Photocatalysis by sunlight ....................................................................................... 50
4.2.4 Photocatalysis by LEDs ........................................................................................... 51
4.2.5 Photo-Fenton reaction ............................................................................................. 53
4.2.6 Fenton Reaction ...................................................................................................... 54
xvi
4.2.7 Global aspects ......................................................................................................... 56
5 Conclusions and future work ........................................................................................... 59
6 References .......................................................................................................................... 61
Appendixes ................................................................................................................................ 67
Appendix I – Mass spectra ....................................................................................................... 69
Appendix II – Chromatograms ................................................................................................. 77
Appendix III – Quantitative Results ......................................................................................... 79
Appendix IV – Resume of the main intermediate products founded in the literature ........ 83
xvii
Figures list Figure 2.1 Historic evolution of triclosan ....................................................................................... 3
Figure 2.2 Molecular structure of triclosan .................................................................................... 4
Figure 2.3 Photodecomposition pathways of TCS ........................................................................ 7
Figure 2.4 The structural similarity of TCS to Bisphenol A, Diethylstillbestrol and the
thyroid hormone thyroxine ........................................................................................................ 8
Figure 2.5 Honda – Fujishima effect – water splitting using a TiO2 photoelectrode ................... 16
Figure 2.6 Principles of oxidative decomposition of TiO2 photocatalysis .................................... 17
Figure 2.7 Applications of TiO2 photocatalysis ............................................................................ 18
Figure 2.8 Crystal structures of TiO2 polymorphs, ...................................................................... 19
Figure 3.1 Advanced oxidation process experiments carried out to the degradation of
TCS ........................................................................................................................................ 21
Figure 3.2 Advanced oxidation process experiments carried out to the degradation of
TCS ........................................................................................................................................ 22
Figure 3.3 TEM images of commercial “TiO2 P25” ..................................................................... 22
Figure 3.4 XRD spectrum of commercial “TiO2 P25” .................................................................. 23
Figure 3.5 Picture of the photocatalytic degradation of Rhodamine B ........................................ 25
Figure 3.6 Picture in detail of the glass structure, beaker and quartz plaque used in the
reactor .................................................................................................................................... 26
Figure 3.7 Pictures of the reactor under the photocatalysis by UV experiment and
detail of the UV lamps ............................................................................................................ 26
Figure 3.8 Emission spectra of the UV lamps used and technical features according to
the manufacture ..................................................................................................................... 26
Figure 3.9 Picture of the crystallizer ready to place on the top of the tower ............................... 27
Figure 3.10 Picture of the LEDs experiment ............................................................................... 28
Figure 3.11 Picture in detail of the sixteen LEDs and photocatalytic experiment ....................... 28
Figure 3.12 Picture of the development of the Fenton reaction experiment ............................... 30
Figure 3.13 Schematic of a typical capillary GC/MS instrument ................................................. 33
Figure 3.14 Carlo Erba GC/MS ................................................................................................... 34
Figure 3.15 Schematic of the electrospray ionization process .................................................... 34
Figure 3.16 Thermo-Finnigan LCQ-Duo spectrometer ............................................................... 35
Figure 3.17 Optical Path in UV-Vis spectrophotometer .............................................................. 36
Figure 3.18 Perkin-Elmer Lambda 25 ......................................................................................... 36
Figure 3.19 Bruker 200 AC spectrometer and cross section of superconductive
magnet for 1H NMR spectroscopy .......................................................................................... 37
Figure 3.20 Liquid/liquid extraction.............................................................................................. 38
Figure 4.1 Triclosan chromatogram ............................................................................................ 39
Figure 4.2 Peak at 20.396 ........................................................................................................... 40
Figure 4.3 Peak at 21.046 ........................................................................................................... 40
Figure 4.4 Triclosan chromatogram by Mezcua et al., 2004 ....................................................... 40
xviii
Figure 4.5 1H NMR spectra of triclosan ....................................................................................... 41
Figure 4.6 Identification of the protons in the molecular structure of triclosan ............................ 41
Figure 4.7 Chromatogram of TCS in positive ion mode .............................................................. 42
Figure 4.8 Emission spectra of TCS ........................................................................................... 43
Figure 4.9 Picture of degradation samples of Rhodamine B ...................................................... 43
Figure 4.10 Picture of the blank samples .................................................................................... 43
Figure 4.11 Chromatogram of the UV lamps degradation of 1 hour experiment ........................ 44
Figure 4.12 Peak 10.477: C8H6Cl2O2 .......................................................................................... 44
Figure 4.13 Mass spectrum of 2,4-DCP by Yu et al., 2006 ......................................................... 45
Figure 4.14 a) Molecular structure of acetic anhydride b) Molecular structure of 2,4-
DCP, c) Molecular structure suggested for C8H6Cl2O2 ......................................................... 45
Figure 4.15 Peak 12.227: C8H2O radical cation .......................................................................... 46
Figure 4.16 Peak 17.461 ............................................................................................................. 46
Figure 4.17 Peak 10.927: C12H7Cl3O5 ......................................................................................... 46
Figure 4.18 Hydroquinine`s species, a) Proposal structure b) Proposal structure by
Rafqah et al., 2006 ................................................................................................................. 47
Figure 4.19 Peak 12.177: C2HO2 ................................................................................................ 47
Figure 4.20 Peak 14.011: C3H3O2 radical cation ......................................................................... 47
Figure 4.21 Chromatogram of the UV lamps degradation of 3 hours experiment ...................... 48
Figure 4.22 Chromatogram of the UV lamps degradation of 4 hours experiment ...................... 49
Figure 4.23 Chromatogram of the UV lamps degradation of 5 hours experiment ...................... 49
Figure 4.24 Chromatogram of the photocatalytic sunlight degradation for the 8 h
experiment .............................................................................................................................. 50
Figure 4.25 Chromatogram of the photocatalytic LEDs degradation of 8h experiment .............. 51
Figure 4.26 Chromatogram of the photo-Fenton reaction experiment ........................................ 53
Figure 4.27 Degradation of 10-3
mol/l 4-CP by different AOPs ................................................... 54
Figure 4.28 Chromatogram of the Fenton reaction of 2 hour experiment ................................... 55
Figure 4.29 Chromatogram of the Fenton reaction of 4 hour experiment ................................... 55
Figure 4.30 Chromatogram of the Fenton reaction of 2 hour experiment by adding
H2O2 in three instants of time ................................................................................................. 56
Figure 4.31 Chromatogram of the Fenton reaction of 4 hour experiment by adding
H2O2 in three instants of time ................................................................................................. 56
Figure 4.32 Degradation of TCS by different AOPs .................................................................... 58
Figure I.1 Peak at 18.812: Triclosan isomer ............................................................................... 69
Figure I.2 Peak at 19.863: Triclosan isomer ............................................................................... 69
Figure I.3 Peak 18.561 ................................................................................................................ 69
Figure I.4 Peak 20.361: Triclosan ............................................................................................... 69
Figure I.5 Peak 20.995: Triclosan ............................................................................................... 69
Figure I.6 Peak 14.011: C3H3O2 radical cation ............................................................................ 70
Figure I.7 Peak 17.461 ................................................................................................................ 70
xix
Figure I.8 Peak 20.345: Triclosan ............................................................................................... 70
Figure I.9 Peak 20.995: Triclosan ............................................................................................... 70
Figure I.10 Peak 17.429 .............................................................................................................. 70
Figure I.11 Peak 18.529 .............................................................................................................. 71
Figure I.12 Peak 20.346: Triclosan ............................................................................................. 71
Figure I.13 Peak 20.963: Triclosan ............................................................................................. 71
Figure I.14. Peak 17.546 ............................................................................................................. 71
Figure I.15 Peak 18.630 .............................................................................................................. 71
Figure I.16 Peak 20.430: Triclosan ............................................................................................. 72
Figure I.17 Peak 21.064: Triclosan ............................................................................................. 72
Figure I.18 Peak 17.461 .............................................................................................................. 72
Figure I.19 Peak 18.561 .............................................................................................................. 72
Figure I.20 Peak 20.395: Triclosan ............................................................................................. 72
Figure I.21 Peak 21.011: Triclosan ............................................................................................. 73
Figure I.22 Peak at 17.529 .......................................................................................................... 73
Figure I.23 Peak at 18.613 .......................................................................................................... 73
Figure I.24 Peak 21.046: Triclosan ............................................................................................. 73
Figure I.25 Peak 20.395: Triclosan ............................................................................................. 73
Figure I.26 Peak 21.061: Triclosan ............................................................................................. 74
Figure I.27 Peak 20.478: Triclosan ............................................................................................. 74
Figure I.28 Peak 21.095: Triclosan ............................................................................................. 74
Figure I.29 Peak 20.345: Triclosan ............................................................................................. 74
Figure I.30 Peak 20.995: Triclosan ............................................................................................. 74
Figure I.31 Peak 20.378: Triclosan ............................................................................................. 75
Figure I.32 Peak 21.011: Triclosan ............................................................................................. 75
Figure II.1 Amplified chromatogram of the photocatalytic degradation by UV lamps
experiment between the retention time 9 and 19 min ............................................................ 77
Figure III.1 Degradation of TCS under UV light .......................................................................... 79
Figure III.2 Degradation of TCS under sunlight ........................................................................... 79
Figure III.3 Degradation of TCS under LEDs .............................................................................. 80
Figure III.4 Degradation of TCS under photo - Fenton reaction .................................................. 80
Figure III.5 Degradation of TCS under Fenton reaction (addition of H2O2 at once) .................... 81
Figure III.6 Degradation of TCS under Fenton reaction (addition of H2O2 in 3 instants
of time) ................................................................................................................................... 81

xx
xxi
Tables list Table 2.1 Chemical Properties of triclosan ................................................................................... 4
Table 2.2 Main conditions of the photodegradation of TCS experiment made by
Sankoda et al., 2011 .............................................................................................................. 11
Table 2.3 Main conditions of the photodegradation of TCS made by Rafqah et al.,
2006........................................................................................................................................ 12
Table 2.4 Main conditions of the photocatalysis degradation experiment performed by
Yu et al., 2006 ........................................................................................................................ 12
Table 2.5 Main conditions of the experiment performed by Sanchez-Prado et al., 2006 ........... 13
Table 2.6 Main conditions of the Fenton reaction experiment performed by Yang et al.,
2011........................................................................................................................................ 14
Table 2.7 Main conditions of the Fenton reaction performed by Son et al., 2010 ...................... 15
Table 2.8 Main conditions of the photo-Fenton reaction experiment performed by Son
et al., 2010 .............................................................................................................................. 15
Table 2.9 Some properties of the main polymorphs of TiO2 ....................................................... 19
Table 3.1 XRD peaks of commercial “TiO2 P25” ......................................................................... 23
Table 4.1 pH measurements from the photocatalytic experiment under UV light ....................... 49
Table 4.2 Degradation percentages of the UV experiment ......................................................... 50
Table 4.3 pH measurement under photocatalytic degradation under sunlight ........................... 51
Table 4.4 pH measurement under photocatalytic degradation under LEDs ............................... 52
Table 4.5 Percentage of removal of pesticides (4 - CP and 2,4-DCP) ....................................... 52
Table 4.6 Mass spectrum of the ion peak m/z 149 in the different experiments ......................... 57
Table 4.7 Degradation percentages of the different methods used ............................................ 58
Table IV.1 Main Intermediate products reported in the literature ................................................ 83

xxii
xxiii
Acronyms List 2,4–DCP 2,4-dichlorophenol
2,8–DCDD 2,8–dicholorodibenzo-p-dioxin
AOPs Advanced oxidation processes
13C Carbon 13 isotope
CO2 Carbon Dioxide
δ Chemical shift
ESI Electrospray ionization
ESI–MS Electrospray ionization mass spectrometry
[FeO4]2-
Ferrate (VI)
FeSO4.7H2O Iron (II) sulfate heptahydrate
GC/ITMS Gas chromatography/ion trap mass spectrometry
GC/MS Gas chromatography/mass spectrometry
1H Proton
1H NMR Proton nuclear magnetic resonance
H2O Water
H2O2 Hydroxide peroxide
H2SO4 Sulfuric acid
HPLC High performance liquid chromatography
HPLC/MS/MS Liquid chromatography/tandem mass spectrometry
HRGC/MS High resolution gas chromatography/mass spectrometry
K2CO3 Potassium carbonate
LED Light emitting diode
MSTFA N-Methyl-N Trifluoroacetamida
m/z Mass-to-charge ratio
Na2SO4 Sodium sulfate (anhydrous form)
NaCl Sodium chloride
NIST National Institute of Standards and Technology
NMR Nuclear magnetic resonance
O3 Ozone
OH● Hydroxyl radical
Pol Pollutant
Pt Platinum
RRLC – MS/MS Rapid resolution liquid chromatography – tandem mass spectrometry
SO4●-
Sulfate radical anion
TCS Triclosan
TEM Transmission Electron Microscopy
TiO2 Titanium Dioxide
TMS Tetramethylsilane
UV Ultraviolet light

xxiv
XRD X Ray Diffraction
1
1 Introduction
Our society has thrived to great extent due to antimicrobial products which allow for a longer
life-span for Humanity and greater comfort in treatment of the sick. Triclosan (5 – chloro – 2 –
[2,4 – dichlorophenoxy] – phenol) is an antimicrobial agent widely used in various consumer
products of health and personal care (Yang et al., 2011). Globally the production of triclosan is
over 1500 tons per year (Dann & Hontela, 2011), available in more than 2 000 antimicrobial
products in the U.S, representing only in this country a market of $1.4 billion in 2014 (Halden,
2014).
Regulated in the EC/1272/2008 (annex VI, table 3.1), this compound is considered very toxic to
aquatic life with long lasting effects causing serious irritation to the skin and irritation to the
eyes. A final classification has not yet been established. The main sources of contamination in
the environment are the release of wastewater effluent and the use of sewage sludge in land
application (Dann & Hontela, 2011; Ricart et al., 2010; Thompson et al., 2005).
There is a growing concern regarding the persistence of triclosan in the environment and its
potential adverse impacts, such as bacteria resistance (Yazdankhah et al., 2006), endocrine
disruptive chemical (Dann & Hontela, 2011; Foran et al., 2000) and acute and chronic toxicity
(Nassef et al., 2010; Chalew & Halden, 2009; Orvos et al., 2002).
Structurally related to toxic and carcinogenic dioxins for instance 2,3,7,8–tetrachlorodibenzo–
p–dioxin and 2,3,7,8–tetrachlorodibenzofuran, triclosan has been labeled has a predioxin
(Halden, 2014). Higher toxicity intermediates and by-products formed during triclosan
degradation, as the phototransformation of triclosan to produce 2,8–dicholorodibenzo–p–dioxin
(2,8–DCDD) are the major hazards and reasons for alarm (Mezcua et al., 2004).
Advanced oxidation processes (AOPs), can be defined as systems that produce strong
reactivity species, precisely the hydroxyl radical (OH●) or sulfate radical anion (SO4
●-) to oxidize
or degrade micropollutants such as endocrine disrupting chemicals and pharmaceutical and
personal care products (Júnior. et al., 2012; Song et al., 2012). Catalysis under light irradiation
has received great attention for pollution control, has the advantages of use inexpensive
photocatalyst (TiO2), operations conditions such as room temperature and atmospheric
pressure, and nearly complete oxidation of carbon and hydrogen containing pollutants to CO2
and H2O (Shie et al., 2008).
The use of mercury discharge lamps to conduct irradiation is the traditionally used method in
TiO2 photocatalysis (Yu et al., 2014), however this process has the disadvantages of the short
life, energy cost, the instability of the output power and the hazardous materials from the
emitted wastes from the lamps (Yu et al., 2014; Shie et al., 2008). The handling of UV lamps
2
should be taken with care because of the UV emission from the UV lamps are harmful to
humans eyes (Shie et al., 2008).
The LEDs offer numerous advantages: long lifetime, lower power, inexpensive installation,
possibility of selective monochromatic light, more effectiveness converting electricity to light with
little or no heating and the use of direct current power which offers greater flexibility for field
applications, especially for remote areas (Ghosh et al., 2009; Shie et al., 2008).
LEDs are a reliable competitor to florescent lamp. There are only a limited number of papers
that study the LED photocatalysis applied in the field of environmental engineering (Yu et al.,
2014). No paper on LED photocatalysis in triclosan was found at the time of this written study.
1.1 Thesis Objectives
The main aim of this thesis was to study methods of degradation applied to the environmental
contaminant triclosan using traditional light sources (UV and sunlight), as well as the Light
Emitting Diode (LEDs). An additional aim was to study the influence of the Fenton and photo
Fenton reaction. The objectives were:
i) To analyze which is the best degradation method based on the degradation rate;
ii) To identify the main by-products formed during the degradation.
1.2 Thesis Organization This thesis was divided in five chapters, and respective subchapters.
1. Introduction, establishes the context and aim of the dissertation.
2. Literature Review, characterization and description of the environmental problems and
concerns about triclosan. The state of the art of the photocatalytic process as well as
case-studies of other degradation processes are presented.
3. Methodology, the experimental methodology is described. The instruments explored
and the analytical treatment methods are defined.
4. Results and discussion, the results are exposed according to the degradation variables
and characterization of the standard solution agreeing to the analytical instruments was
done. In this chapter a comparison between degradation methods and identification of
by-products was presented in order to achieve a response to the thesis objectives.
5. Conclusions and future recommendations, the accomplishment of the objectives is
evaluated and futures recommendations to improve results towards and theme
development are proposed.

3
2 Literature Review
2.1 The compound triclosan Triclosan (TCS) is a broad-spectrum antimicrobial, widely used as main ingredient in various
consumer products as disinfectant, preservative or antiseptic. It is used in personal care and
household products like: soaps, deodorant soaps, mouthwash, toothpastes, shampoos, body
lotions and detergents. It is also used in clinical settings, medical devices, plastic materials and
toys (Dann & Hontela, 2011; SCCS, 2010; Fang et al., 2010; Bhargava & Leonard, 1996).
TCS was first synthesized by the chemical company Cyba-Geigy in Basel, Switzerland. Firstly
registered as a pesticide in 1969, it was later on introduced to the healthcare industry in 1972
and it met widespread use throughout Europe in toothpastes during the 80`s (Kola et al., 2013;
Fang et al., 2010; Bhargava & Leonard, 1996).
According to the European Union in the Scientific Committee on Consumer Safety (SCCS,
2010) apud The European Association of the Cosmetics Industry (COLIPA, 2007) indicates that
about 85% of the total of volume of triclosan is used in personal care products, 5% in textiles
and 10% for plastics and food contact materials.
Over the years consumer demand for antimicrobials products has increased and so has the
amount of triclosan (Figure 2.1). Between 1976 and 2008 the US Patent and Trademark Office
issued a total of 2385 patents containing the word triclosan. The production of TCS has now
exceeded 1500 tons per year, with Europe having a part of 350 tons of total production. In the
U.S over 2 000 antimicrobials products are available with TCS representing a market of $1.4
billion (Halden, 2014; Dann & Hontela, 2011; Fang et al., 2010; ; Singer et al., 2002).
Figure 2.1 Historic evolution of triclosan (Adapted from: Fang et al., 2010)
The widespread use and mass production of TCS brings new concerns to human health and to
the environment that must be studied (Fang et al., 2010).
0
1
2
3
4
5
6
1977 1986 1990 1994 1998
Am
ou
nt
Pro
du
ced
(M
illio
n
Po
un
ds)
Year of production
Triclosan Production History
4
Triclosan is the name given by the Internacional Nomenclature of Cosmetic Ingredient (INCI),
but TCS takes on many different trade names: Irgasan; CH 3565; Irgasan DP300; Ster-Zac;
Aquasept; Sapoderm; Irgacare MP; Lexol 300 and Cloxifenolum. In fibres and other materials it
can take the name of Ultra-Fresh, Amicor, Microban, Monolith, Bactonixans Sanitized (Dann &
Hontela, 2011).
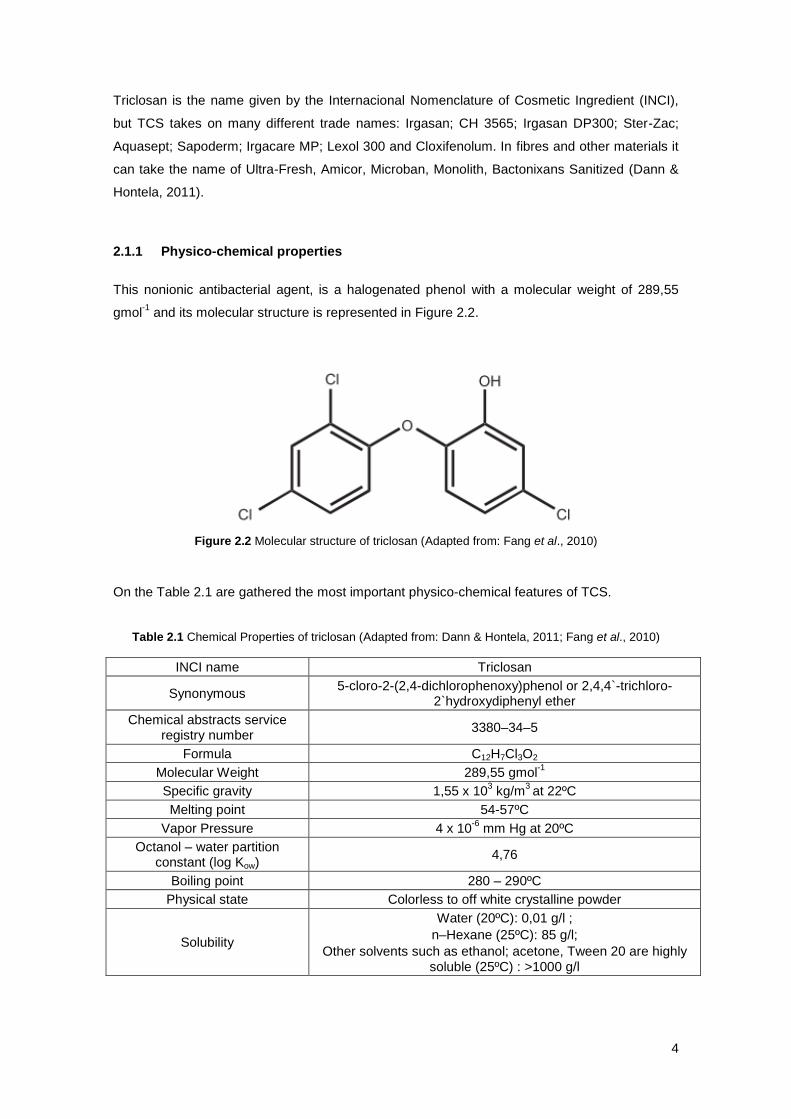
2.1.1 Physico-chemical properties
This nonionic antibacterial agent, is a halogenated phenol with a molecular weight of 289,55
gmol-1
and its molecular structure is represented in Figure 2.2.
Figure 2.2 Molecular structure of triclosan (Adapted from: Fang et al., 2010)
On the Table 2.1 are gathered the most important physico-chemical features of TCS.
Table 2.1 Chemical Properties of triclosan (Adapted from: Dann & Hontela, 2011; Fang et al., 2010)
INCI name Triclosan
Synonymous 5-cloro-2-(2,4-dichlorophenoxy)phenol or 2,4,4`-trichloro-
2`hydroxydiphenyl ether
Chemical abstracts service registry number
3380–34–5
Formula C12H7Cl3O2
Molecular Weight 289,55 gmol-1
Specific gravity 1,55 x 10³ kg/m
3 at 22ºC
Melting point 54-57ºC
Vapor Pressure 4 x 10⁻⁶
mm Hg at 20ºC
Octanol – water partition constant (log Kow)
4,76
Boiling point 280 – 290ºC
Physical state Colorless to off white crystalline powder
Solubility
Water (20ºC): 0,01 g/l ;
n–Hexane (25ºC): 85 g/l;
Other solvents such as ethanol; acetone, Tween 20 are highly soluble (25ºC) : >1000 g/l

5
2.1.2 Antibacterial properties
The first action of TCS is on the cytoplasmic membrane, directed to the RNA and protein
synthesis (Bhargava & Leonard, 1996). In addition TCS demonstrates a tendency to disorder
membrane activities, compromising the functional activity without causing leakage of
intracellular components (Villalaín et al., 2001).
Triclosan inhibits bacterial fatty acid biosynthesis by inhibiting the enzyme enoyl–acyl–carrier
protein (ACP) reductase or FabI (Russell, A.D., 2004, Heath et al., 1999). This enzyme
catalyzes chemical reactions essential in the synthesis of fatty acid. The bacterial enzyme ACP
sequence and structural organization are different from those of mammalian fatty acid
biosynthesis enzymes (Ling et al., 2004). So the efficacy and specificity of triclosan against
bacteria’s making this compound an antibacterial.
Triclosan has different reactions depending on its concentration (SCCS, 2010). At low
concentrations triclosan is bacteriostatic, inhibiting the enzyme ACP; at higher concentrations it
becomes bactericidal, destabilizing the membrane structure and compromising the functional
integrity of those membranes (SCCS, 2010; Villalaín et al., 2001). According to Heidler &
Halden, (2007) and Bhargava & Leonard, (1996) referring Regos et al., 1979 triclosan is
effective at low concentrations against a broad spectrum of gram-negative and gram-positive
bacteria.
2.2 The environmental problem of triclosan
2.2.1 Sources of contamination
The main sources identified of contamination of the environment are (Dann & Hontela, 2011;
Ricart et al., 2010; Thompson et al., 2005):
1) The release of wastewater effluent into the receiving waters;
2) The use of sewage sludge in land application.
Biological wastewater treatment is currently considered the principal destructive mechanism
limiting dispersal of and environmental contamination of TCS (Heidler & Halden, 2007).
Removal efficiencies are between 95% to 98% for activated sludge plants (Heidler & Halden,
2007; Thompson et al., 2005; Bester, 2003; McAvoy et al., 2002), 58% to 96% for rotating
biological contactors and 86% to 97% for trickling filter (Thompson et al., 2005). Activated
sludge treatment had the higher removal efficiencies because it is maintained in high dissolved
6
oxygen levels (Thompson et al., 2005). TCS shows no biodegradation under anaerobic
conditions (McAvoy et al., 2002).
According with Bester, (2003) in a study performed in a German activated sludge sewage
treatment plant that processed 200 000 m3 wastewater per day, about 5% of TCS was dissolved
in the effluent and 30% was absorbed to the sludge. It was considered that the other 65% was
transformed into unknown metabolites or strongly bound residues. There are four process that
could remove TCS from the liquid phase: volatilization, photolysis, sorption to wastewater
sludge and biodegradation (Thompson et al., 2005). Volatilization could be considered refutable
since triclosan vapor pressure is 4 x 10⁻⁶
mm Hg (Heidler & Halden, 2007; Thompson et al.,
2005). TCS is mostly in its photostable form in the pH range that normally wastewater treatment
works, from 6.5 to 8.5, therefore photolysis is minimal (Thompson et al., 2005). TCS is a
hydrophobic compound, and hydrophobic compounds tend to adsorb to primary sludge
(Thompson et al., 2005).
In a deep research, Chalew & Halden, (2009) found the maximum amount detected in rivers in
the U.S was 2.3 µg/l. The potential environmental risk is higher in waters with low dilution
capacity (Ricart et al., 2010).
Currently there are some methods available to remove TCS from the water, like advanced
oxidation or granular activated carbon. Unfortunately these methods are expensive to install and
operate (Thompson et al., 2005).
2.2.2 Environmental fate
TCS`s trichlorinated binuclear aromatic structure shares similarities with dioxins, suggesting
potentially problematic properties, including persistence and bioaccumulation (Heidler & Halden,
2007). Bioaccumulation in tissue, opens a potential pathway for chemical biomagnification up
the food chain (Chalew & Halden, 2009).
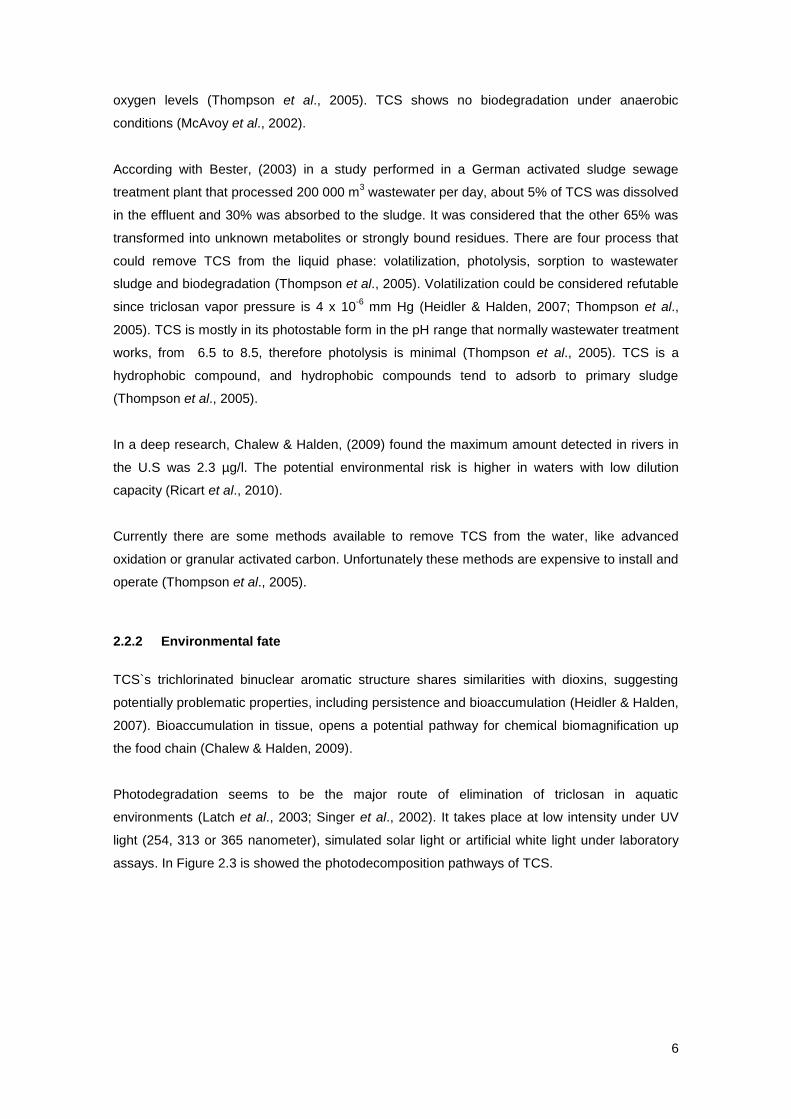
Photodegradation seems to be the major route of elimination of triclosan in aquatic
environments (Latch et al., 2003; Singer et al., 2002). It takes place at low intensity under UV
light (254, 313 or 365 nanometer), simulated solar light or artificial white light under laboratory
assays. In Figure 2.3 is showed the photodecomposition pathways of TCS.
7
Figure 2.3 Photodecomposition pathways of TCS (Adapted from: Sanchez-Prado et al., 2006)
Tixier et al., (2002) concluded that photochemical transformation of TCS accounts for up 80% of
its loss from the epilimnion in Lake Greifensee during summer months. Dioxins accumulate in
the water due to the TCS photodegradation (Aranami & Readman, 2007).
2.2.3 Toxicity
Since TCS is an anthropogenic chemical, its presence in the environment derives directly from
human activities. TCS it is an apolar molecule (log Kow = 4,8), and is likely to bioaccumulate
(Thompson et al., 2005).
The main concerns originated by the TCS compound are:
1. Resistance of bacteria
Antibacterials are similar to antibiotics in the point that both inhibit bacterial growth. One
concern is bacteria will become resistant to antibacterial products like TCS. Another concern is
bacteria that becomes resistant to TCS can also become resistant to antibiotics (Yazdankhah et
al., 2006).
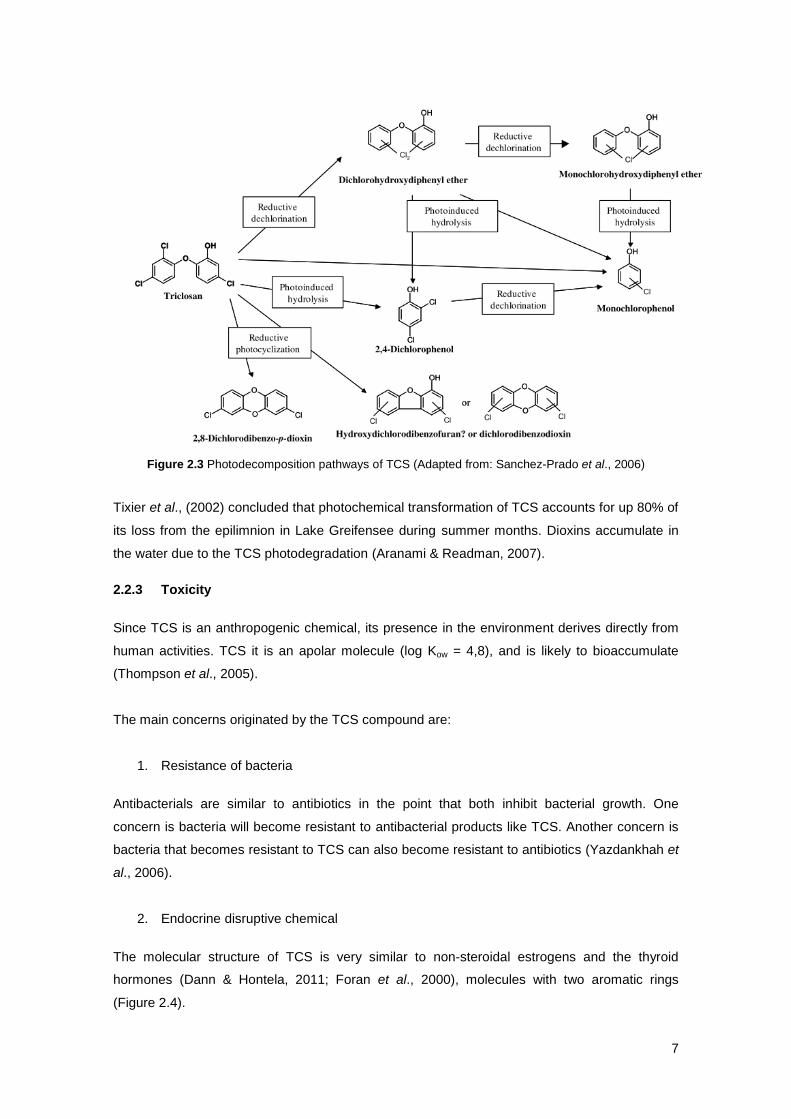
2. Endocrine disruptive chemical
The molecular structure of TCS is very similar to non-steroidal estrogens and the thyroid
hormones (Dann & Hontela, 2011; Foran et al., 2000), molecules with two aromatic rings
(Figure 2.4).
8
Figure 2.4 The structural similarity of TCS to Bisphenol A, Diethylstillbestrol and the thyroid hormone
thyroxine (Adapted from: Dann & Hontela, 2011)
3. Acute and chronic toxicity
Higher toxicity intermediates and by-products are produced during TCS degradation in the
environment bring new concerns to its degradation mechanism in the environment. TCS has
been detected in water, sediments, biosolids, soils, aquatic species and humans (Dann &
Hontela, 2011). Worldwide TCS survey indicates a large dispersion being referred in aquatic
environments and organisms from the United States, to Germany and Australia (Katz et al.,
2013; Xie et al., 2008; Coogan et al., 2007; Ying & Kookana, 2007).
In humans, exposure and bioaccumulation were registered by detection of TCS in human breast
milk in the United States, Sweden and Australia (Toms et al., 2011; Dayan, 2007; Allmyr et al.,
2006; Adolfsson-Erici et al., 2002). In China and Korea it was detected in urine (Li et al., 2013;
Kim et al., 2011). Human blood and plasma samples with the presence of TCS were reported in
Sweden and Australia (Allmyr et al., 2006; Adolfsson-Erici et al., 2002).
An in vitro study revealed that the exposure to TCS inhibits phase II enzyme metabolism in
human liver (Wang et al., 2004). Other studies (SCCS, 2010; Dayan, 2007) conclude that TCS
is rapidly absorbed from the gastrointestinal tract and although at a lower rate is also absorbed
through the skin.
The route of administration and the kind of species has a substantial influence on the toxicity of
triclosan (Fang et al., 2010; Bhargava & Leonard, 1996). TCS inhibited plant growth with a half
maximal effective concentration (EC50) between 57 mg/kg to 108 mg/kg. Soil respiration was
inhibited in treatments with triclosan at concentrations more than 10 mg/kg (Liu et al., 2009). At
concentrations below 10 mg/kg, TCS can disturb the nitrogen cycle in some soils (Waller &
Kookana, 2009).
TCS has the potencial to bioaccumulate in aquatic organisms and exert adverse physiological
effects (Hontela & Habibi, 2013). From the studied aquatic species, the ones that appeared
most vulnerable are crustacea and algae species, with growth inhibition occurring at
9
concentrations measured in surface waters (Dann & Hontela, 2011; Chalew & Halden, 2009;
Tatarazako et al., 2004; Orvos et al., 2002).
Algae
In Tatarazako et al., 2004 the microalga Selenastrum capricornutum was about 30 to 80 times
more sensitive to Triclosan toxicity than the bacterium (Vibrio fisheri) and fish (Danio rerio and
Oryzias latipes). The half maximal inhibitory concentration (IC50) growth inhibition of microalga
Selenastrum capricornutum was 4,7 µg/l while fish Danio rerio and Oryzias latipes were
respectively 220 µg/l and 400 µg/l.
Another algae, Scenedesmus subspicatus, revealed a EC50 (96h) of 1,4 µg/l (Orvos et al.,
2002). Chalew & Halden, (2009) performed a study where the summary of occurrence data for
TCS and contrasts of toxicity thresholds for aquatic organisms were gathered. According to this
study the toxic concentrations to algae lays in the range of 0,2 µg/l to 2,8 µg/l. The increased of
concentration of TCS affects the viability of the diatom cell (Ricart et al., 2010).
The influence that TCS has on algae, important organisms for being the first-step producers in
the ecosystem, opens the possibility for the destruction of the ecosystem’s balance if a high
volume discharge in the environment occurs (Tatarazako et al., 2004).
Crustacea
Orvos et al., 2002 studied the aquatic toxicity of triclosan using activated sludge
microorganisms, algae, invertebrates and fish. The Daphnia magna acute toxicity EC50 (48h)
was 390 µg/l and to the Ceriodaphnia was 184,7 µg/l. The study of Chalew & Halden, (2009)
stated acute toxicity for crustacea lays in the range from 185 µg/l to 390 µg/l and chronic toxicity
lower levels initiate from 6 µg/l to 182 µg/l.
Fish
Fish show a great vulnerability to TCS too. Nassef et al., 2010, measured the effects on feeding
behavior and swimming speed in adult Japanese medaka fish (Oryzias latipes). Exposure to
0,17 mg/l TCS in nine days resulted in a decrease in the mean of the swimming performance,
but not in the feeding behavior. However, swimming performance is closely related to food
capture and is considered to be a primary determinant of survival in many species of fish and
other aquatic animals. Other study performed by Foran et al., 2000, in a exposure of 14 days
with 1,10 µg/l and 100 µg/l TCS in Japanese medaka fish (Oryzias latipes), suggested TCS may
act as an environmental anti-estrogen or androgen. At lower concentrations swimming
10
performance and feeding behaviors were affected. At high concentrations it was lethal to
medaka infant fish, calculating the lethal concentration at 50% (LC50) in 48h of 352 µg/l.
For the zebrafish (Danio rerio), the effects of TCS count teratogenic effects and delaying
embryo development, resulting in mortality within 48h (Nassef et al., 2009 apud Dann &
Hontela, 2011). The acute toxicity levels in fish have been determined to range from 260 µg/l to
440 µg/l and the chronic toxicity range from 34 µg/l to 290 µg/l (Chalew & Halden, 2009).
Aquatic invertebrates also exhibit vulnerability to TCS (Dann & Hontela, 2011).
Due to the large increase of exposure, even if a product is non-toxic, the accumulation of TCS
from different sources in the environment can have a greater effect of which exposure dangers
are not yet known.
2.3 Different processes studied for degradation. Triclosan case
studies
AOPs, can be defined as systems that produce strong reactivity species, precisely OH● or SO4
●-
to oxidize or degrade micropollutants such as endocrine disrupting chemicals and
pharmaceutical and personal care products (Júnior et al., 2012; Song et al., 2012).
AOPs recognized examples are (Júnior et al., 2012; Bauer & Fallmann, 1997):
Oxidant (catalyst, when used)/ light: H2O2/UV; O3/UV; O3-H2O2/UV; (TiO2)/UV;
Fe(III)/(TiO2)/UV;
Fenton-reaction or H2O2-Fe(III);
Photo-Fenton reaction or H2O2 [Fe (II)/(Fe(III)]/UV.
The generation of OH● radicals in AOPs is very important because it affects not only the decay
rate of the parent compound triclosan but also the accumulation of toxic intermediates (Song et
al., 2012). One usual problem for the AOPs is the high demand of electrical energy for
ozonizers and/or UV lamps. The pursuance for a total cost reduction process can be possible
by using the catalyst TiO2 that used 5% of the solar spectrum and the photo-Fenton reaction,
since O3 and H2O2 alone don’t absorb light of wavelength superior to 300 nanometers (nm),
having the main precondition the use of sunlight (Bauer & Fallmann, 1997).
11
Triclosan case studies
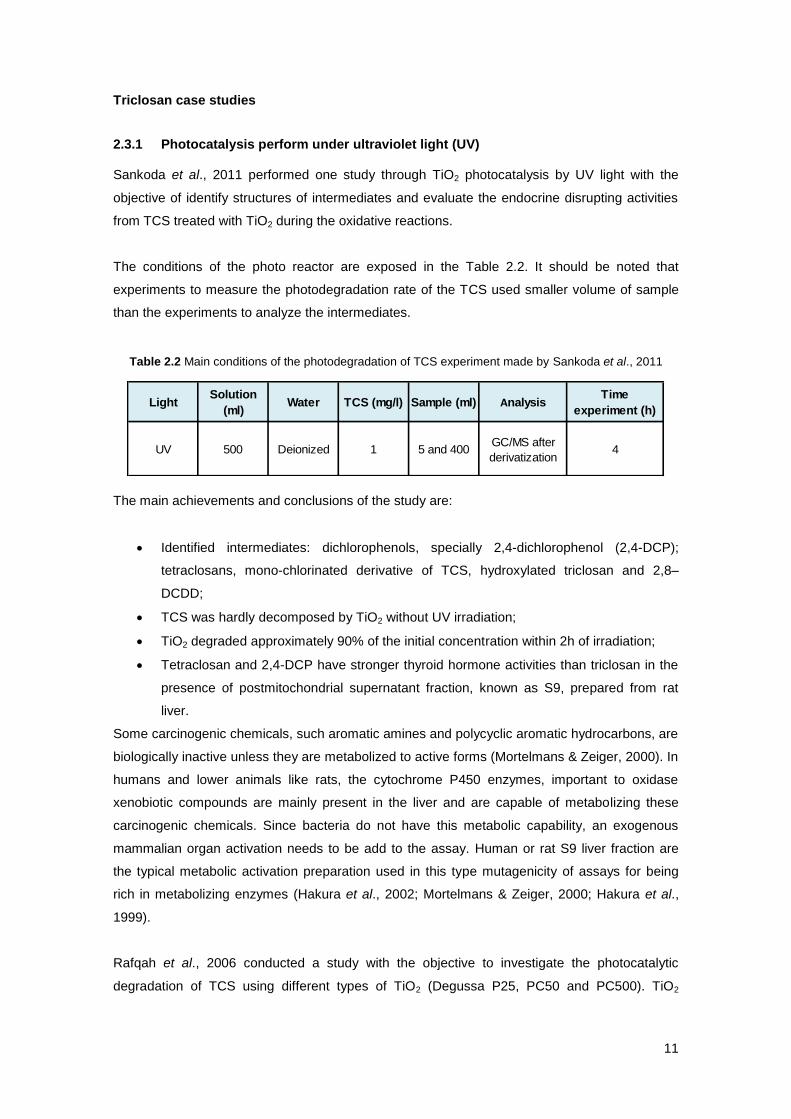
2.3.1 Photocatalysis perform under ultraviolet light (UV) Sankoda et al., 2011 performed one study through TiO2 photocatalysis by UV light with the
objective of identify structures of intermediates and evaluate the endocrine disrupting activities
from TCS treated with TiO2 during the oxidative reactions.
The conditions of the photo reactor are exposed in the Table 2.2. It should be noted that
experiments to measure the photodegradation rate of the TCS used smaller volume of sample
than the experiments to analyze the intermediates.
Table 2.2 Main conditions of the photodegradation of TCS experiment made by Sankoda et al., 2011
The main achievements and conclusions of the study are:
Identified intermediates: dichlorophenols, specially 2,4-dichlorophenol (2,4-DCP);
tetraclosans, mono-chlorinated derivative of TCS, hydroxylated triclosan and 2,8–
DCDD;
TCS was hardly decomposed by TiO2 without UV irradiation;
TiO2 degraded approximately 90% of the initial concentration within 2h of irradiation;
Tetraclosan and 2,4-DCP have stronger thyroid hormone activities than triclosan in the
presence of postmitochondrial supernatant fraction, known as S9, prepared from rat
liver.
Some carcinogenic chemicals, such aromatic amines and polycyclic aromatic hydrocarbons, are
biologically inactive unless they are metabolized to active forms (Mortelmans & Zeiger, 2000). In
humans and lower animals like rats, the cytochrome P450 enzymes, important to oxidase
xenobiotic compounds are mainly present in the liver and are capable of metabolizing these
carcinogenic chemicals. Since bacteria do not have this metabolic capability, an exogenous
mammalian organ activation needs to be add to the assay. Human or rat S9 liver fraction are
the typical metabolic activation preparation used in this type mutagenicity of assays for being
rich in metabolizing enzymes (Hakura et al., 2002; Mortelmans & Zeiger, 2000; Hakura et al.,
1999).
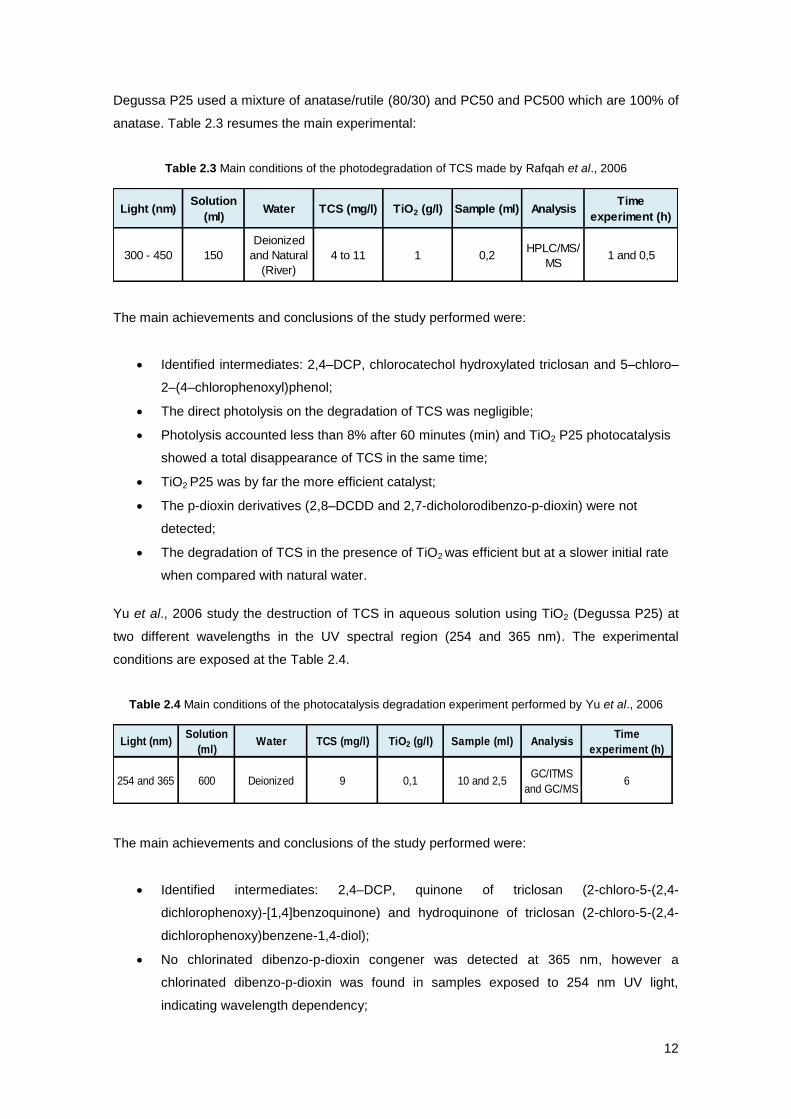
Rafqah et al., 2006 conducted a study with the objective to investigate the photocatalytic
degradation of TCS using different types of TiO2 (Degussa P25, PC50 and PC500). TiO2
LightSolution
(ml)Water TCS (mg/l) Sample (ml) Analysis
Time
experiment (h)
UV 500 Deionized 1 5 and 400GC/MS after
derivatization4
12
Degussa P25 used a mixture of anatase/rutile (80/30) and PC50 and PC500 which are 100% of
anatase. Table 2.3 resumes the main experimental:
Table 2.3 Main conditions of the photodegradation of TCS made by Rafqah et al., 2006
The main achievements and conclusions of the study performed were:
Identified intermediates: 2,4–DCP, chlorocatechol hydroxylated triclosan and 5–chloro–
2–(4–chlorophenoxyl)phenol;
The direct photolysis on the degradation of TCS was negligible;
Photolysis accounted less than 8% after 60 minutes (min) and TiO2 P25 photocatalysis
showed a total disappearance of TCS in the same time;
TiO2 P25 was by far the more efficient catalyst;
The p-dioxin derivatives (2,8–DCDD and 2,7-dicholorodibenzo-p-dioxin) were not
detected;
The degradation of TCS in the presence of TiO2 was efficient but at a slower initial rate
when compared with natural water.
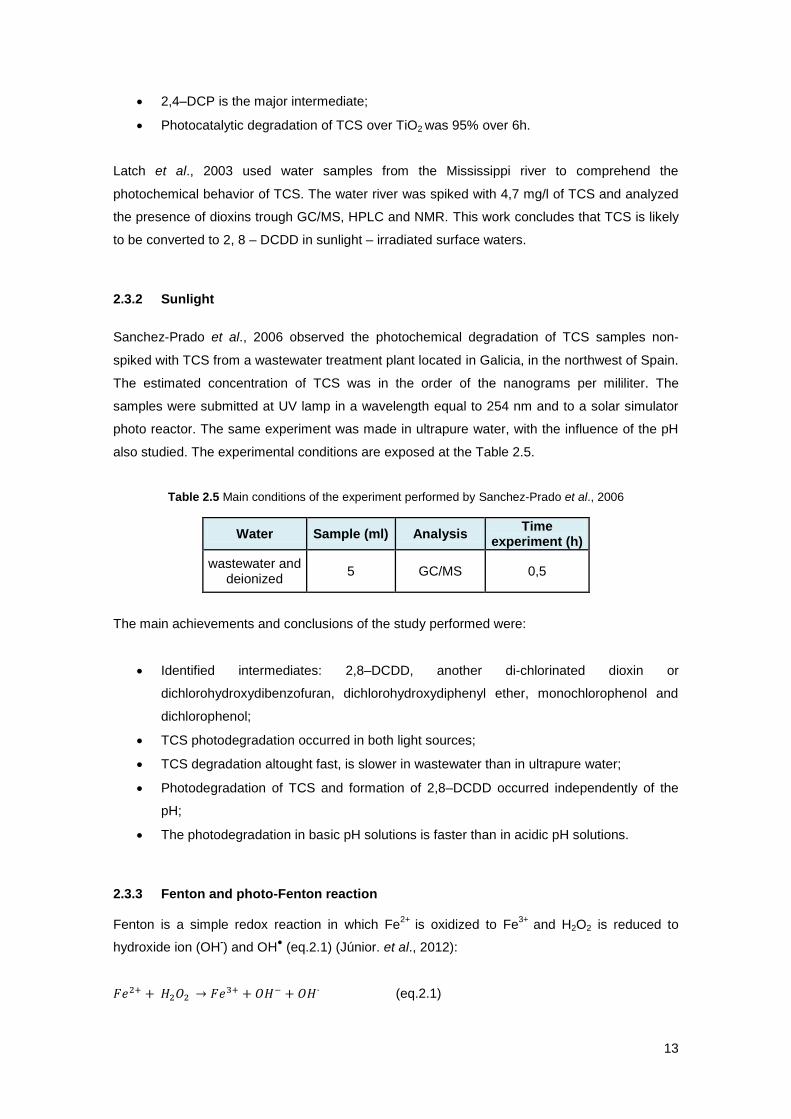
Yu et al., 2006 study the destruction of TCS in aqueous solution using TiO2 (Degussa P25) at
two different wavelengths in the UV spectral region (254 and 365 nm). The experimental
conditions are exposed at the Table 2.4.
Table 2.4 Main conditions of the photocatalysis degradation experiment performed by Yu et al., 2006
The main achievements and conclusions of the study performed were:
Identified intermediates: 2,4–DCP, quinone of triclosan (2-chloro-5-(2,4-
dichlorophenoxy)-[1,4]benzoquinone) and hydroquinone of triclosan (2-chloro-5-(2,4-
dichlorophenoxy)benzene-1,4-diol);
No chlorinated dibenzo-p-dioxin congener was detected at 365 nm, however a
chlorinated dibenzo-p-dioxin was found in samples exposed to 254 nm UV light,
indicating wavelength dependency;
Light (nm)Solution
(ml)Water TCS (mg/l) TiO2 (g/l) Sample (ml) Analysis
Time
experiment (h)
300 - 450 150
Deionized
and Natural
(River)
4 to 11 1 0,2HPLC/MS/
MS1 and 0,5
Light (nm)Solution
(ml)Water TCS (mg/l) TiO2 (g/l) Sample (ml) Analysis
Time
experiment (h)
254 and 365 600 Deionized 9 0,1 10 and 2,5GC/ITMS
and GC/MS6
13
2,4–DCP is the major intermediate;
Photocatalytic degradation of TCS over TiO2 was 95% over 6h.
Latch et al., 2003 used water samples from the Mississippi river to comprehend the
photochemical behavior of TCS. The water river was spiked with 4,7 mg/l of TCS and analyzed
the presence of dioxins trough GC/MS, HPLC and NMR. This work concludes that TCS is likely
to be converted to 2, 8 – DCDD in sunlight – irradiated surface waters.
2.3.2 Sunlight
Sanchez-Prado et al., 2006 observed the photochemical degradation of TCS samples non-
spiked with TCS from a wastewater treatment plant located in Galicia, in the northwest of Spain.
The estimated concentration of TCS was in the order of the nanograms per mililiter. The
samples were submitted at UV lamp in a wavelength equal to 254 nm and to a solar simulator
photo reactor. The same experiment was made in ultrapure water, with the influence of the pH
also studied. The experimental conditions are exposed at the Table 2.5.
Table 2.5 Main conditions of the experiment performed by Sanchez-Prado et al., 2006
Water Sample (ml) Analysis Time
experiment (h)
wastewater and deionized
5 GC/MS 0,5
The main achievements and conclusions of the study performed were:
Identified intermediates: 2,8–DCDD, another di-chlorinated dioxin or
dichlorohydroxydibenzofuran, dichlorohydroxydiphenyl ether, monochlorophenol and
dichlorophenol;
TCS photodegradation occurred in both light sources;
TCS degradation altought fast, is slower in wastewater than in ultrapure water;
Photodegradation of TCS and formation of 2,8–DCDD occurred independently of the
pH;
The photodegradation in basic pH solutions is faster than in acidic pH solutions.
2.3.3 Fenton and photo-Fenton reaction Fenton is a simple redox reaction in which Fe
2+ is oxidized to Fe
3+ and H2O2 is reduced to
hydroxide ion (OH-) and OH
● (eq.2.1) (Júnior. et al., 2012):
(eq.2.1)
14
In the absence of light, the Fe3+
can be reduced to ferrous ion by a second molecule of H2O2
(eq.2.2), (Júnior. et al., 2012):
(eq.2.2)
For the degradation of organic molecules, the optimum pH for the Fenton reaction is in the
range of pH of 2-4 (Júnior et al., 2012; Bauer & Fallmann, 1997). One way to accelerate the
Fenton reaction is thought the irradiation of ultraviolet light, giving the name photo-assisted
Fenton or photo-Fenton reaction (Júnior et al., 2012). The photo-reaction produces additional
OH● radicals and leads to the recycling of the Fe
2+ catalyst (Bauer & Fallmann, 1997). The
general mechanism is show in the eq.2.3.
(eq.2.3)
Yang et al., 2011 determined the rate constants and identified intermediates for the reaction of
Fe (VI) with triclosan and evaluated the toxicity changes during the Fe (VI) oxidation of triclosan
using algal toxicity tests. The conditions of the Fenton reaction experiment are reported in the
Table 2.6. For the identification of the intermediate products samples were adjusted to a pH
equal to 2.
Main conditions are presented in the Table 2.6.
Table 2.6 Main conditions of the Fenton reaction experiment performed by Yang et al., 2011
The main achievements and conclusions of the study performed were:
Identified intermediates: 2,4–DCP, 2-chlorobenzoquinone, chlorophenol and
hydroquinone of triclosan;
The proposed mechanism for the oxidation of triclosan by the Fe(VI) involves the
scission of the ether bond and phenoxy radical addition reaction;
The degradation processes of triclosan resulted in a significant decreased of algal
toxicity.
Solution
(ml)pH Water TCS (mg/l)
[FeO4]2-
(mg/l)Analysis
Time
experiment (h)
150 7 - 10 Deionized 0,87 5
GC/MS and
RRLC –
MS/MS
1,5
15
Son et al., 2010 studied the degradation efficiency of TCS in the Fenton reaction, photo-Fenton
reaction and photolysis (UV-C only). In this work it was estimated the participation of OH●
radicals into the reactions by adding methanol, a radical scavenger. In all the reactions the
concentration of TCS and the duration of the experiments were identical; in the photolysis
experiment the UV-C lamps had a wavelength of 254 nm. The main conditions of the Fenton
and photo-Fenton reaction are reported in the Table 2.7 and Table 2.8.
Table 2.7 Main conditions of the Fenton reaction performed by Son et al., 2010
Table 2.8 Main conditions of the photo-Fenton reaction experiment performed by Son et al., 2010
The main achievements and conclusions of the study performed were:
Identified intermediates: Chloride (ionic intermediate of TCS);
TCS was completely degraded after 90 min under photolysis (UV-C), and after 30 min
in the Fenton and photo-Fenton.
The primary degradation mechanism in both Fenton and photolysis is oxidation by OH●
radicals. The presence of methanol, considerably reduced the degradation rate of TCS
in all tree reactions, but with more expression in the Fenton and photolysis reactions;
The reversible reaction of Fe2+
to Fe3+
occurs in the photo-Fenton reaction, but not in
the Fenton reaction;
The photo-Fenton reaction can overcome the disadvantages of the Fenton reaction like
sludge production, the use of expensive H2O2 and pH adjustment.
Degradation products Dioxins, specifically 2,8–DCDD, are one of the most dangerous by-products produced in the
photodegradation of TCS. Dioxin can be highly carcinogenic and can cause health problems as
severe as weakening of the immune system, decreased fertility, altered sex hormones,
miscarriage, birth defects and cancer (Glaser, 2004).
The by-product 2,4–DCP is considered a priority pollutant by the US EPA (United States
Environmental Protection Agency), suspected to be a carcinogenic compound.
Solution
(ml)pH Water TCS (mg/l)
FeSO4.7H2O
(mg/l)
H2O2
(mg/l)Analysis
Time
experiment (h)
1500 3 Deionized 5 556 180 GC/MS 2
Light (nm)Solution
(ml)Water TCS (mg/l)
FeSO4.7H2O
(mg/l)Analysis
Time
experiment (h)
365 1500 Deionized 5 556 GC/MS 2
16
2.4 Mechanism of photocatalysis. The catalyst TiO2 The inspiration to the conception of the photocatalysis came from the natural photosynthesis
from plants. Plants use sunlight energy to grow, this process is possible by the oxidation of
water, producing O2 and the reduction of CO2 through solar energy (Kaneko & Okura, 2002).
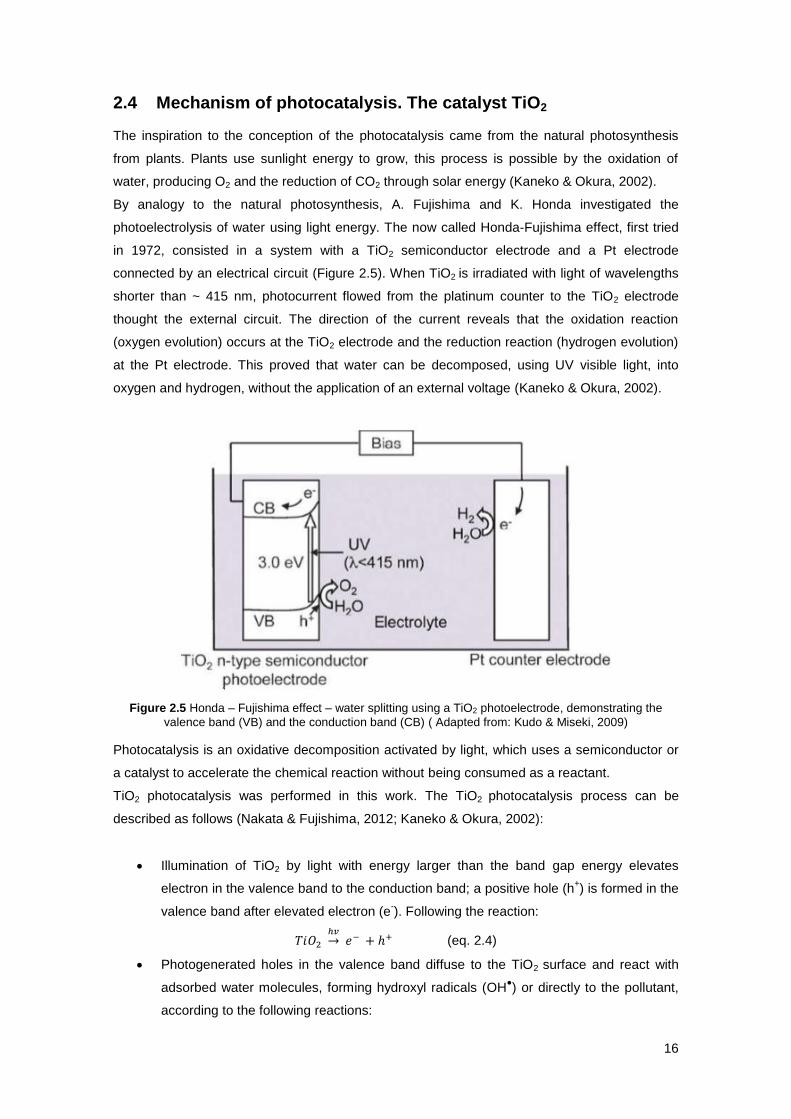
By analogy to the natural photosynthesis, A. Fujishima and K. Honda investigated the
photoelectrolysis of water using light energy. The now called Honda-Fujishima effect, first tried
in 1972, consisted in a system with a TiO2 semiconductor electrode and a Pt electrode
connected by an electrical circuit (Figure 2.5). When TiO2 is irradiated with light of wavelengths
shorter than ~ 415 nm, photocurrent flowed from the platinum counter to the TiO2 electrode
thought the external circuit. The direction of the current reveals that the oxidation reaction
(oxygen evolution) occurs at the TiO2 electrode and the reduction reaction (hydrogen evolution)
at the Pt electrode. This proved that water can be decomposed, using UV visible light, into
oxygen and hydrogen, without the application of an external voltage (Kaneko & Okura, 2002).
Figure 2.5 Honda – Fujishima effect – water splitting using a TiO2 photoelectrode, demonstrating the
valence band (VB) and the conduction band (CB) ( Adapted from: Kudo & Miseki, 2009)
Photocatalysis is an oxidative decomposition activated by light, which uses a semiconductor or
a catalyst to accelerate the chemical reaction without being consumed as a reactant.
TiO2 photocatalysis was performed in this work. The TiO2 photocatalysis process can be
described as follows (Nakata & Fujishima, 2012; Kaneko & Okura, 2002):
Illumination of TiO2 by light with energy larger than the band gap energy elevates
electron in the valence band to the conduction band; a positive hole (h+) is formed in the
valence band after elevated electron (e-). Following the reaction:
(eq. 2.4)
Photogenerated holes in the valence band diffuse to the TiO2 surface and react with
adsorbed water molecules, forming hydroxyl radicals (OH●) or directly to the pollutant,
according to the following reactions:
17
(eq. 2.5)
(eq.2.6)
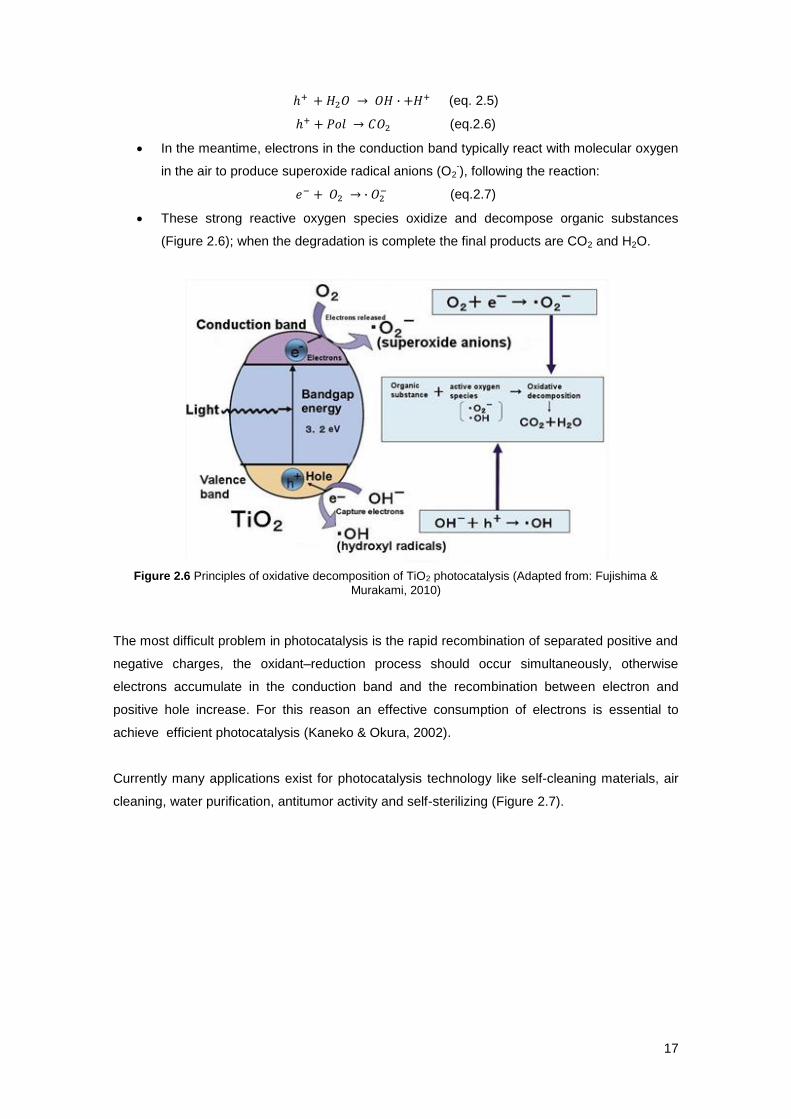
In the meantime, electrons in the conduction band typically react with molecular oxygen
in the air to produce superoxide radical anions (O2-), following the reaction:
(eq.2.7)
These strong reactive oxygen species oxidize and decompose organic substances
(Figure 2.6); when the degradation is complete the final products are CO2 and H2O.
Figure 2.6 Principles of oxidative decomposition of TiO2 photocatalysis (Adapted from: Fujishima &
Murakami, 2010)
The most difficult problem in photocatalysis is the rapid recombination of separated positive and
negative charges, the oxidant–reduction process should occur simultaneously, otherwise
electrons accumulate in the conduction band and the recombination between electron and
positive hole increase. For this reason an effective consumption of electrons is essential to
achieve efficient photocatalysis (Kaneko & Okura, 2002).
Currently many applications exist for photocatalysis technology like self-cleaning materials, air
cleaning, water purification, antitumor activity and self-sterilizing (Figure 2.7).
18
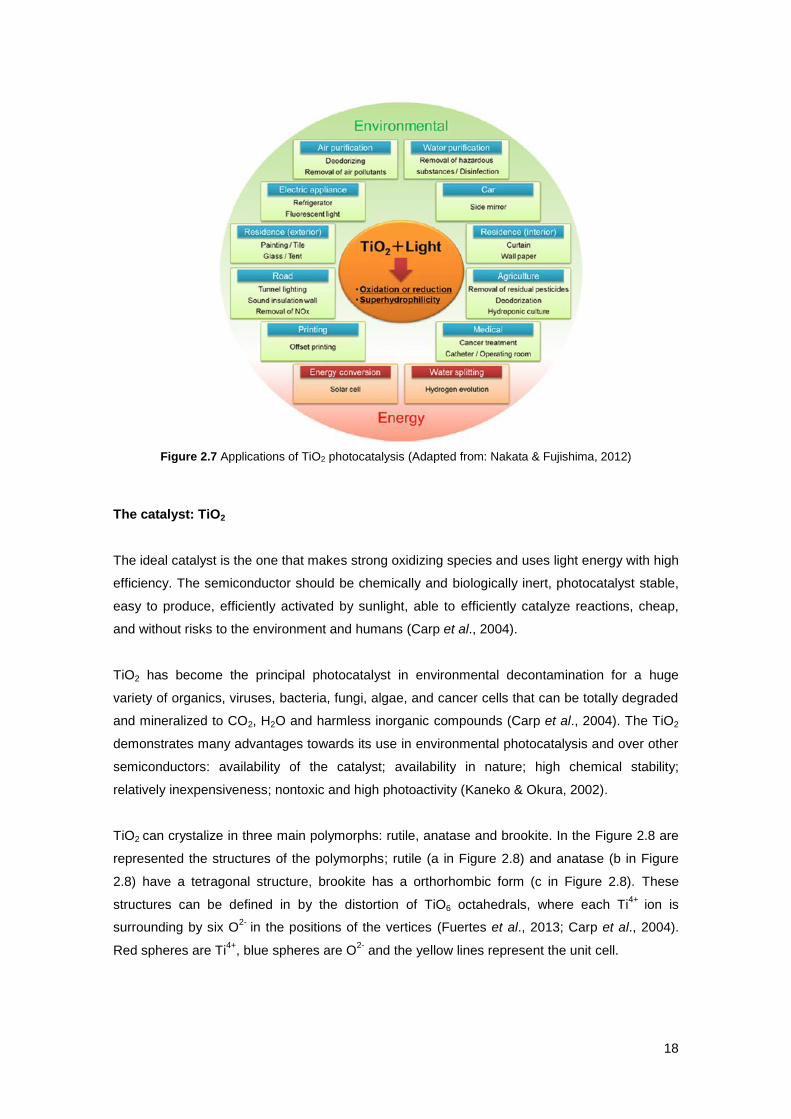
Figure 2.7 Applications of TiO2 photocatalysis (Adapted from: Nakata & Fujishima, 2012)
The catalyst: TiO2
The ideal catalyst is the one that makes strong oxidizing species and uses light energy with high
efficiency. The semiconductor should be chemically and biologically inert, photocatalyst stable,
easy to produce, efficiently activated by sunlight, able to efficiently catalyze reactions, cheap,
and without risks to the environment and humans (Carp et al., 2004).
TiO2 has become the principal photocatalyst in environmental decontamination for a huge
variety of organics, viruses, bacteria, fungi, algae, and cancer cells that can be totally degraded
and mineralized to CO2, H2O and harmless inorganic compounds (Carp et al., 2004). The TiO2
demonstrates many advantages towards its use in environmental photocatalysis and over other
semiconductors: availability of the catalyst; availability in nature; high chemical stability;
relatively inexpensiveness; nontoxic and high photoactivity (Kaneko & Okura, 2002).
TiO2 can crystalize in three main polymorphs: rutile, anatase and brookite. In the Figure 2.8 are
represented the structures of the polymorphs; rutile (a in Figure 2.8) and anatase (b in Figure
2.8) have a tetragonal structure, brookite has a orthorhombic form (c in Figure 2.8). These
structures can be defined in by the distortion of TiO6 octahedrals, where each Ti4+
ion is
surrounding by six O2-
in the positions of the vertices (Fuertes et al., 2013; Carp et al., 2004).
Red spheres are Ti4+
, blue spheres are O2-
and the yellow lines represent the unit cell.
19
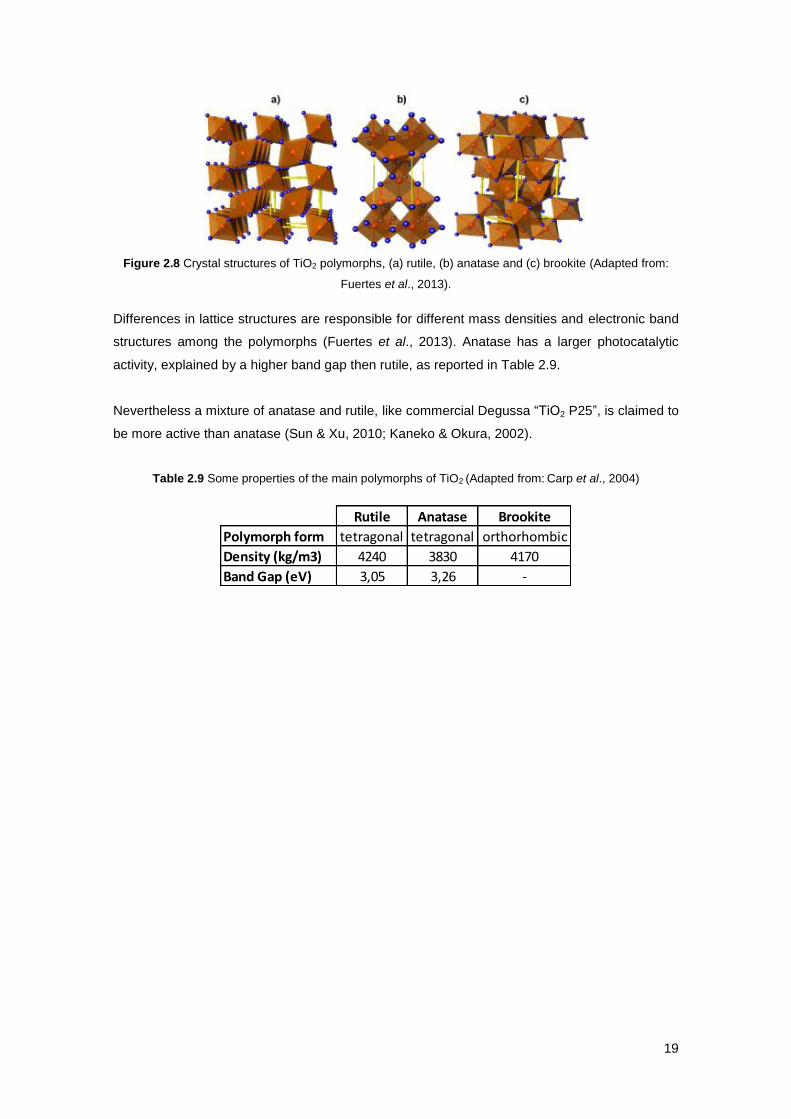
Figure 2.8 Crystal structures of TiO2 polymorphs, (a) rutile, (b) anatase and (c) brookite (Adapted from:
Fuertes et al., 2013).
Differences in lattice structures are responsible for different mass densities and electronic band
structures among the polymorphs (Fuertes et al., 2013). Anatase has a larger photocatalytic
activity, explained by a higher band gap then rutile, as reported in Table 2.9.
Nevertheless a mixture of anatase and rutile, like commercial Degussa “TiO2 P25”, is claimed to
be more active than anatase (Sun & Xu, 2010; Kaneko & Okura, 2002).
Table 2.9 Some properties of the main polymorphs of TiO2 (Adapted from: Carp et al., 2004)
Rutile Anatase Brookite
Polymorph form tetragonal tetragonal orthorhombic
Density (kg/m3) 4240 3830 4170
Band Gap (eV) 3,05 3,26 -

20
21
3 Methodology
3.1 Experimental setup
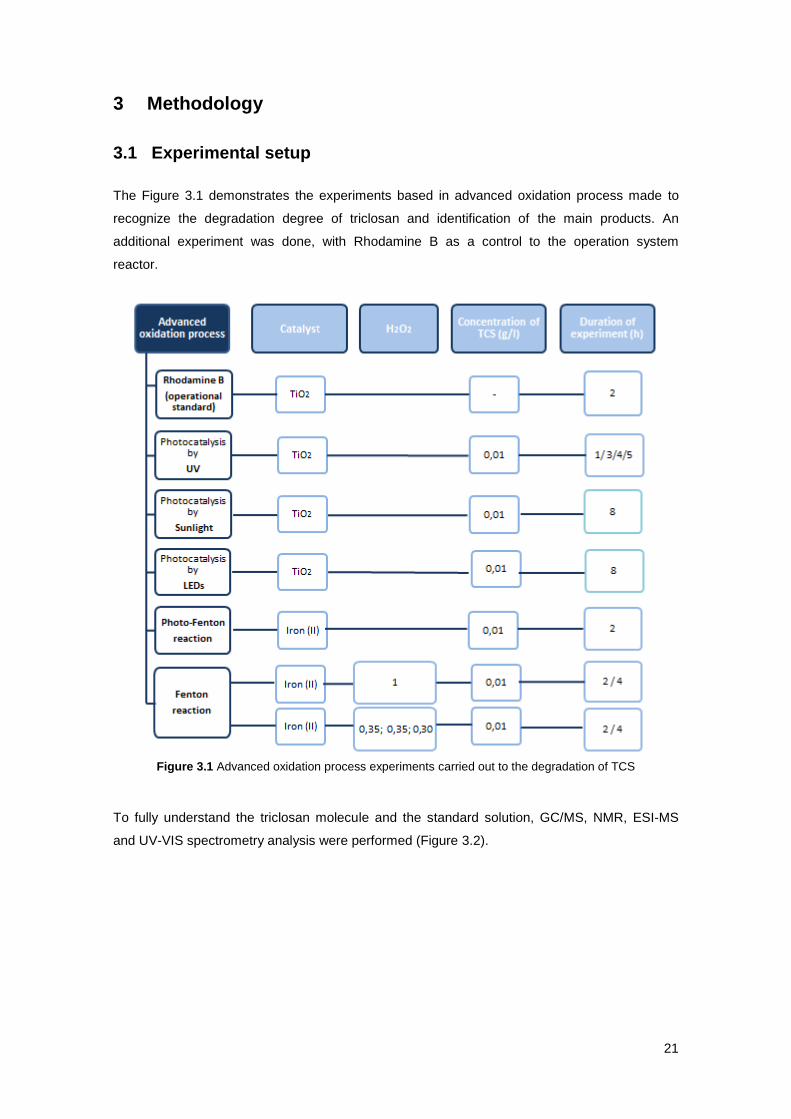
The Figure 3.1 demonstrates the experiments based in advanced oxidation process made to
recognize the degradation degree of triclosan and identification of the main products. An
additional experiment was done, with Rhodamine B as a control to the operation system
reactor.
Figure 3.1 Advanced oxidation process experiments carried out to the degradation of TCS
To fully understand the triclosan molecule and the standard solution, GC/MS, NMR, ESI-MS
and UV-VIS spectrometry analysis were performed (Figure 3.2).
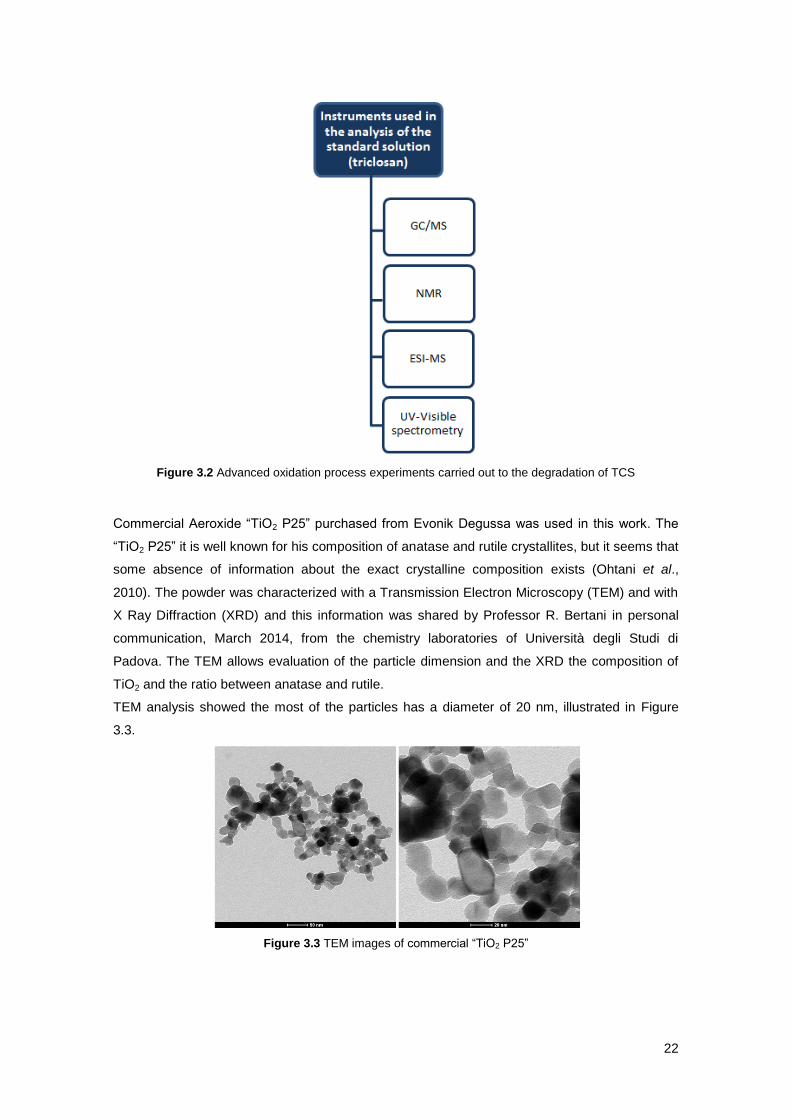
22
Figure 3.2 Advanced oxidation process experiments carried out to the degradation of TCS
Commercial Aeroxide “TiO2 P25” purchased from Evonik Degussa was used in this work. The
“TiO2 P25” it is well known for his composition of anatase and rutile crystallites, but it seems that
some absence of information about the exact crystalline composition exists (Ohtani et al.,
2010). The powder was characterized with a Transmission Electron Microscopy (TEM) and with
X Ray Diffraction (XRD) and this information was shared by Professor R. Bertani in personal
communication, March 2014, from the chemistry laboratories of Università degli Studi di
Padova. The TEM allows evaluation of the particle dimension and the XRD the composition of
TiO2 and the ratio between anatase and rutile.
TEM analysis showed the most of the particles has a diameter of 20 nm, illustrated in Figure
3.3.
Figure 3.3 TEM images of commercial “TiO2 P25”
23
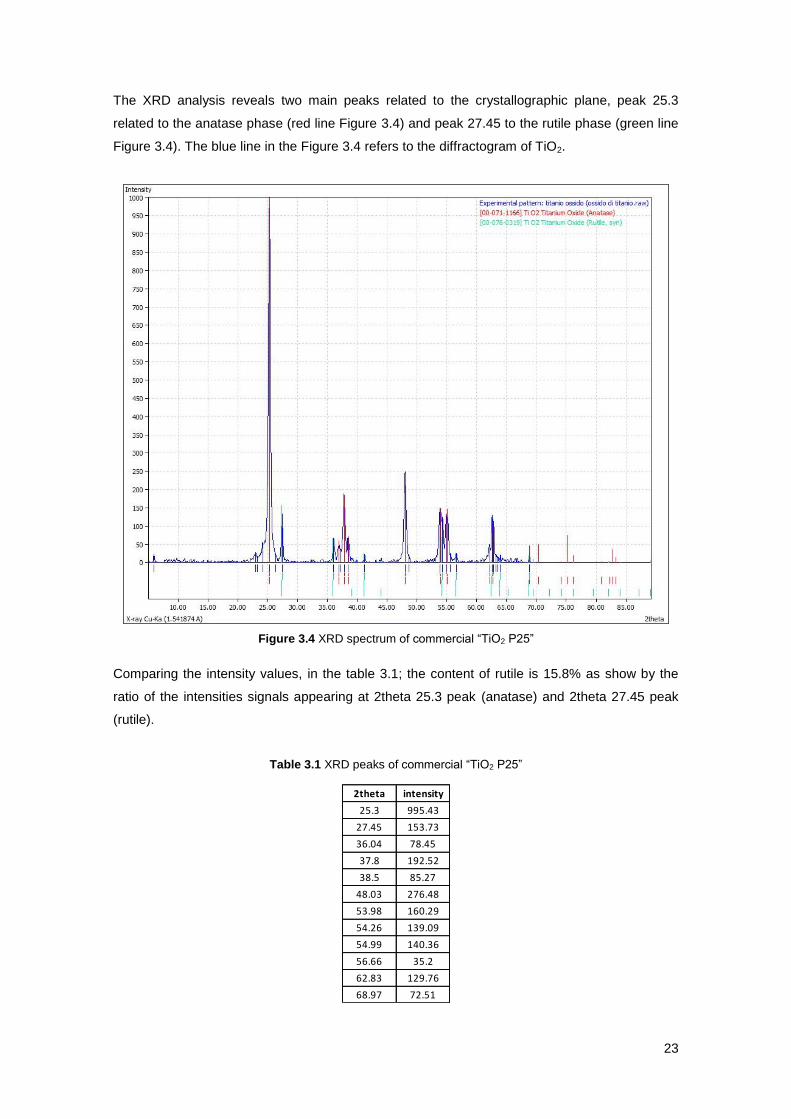
The XRD analysis reveals two main peaks related to the crystallographic plane, peak 25.3
related to the anatase phase (red line Figure 3.4) and peak 27.45 to the rutile phase (green line
Figure 3.4). The blue line in the Figure 3.4 refers to the diffractogram of TiO2.
Figure 3.4 XRD spectrum of commercial “TiO2 P25”
Comparing the intensity values, in the table 3.1; the content of rutile is 15.8% as show by the
ratio of the intensities signals appearing at 2theta 25.3 peak (anatase) and 2theta 27.45 peak
(rutile).
Table 3.1 XRD peaks of commercial “TiO2 P25”
2theta intensity
25.3 995.43
27.45 153.73
36.04 78.45
37.8 192.52
38.5 85.27
48.03 276.48
53.98 160.29
54.26 139.09
54.99 140.36
56.66 35.2
62.83 129.76
68.97 72.51
24
According to the information in the label product the specific surface area is 50 ± 15 m2/g, the
percentage in weight of TiO2 is 99.5% and the typical crystalline composition was 70-78%
anatase, 10-15% rutile and 7-20% amorphous phase.
In all the experiments the maximal amount of solubility of TCS in water was chosen given the
difficulties of determination in the GC/MS analysis. The maximum solubility of TCS in distilled
water is 0,01 g/l at 20ºC (SCCS, 2010; Yu et al., 2006).
The amount of TiO2 was chosen based on literature, Rafqah et al., 2006, compared different
concentrations of commercial “TiO2 P25” (0.2, 0.5, 1, and 2.5 g/l) concluded that the most
efficient concentration was 1 g/l. Since the concentration of 0,5 g/l in this study yielded
approximated values of efficiency has the concentration 1 g/l, the concentration of 0,5 g/l of
TiO2 was used. The standard solution was prepared by dissolving triclosan in deionized
laboratory water.
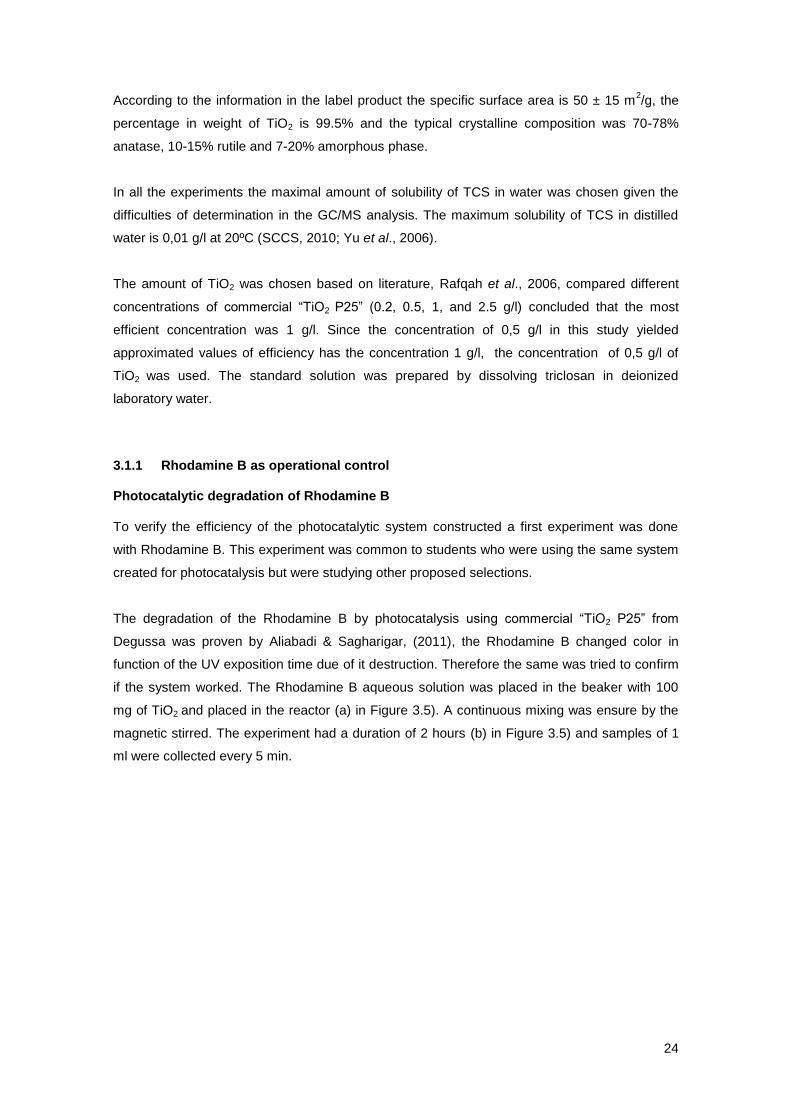
3.1.1 Rhodamine B as operational control Photocatalytic degradation of Rhodamine B To verify the efficiency of the photocatalytic system constructed a first experiment was done
with Rhodamine B. This experiment was common to students who were using the same system
created for photocatalysis but were studying other proposed selections.
The degradation of the Rhodamine B by photocatalysis using commercial “TiO2 P25” from
Degussa was proven by Aliabadi & Sagharigar, (2011), the Rhodamine B changed color in
function of the UV exposition time due of it destruction. Therefore the same was tried to confirm
if the system worked. The Rhodamine B aqueous solution was placed in the beaker with 100
mg of TiO2 and placed in the reactor (a) in Figure 3.5). A continuous mixing was ensure by the
magnetic stirred. The experiment had a duration of 2 hours (b) in Figure 3.5) and samples of 1
ml were collected every 5 min.
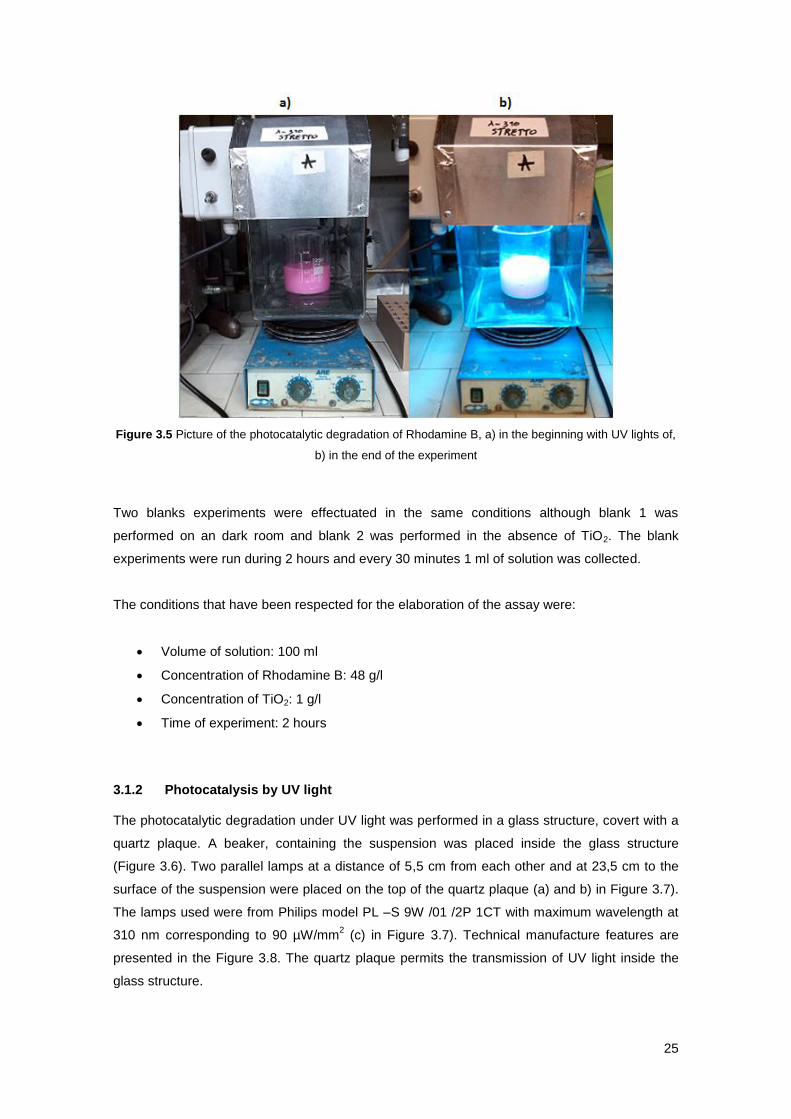
25
Figure 3.5 Picture of the photocatalytic degradation of Rhodamine B, a) in the beginning with UV lights of,
b) in the end of the experiment
Two blanks experiments were effectuated in the same conditions although blank 1 was
performed on an dark room and blank 2 was performed in the absence of TiO2. The blank
experiments were run during 2 hours and every 30 minutes 1 ml of solution was collected.
The conditions that have been respected for the elaboration of the assay were:
Volume of solution: 100 ml
Concentration of Rhodamine B: 48 g/l
Concentration of TiO2: 1 g/l
Time of experiment: 2 hours
3.1.2 Photocatalysis by UV light The photocatalytic degradation under UV light was performed in a glass structure, covert with a
quartz plaque. A beaker, containing the suspension was placed inside the glass structure
(Figure 3.6). Two parallel lamps at a distance of 5,5 cm from each other and at 23,5 cm to the
surface of the suspension were placed on the top of the quartz plaque (a) and b) in Figure 3.7).
The lamps used were from Philips model PL –S 9W /01 /2P 1CT with maximum wavelength at
310 nm corresponding to 90 µW/mm2 (c) in Figure 3.7). Technical manufacture features are
presented in the Figure 3.8. The quartz plaque permits the transmission of UV light inside the
glass structure.
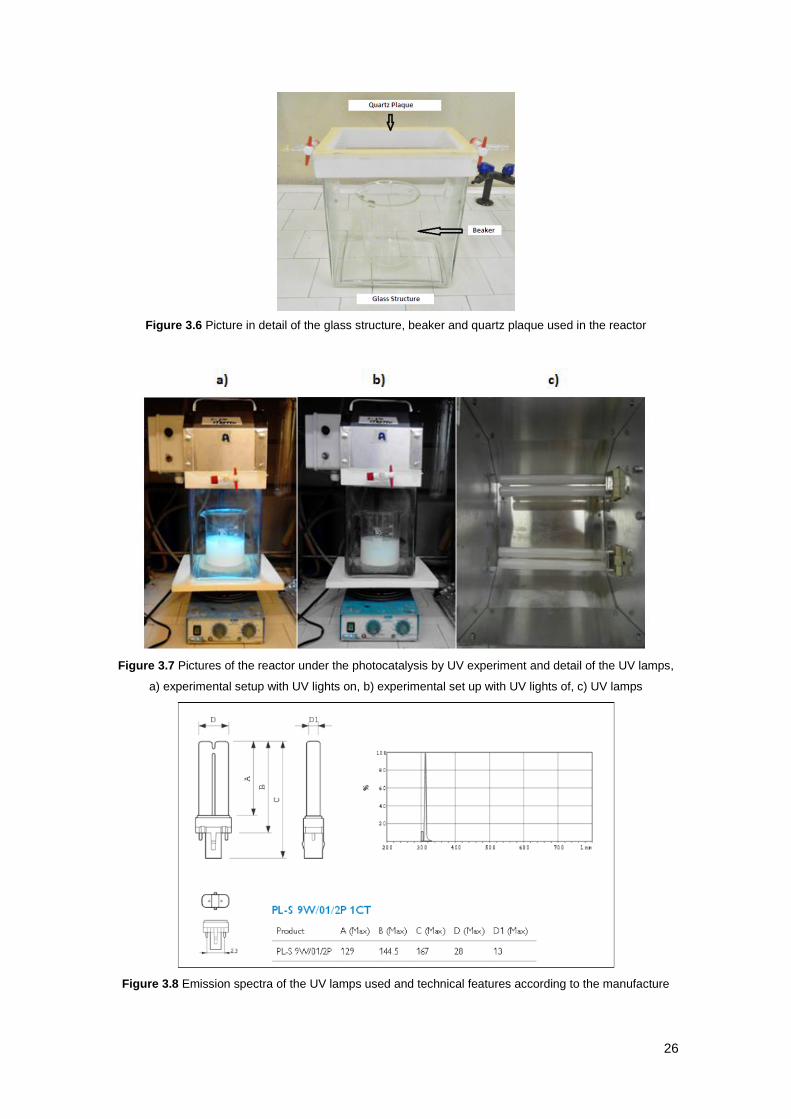
26
Figure 3.6 Picture in detail of the glass structure, beaker and quartz plaque used in the reactor
Figure 3.7 Pictures of the reactor under the photocatalysis by UV experiment and detail of the UV lamps,
a) experimental setup with UV lights on, b) experimental set up with UV lights of, c) UV lamps
Figure 3.8 Emission spectra of the UV lamps used and technical features according to the manufacture
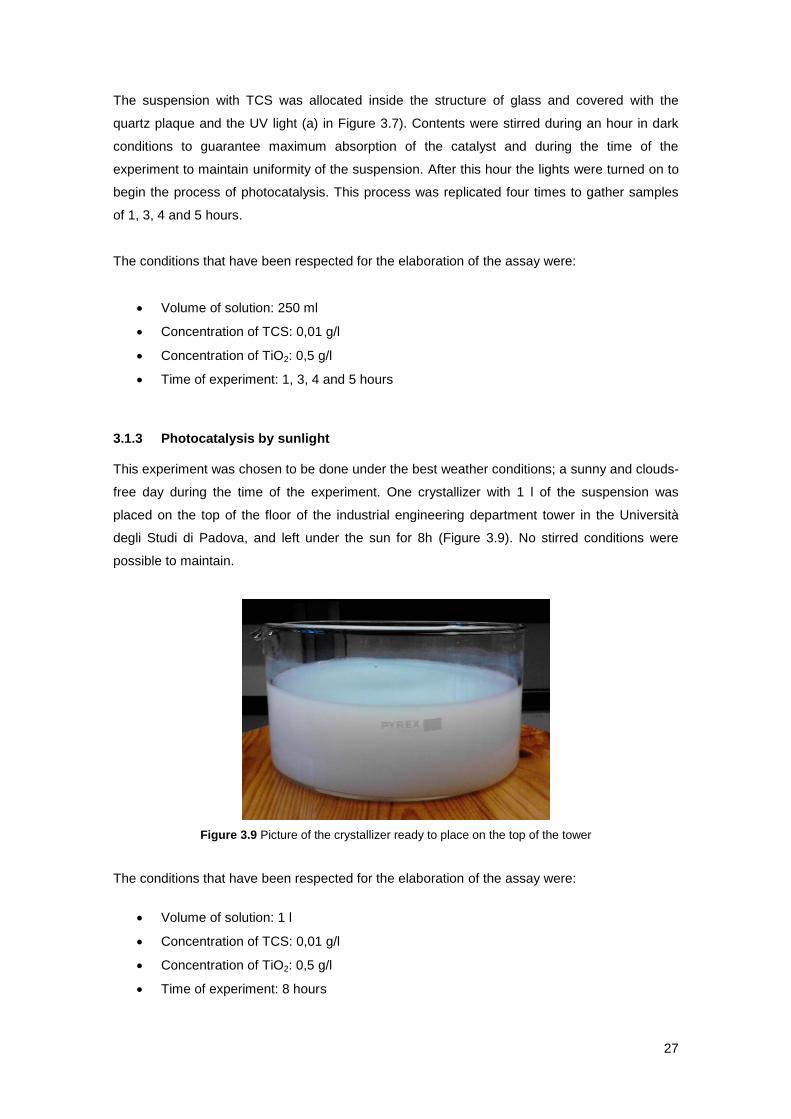
27
The suspension with TCS was allocated inside the structure of glass and covered with the
quartz plaque and the UV light (a) in Figure 3.7). Contents were stirred during an hour in dark
conditions to guarantee maximum absorption of the catalyst and during the time of the
experiment to maintain uniformity of the suspension. After this hour the lights were turned on to
begin the process of photocatalysis. This process was replicated four times to gather samples
of 1, 3, 4 and 5 hours.
The conditions that have been respected for the elaboration of the assay were:
Volume of solution: 250 ml
Concentration of TCS: 0,01 g/l
Concentration of TiO2: 0,5 g/l
Time of experiment: 1, 3, 4 and 5 hours
3.1.3 Photocatalysis by sunlight This experiment was chosen to be done under the best weather conditions; a sunny and clouds-
free day during the time of the experiment. One crystallizer with 1 l of the suspension was
placed on the top of the floor of the industrial engineering department tower in the Università
degli Studi di Padova, and left under the sun for 8h (Figure 3.9). No stirred conditions were
possible to maintain.
Figure 3.9 Picture of the crystallizer ready to place on the top of the tower
The conditions that have been respected for the elaboration of the assay were:
Volume of solution: 1 l
Concentration of TCS: 0,01 g/l
Concentration of TiO2: 0,5 g/l
Time of experiment: 8 hours
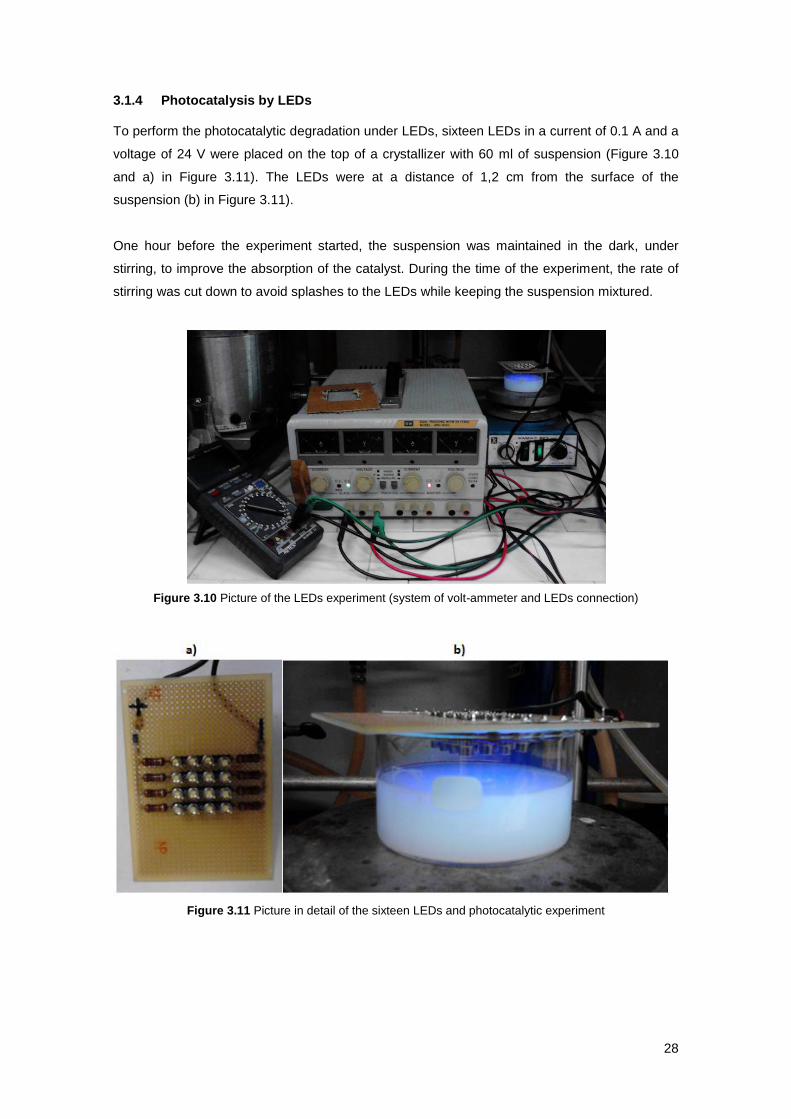
28
3.1.4 Photocatalysis by LEDs To perform the photocatalytic degradation under LEDs, sixteen LEDs in a current of 0.1 A and a
voltage of 24 V were placed on the top of a crystallizer with 60 ml of suspension (Figure 3.10
and a) in Figure 3.11). The LEDs were at a distance of 1,2 cm from the surface of the
suspension (b) in Figure 3.11).
One hour before the experiment started, the suspension was maintained in the dark, under
stirring, to improve the absorption of the catalyst. During the time of the experiment, the rate of
stirring was cut down to avoid splashes to the LEDs while keeping the suspension mixtured.
Figure 3.10 Picture of the LEDs experiment (system of volt-ammeter and LEDs connection)
Figure 3.11 Picture in detail of the sixteen LEDs and photocatalytic experiment
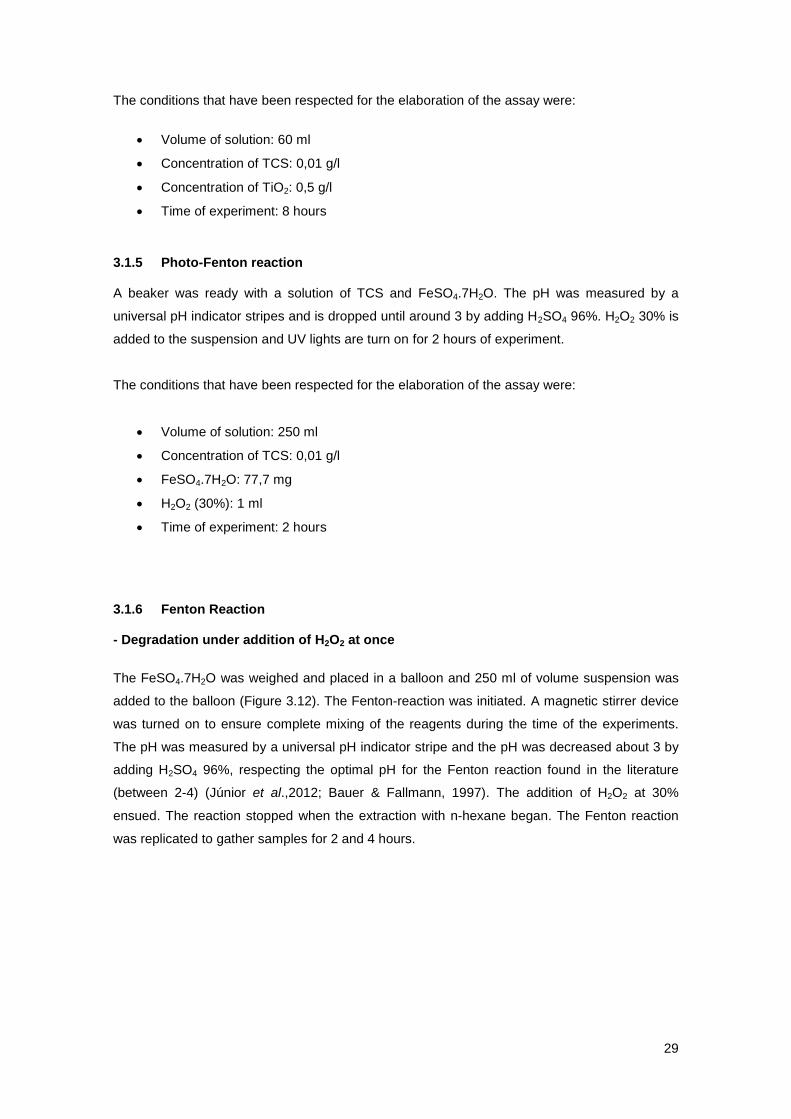
29
The conditions that have been respected for the elaboration of the assay were:
Volume of solution: 60 ml
Concentration of TCS: 0,01 g/l
Concentration of TiO2: 0,5 g/l
Time of experiment: 8 hours
3.1.5 Photo-Fenton reaction A beaker was ready with a solution of TCS and FeSO4.7H2O. The pH was measured by a
universal pH indicator stripes and is dropped until around 3 by adding H2SO4 96%. H2O2 30% is
added to the suspension and UV lights are turn on for 2 hours of experiment.
The conditions that have been respected for the elaboration of the assay were:
Volume of solution: 250 ml
Concentration of TCS: 0,01 g/l
FeSO4.7H2O: 77,7 mg
H2O2 (30%): 1 ml
Time of experiment: 2 hours
3.1.6 Fenton Reaction - Degradation under addition of H2O2 at once
The FeSO4.7H2O was weighed and placed in a balloon and 250 ml of volume suspension was
added to the balloon (Figure 3.12). The Fenton-reaction was initiated. A magnetic stirrer device
was turned on to ensure complete mixing of the reagents during the time of the experiments.
The pH was measured by a universal pH indicator stripe and the pH was decreased about 3 by
adding H2SO4 96%, respecting the optimal pH for the Fenton reaction found in the literature
(between 2-4) (Júnior et al.,2012; Bauer & Fallmann, 1997). The addition of H2O2 at 30%
ensued. The reaction stopped when the extraction with n-hexane began. The Fenton reaction
was replicated to gather samples for 2 and 4 hours.
30
Figure 3.12 Picture of the development of the Fenton reaction experiment
The conditions that have been respected for the elaboration of the assay were:
Volume of solution: 250 ml
Concentration of TCS: 0,01 g/l
FeSO4.7H2O: 77,7 mg
H2O2 (30%): 1 ml
Time of experiment: 2 and 4 hours
- Degradation under addition of H2O2 in 3 instants of time
The FeSO4.7H2O was weigh and placed in a balloon, 250 ml of volume suspension was added
to the balloon. The magnetic stirrer device ensured complete mixing of the reagents during the
experiments time (2 and 4 hours). The pH was measured by a universal pH indicator stripe and
is dropped until around 3 by adding H2SO4 96% and the addition of H2O2 30% was made in 3
separate times during the duration of the experiment. For instance in the 2h experiment, the
addition of H2O2 was made at 20 min (0,35 ml), 60 min (0,35 ml) and at 100 min (0,30 ml).
The concentration of FeSO4.7H2O and H2O2 are based on the concentrations adopted in the
studies of I. Casalatina (I. Casalatina, personal communication, May 2014) in the Laboratory of
the Università degli Studi di Padova and it was respected in the photo-Fenton and Fenton
reaction to maintain uniformity in the experiments.
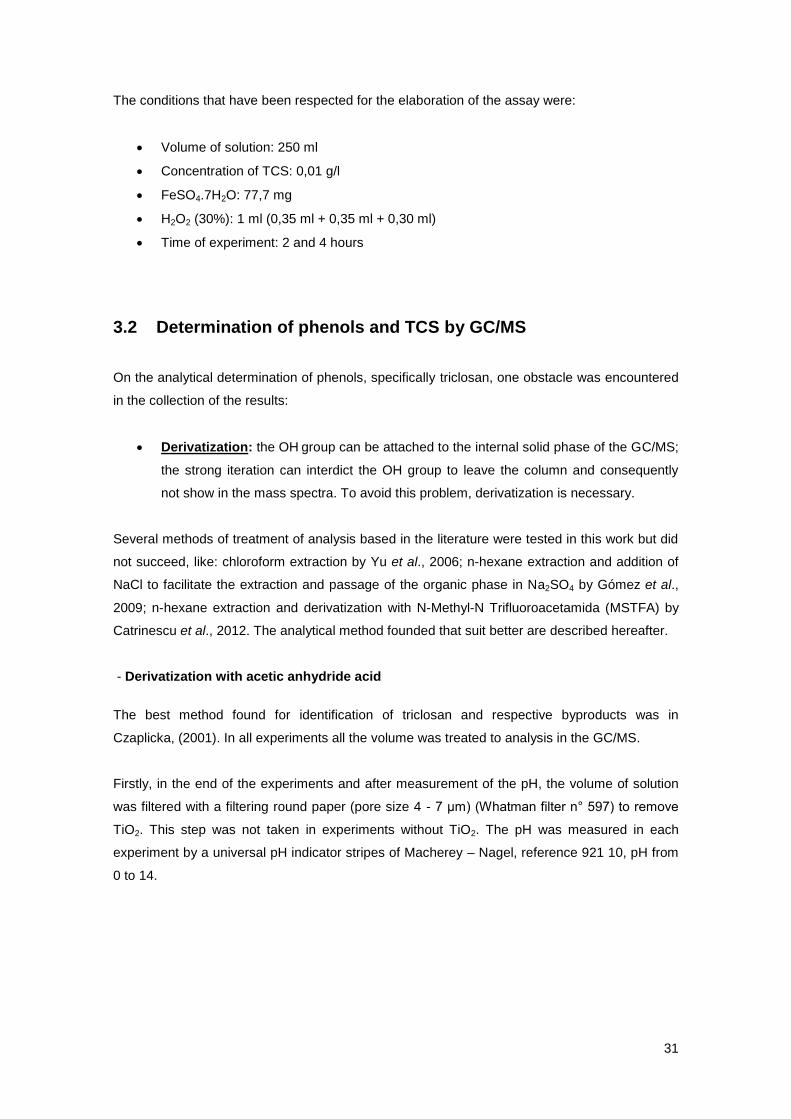
31
The conditions that have been respected for the elaboration of the assay were:
Volume of solution: 250 ml
Concentration of TCS: 0,01 g/l
FeSO4.7H2O: 77,7 mg
H2O2 (30%): 1 ml (0,35 ml + 0,35 ml + 0,30 ml)
Time of experiment: 2 and 4 hours
3.2 Determination of phenols and TCS by GC/MS
On the analytical determination of phenols, specifically triclosan, one obstacle was encountered
in the collection of the results:
Derivatization: the OH group can be attached to the internal solid phase of the GC/MS;
the strong iteration can interdict the OH group to leave the column and consequently
not show in the mass spectra. To avoid this problem, derivatization is necessary.
Several methods of treatment of analysis based in the literature were tested in this work but did
not succeed, like: chloroform extraction by Yu et al., 2006; n-hexane extraction and addition of
NaCl to facilitate the extraction and passage of the organic phase in Na2SO4 by Gómez et al.,
2009; n-hexane extraction and derivatization with N-Methyl-N Trifluoroacetamida (MSTFA) by
Catrinescu et al., 2012. The analytical method founded that suit better are described hereafter.
- Derivatization with acetic anhydride acid
The best method found for identification of triclosan and respective byproducts was in
Czaplicka, (2001). In all experiments all the volume was treated to analysis in the GC/MS.
Firstly, in the end of the experiments and after measurement of the pH, the volume of solution
was filtered with a filtering round paper (pore size 4 - 7 μm) (Whatman filter n° 597) to remove
TiO2. This step was not taken in experiments without TiO2. The pH was measured in each
experiment by a universal pH indicator stripes of Macherey – Nagel, reference 921 10, pH from
0 to 14.
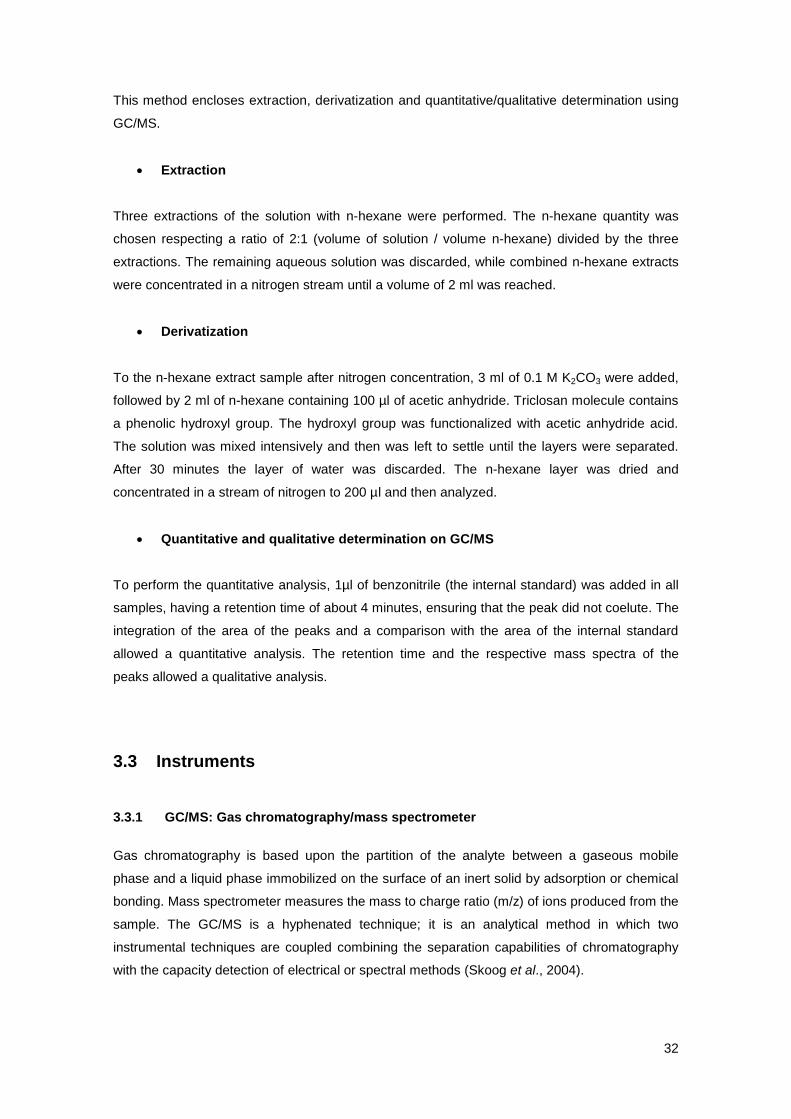
32
This method encloses extraction, derivatization and quantitative/qualitative determination using
GC/MS.
Extraction
Three extractions of the solution with n-hexane were performed. The n-hexane quantity was
chosen respecting a ratio of 2:1 (volume of solution / volume n-hexane) divided by the three
extractions. The remaining aqueous solution was discarded, while combined n-hexane extracts
were concentrated in a nitrogen stream until a volume of 2 ml was reached.
Derivatization
To the n-hexane extract sample after nitrogen concentration, 3 ml of 0.1 M K2CO3 were added,
followed by 2 ml of n-hexane containing 100 µl of acetic anhydride. Triclosan molecule contains
a phenolic hydroxyl group. The hydroxyl group was functionalized with acetic anhydride acid.
The solution was mixed intensively and then was left to settle until the layers were separated.
After 30 minutes the layer of water was discarded. The n-hexane layer was dried and
concentrated in a stream of nitrogen to 200 µl and then analyzed.
Quantitative and qualitative determination on GC/MS
To perform the quantitative analysis, 1µl of benzonitrile (the internal standard) was added in all
samples, having a retention time of about 4 minutes, ensuring that the peak did not coelute. The
integration of the area of the peaks and a comparison with the area of the internal standard
allowed a quantitative analysis. The retention time and the respective mass spectra of the
peaks allowed a qualitative analysis.
3.3 Instruments
3.3.1 GC/MS: Gas chromatography/mass spectrometer
Gas chromatography is based upon the partition of the analyte between a gaseous mobile
phase and a liquid phase immobilized on the surface of an inert solid by adsorption or chemical
bonding. Mass spectrometer measures the mass to charge ratio (m/z) of ions produced from the
sample. The GC/MS is a hyphenated technique; it is an analytical method in which two
instrumental techniques are coupled combining the separation capabilities of chromatography
with the capacity detection of electrical or spectral methods (Skoog et al., 2004).
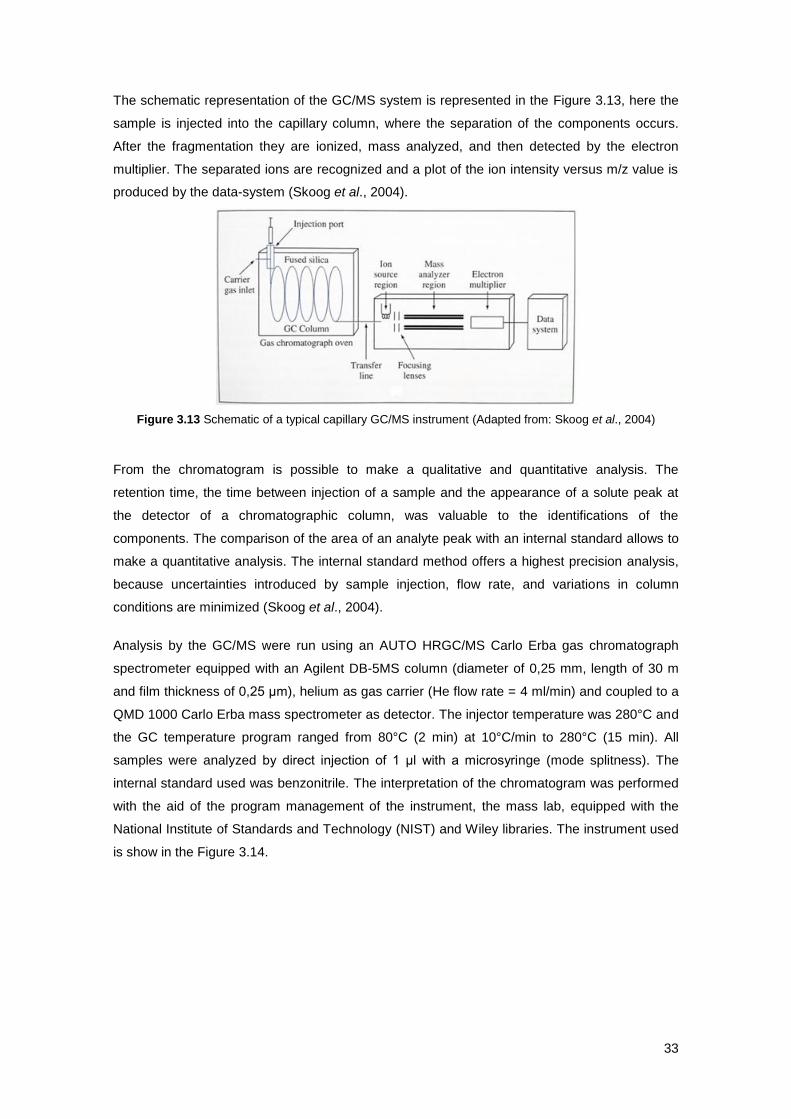
33
The schematic representation of the GC/MS system is represented in the Figure 3.13, here the
sample is injected into the capillary column, where the separation of the components occurs.
After the fragmentation they are ionized, mass analyzed, and then detected by the electron
multiplier. The separated ions are recognized and a plot of the ion intensity versus m/z value is
produced by the data-system (Skoog et al., 2004).
Figure 3.13 Schematic of a typical capillary GC/MS instrument (Adapted from: Skoog et al., 2004)
From the chromatogram is possible to make a qualitative and quantitative analysis. The
retention time, the time between injection of a sample and the appearance of a solute peak at
the detector of a chromatographic column, was valuable to the identifications of the
components. The comparison of the area of an analyte peak with an internal standard allows to
make a quantitative analysis. The internal standard method offers a highest precision analysis,
because uncertainties introduced by sample injection, flow rate, and variations in column
conditions are minimized (Skoog et al., 2004).
Analysis by the GC/MS were run using an AUTO HRGC/MS Carlo Erba gas chromatograph
spectrometer equipped with an Agilent DB-5MS column (diameter of 0,25 mm, length of 30 m
and film thickness of 0,25 μm), helium as gas carrier (He flow rate = 4 ml/min) and coupled to a
QMD 1000 Carlo Erba mass spectrometer as detector. The injector temperature was 280°C and
the GC temperature program ranged from 80°C (2 min) at 10°C/min to 280°C (15 min). All
samples were analyzed by direct injection of 1 μl with a microsyringe (mode splitness). The
internal standard used was benzonitrile. The interpretation of the chromatogram was performed
with the aid of the program management of the instrument, the mass lab, equipped with the
National Institute of Standards and Technology (NIST) and Wiley libraries. The instrument used
is show in the Figure 3.14.
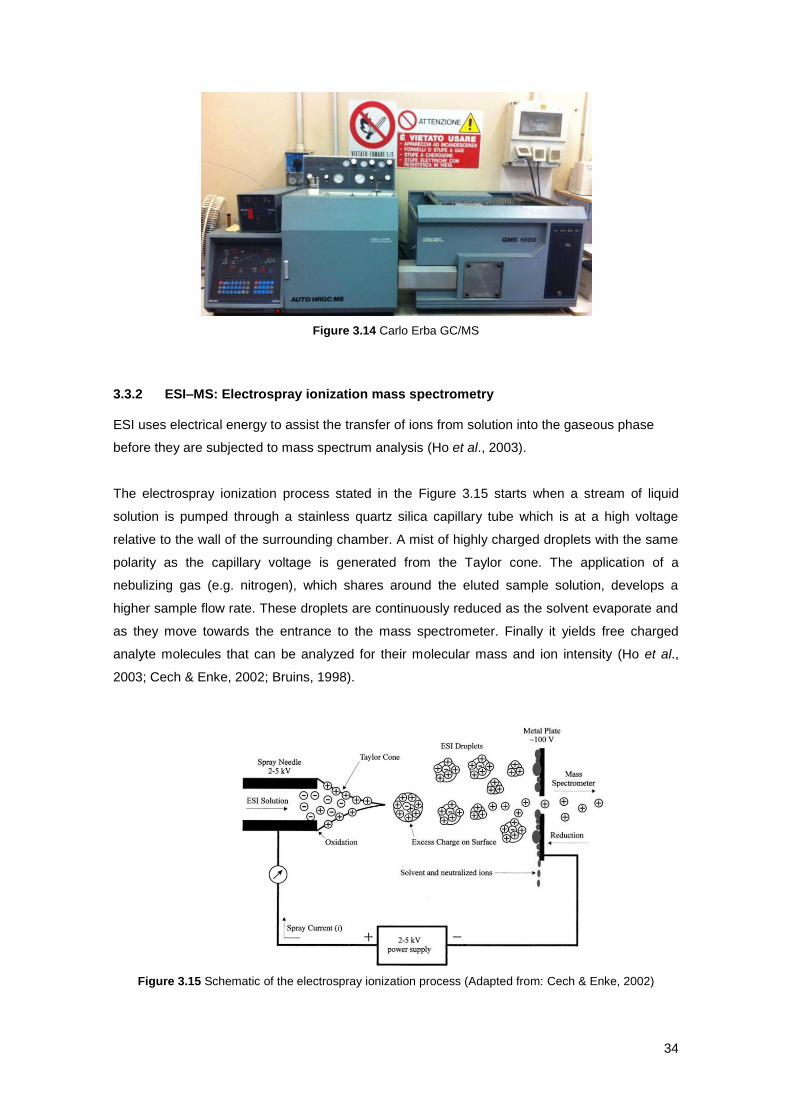
34
Figure 3.14 Carlo Erba GC/MS
3.3.2 ESI–MS: Electrospray ionization mass spectrometry
ESI uses electrical energy to assist the transfer of ions from solution into the gaseous phase
before they are subjected to mass spectrum analysis (Ho et al., 2003).
The electrospray ionization process stated in the Figure 3.15 starts when a stream of liquid
solution is pumped through a stainless quartz silica capillary tube which is at a high voltage
relative to the wall of the surrounding chamber. A mist of highly charged droplets with the same
polarity as the capillary voltage is generated from the Taylor cone. The application of a
nebulizing gas (e.g. nitrogen), which shares around the eluted sample solution, develops a
higher sample flow rate. These droplets are continuously reduced as the solvent evaporate and
as they move towards the entrance to the mass spectrometer. Finally it yields free charged
analyte molecules that can be analyzed for their molecular mass and ion intensity (Ho et al.,
2003; Cech & Enke, 2002; Bruins, 1998).
Figure 3.15 Schematic of the electrospray ionization process (Adapted from: Cech & Enke, 2002)
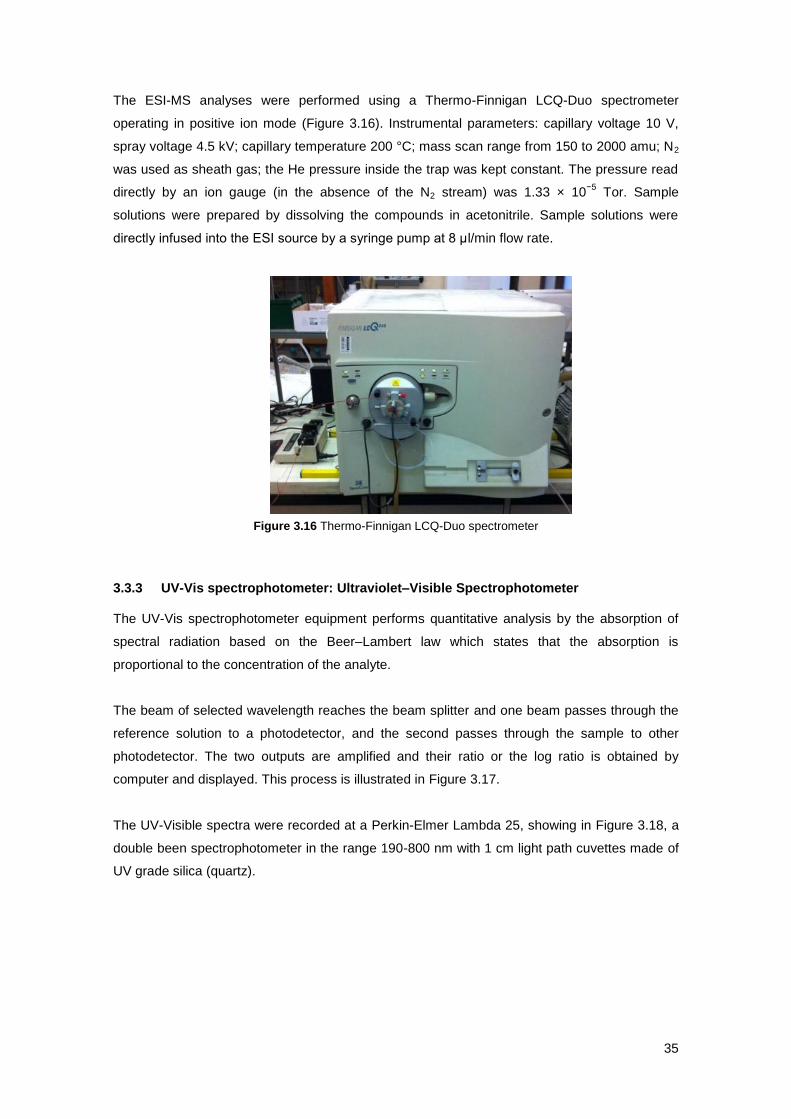
35
The ESI-MS analyses were performed using a Thermo-Finnigan LCQ-Duo spectrometer
operating in positive ion mode (Figure 3.16). Instrumental parameters: capillary voltage 10 V,
spray voltage 4.5 kV; capillary temperature 200 °C; mass scan range from 150 to 2000 amu; N2
was used as sheath gas; the He pressure inside the trap was kept constant. The pressure read
directly by an ion gauge (in the absence of the N2 stream) was 1.33 × 10⁻⁵
Tor. Sample
solutions were prepared by dissolving the compounds in acetonitrile. Sample solutions were
directly infused into the ESI source by a syringe pump at 8 μl/min flow rate.
Figure 3.16 Thermo-Finnigan LCQ-Duo spectrometer
3.3.3 UV-Vis spectrophotometer: Ultraviolet–Visible Spectrophotometer
The UV-Vis spectrophotometer equipment performs quantitative analysis by the absorption of
spectral radiation based on the Beer–Lambert law which states that the absorption is
proportional to the concentration of the analyte.
The beam of selected wavelength reaches the beam splitter and one beam passes through the
reference solution to a photodetector, and the second passes through the sample to other
photodetector. The two outputs are amplified and their ratio or the log ratio is obtained by
computer and displayed. This process is illustrated in Figure 3.17.
The UV-Visible spectra were recorded at a Perkin-Elmer Lambda 25, showing in Figure 3.18, a
double been spectrophotometer in the range 190-800 nm with 1 cm light path cuvettes made of
UV grade silica (quartz).
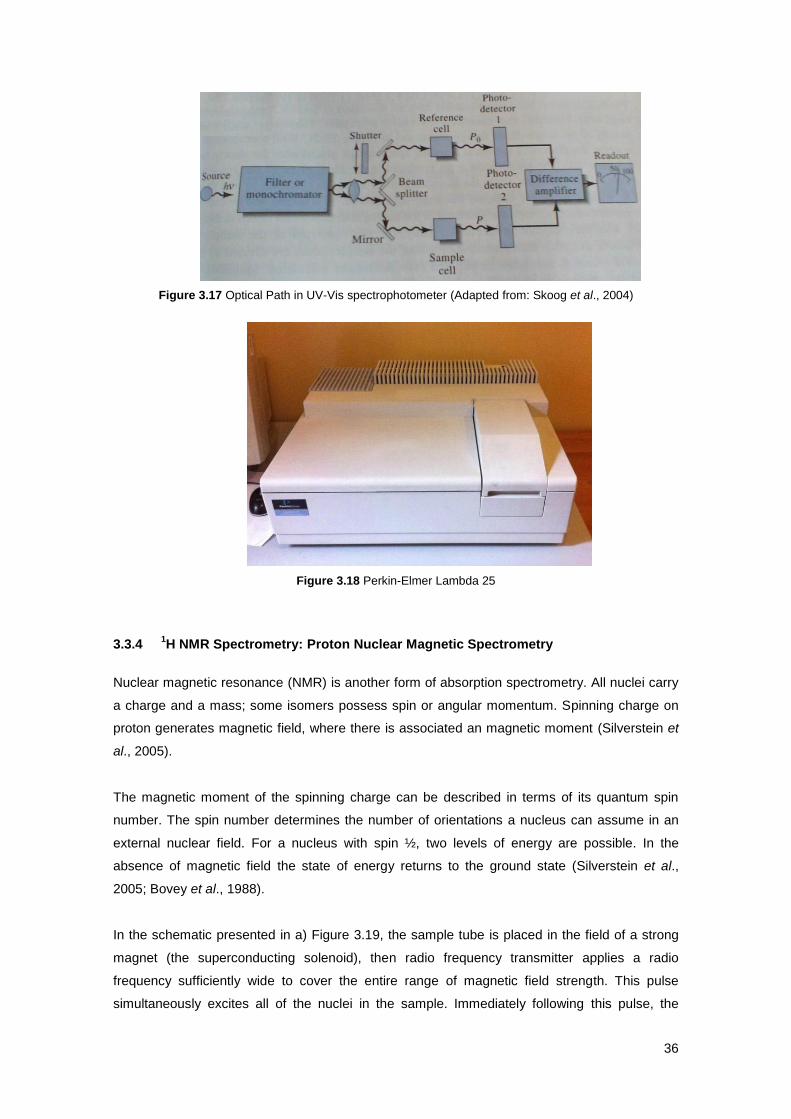
36
Figure 3.17 Optical Path in UV-Vis spectrophotometer (Adapted from: Skoog et al., 2004)
Figure 3.18 Perkin-Elmer Lambda 25
3.3.4 1H NMR Spectrometry: Proton Nuclear Magnetic Spectrometry
Nuclear magnetic resonance (NMR) is another form of absorption spectrometry. All nuclei carry
a charge and a mass; some isomers possess spin or angular momentum. Spinning charge on
proton generates magnetic field, where there is associated an magnetic moment (Silverstein et
al., 2005).
The magnetic moment of the spinning charge can be described in terms of its quantum spin
number. The spin number determines the number of orientations a nucleus can assume in an
external nuclear field. For a nucleus with spin ½, two levels of energy are possible. In the
absence of magnetic field the state of energy returns to the ground state (Silverstein et al.,
2005; Bovey et al., 1988).
In the schematic presented in a) Figure 3.19, the sample tube is placed in the field of a strong
magnet (the superconducting solenoid), then radio frequency transmitter applies a radio
frequency sufficiently wide to cover the entire range of magnetic field strength. This pulse
simultaneously excites all of the nuclei in the sample. Immediately following this pulse, the
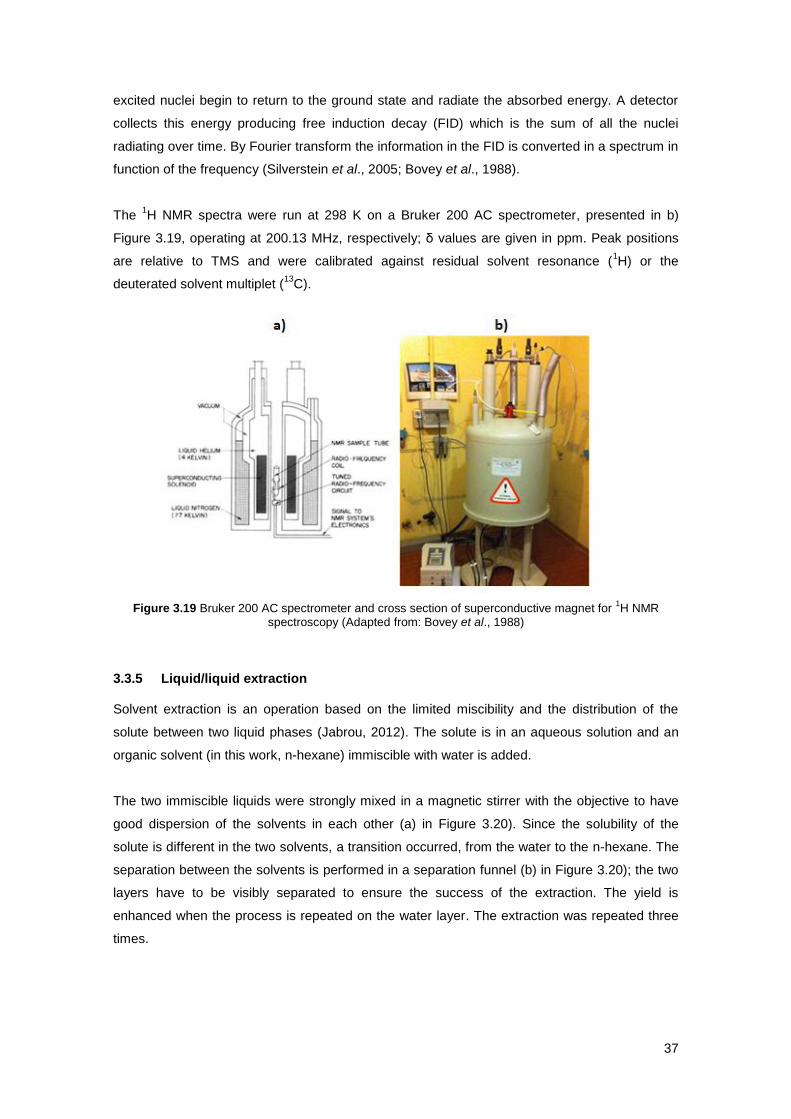
37
excited nuclei begin to return to the ground state and radiate the absorbed energy. A detector
collects this energy producing free induction decay (FID) which is the sum of all the nuclei
radiating over time. By Fourier transform the information in the FID is converted in a spectrum in
function of the frequency (Silverstein et al., 2005; Bovey et al., 1988).
The 1H NMR spectra were run at 298 K on a Bruker 200 AC spectrometer, presented in b)
Figure 3.19, operating at 200.13 MHz, respectively; δ values are given in ppm. Peak positions
are relative to TMS and were calibrated against residual solvent resonance (1H) or the
deuterated solvent multiplet (13
C).
Figure 3.19 Bruker 200 AC spectrometer and cross section of superconductive magnet for 1H NMR
spectroscopy (Adapted from: Bovey et al., 1988)
3.3.5 Liquid/liquid extraction Solvent extraction is an operation based on the limited miscibility and the distribution of the
solute between two liquid phases (Jabrou, 2012). The solute is in an aqueous solution and an
organic solvent (in this work, n-hexane) immiscible with water is added.
The two immiscible liquids were strongly mixed in a magnetic stirrer with the objective to have
good dispersion of the solvents in each other (a) in Figure 3.20). Since the solubility of the
solute is different in the two solvents, a transition occurred, from the water to the n-hexane. The
separation between the solvents is performed in a separation funnel (b) in Figure 3.20); the two
layers have to be visibly separated to ensure the success of the extraction. The yield is
enhanced when the process is repeated on the water layer. The extraction was repeated three
times.
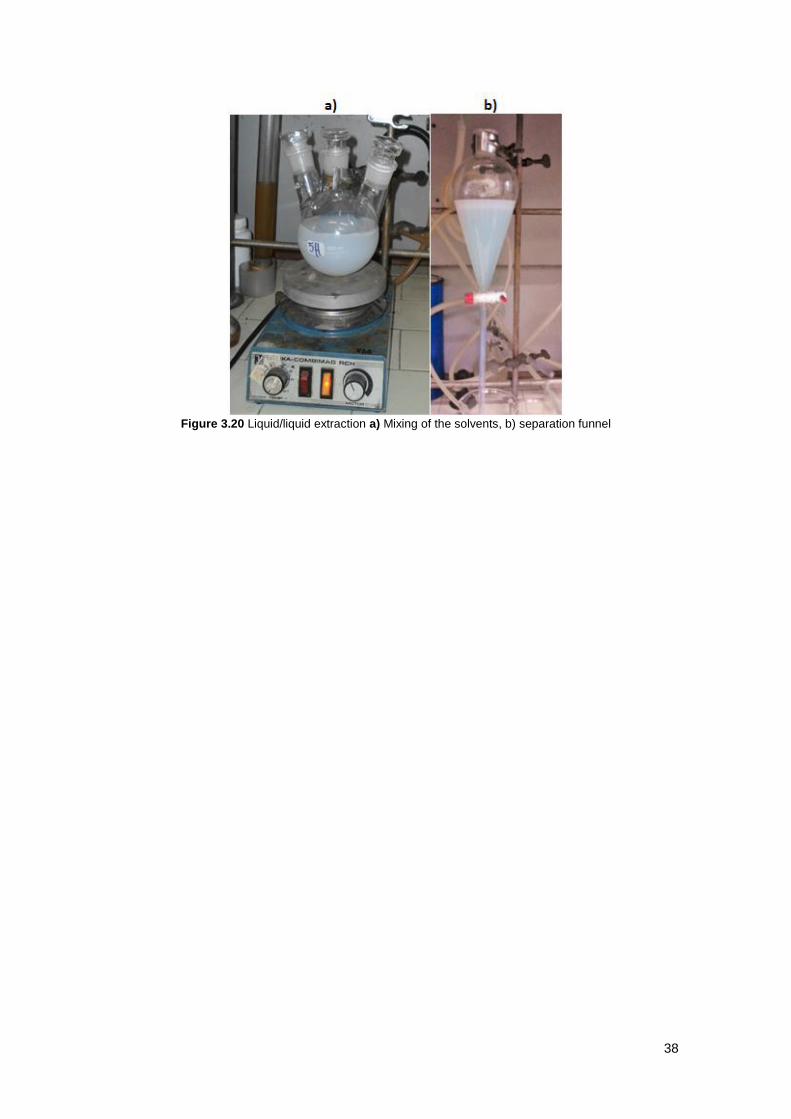
38
Figure 3.20 Liquid/liquid extraction a) Mixing of the solvents, b) separation funnel
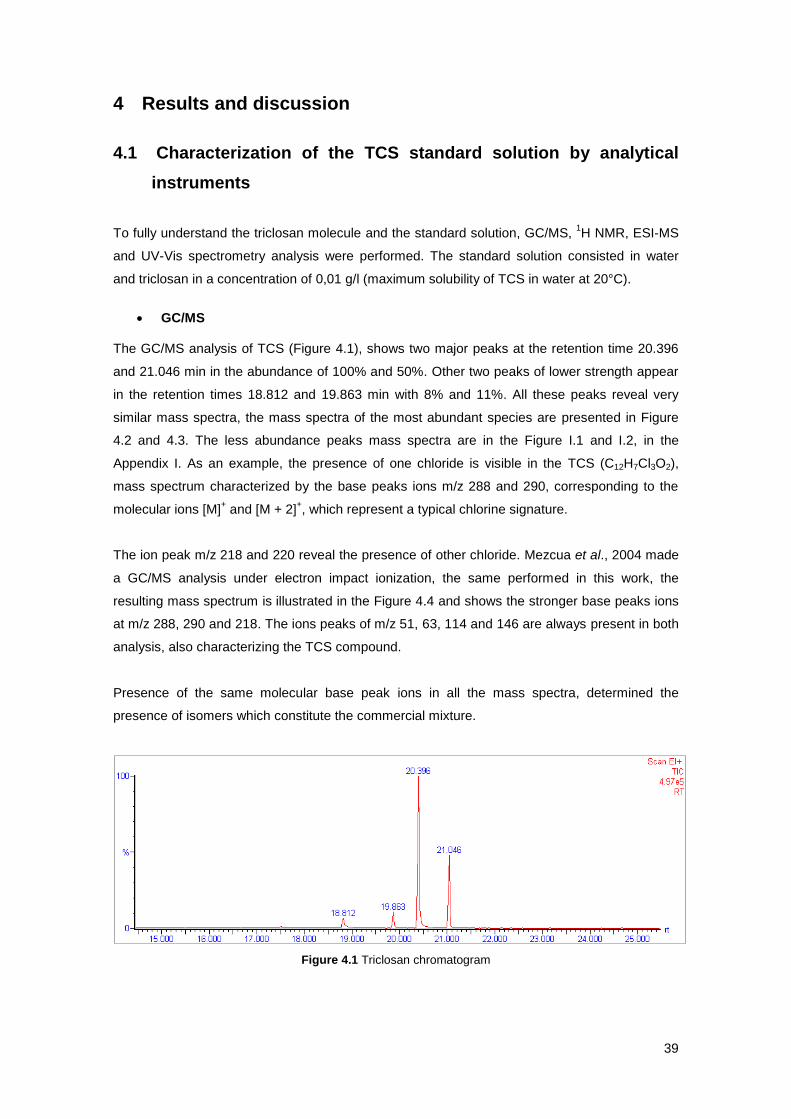
39
4 Results and discussion
4.1 Characterization of the TCS standard solution by analytical
instruments
To fully understand the triclosan molecule and the standard solution, GC/MS, 1H NMR, ESI-MS
and UV-Vis spectrometry analysis were performed. The standard solution consisted in water
and triclosan in a concentration of 0,01 g/l (maximum solubility of TCS in water at 20°C).
GC/MS
The GC/MS analysis of TCS (Figure 4.1), shows two major peaks at the retention time 20.396
and 21.046 min in the abundance of 100% and 50%. Other two peaks of lower strength appear
in the retention times 18.812 and 19.863 min with 8% and 11%. All these peaks reveal very
similar mass spectra, the mass spectra of the most abundant species are presented in Figure
4.2 and 4.3. The less abundance peaks mass spectra are in the Figure I.1 and I.2, in the
Appendix I. As an example, the presence of one chloride is visible in the TCS (C12H7Cl3O2),
mass spectrum characterized by the base peaks ions m/z 288 and 290, corresponding to the
molecular ions [M]+ and [M + 2]
+, which represent a typical chlorine signature.
The ion peak m/z 218 and 220 reveal the presence of other chloride. Mezcua et al., 2004 made
a GC/MS analysis under electron impact ionization, the same performed in this work, the
resulting mass spectrum is illustrated in the Figure 4.4 and shows the stronger base peaks ions
at m/z 288, 290 and 218. The ions peaks of m/z 51, 63, 114 and 146 are always present in both
analysis, also characterizing the TCS compound.
Presence of the same molecular base peak ions in all the mass spectra, determined the
presence of isomers which constitute the commercial mixture.
Figure 4.1 Triclosan chromatogram
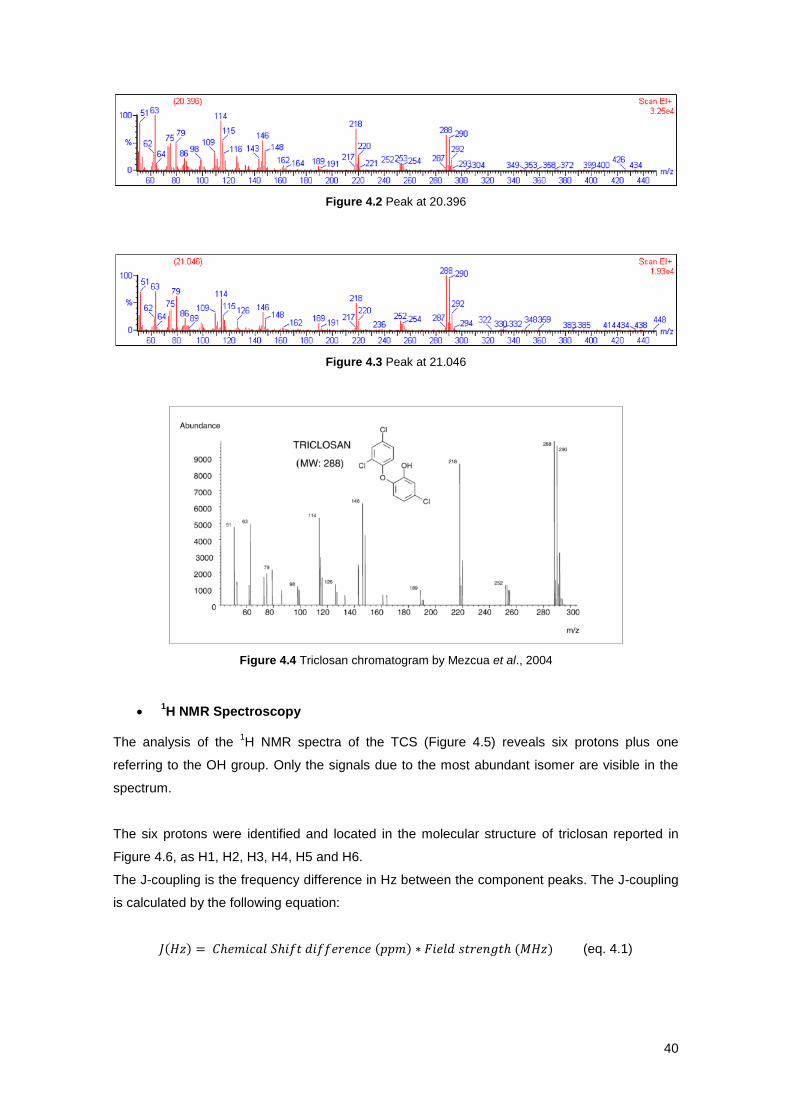
40
Figure 4.2 Peak at 20.396
Figure 4.3 Peak at 21.046
Figure 4.4 Triclosan chromatogram by Mezcua et al., 2004
1H NMR Spectroscopy
The analysis of the
1H NMR spectra of the TCS (Figure 4.5) reveals six protons plus one
referring to the OH group. Only the signals due to the most abundant isomer are visible in the
spectrum.
The six protons were identified and located in the molecular structure of triclosan reported in
Figure 4.6, as H1, H2, H3, H4, H5 and H6.
The J-coupling is the frequency difference in Hz between the component peaks. The J-coupling
is calculated by the following equation:
(eq. 4.1)

41
The H6 is a doublet centered at δ 7.54 ppm with a J-coupling of 4JH5H6 4 Hz, the H5 is a doublet
of doublets centered at δ 7.225 ppm with a J-coupling of 3JH4H5 4 Hz and a J-coupling of
4JH5H6 2
Hz, the H1 is a triplet at δ 7.05 ppm with a J-coupling of 4JH1H2 ~ 1 Hz. The H2 and H3 are
centered at δ 6.875 ppm with a J-coupling with H1 about 1Hz and the H4 is a duplet centered at
δ 6.775 ppm with a J-coupling of 3JH5H4 8 Hz. The OH is at δ 7.66 ppm.
Figure 4.5 1H NMR spectra of triclosan
Figure 4.6 Identification of the protons in the molecular structure of triclosan
ESI-MS
The ionization of TCS generates the ion peak m/z 310 with 85% relative abundance by the
addition of Na+, the peak m/z 325 (20%) is referred to the addition of K
+. These two ions appear
as part of contamination present in the equipment.
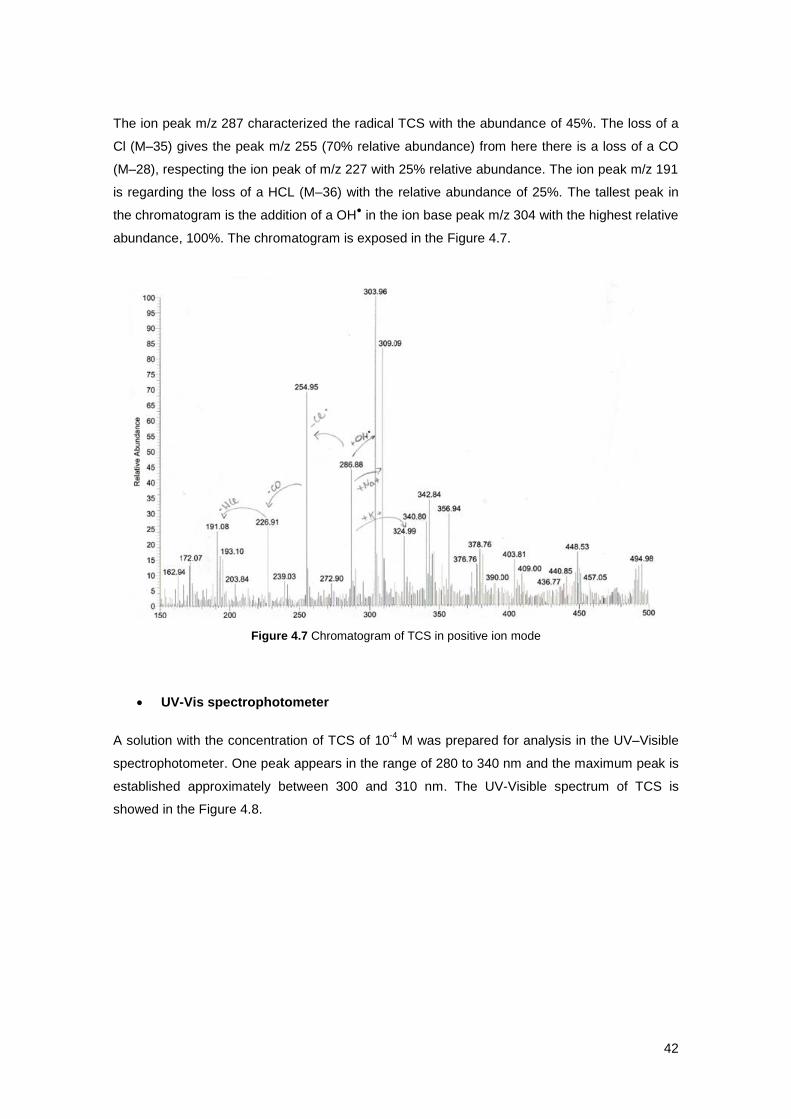
42
The ion peak m/z 287 characterized the radical TCS with the abundance of 45%. The loss of a
Cl (M–35) gives the peak m/z 255 (70% relative abundance) from here there is a loss of a CO
(M–28), respecting the ion peak of m/z 227 with 25% relative abundance. The ion peak m/z 191
is regarding the loss of a HCL (M–36) with the relative abundance of 25%. The tallest peak in
the chromatogram is the addition of a OH● in the ion base peak m/z 304 with the highest relative
abundance, 100%. The chromatogram is exposed in the Figure 4.7.
Figure 4.7 Chromatogram of TCS in positive ion mode
UV-Vis spectrophotometer
A solution with the concentration of TCS of 10-4
M was prepared for analysis in the UV–Visible
spectrophotometer. One peak appears in the range of 280 to 340 nm and the maximum peak is
established approximately between 300 and 310 nm. The UV-Visible spectrum of TCS is
showed in the Figure 4.8.
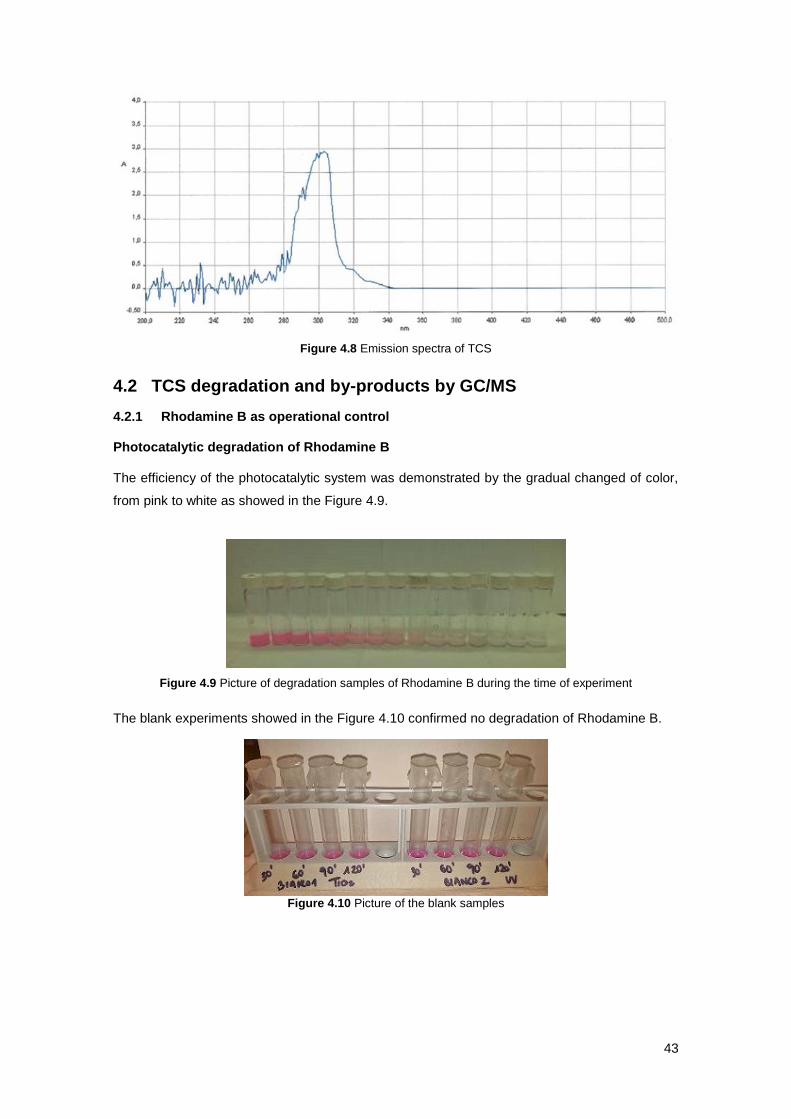
43
Figure 4.8 Emission spectra of TCS
4.2 TCS degradation and by-products by GC/MS
4.2.1 Rhodamine B as operational control Photocatalytic degradation of Rhodamine B The efficiency of the photocatalytic system was demonstrated by the gradual changed of color,
from pink to white as showed in the Figure 4.9.
Figure 4.9 Picture of degradation samples of Rhodamine B during the time of experiment
The blank experiments showed in the Figure 4.10 confirmed no degradation of Rhodamine B.
Figure 4.10 Picture of the blank samples
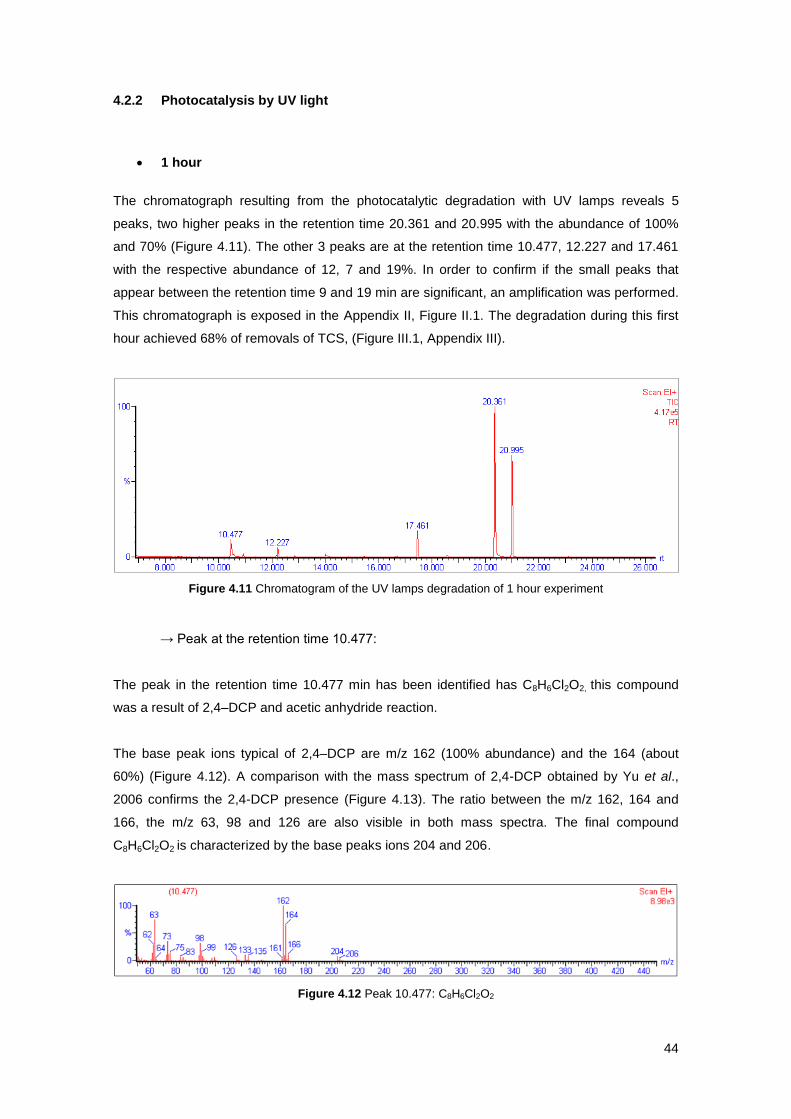
44
4.2.2 Photocatalysis by UV light
1 hour
The chromatograph resulting from the photocatalytic degradation with UV lamps reveals 5
peaks, two higher peaks in the retention time 20.361 and 20.995 with the abundance of 100%
and 70% (Figure 4.11). The other 3 peaks are at the retention time 10.477, 12.227 and 17.461
with the respective abundance of 12, 7 and 19%. In order to confirm if the small peaks that
appear between the retention time 9 and 19 min are significant, an amplification was performed.
This chromatograph is exposed in the Appendix II, Figure II.1. The degradation during this first
hour achieved 68% of removals of TCS, (Figure III.1, Appendix III).
Figure 4.11 Chromatogram of the UV lamps degradation of 1 hour experiment
→ Peak at the retention time 10.477:
The peak in the retention time 10.477 min has been identified has C8H6Cl2O2, this compound
was a result of 2,4–DCP and acetic anhydride reaction.
The base peak ions typical of 2,4–DCP are m/z 162 (100% abundance) and the 164 (about
60%) (Figure 4.12). A comparison with the mass spectrum of 2,4-DCP obtained by Yu et al.,
2006 confirms the 2,4-DCP presence (Figure 4.13). The ratio between the m/z 162, 164 and
166, the m/z 63, 98 and 126 are also visible in both mass spectra. The final compound
C8H6Cl2O2 is characterized by the base peaks ions 204 and 206.
Figure 4.12 Peak 10.477: C8H6Cl2O2
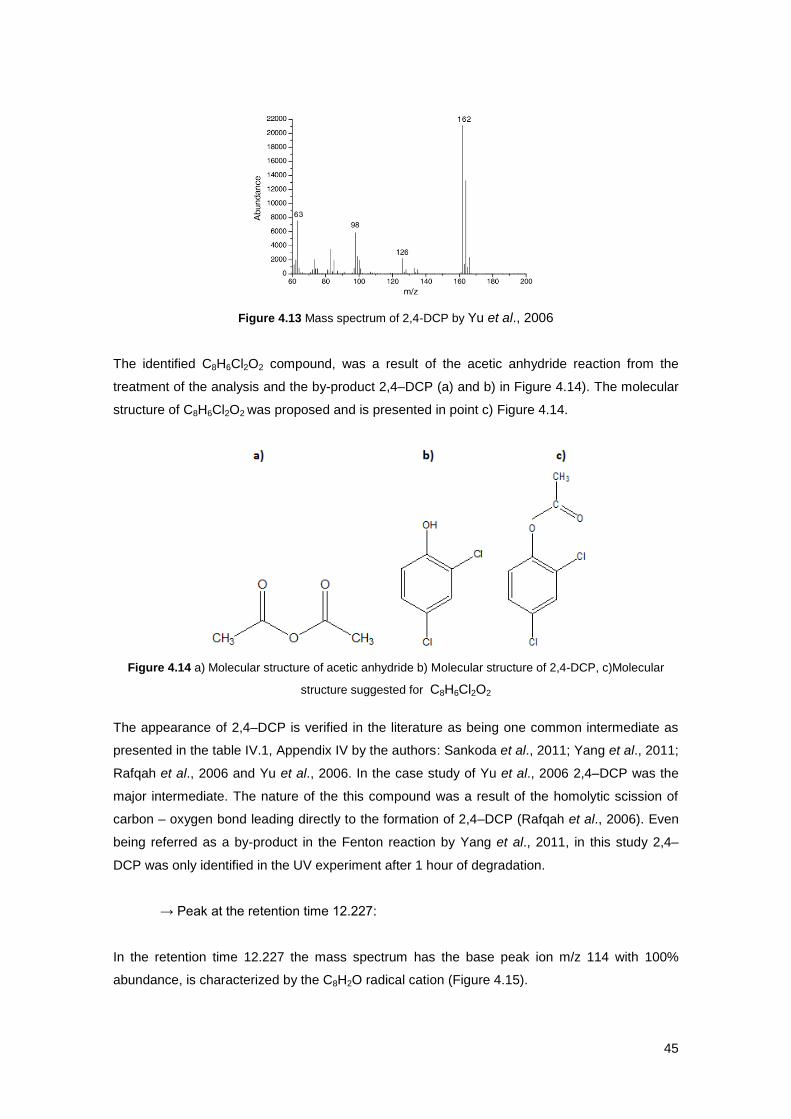
45
Figure 4.13 Mass spectrum of 2,4-DCP by Yu et al., 2006
The identified C8H6Cl2O2 compound, was a result of the acetic anhydride reaction from the
treatment of the analysis and the by-product 2,4–DCP (a) and b) in Figure 4.14). The molecular
structure of C8H6Cl2O2 was proposed and is presented in point c) Figure 4.14.
Figure 4.14 a) Molecular structure of acetic anhydride b) Molecular structure of 2,4-DCP, c)Molecular
structure suggested for C8H6Cl2O2
The appearance of 2,4–DCP is verified in the literature as being one common intermediate as
presented in the table IV.1, Appendix IV by the authors: Sankoda et al., 2011; Yang et al., 2011;
Rafqah et al., 2006 and Yu et al., 2006. In the case study of Yu et al., 2006 2,4–DCP was the
major intermediate. The nature of the this compound was a result of the homolytic scission of
carbon – oxygen bond leading directly to the formation of 2,4–DCP (Rafqah et al., 2006). Even
being referred as a by-product in the Fenton reaction by Yang et al., 2011, in this study 2,4–
DCP was only identified in the UV experiment after 1 hour of degradation.
→ Peak at the retention time 12.227:
In the retention time 12.227 the mass spectrum has the base peak ion m/z 114 with 100%
abundance, is characterized by the C8H2O radical cation (Figure 4.15).
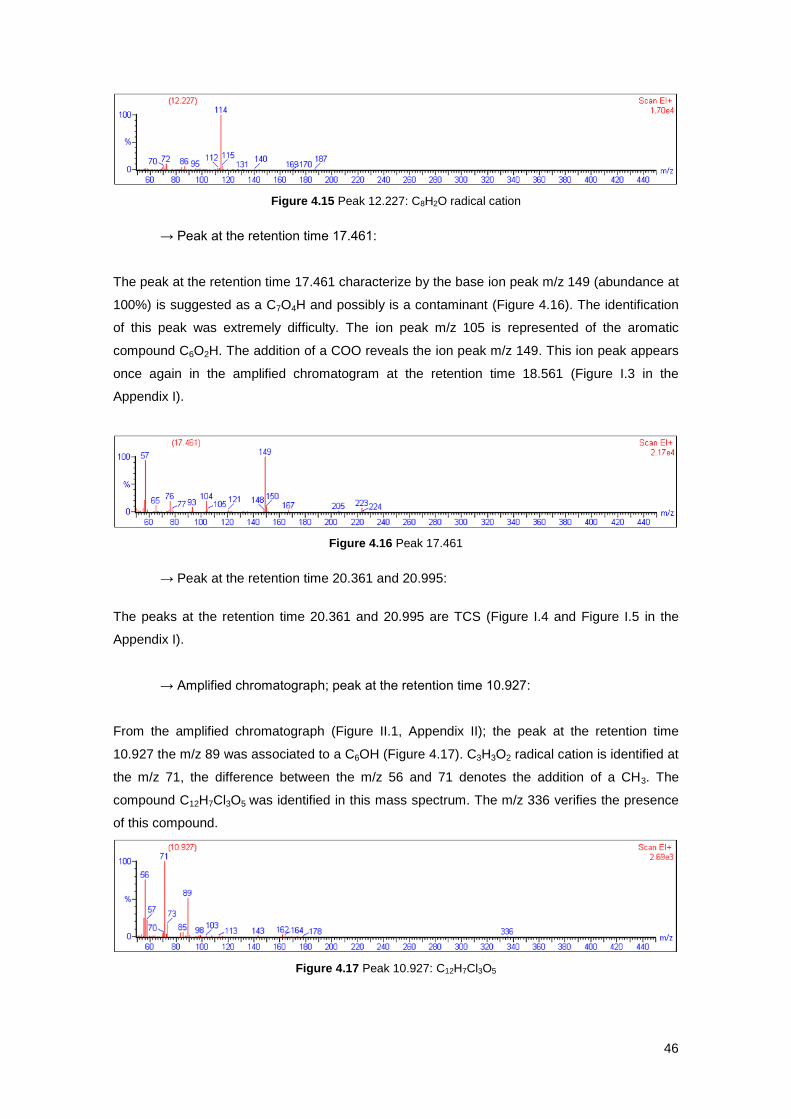
46
Figure 4.15 Peak 12.227: C8H2O radical cation
→ Peak at the retention time 17.461:
The peak at the retention time 17.461 characterize by the base ion peak m/z 149 (abundance at
100%) is suggested as a C7O4H and possibly is a contaminant (Figure 4.16). The identification
of this peak was extremely difficulty. The ion peak m/z 105 is represented of the aromatic
compound C6O2H. The addition of a COO reveals the ion peak m/z 149. This ion peak appears
once again in the amplified chromatogram at the retention time 18.561 (Figure I.3 in the
Appendix I).
Figure 4.16 Peak 17.461
→ Peak at the retention time 20.361 and 20.995:
The peaks at the retention time 20.361 and 20.995 are TCS (Figure I.4 and Figure I.5 in the
Appendix I).
→ Amplified chromatograph; peak at the retention time 10.927:
From the amplified chromatograph (Figure II.1, Appendix II); the peak at the retention time
10.927 the m/z 89 was associated to a C6OH (Figure 4.17). C3H3O2 radical cation is identified at
the m/z 71, the difference between the m/z 56 and 71 denotes the addition of a CH3. The
compound C12H7Cl3O5 was identified in this mass spectrum. The m/z 336 verifies the presence
of this compound.
Figure 4.17 Peak 10.927: C12H7Cl3O5
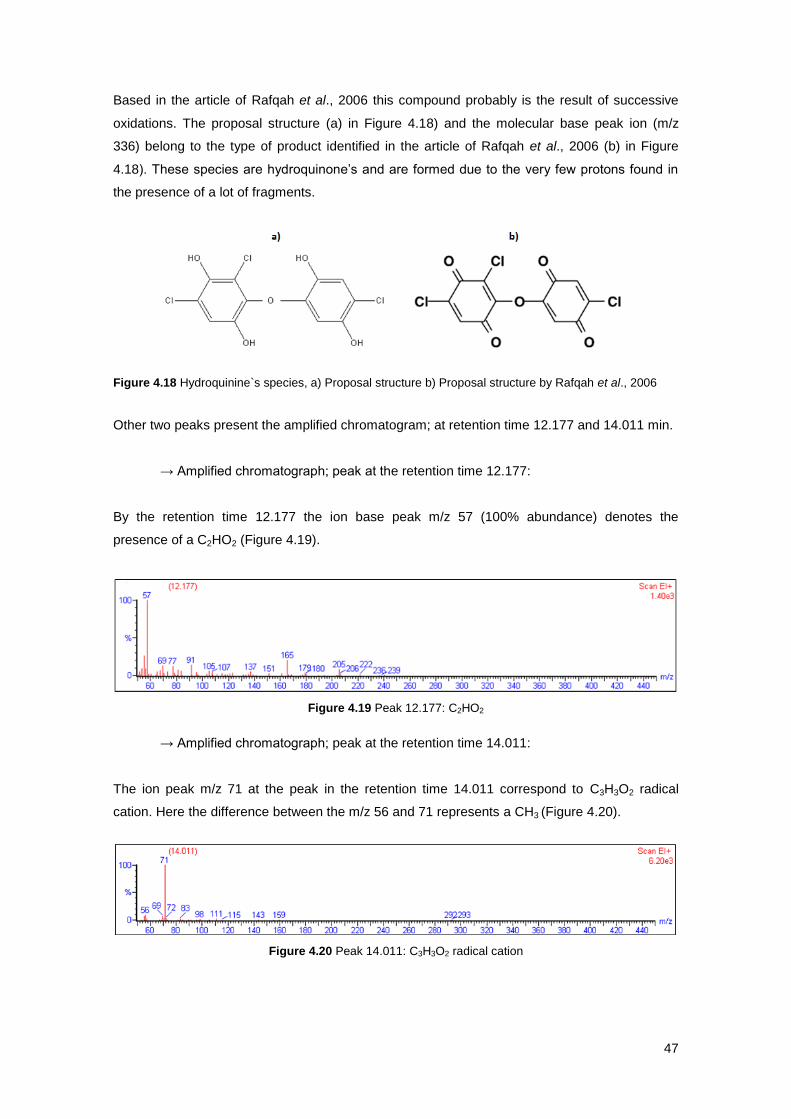
47
Based in the article of Rafqah et al., 2006 this compound probably is the result of successive
oxidations. The proposal structure (a) in Figure 4.18) and the molecular base peak ion (m/z
336) belong to the type of product identified in the article of Rafqah et al., 2006 (b) in Figure
4.18). These species are hydroquinone’s and are formed due to the very few protons found in
the presence of a lot of fragments.
Figure 4.18 Hydroquinine`s species, a) Proposal structure b) Proposal structure by Rafqah et al., 2006
Other two peaks present the amplified chromatogram; at retention time 12.177 and 14.011 min.
→ Amplified chromatograph; peak at the retention time 12.177:
By the retention time 12.177 the ion base peak m/z 57 (100% abundance) denotes the
presence of a C2HO2 (Figure 4.19).
Figure 4.19 Peak 12.177: C2HO2
→ Amplified chromatograph; peak at the retention time 14.011:
The ion peak m/z 71 at the peak in the retention time 14.011 correspond to C3H3O2 radical
cation. Here the difference between the m/z 56 and 71 represents a CH3 (Figure 4.20).
Figure 4.20 Peak 14.011: C3H3O2 radical cation
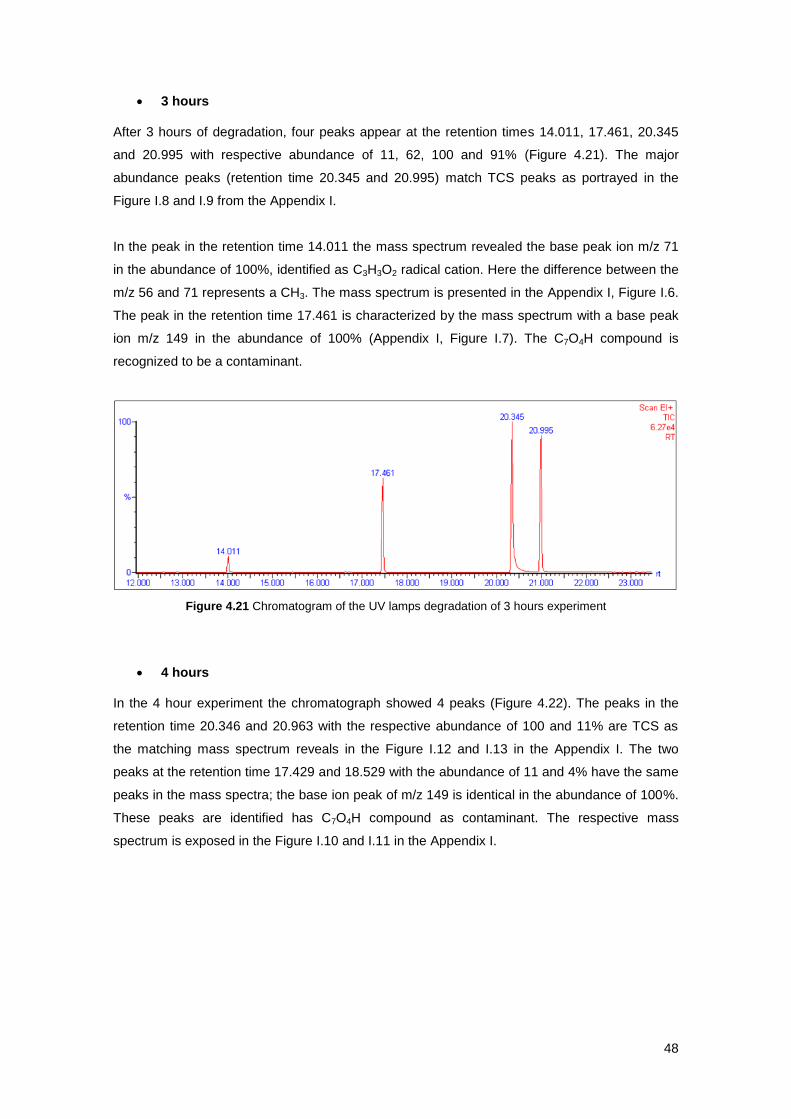
48
3 hours After 3 hours of degradation, four peaks appear at the retention times 14.011, 17.461, 20.345
and 20.995 with respective abundance of 11, 62, 100 and 91% (Figure 4.21). The major
abundance peaks (retention time 20.345 and 20.995) match TCS peaks as portrayed in the
Figure I.8 and I.9 from the Appendix I.
In the peak in the retention time 14.011 the mass spectrum revealed the base peak ion m/z 71
in the abundance of 100%, identified as C3H3O2 radical cation. Here the difference between the
m/z 56 and 71 represents a CH3. The mass spectrum is presented in the Appendix I, Figure I.6.
The peak in the retention time 17.461 is characterized by the mass spectrum with a base peak
ion m/z 149 in the abundance of 100% (Appendix I, Figure I.7). The C7O4H compound is
recognized to be a contaminant.
Figure 4.21 Chromatogram of the UV lamps degradation of 3 hours experiment
4 hours In the 4 hour experiment the chromatograph showed 4 peaks (Figure 4.22). The peaks in the
retention time 20.346 and 20.963 with the respective abundance of 100 and 11% are TCS as
the matching mass spectrum reveals in the Figure I.12 and I.13 in the Appendix I. The two
peaks at the retention time 17.429 and 18.529 with the abundance of 11 and 4% have the same
peaks in the mass spectra; the base ion peak of m/z 149 is identical in the abundance of 100%.
These peaks are identified has C7O4H compound as contaminant. The respective mass
spectrum is exposed in the Figure I.10 and I.11 in the Appendix I.
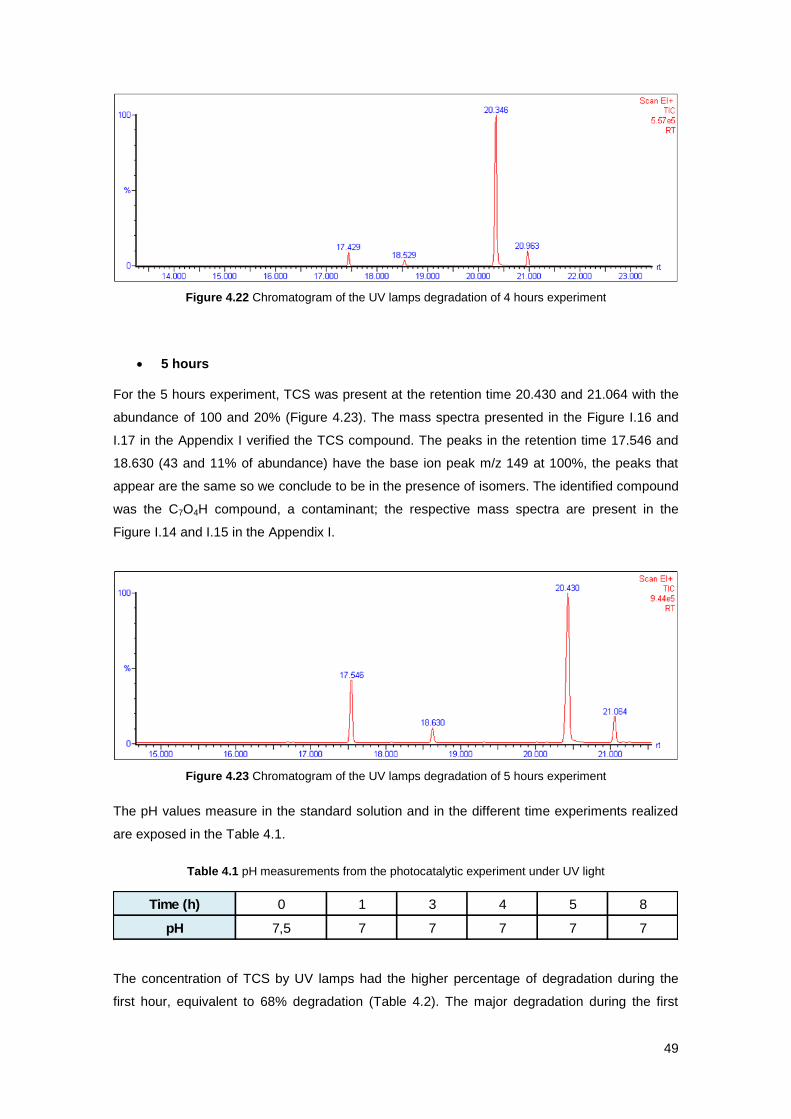
49
Figure 4.22 Chromatogram of the UV lamps degradation of 4 hours experiment
5 hours For the 5 hours experiment, TCS was present at the retention time 20.430 and 21.064 with the
abundance of 100 and 20% (Figure 4.23). The mass spectra presented in the Figure I.16 and
I.17 in the Appendix I verified the TCS compound. The peaks in the retention time 17.546 and
18.630 (43 and 11% of abundance) have the base ion peak m/z 149 at 100%, the peaks that
appear are the same so we conclude to be in the presence of isomers. The identified compound
was the C7O4H compound, a contaminant; the respective mass spectra are present in the
Figure I.14 and I.15 in the Appendix I.
Figure 4.23 Chromatogram of the UV lamps degradation of 5 hours experiment
The pH values measure in the standard solution and in the different time experiments realized
are exposed in the Table 4.1.
Table 4.1 pH measurements from the photocatalytic experiment under UV light
The concentration of TCS by UV lamps had the higher percentage of degradation during the
first hour, equivalent to 68% degradation (Table 4.2). The major degradation during the first
Time (h) 0 1 3 4 5 8
pH 7,5 7 7 7 7 7
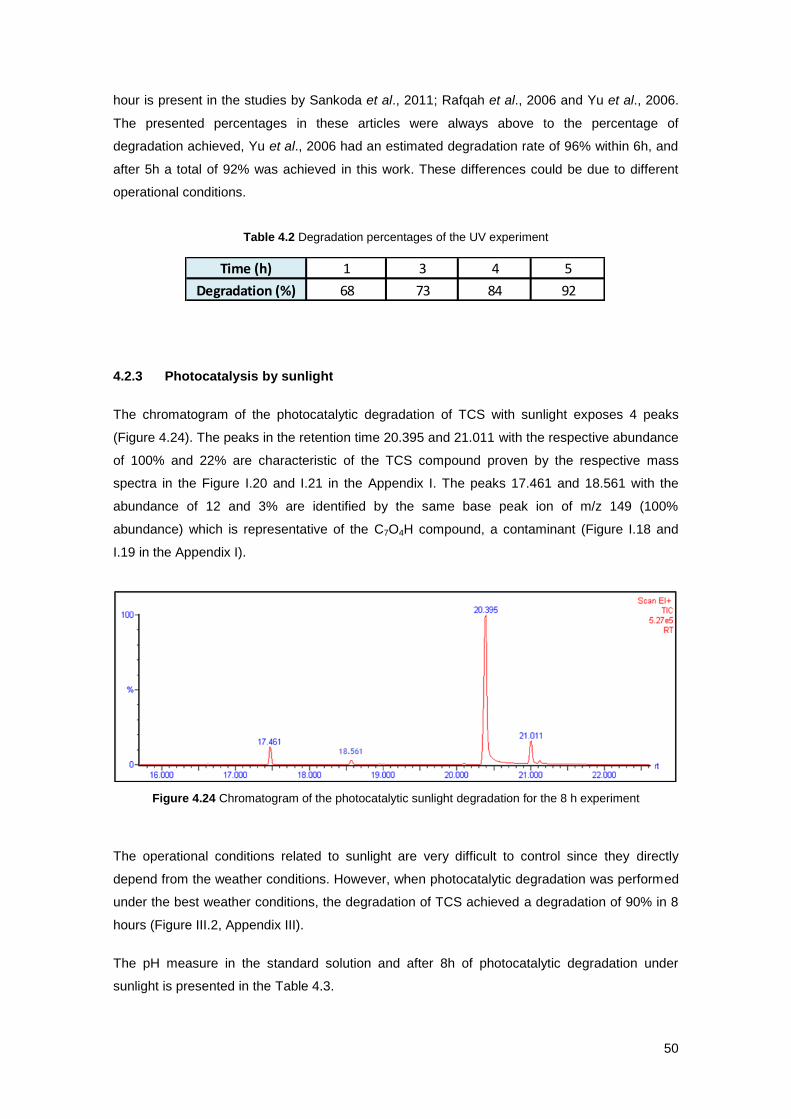
50
hour is present in the studies by Sankoda et al., 2011; Rafqah et al., 2006 and Yu et al., 2006.
The presented percentages in these articles were always above to the percentage of
degradation achieved, Yu et al., 2006 had an estimated degradation rate of 96% within 6h, and
after 5h a total of 92% was achieved in this work. These differences could be due to different
operational conditions.
Table 4.2 Degradation percentages of the UV experiment
4.2.3 Photocatalysis by sunlight
The chromatogram of the photocatalytic degradation of TCS with sunlight exposes 4 peaks
(Figure 4.24). The peaks in the retention time 20.395 and 21.011 with the respective abundance
of 100% and 22% are characteristic of the TCS compound proven by the respective mass
spectra in the Figure I.20 and I.21 in the Appendix I. The peaks 17.461 and 18.561 with the
abundance of 12 and 3% are identified by the same base peak ion of m/z 149 (100%
abundance) which is representative of the C7O4H compound, a contaminant (Figure I.18 and
I.19 in the Appendix I).
Figure 4.24 Chromatogram of the photocatalytic sunlight degradation for the 8 h experiment
The operational conditions related to sunlight are very difficult to control since they directly
depend from the weather conditions. However, when photocatalytic degradation was performed
under the best weather conditions, the degradation of TCS achieved a degradation of 90% in 8
hours (Figure III.2, Appendix III).
The pH measure in the standard solution and after 8h of photocatalytic degradation under
sunlight is presented in the Table 4.3.
1 3 4 5
68 73 84 92
Time (h)
Degradation (%)
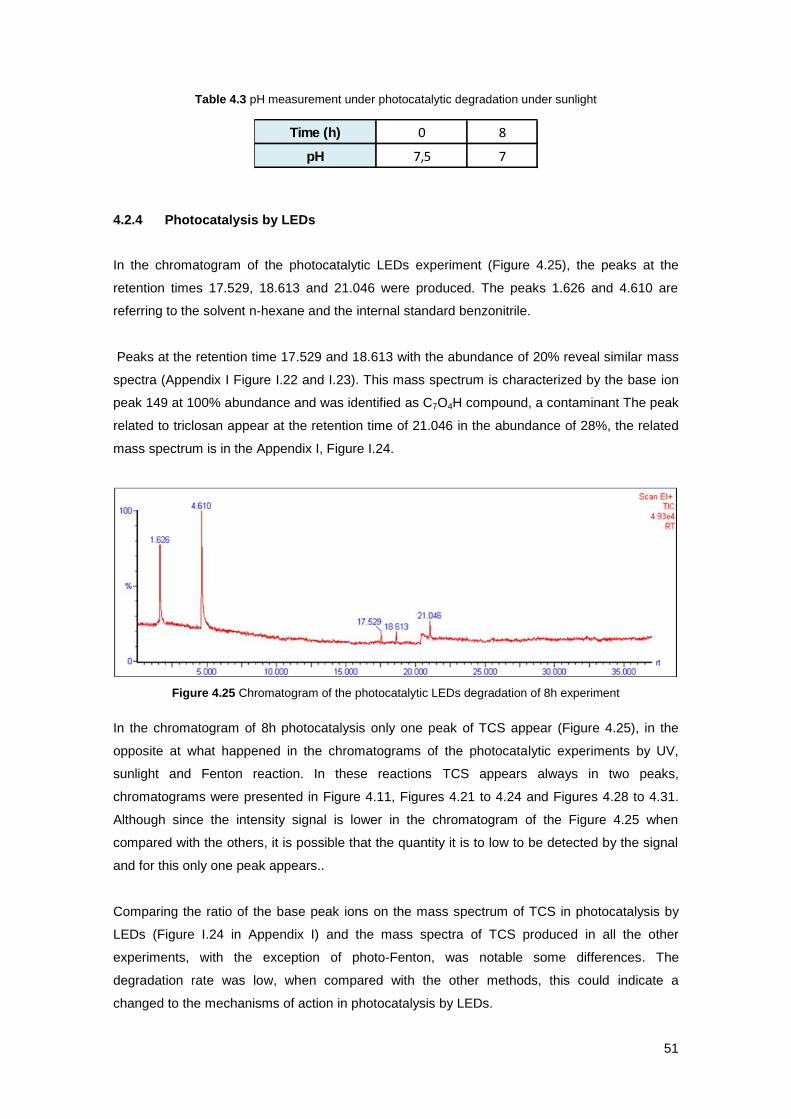
51
Table 4.3 pH measurement under photocatalytic degradation under sunlight
4.2.4 Photocatalysis by LEDs
In the chromatogram of the photocatalytic LEDs experiment (Figure 4.25), the peaks at the
retention times 17.529, 18.613 and 21.046 were produced. The peaks 1.626 and 4.610 are
referring to the solvent n-hexane and the internal standard benzonitrile.
Peaks at the retention time 17.529 and 18.613 with the abundance of 20% reveal similar mass
spectra (Appendix I Figure I.22 and I.23). This mass spectrum is characterized by the base ion
peak 149 at 100% abundance and was identified as C7O4H compound, a contaminant The peak
related to triclosan appear at the retention time of 21.046 in the abundance of 28%, the related
mass spectrum is in the Appendix I, Figure I.24.
Figure 4.25 Chromatogram of the photocatalytic LEDs degradation of 8h experiment
In the chromatogram of 8h photocatalysis only one peak of TCS appear (Figure 4.25), in the
opposite at what happened in the chromatograms of the photocatalytic experiments by UV,
sunlight and Fenton reaction. In these reactions TCS appears always in two peaks,
chromatograms were presented in Figure 4.11, Figures 4.21 to 4.24 and Figures 4.28 to 4.31.
Although since the intensity signal is lower in the chromatogram of the Figure 4.25 when
compared with the others, it is possible that the quantity it is to low to be detected by the signal
and for this only one peak appears..
Comparing the ratio of the base peak ions on the mass spectrum of TCS in photocatalysis by
LEDs (Figure I.24 in Appendix I) and the mass spectra of TCS produced in all the other
experiments, with the exception of photo-Fenton, was notable some differences. The
degradation rate was low, when compared with the other methods, this could indicate a
changed to the mechanisms of action in photocatalysis by LEDs.
Time (h) 0 8
pH 7,5 7
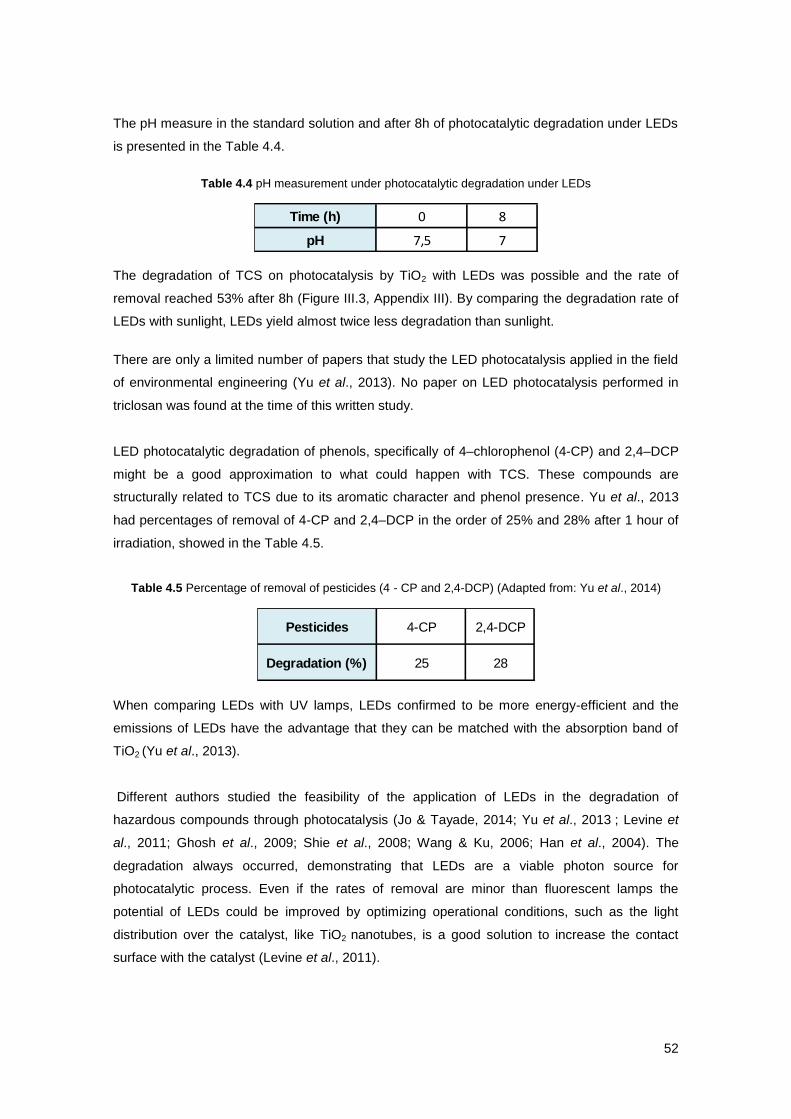
52
The pH measure in the standard solution and after 8h of photocatalytic degradation under LEDs
is presented in the Table 4.4.
Table 4.4 pH measurement under photocatalytic degradation under LEDs
The degradation of TCS on photocatalysis by TiO2 with LEDs was possible and the rate of
removal reached 53% after 8h (Figure III.3, Appendix III). By comparing the degradation rate of
LEDs with sunlight, LEDs yield almost twice less degradation than sunlight.
There are only a limited number of papers that study the LED photocatalysis applied in the field
of environmental engineering (Yu et al., 2013). No paper on LED photocatalysis performed in
triclosan was found at the time of this written study.
LED photocatalytic degradation of phenols, specifically of 4–chlorophenol (4-CP) and 2,4–DCP
might be a good approximation to what could happen with TCS. These compounds are
structurally related to TCS due to its aromatic character and phenol presence. Yu et al., 2013
had percentages of removal of 4-CP and 2,4–DCP in the order of 25% and 28% after 1 hour of
irradiation, showed in the Table 4.5.
Table 4.5 Percentage of removal of pesticides (4 - CP and 2,4-DCP) (Adapted from: Yu et al., 2014)
When comparing LEDs with UV lamps, LEDs confirmed to be more energy-efficient and the
emissions of LEDs have the advantage that they can be matched with the absorption band of
TiO2 (Yu et al., 2013).
Different authors studied the feasibility of the application of LEDs in the degradation of
hazardous compounds through photocatalysis (Jo & Tayade, 2014; Yu et al., 2013 ; Levine et
al., 2011; Ghosh et al., 2009; Shie et al., 2008; Wang & Ku, 2006; Han et al., 2004). The
degradation always occurred, demonstrating that LEDs are a viable photon source for
photocatalytic process. Even if the rates of removal are minor than fluorescent lamps the
potential of LEDs could be improved by optimizing operational conditions, such as the light
distribution over the catalyst, like TiO2 nanotubes, is a good solution to increase the contact
surface with the catalyst (Levine et al., 2011).
Time (h) 0 8
pH 7,5 7
Pesticides 4-CP 2,4-DCP
Degradation (%) 25 28
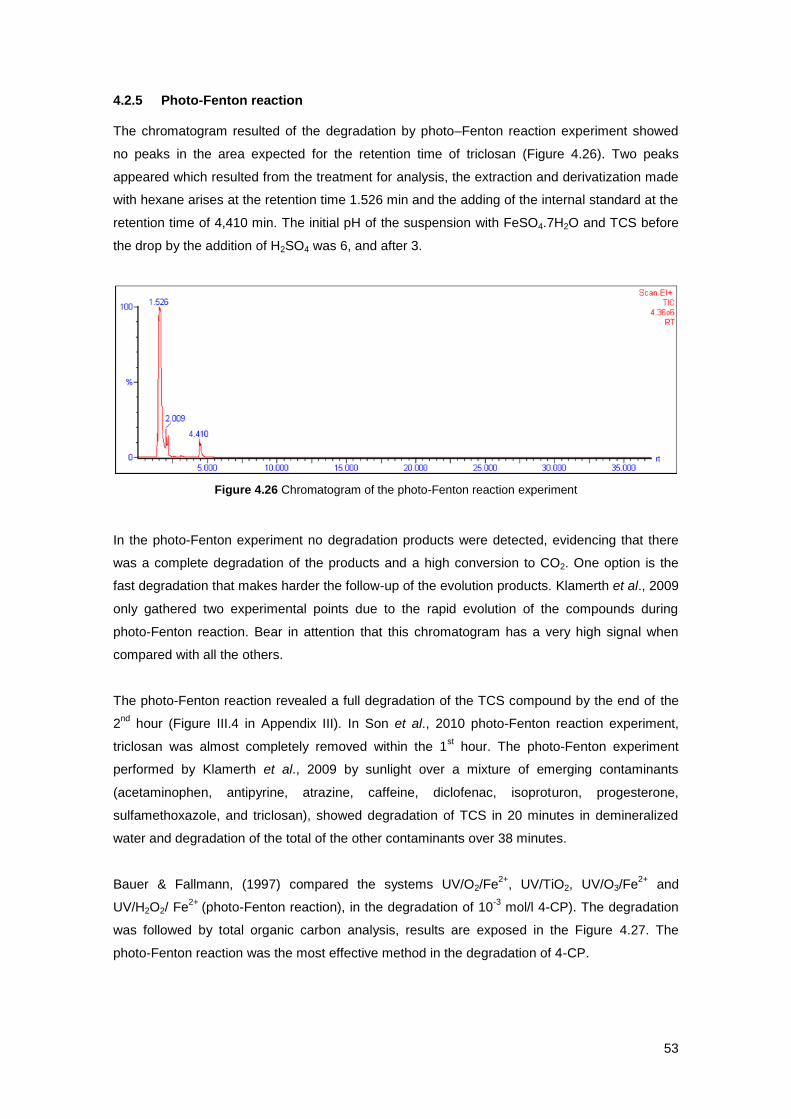
53
4.2.5 Photo-Fenton reaction The chromatogram resulted of the degradation by photo–Fenton reaction experiment showed
no peaks in the area expected for the retention time of triclosan (Figure 4.26). Two peaks
appeared which resulted from the treatment for analysis, the extraction and derivatization made
with hexane arises at the retention time 1.526 min and the adding of the internal standard at the
retention time of 4,410 min. The initial pH of the suspension with FeSO4.7H2O and TCS before
the drop by the addition of H2SO4 was 6, and after 3.
Figure 4.26 Chromatogram of the photo-Fenton reaction experiment
In the photo-Fenton experiment no degradation products were detected, evidencing that there
was a complete degradation of the products and a high conversion to CO2. One option is the
fast degradation that makes harder the follow-up of the evolution products. Klamerth et al., 2009
only gathered two experimental points due to the rapid evolution of the compounds during
photo-Fenton reaction. Bear in attention that this chromatogram has a very high signal when
compared with all the others.
The photo-Fenton reaction revealed a full degradation of the TCS compound by the end of the
2nd
hour (Figure III.4 in Appendix III). In Son et al., 2010 photo-Fenton reaction experiment,
triclosan was almost completely removed within the 1st hour. The photo-Fenton experiment
performed by Klamerth et al., 2009 by sunlight over a mixture of emerging contaminants
(acetaminophen, antipyrine, atrazine, caffeine, diclofenac, isoproturon, progesterone,
sulfamethoxazole, and triclosan), showed degradation of TCS in 20 minutes in demineralized
water and degradation of the total of the other contaminants over 38 minutes.
Bauer & Fallmann, (1997) compared the systems UV/O2/Fe2+
, UV/TiO2, UV/O3/Fe2+
and
UV/H2O2/ Fe2+
(photo-Fenton reaction), in the degradation of 10-3
mol/l 4-CP). The degradation
was followed by total organic carbon analysis, results are exposed in the Figure 4.27. The
photo-Fenton reaction was the most effective method in the degradation of 4-CP.
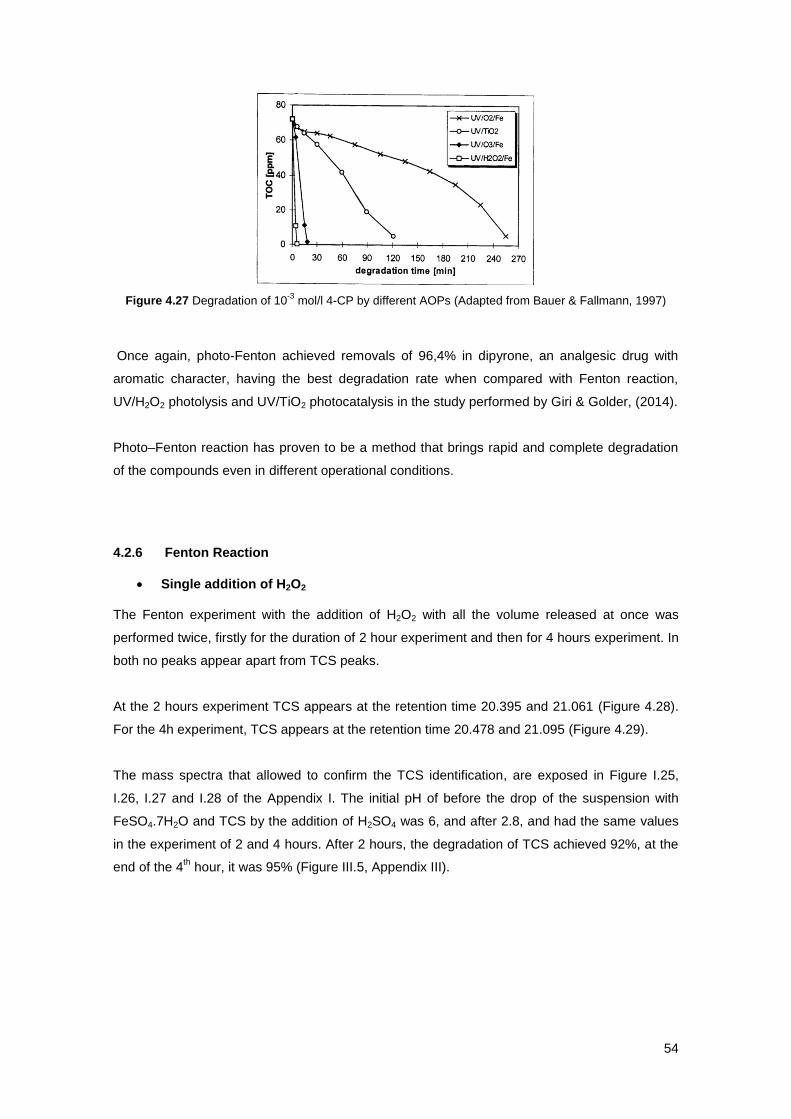
54
Figure 4.27 Degradation of 10-3
mol/l 4-CP by different AOPs (Adapted from Bauer & Fallmann, 1997)
Once again, photo-Fenton achieved removals of 96,4% in dipyrone, an analgesic drug with
aromatic character, having the best degradation rate when compared with Fenton reaction,
UV/H2O2 photolysis and UV/TiO2 photocatalysis in the study performed by Giri & Golder, (2014).
Photo–Fenton reaction has proven to be a method that brings rapid and complete degradation
of the compounds even in different operational conditions.
4.2.6 Fenton Reaction
Single addition of H2O2 The Fenton experiment with the addition of H2O2 with all the volume released at once was
performed twice, firstly for the duration of 2 hour experiment and then for 4 hours experiment. In
both no peaks appear apart from TCS peaks.
At the 2 hours experiment TCS appears at the retention time 20.395 and 21.061 (Figure 4.28).
For the 4h experiment, TCS appears at the retention time 20.478 and 21.095 (Figure 4.29).
The mass spectra that allowed to confirm the TCS identification, are exposed in Figure I.25,
I.26, I.27 and I.28 of the Appendix I. The initial pH of before the drop of the suspension with
FeSO4.7H2O and TCS by the addition of H2SO4 was 6, and after 2.8, and had the same values
in the experiment of 2 and 4 hours. After 2 hours, the degradation of TCS achieved 92%, at the
end of the 4th hour, it was 95% (Figure III.5, Appendix III).
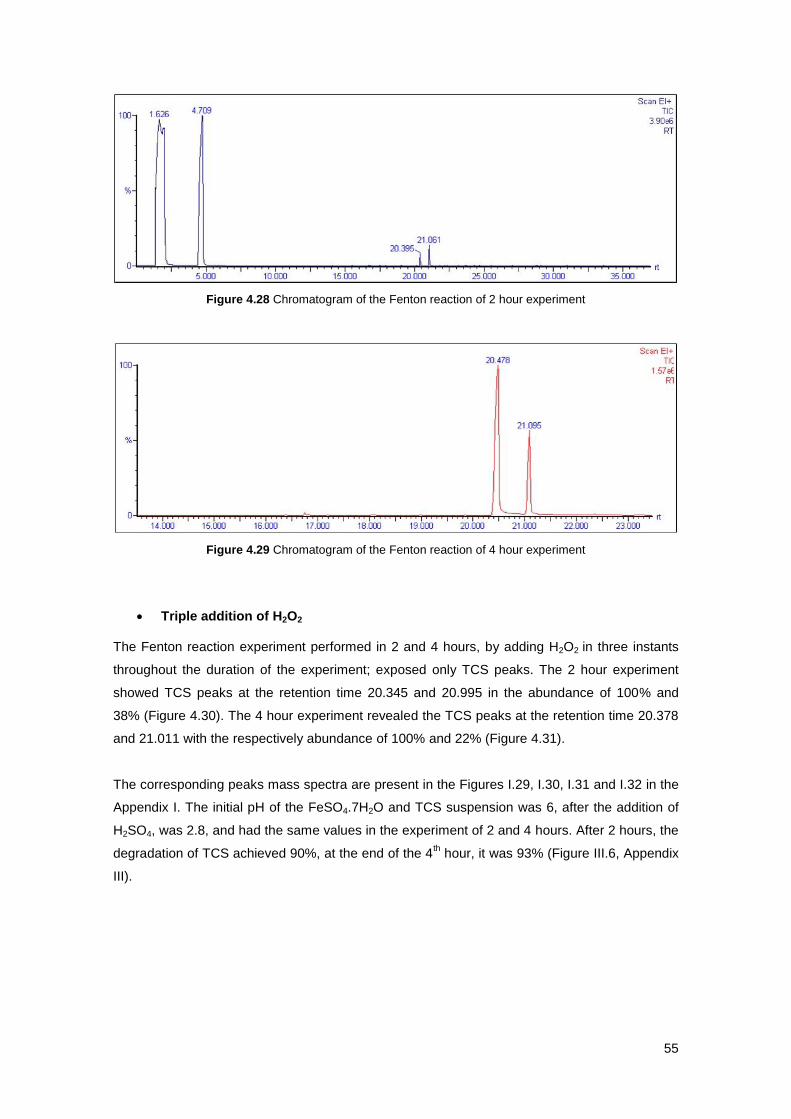
55
Figure 4.28 Chromatogram of the Fenton reaction of 2 hour experiment
Figure 4.29 Chromatogram of the Fenton reaction of 4 hour experiment
Triple addition of H2O2 The Fenton reaction experiment performed in 2 and 4 hours, by adding H2O2 in three instants
throughout the duration of the experiment; exposed only TCS peaks. The 2 hour experiment
showed TCS peaks at the retention time 20.345 and 20.995 in the abundance of 100% and
38% (Figure 4.30). The 4 hour experiment revealed the TCS peaks at the retention time 20.378
and 21.011 with the respectively abundance of 100% and 22% (Figure 4.31).
The corresponding peaks mass spectra are present in the Figures I.29, I.30, I.31 and I.32 in the
Appendix I. The initial pH of the FeSO4.7H2O and TCS suspension was 6, after the addition of
H2SO4, was 2.8, and had the same values in the experiment of 2 and 4 hours. After 2 hours, the
degradation of TCS achieved 90%, at the end of the 4th hour, it was 93% (Figure III.6, Appendix
III).
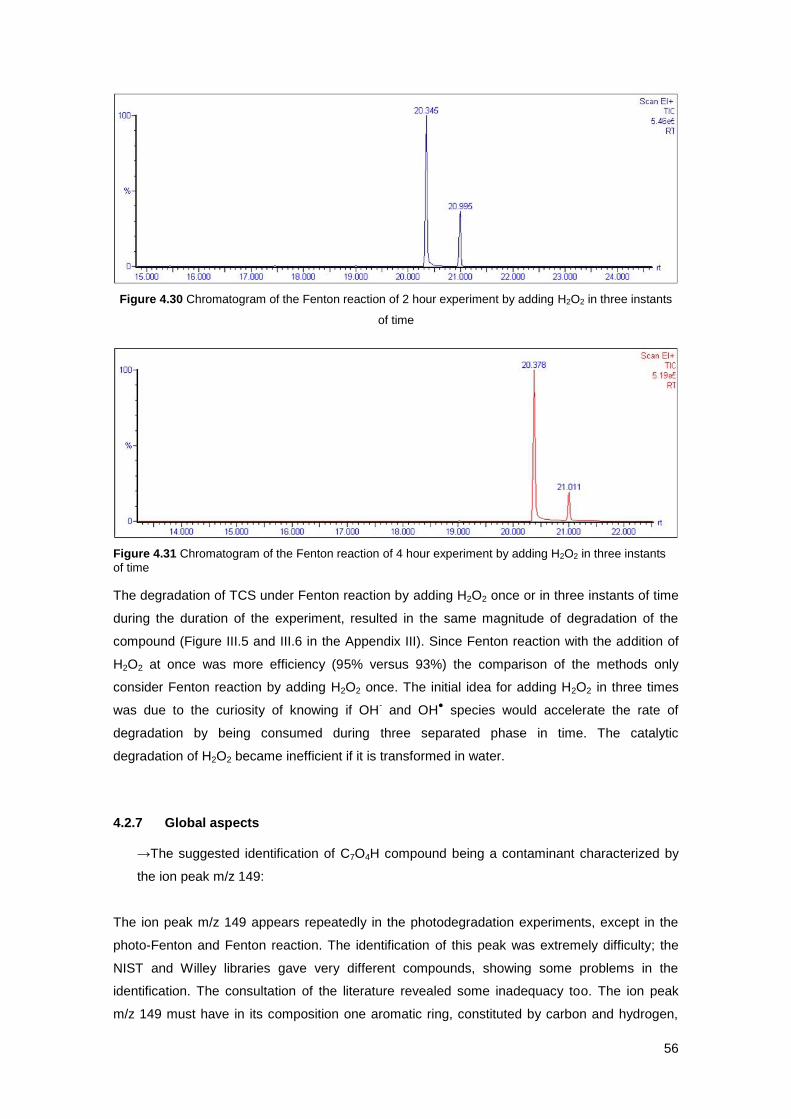
56
Figure 4.30 Chromatogram of the Fenton reaction of 2 hour experiment by adding H2O2 in three instants
of time
Figure 4.31 Chromatogram of the Fenton reaction of 4 hour experiment by adding H2O2 in three instants
of time
The degradation of TCS under Fenton reaction by adding H2O2 once or in three instants of time
during the duration of the experiment, resulted in the same magnitude of degradation of the
compound (Figure III.5 and III.6 in the Appendix III). Since Fenton reaction with the addition of
H2O2 at once was more efficiency (95% versus 93%) the comparison of the methods only
consider Fenton reaction by adding H2O2 once. The initial idea for adding H2O2 in three times
was due to the curiosity of knowing if OH- and OH
● species would accelerate the rate of
degradation by being consumed during three separated phase in time. The catalytic
degradation of H2O2 became inefficient if it is transformed in water.
4.2.7 Global aspects
→The suggested identification of C7O4H compound being a contaminant characterized by
the ion peak m/z 149:
The ion peak m/z 149 appears repeatedly in the photodegradation experiments, except in the
photo-Fenton and Fenton reaction. The identification of this peak was extremely difficulty; the
NIST and Willey libraries gave very different compounds, showing some problems in the
identification. The consultation of the literature revealed some inadequacy too. The ion peak
m/z 149 must have in its composition one aromatic ring, constituted by carbon and hydrogen,
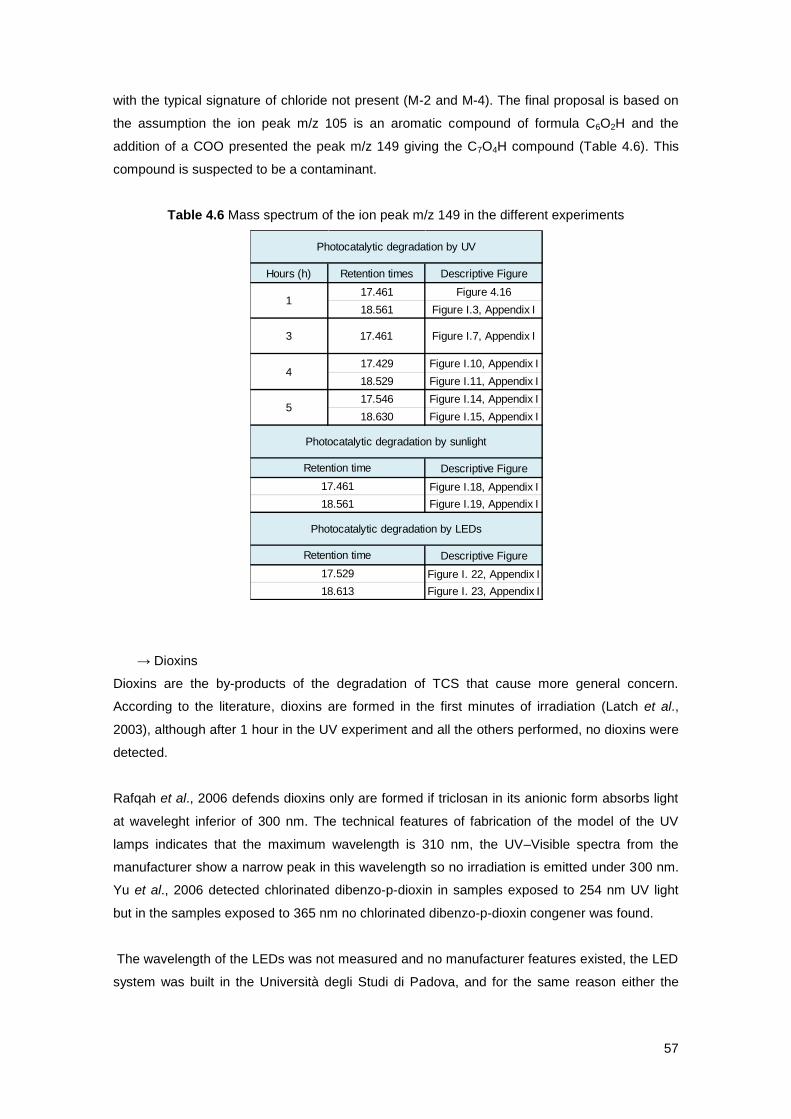
57
with the typical signature of chloride not present (M-2 and M-4). The final proposal is based on
the assumption the ion peak m/z 105 is an aromatic compound of formula C6O2H and the
addition of a COO presented the peak m/z 149 giving the C7O4H compound (Table 4.6). This
compound is suspected to be a contaminant.
Table 4.6 Mass spectrum of the ion peak m/z 149 in the different experiments
→ Dioxins
Dioxins are the by-products of the degradation of TCS that cause more general concern.
According to the literature, dioxins are formed in the first minutes of irradiation (Latch et al.,
2003), although after 1 hour in the UV experiment and all the others performed, no dioxins were
detected.
Rafqah et al., 2006 defends dioxins only are formed if triclosan in its anionic form absorbs light
at waveleght inferior of 300 nm. The technical features of fabrication of the model of the UV
lamps indicates that the maximum wavelength is 310 nm, the UV–Visible spectra from the
manufacturer show a narrow peak in this wavelength so no irradiation is emitted under 300 nm.
Yu et al., 2006 detected chlorinated dibenzo-p-dioxin in samples exposed to 254 nm UV light
but in the samples exposed to 365 nm no chlorinated dibenzo-p-dioxin congener was found.
The wavelength of the LEDs was not measured and no manufacturer features existed, the LED
system was built in the Università degli Studi di Padova, and for the same reason either the
Hours (h) Retention times Descriptive Figure
17.461 Figure 4.16
18.561 Figure I.3, Appendix I
17.429 Figure I.10, Appendix I
18.529 Figure I.11, Appendix I
17.546 Figure I.14, Appendix I
18.630 Figure I.15, Appendix I
Descriptive Figure
Figure I.18, Appendix I
Figure I.19, Appendix I
Descriptive Figure
Figure I. 22, Appendix I
Figure I. 23, Appendix I
17.529
18.613
1
3 17.461 Figure I.7, Appendix I
4
5
Photocatalytic degradation by sunlight
Retention time
17.461
18.561
Photocatalytic degradation by LEDs
Retention time
Photocatalytic degradation by UV
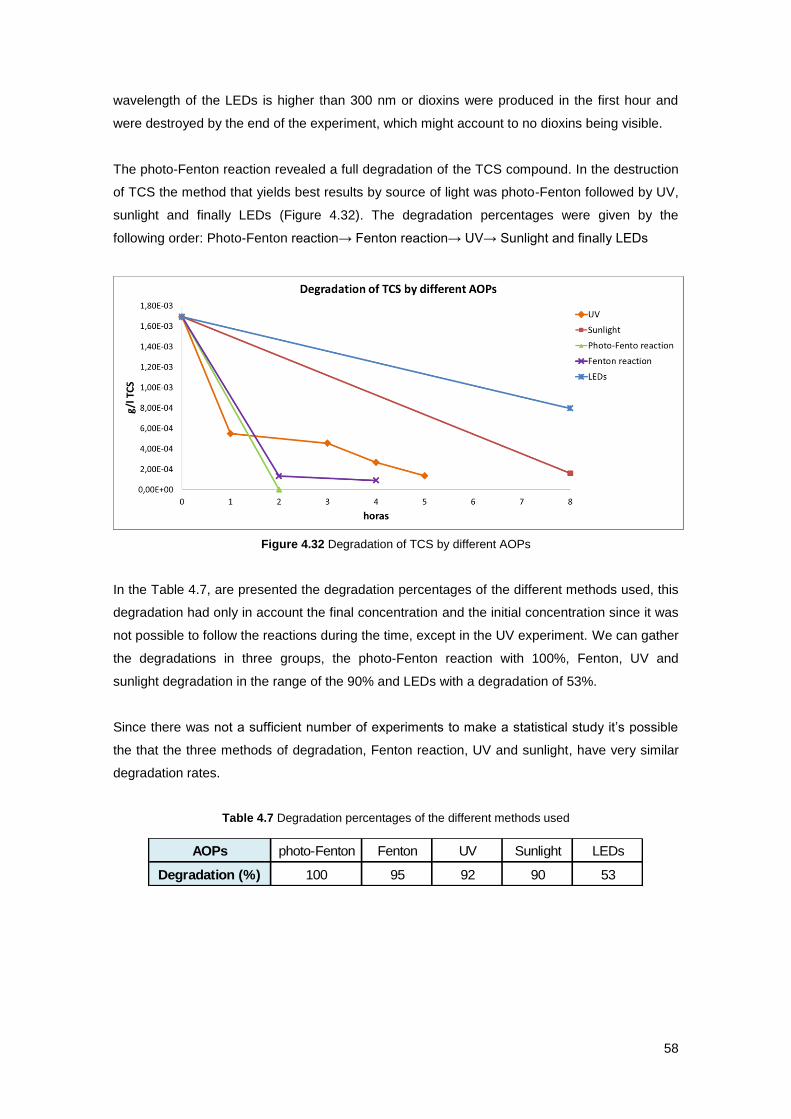
58
wavelength of the LEDs is higher than 300 nm or dioxins were produced in the first hour and
were destroyed by the end of the experiment, which might account to no dioxins being visible.
The photo-Fenton reaction revealed a full degradation of the TCS compound. In the destruction
of TCS the method that yields best results by source of light was photo-Fenton followed by UV,
sunlight and finally LEDs (Figure 4.32). The degradation percentages were given by the
following order: Photo-Fenton reaction→ Fenton reaction→ UV→ Sunlight and finally LEDs
Figure 4.32 Degradation of TCS by different AOPs
In the Table 4.7, are presented the degradation percentages of the different methods used, this
degradation had only in account the final concentration and the initial concentration since it was
not possible to follow the reactions during the time, except in the UV experiment. We can gather
the degradations in three groups, the photo-Fenton reaction with 100%, Fenton, UV and
sunlight degradation in the range of the 90% and LEDs with a degradation of 53%.
Since there was not a sufficient number of experiments to make a statistical study it’s possible
the that the three methods of degradation, Fenton reaction, UV and sunlight, have very similar
degradation rates.
Table 4.7 Degradation percentages of the different methods used
AOPs photo-Fenton Fenton UV Sunlight LEDs
Degradation (%) 100 95 92 90 53
59
5 Conclusions and future work
Throughout the course of this study, several methods of degradation of TCS, known as AOPs
were evaluated. The analysis of the result and literature lead to the following conclusions:
Photon-Fenton reaction was the best AOPs, having a degradation rate of 100% of TCS
within 2 hours, and no by-products were detected;
The degradation was given by the following order: photo-Fenton → Fenton reaction →
UV → Sunlight → LEDs;
The photocatalytic degradation under UV produced by-products after the first hour. It
was not possible to compare with the other methods since samples were not gathered
after one hour;
Hydroquinone specie and 2,4–DCP intermediates were identified in the first hour of the
photocatalytic degradation under UV;
A common contaminant, identified has C7O4H compound, was present at the
degradation by UV, sunlight and LEDs;
Photocatalytic degradation by using LEDs is a viable possibility in the destruction of
TCS. The degradation percentage was 53% after 8h;
Photocatalytic degradation under LEDs could follow different mechanisms of action
when comparing the degradation rate with other degradation sources;
The addition of H2O2 once or in three separate times gave the same magnitude of
degradation of the TCS;
No dioxins where detected in the operational conditions used.
Future work and recommendations:
The study work with LEDs is worthwhile to continue given the advantages of long
durability and low consumption of energy making the future potential for these lamps
very high; fluorescent lamps in the ending of their life cycle carry the risk of spread of
mercury in the environment and as governments make these lamps unavailable new
solutions are required; Fenton and photo-Fenton reaction can be also a costly process
due to the reagents cost used.
More studies in the use of LEDs should be performed in order to better define the
kinetics reactions;
LEDs allowed a variable possibility to design devices. An industrial scale pilot can be
used to research;
Improve the extraction and derivatization techniques to understand the degradation
products;
60
Following degradation of TCS through time in different AOPs and the by–products
generated is an interesting point to have in considerer;
In the case of photo-Fenton process, possibly high quantities of TCS were transformed
in CO2; the measurement of CO2 levels can be quantified on the absorption of CO2 by
sodium hydroxide.
61
6 References
Adolfsson-Erici, M., Pettersson, M., Parkkonen, J. & Sturve, J. (2002). Triclosan, a commonly used bactericide found in human milk and in the aquatic environment in Sweden. Chemosphere, 46(9-10), 1485–1489.
Aguillon, C., Newman, J. & Machado, A. (2010). Pharmaceuticals and Personal Care Products (PPCPs):triclosan. http://www.csun.edu/~vchsc006/triclosan.pdf.
Aliabadi, M. & Sagharigar, T. (2011). Photocatalytic removal of Rhodamine B from aqueous solutions using TiO2 nanocatalyst. Journal of Applied Environmental and Biological Sciences, 1(12), 620–626.
Allmyr, M., Adolfsson-Erici, M., McLachlan, M. S. & Sandborgh-Englund, G. (2006). Triclosan in plasma and milk from Swedish nursing mothers and their exposure via personal care products. Science of the Total Environment, 372(1), 87–93.
Aranami, K. & Readman, J. W. (2007). Photolytic degradation of triclosan in freshwater and seawater. Chemosphere, 66(6), 1052–1056.
Bauer, R. & Fallmann, H. (1997). The photo-Fenton oxidation — A cheap and efficient wastewater treatment method. Research on Chemical Intermediates, 23(4), 341–354.
Bester, K. (2003). Triclosan in a sewage treatment process-balances and monitoring data. Water Research, 37(16), 3891–3896.
Bhargava, H. N. & Leonard, P. A. (1996). Triclosan : Applications and safety. American Journal of Infection Control, 24(3), 209 – 218.
Bovey, F. A., Mirau, P. A. & Gutowsky, H. S. (1988). Nuclear Magnetic Resonance Spectroscopy: Academic Press, INC.
Bruins, A. P. (1998). Mechanistic aspects of electrospray ionization. Journal of Chromatography A, 794(1), 345–357.
Carp, O., Huisman, C. L. & Reller, A. (2004). Photoinduced reactivity of titanium dioxide. Progress in Solid State Chemistry, 32, 33–177.
Catrinescu, C., Arsene, D., Apopei, P. & Teodosiu, C. (2012). Degradation of 4-chlorophenol from wastewater through heterogeneous Fenton and photo-Fenton process, catalyzed by Al–Fe PILC. Applied Clay Science, 58, 96–101.
Cech, N. B. & Enke, C. G. (2002). Practical implications of some recent studies in electrospray ionization fundamentals. Mass Spectrometry Reviews, 20, 362–387.
Chalew, T. E. A. & Halden, R. U. (2009). Environmental exposure of aquatic and terrestrial biota to triclosan and triclocarban. Journal of the American Water Resources Association, 45(1), 4–13.
Coogan, M. A., Edziyie, R. E., La Point, T. W. & Venables, B. J. (2007). Algal bioaccumulation of triclocarban, triclosan, and methyl-triclosan in a North Texas wastewater treatment plant receiving stream. Chemosphere, 67, 1911–1918.
Czaplicka, M. (2001). Determination of phenols and chlorophenols in bottom sediments. Chromatographia, 53, 470–473.
62
Dann, A. B. & Hontela, A. (2011). Triclosan: environmental exposure, toxicity and mechanisms of action. Journal of Applied Toxicology, 31, 285–311.
Dayan, A. D. (2007). Risk assessment of triclosan [Irgasan] in human breast milk. Food and Chemical Toxicology , 45(1), 125–129.
Fang, J.L., Stingley, R. L., Beland, F. A., Harrouk, W., Lumpkins, D. L. & Howard, P. (2010). Occurrence, efficacy, metabolism and toxicity of triclosan. Journal of Environmental Science and Health. Part C, Environmental Carcinogenesis & Ecotoxicology Reviews, 28(3), 147–171.
Foran, C. M., Bennett, E. R. & Benson, W. H. (2000). Developmental evaluation of a potential non-steroidal estrogen: triclosan. Marine Environmental Research, 50,153–156.
Fuertes, V. C., Negre, C. F. A., Oviedo, M. B., Bonafé, F. P., Oliva, F. Y. & Sánchez, C. G. (2013). A theoretical study of the optical properties of nanostructured TiO2. Journal of Physics: Condensed Matter, 25, 1-7.
Fujishima, A. & Murakami, T. (2010). Expanding industrialization of photocatalysts. Sangakukan, 6.
Ghosh, J. P., Sui, R., Langford, C. H., Achari, G. & Berlinguette, C. P. (2009). A comparison of several nanoscale photocatalysts in the degradation of a common pollutant using LEDs and conventional UV light. Water Research, 43, 4499–4506.
Giri, A. S. & Golder, A. K. (2014). Fenton, photo-Fenton, H2O2 photolysis, and TiO2 photocatalysis for dipyrone oxidation : drug removal, mineralization, biodegradability and degradation mechanism. Industrial & Engineering Chemistry Research, 53, 1351 - 1358.
Glaser, A. (2004). The Ubiquitous Triclosan A common antibacterial agent exposed. Pesticides and You, 24(3), 12-17.
Gómez, M. J., Gómez-Ramos, M. M., Agüera, A., Mezcua, M., Herrera, S. & Fernández-Alba, A. R. (2009). A new gas chromatography/mass spectrometry method for the simultaneous analysis of target and non-target organic contaminants in waters. Journal of Chromatography A, 1216, 4071–4082.
Hakura, A., Suzuki, S., Sawada, S., Motooka, S. & Satoh, T. (2002). An improvement of the Ames test using a modified human liver S9 preparation. Jornal of Pharmacological Methods, 46, 169-172.
Hakura, A., Suzuki, S. & Satoh, T. (1999). Advantage of the use of human liver S9 in the Ames test. Mutation Research, 438, 29-36.
Halden, R. U. (2014). On the need and speed of regulating triclosan and triclocarban in the United States. Environmental Science & Technology, 48, 3603–3611.
Han, W., Zhu, W., Zhang, P., Zhang, Y. & Li, L. (2004). Photocatalytic degradation of phenols in aqueous solution under irradiation of 254 and 185nm UV light. Catalysis Today, 90, 319–324.
Heath, R. J., Rubin, J. R., Holland, D. R., Zhang, E., Snow, M. E. & Rock, C. O. (1999). Mechanism of triclosan inhibition of bacterial fatty acid synthesis. The Journal of Biological Chemistry, 274(16), 11110–11114.
Heidler, J. & Halden, R. U. (2007). Mass balance assessment of triclosan removal during conventional sewage treatment. Chemosphere, 66(2), 362–369.
63
Ho, C. S., Lam, C. W. K., Chan, M. H. M., Cheung, R. C. K., Law, L. K., Lit, L. C. W., Ng, K. F., Suen, M. W. M. & Tai, H. L. (2003). Electrospray ionisation mass spectrometry: principles and clinical applications. The Clinical Biochemist Reviews, 24(1), 3–12.
Hontela, A. & Habibi, H. R. (2013). 8 - Personal care products in the aquatic environment: a case study on the effects of triclosan in fish. In Organic Chemical Toxicology of Fishes (pp. 411– 437): Academic Press.
Jabrou, S. N. (2012). Extraction of phenol from industrial water using different solvents. Research Journal of Chemical Sciences, 2(4), 1–12.
Jo, W. & Tayade, R. J. (2014). New generation energy-efficient light source for photocatalysis : LEDs for environmental applications. Industrial & Engineering Chemistry Research, 53, 2073-2084.
Júnior, A., Quina, F., Gozzi, F., Silva, V., Friedrich, L. & Moraes, J. (2012). Fundamental mechanistic studies of the photo-Fenton reaction for the degradation of the organic pollutants. In T. Puzyn (Ed.), Organic Pollutants Ten Years After the Stockholm Convention - Environmental and Analytical Update: Intech.
Kaneko, M. & Okura, I. (2002). Photocatalysis: science and technology. Japan: Kodansha/ Springer.
Katz, D. R., Cantwell, M. G., Sullivan, J. C., Perron, M. M., Burgess, R. M., Ho, K. T. & Charpentier, M. A. (2013). Factors regulating the accumulation and spatial distribution of the emerging contaminant triclosan in the sediments of an urbanized estuary: Greenwich Bay, Rhode Island, USA. Science of the Total Environment, 443, 123–133.
Kim, K., Park, H., Yang, W. & Lee, J. H. (2011). Urinary concentrations of bisphenol A and triclosan and associations with demographic factors in the Korean population. Environmental Research, 111(8), 1280–1285.
Klamerth, N., Miranda, N., Malato, S., Agüera, A., Fernández-Alba, A. R., Maldonado, M. I. & Coronado, J. M. (2009). Degradation of emerging contaminants at low concentrations in MWTPs effluents with mild solar photo-Fenton and TiO2. Catalysis Today, 144(1-2), 124–130.
Kola, R. K., Rasheed, A. & Yalavarthy, P. D. (2013). Evaluation of antibacterial activity of triclosan against human patogens. The Ecoscan, 4, 273–276.
Kudo, A. & Miseki, Y. (2009). Heterogeneous photocatalyst materials for water splitting. Chemical Society Reviews, 38(1), 253–278.
Latch, D. E., Packer, J. L., Arnold, W. A. & McNeill, K. (2003). Photochemical conversion of triclosan to 2,8-dichlorodibenzo-p-dioxin in aqueous solution. Journal of Photochemistry and Photobiology A: Chemistry, 158, 63–66.
Levine, L. H., Richards, J. T., Coutts, J. L., Soler, R., Maxik, F. & Wheeler, R. M. (2011). Feasibility of ultraviolet-light-emitting diodes as an alternative light source for photocatalysis. Journal of the Air & Waste Management Association, 61(9), 932–940.
Li, X., Ying, G., Zhao, J., Chen, Z., Lai, H. & Su, H. (2013). 4-Nonylphenol, bisphenol-A and triclosan levels in human urine of children and students in China, and the effects of drinking these bottled materials on the levels. Environment International, 52, 81–86.
Ling, L., Xian, J., Ali, S., Geng, B., Fan, J., Mills, D. M., Arvanites, A.C., Orgueira, H., Ashwell, M. A., Carmel, G., Xiang, Y. & Moir D. T. (2004). Identification and characterization of
64
inhibitors of bacterial enoyl-acyl carrier protein reductase. Antimicrobial agents and chemotherapy, 48(5), 1541-1547.
Liu, F., Ying, G., Yang, L. & Zhou, Q. (2009). Terrestrial ecotoxicological effects of the antimicrobial agent triclosan. Ecotoxicology and Environmental Safety, 72, 86–92.
McAvoy, D. C., Schatowitz, B., Jacob, M., Hauk, A. & Eckhoff, W. S. (2002). Measurement of triclosan in wastewater treatment systems. Environmental Toxicology and Chemistry, 21(7), 1323–1329.
Mezcua, M., Gómez, M. J., Ferrer, I., Aguera, A., Hernando, M. D. & Fernández-Alba, A. R. (2004). Evidence of 2,7/2,8-dibenzodichloro-p-dioxin as a photodegradation product of triclosan in water and wastewater samples. Analytica Chimica Acta, 524, 241–247.
Mortelmans K. & Zeiger E. (2000). The Ames Salmonella/microsome mutagenicity assay. Mutation Research, 455(1-2), 29-60.
Nakata, K. & Fujishima, A. (2012). TiO2 photocatalysis: design and applications. Journal of Photochemistry and Photobiology C: Photochemistry Reviews, 13(3), 169–189.
Nassef, M., Matsumoto, S., Seki, M., Khalil, F., Kang, I. J., Shimasaki, Y., Oshima, Y. & Honjo, T. (2010). Acute effects of triclosan, diclofenac and carbamazepine on feeding performance of Japanese medaka fish (Oryzias latipes). Chemosphere, 80, 1095–1100.
Australian Government - Department of Health and Ageing/ National Industrial Chemicals Notification and Assessment Scheme. (2009). Triclosan. Priority Existing Chemical Assessment Report nr.30.
Ohtani, B., Prieto-Mahaney, O. O., Li, D. & Abe, R. (2010). What is Degussa (Evonik) P25? Crystalline composition analysis, reconstruction from isolated pure particles and photocatalytic activity test. Journal of Photochemistry and Photobiology A: Chemistry, 216, 179–182.
Orvos, D. R., Versteeg, D. J., Inauen, J., Capdevielle, M., Rothenstein, A. & Cunningham, V. (2002). Aquatic toxicity of triclosan. Environmental Toxicology and Chemistry, 21(7), 1338–1349.
Rafqah, S., Wong-Wah-Chung, P., Nelieu, S., Einhorn, J. & Sarakha, M. (2006). Phototransformation of triclosan in the presence of TiO2 in aqueous suspension : mechanistic approach. Applied Catalysis B: Environmental, 66, 119–125.
Ricart, M., Guasch, H., Alberch, M., Barceló, D., Bonnineau, C., Geiszinger, A., la Farré, M., Ferrer, J., Ricciardi, F., Romaní, A. M., Morin, S., Proia, L., Sala, L., Sureda, D. & Sabater, S. (2010). Triclosan persistence through wastewater treatment plants and its potential toxic effects on river biofilms. Aquatic Toxicology, 100, 346–353.
Russel, A.D. (2004). Whither triclosan?Journal of Antimicrobial Chemotherapy, 53, 693-695.
Sanchez-Prado, L., Llompart, M., Lores, M., García-Jares, C., Bayona, J. M. & Cela, R. (2006). Monitoring the photochemical degradation of triclosan in wastewater by UV light and sunlight using solid-phase microextraction. Chemosphere, 65, 1338–1347.
Sankoda, K., Matsuo, H., Ito, M., Nomiyama, K., Arizono, K. & Shinohara, R. (2011). Identification of triclosan intermediates produced by oxidative degradation using TiO2 in pure water and their endocrine disrupting activities. Bulletin of Environmental Contamination and Toxicology, 86, 470–475.
65
SCCS. (2010). Opinion on triclosan: antimicrobial resistance (Publication No. 1251/09). European Commission, Brussels: Angerer, J., Bernauer, U., Chambers, C., Chaudhry, Q., Degen, G., Eisenbrand, G., Platzek, T., Rastogi, S. C., Rogiers, V., Rousselle, C., Sanner, T., Savolainen, K., Engelen, J., Vinardell, M. P., Waring, R. & White, I. R.
Shie, J., Lee, C., Chiou, C., Chang, C., Chang, C. & Chang, C. (2008). Photodegradation kinetics of formaldehyde using light sources of UVA, UVC and UVLED in the presence of composed silver titanium oxide photocatalyst. Journal of Hazardous Materials, 155, 164–72.
Silverstein, R. M., Webster, F. X. & Kiemble, D. J. (2005). Spectrometric identification of organic compounds. United States of America, USA: Jon Willey & Sons, INC.
Singer, H., Müller, S., Tixier, C. & Pillonel, L. (2002). Triclosan: occurrence and fate of a widely used biocide in the aquatic environment: field measurements in wastewater treatment plants, surface waters, and lake sediments. Environmental Science & Technology, 36(23), 4998–5004.
Skoog, D., West, D., Holler, F. & Crouch, S. (2004). Fundamentals of Analytical Chemistry. United States of America, USA: Thomson Brooks/Cole.
Son, H., Khim, J. & Zoh, K. (2010). Degradation of triclosan in the combined reaction of Fe2+
and UV-C: Comparison with the Fenton and photolytic reactions. Environmental Progress & Sustainable Energy, 29(4), 415–420.
Song, Z., Wang, N., Zhu, L., Huang, A., Zhao, X. & Tang, H. (2012). Efficient oxidative degradation of triclosan by using an enhanced Fenton-like process. Chemical Engineering Journal, 198-199, 379-387.
Sun, Q. & Xu, Y. (2010). Evaluating intrinsic photocatalytic activities of anatase and rutile TiO2 for organic degradation in water. Journal of Physical Chemistry, 114(44), 18911–18918.
Tatarazako, N., Ishibashi, H., Teshima, K., Kishi, K. & Arizono, K. (2004). Effects of triclosan on various aquatic organisms. Environmental Sciences, 11(2), 133–140.
Thompson, A., Griffin, P., Stuetz, R. & Cartmell, E. (2005). The fate and removal of triclosan during wastewater treatment. Water Environment Research, 77(1), 63–67.
Tixier, C., Singer, H. P., Canonica, S. & Müller, S. R. (2002). Phototransformation of triclosan in surface waters: a relevant elimination process for this widely used biocide-laboratory studies, field measurements and modeling. Environmental Science & Technology, 36(16), 3482–3489.
Toms, L. L., Allmyr, M., Mueller, J. F., Adolfsson-Erici, M., McLachlan, M., Murby, J. & Harden, F. A. (2011). Triclosan in individual human milk samples from Australia. Chemosphere, 85, 1682–1686.
U.S, EPA (2013). Priority pollutants. From URL: http://water.epa.gov/scitech/methods/cwa/pollutants.cfm ( acceded: 9 -09-2014)
Villalaín, J., Mateo, C. R., Aranda, F. J., Shapiro, S. & Micol, V. (2001). Membranotropic effects of the antibacterial agent triclosan. Archives of Biochemistry and Biophysics, 390(1), 128–136.
Waller, N. J. & Kookana, R. S. (2009). Effect of triclosan on microbial activity in Australian soils. Environmental Toxicology and Chemistry, 28(1), 65–70.
66
Wang, L., Falany, C. N. & James, M. O. (2004). Triclosan as a substrate and inhibitor of 3` -phosphoadenosine 5` - phosphosulfate-sulfotransferase and udp-glucuronosyl transferase in human liver fractions, The American Society for Pharmacology and Experimental Therapeutics, 32(10), 1162–1169.
Wang, W. & Ku, Y. (2006). Photocatalytic degradation of Reactive Red 22 in aqueous solution by UV-LED radiation. Water Research, 40, 2249–2258.
Xie, Z., Ebinghaus, R., Flöser, G., Caba, A. & Ruck, W. (2008). Occurrence and distribution of triclosan in the German Bight (North Sea). Environmental Pollution, 156, 1190–1195.
Yang, B., Ying, G., Zhao, J., Zhang, L., Fang, Y. & Nghiem, L. (2011). Oxidation of triclosan by ferrate: reaction kinetics, products identification and toxicity evaluation. Journal of Hazardous Materials, 186, 227–235.
Yazdankhah, S. P., Scheie, A. A., Hoiby, E. A., Lunestad, B. T., Heir, E., Fotland, T. O., Naterstand, K. & Kruse, H. (2006). Triclosan and antimicrobial resistance in bacteria: an overview. Microbial Drug Resistance, 12(2), 83 – 90.
Ying, G. & Kookana, R. S. (2007). Triclosan in wastewaters and biosolids from Australian wastewater treatment plants. Environment International, 33, 199–205.
Yu, J. C., Kwong, T. Y., Luo, Q. & Cai, Z. (2006). Photocatalytic oxidation of triclosan. Chemosphere, 65, 390–399.
Yu, L., Achari, G. & Langford, C. H. (2013). LED-based photocatalytic treatment of pesticides and chlorophenols. Journal of Environmental Engineering, 139, 1146–1151.
67
Appendixes

68
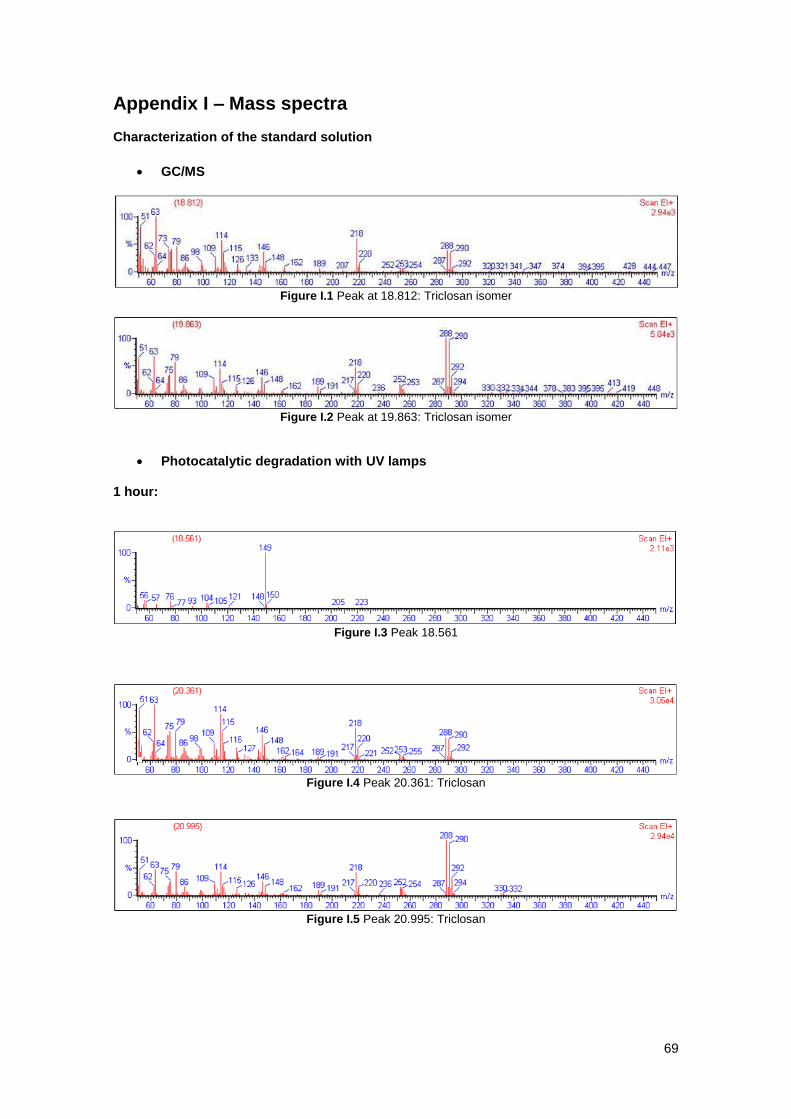
69
Appendix I – Mass spectra Characterization of the standard solution
GC/MS
Figure I.1 Peak at 18.812: Triclosan isomer
Figure I.2 Peak at 19.863: Triclosan isomer
Photocatalytic degradation with UV lamps 1 hour:
Figure I.3 Peak 18.561
Figure I.4 Peak 20.361: Triclosan
Figure I.5 Peak 20.995: Triclosan
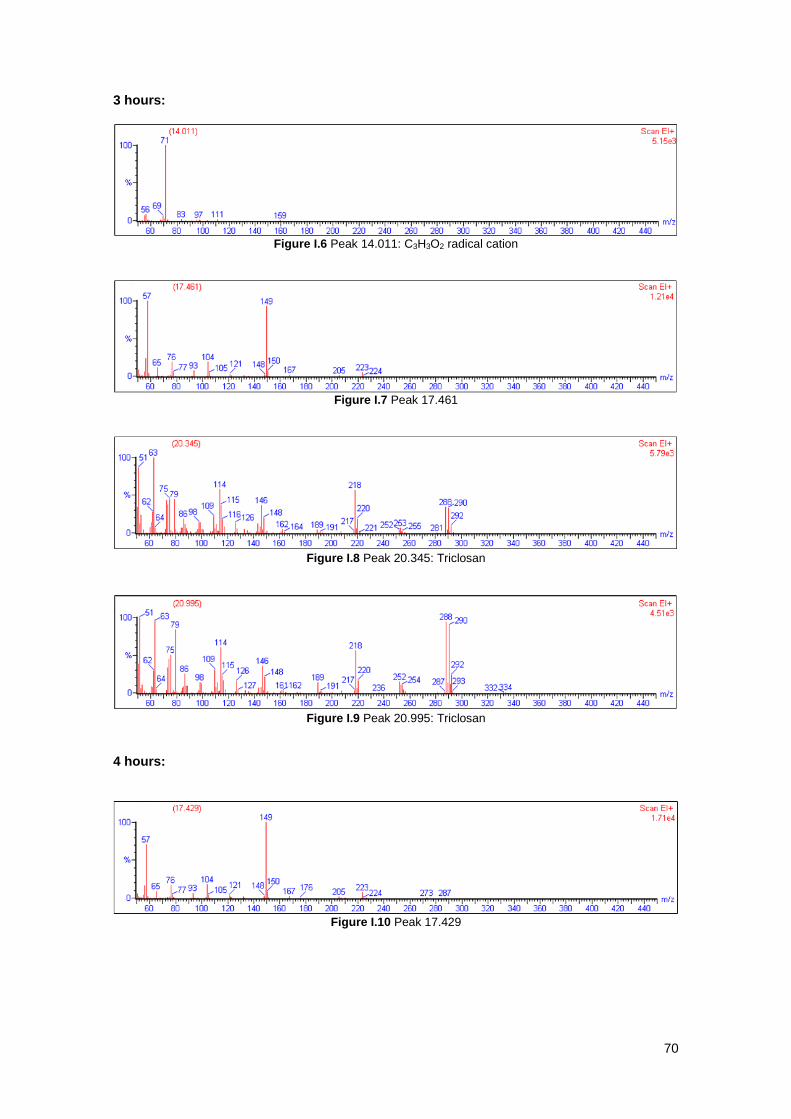
70
3 hours:
Figure I.6 Peak 14.011: C3H3O2 radical cation
Figure I.7 Peak 17.461
Figure I.8 Peak 20.345: Triclosan
Figure I.9 Peak 20.995: Triclosan
4 hours:
Figure I.10 Peak 17.429

71
Figure I.11 Peak 18.529
Figure I.12 Peak 20.346: Triclosan
Figure I.13 Peak 20.963: Triclosan
5 hours:
Figure I.14. Peak 17.546
Figure I.15 Peak 18.630
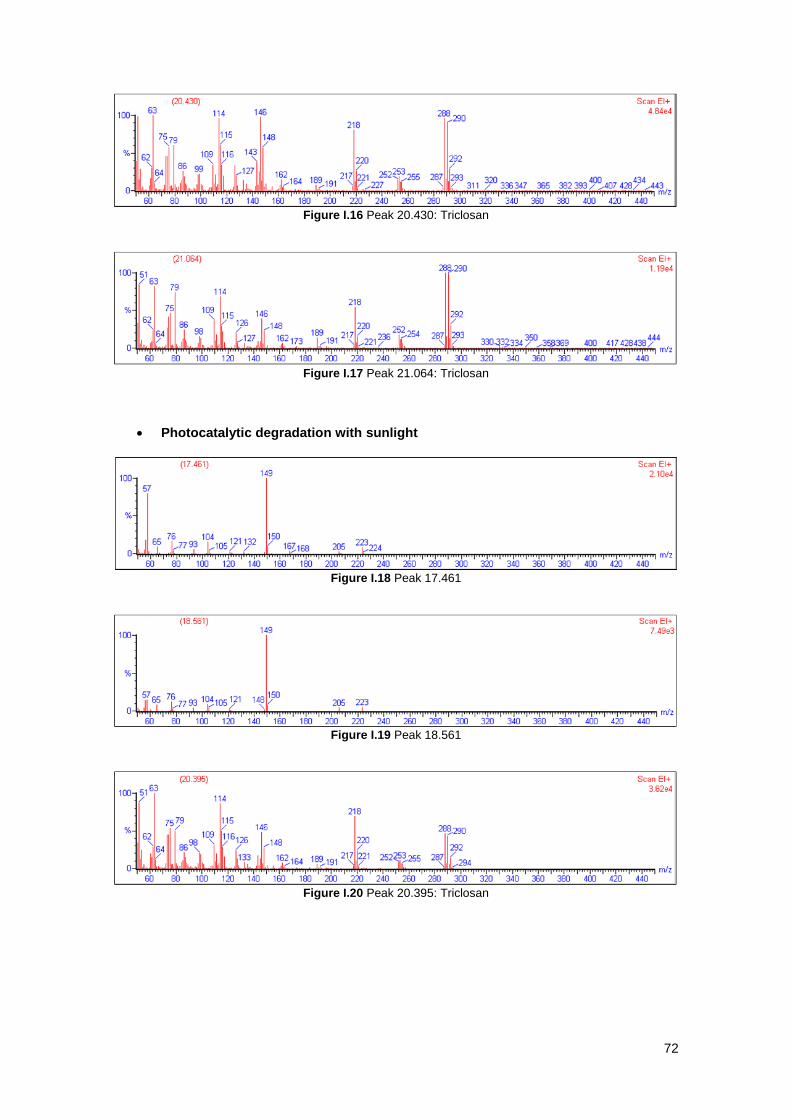
72
Figure I.16 Peak 20.430: Triclosan
Figure I.17 Peak 21.064: Triclosan
Photocatalytic degradation with sunlight
Figure I.18 Peak 17.461
Figure I.19 Peak 18.561
Figure I.20 Peak 20.395: Triclosan
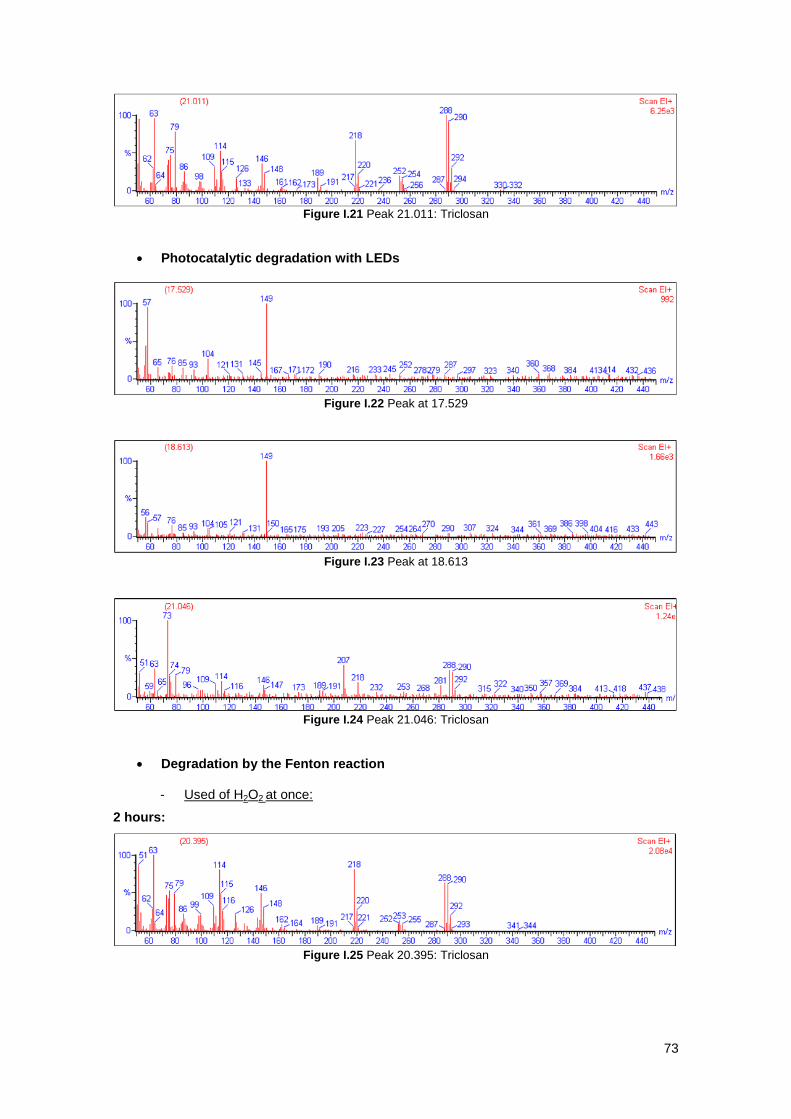
73
Figure I.21 Peak 21.011: Triclosan
Photocatalytic degradation with LEDs
Figure I.22 Peak at 17.529
Figure I.23 Peak at 18.613
Figure I.24 Peak 21.046: Triclosan
Degradation by the Fenton reaction
- Used of H2O2 at once:
2 hours:
Figure I.25 Peak 20.395: Triclosan
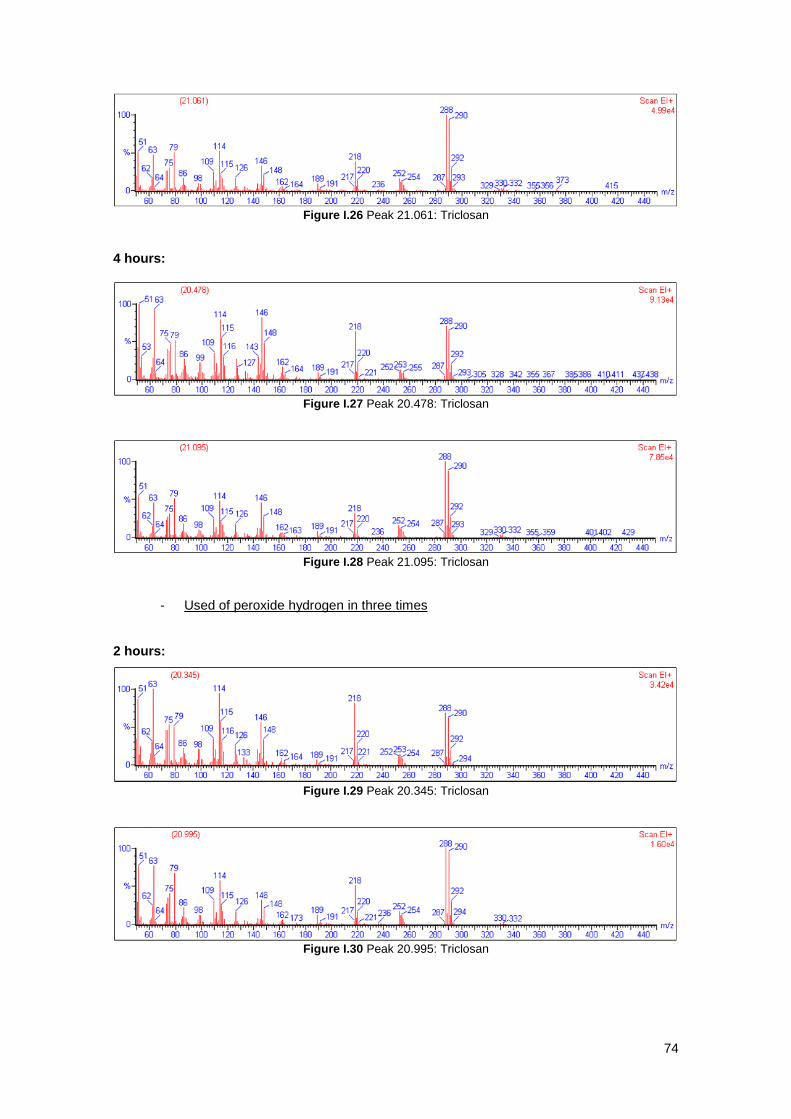
74
Figure I.26 Peak 21.061: Triclosan
4 hours:
Figure I.27 Peak 20.478: Triclosan
Figure I.28 Peak 21.095: Triclosan
- Used of peroxide hydrogen in three times
2 hours:
Figure I.29 Peak 20.345: Triclosan
Figure I.30 Peak 20.995: Triclosan
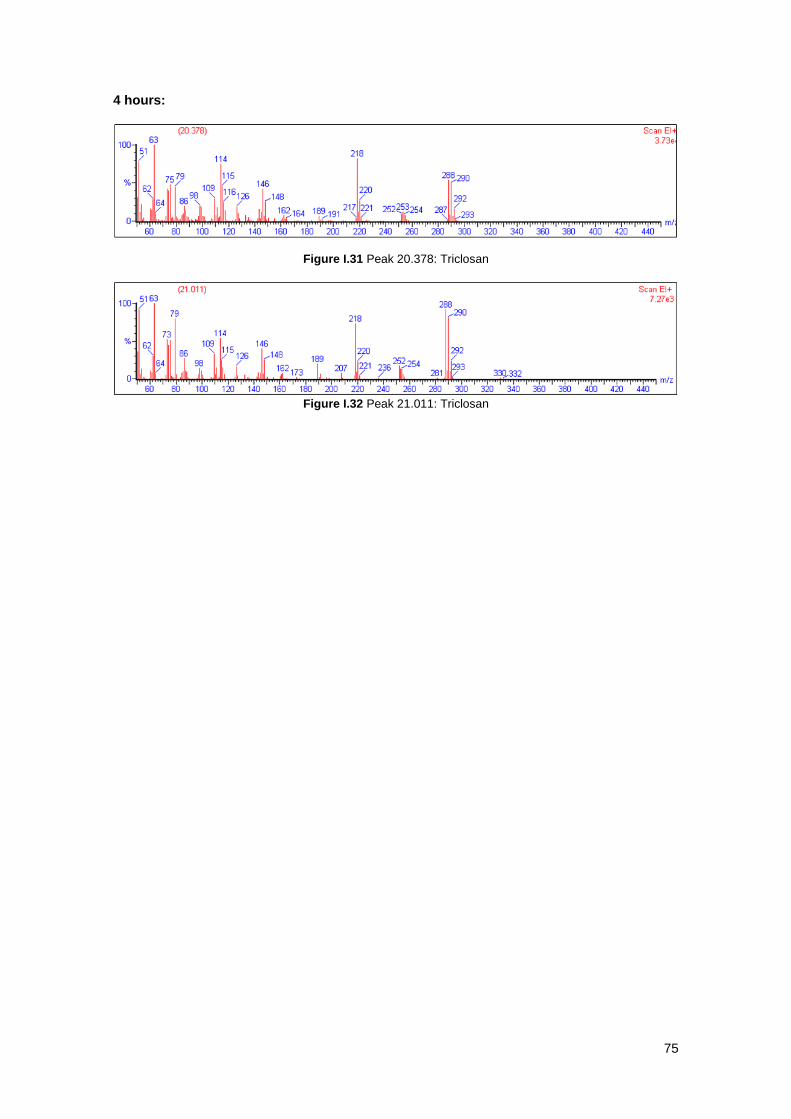
75
4 hours:
Figure I.31 Peak 20.378: Triclosan
Figure I.32 Peak 21.011: Triclosan

76
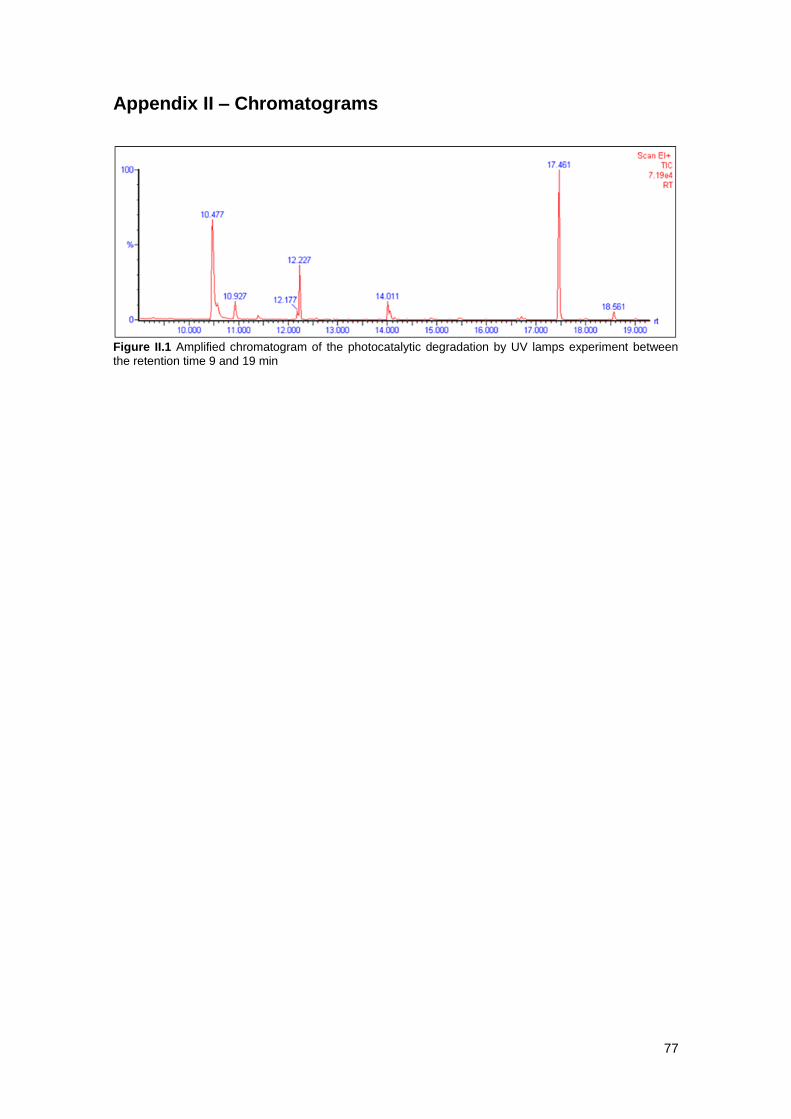
77
Appendix II – Chromatograms
Figure II.1 Amplified chromatogram of the photocatalytic degradation by UV lamps experiment between
the retention time 9 and 19 min

78
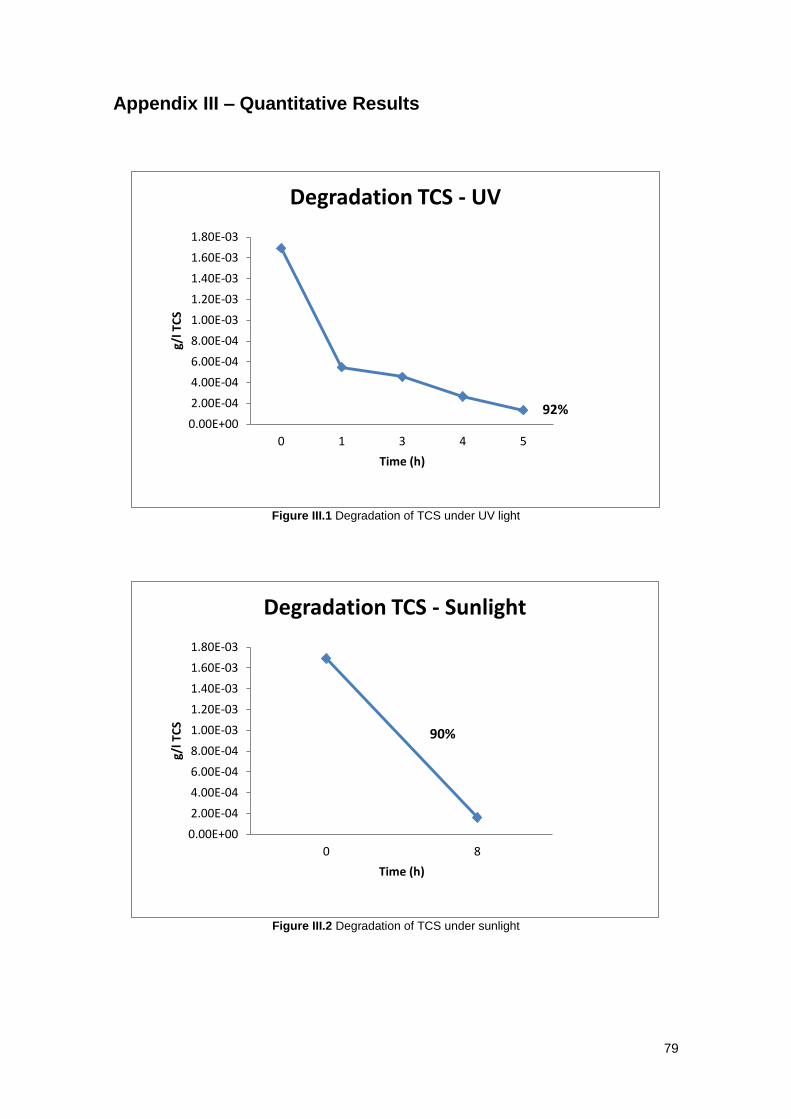
79
Appendix III – Quantitative Results
Figure III.1 Degradation of TCS under UV light
Figure III.2 Degradation of TCS under sunlight
0.00E+00
2.00E-04
4.00E-04
6.00E-04
8.00E-04
1.00E-03
1.20E-03
1.40E-03
1.60E-03
1.80E-03
0 1 3 4 5
g/l T
CS
Time (h)
Degradation TCS - UV
92%
0.00E+00
2.00E-04
4.00E-04
6.00E-04
8.00E-04
1.00E-03
1.20E-03
1.40E-03
1.60E-03
1.80E-03
0 8
g/l T
CS
Time (h)
Degradation TCS - Sunlight
90%

80
Figure III.3 Degradation of TCS under LEDs
Figure III.4 Degradation of TCS under photo - Fenton reaction
0.00E+00
2.00E-04
4.00E-04
6.00E-04
8.00E-04
1.00E-03
1.20E-03
1.40E-03
1.60E-03
1.80E-03
0 8
g/l T
CS
Time (h)
Degradation TCS - Leds
0.00E+00
2.00E-04
4.00E-04
6.00E-04
8.00E-04
1.00E-03
1.20E-03
1.40E-03
1.60E-03
1.80E-03
0 2
g/ T
CS
Time (h)
Degradation TCS - Photo/Fenton
100%
53%
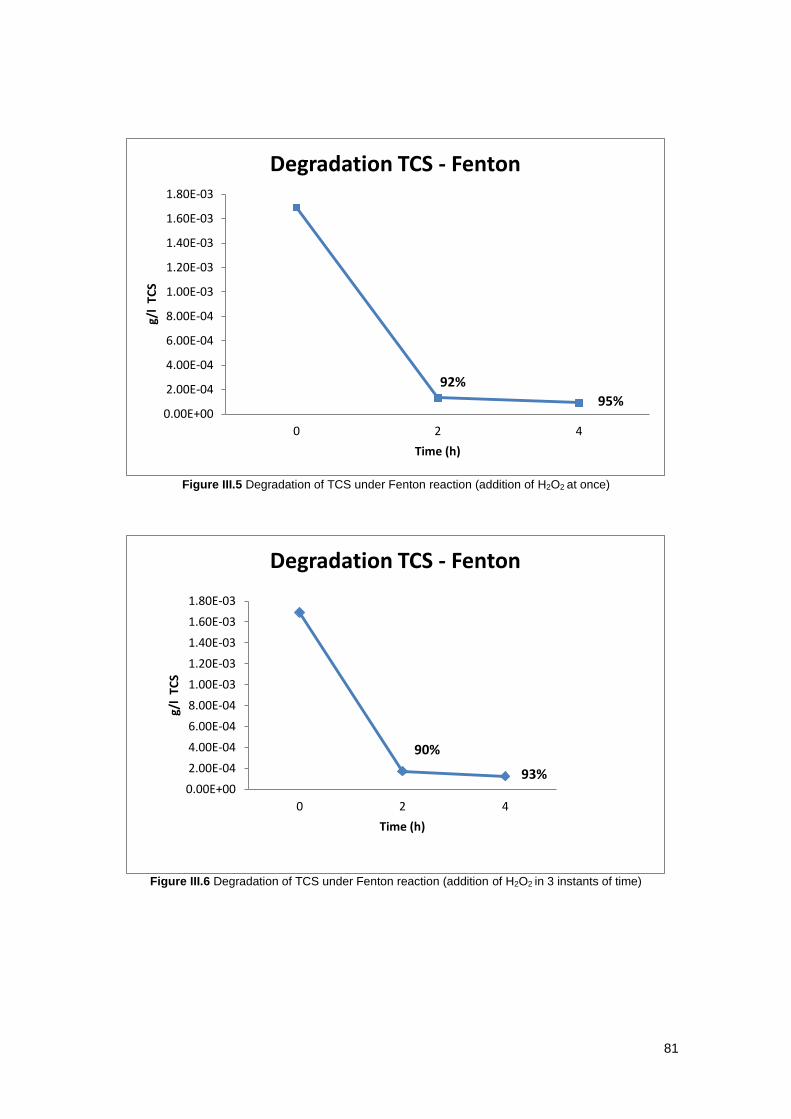
81
Figure III.5 Degradation of TCS under Fenton reaction (addition of H2O2 at once)
Figure III.6 Degradation of TCS under Fenton reaction (addition of H2O2 in 3 instants of time)
0.00E+00
2.00E-04
4.00E-04
6.00E-04
8.00E-04
1.00E-03
1.20E-03
1.40E-03
1.60E-03
1.80E-03
0 2 4
g/l
TCS
Time (h)
Degradation TCS - Fenton
92%
95%
0.00E+00
2.00E-04
4.00E-04
6.00E-04
8.00E-04
1.00E-03
1.20E-03
1.40E-03
1.60E-03
1.80E-03
0 2 4
g/l
TCS
Time (h)
Degradation TCS - Fenton
90%
93%

82
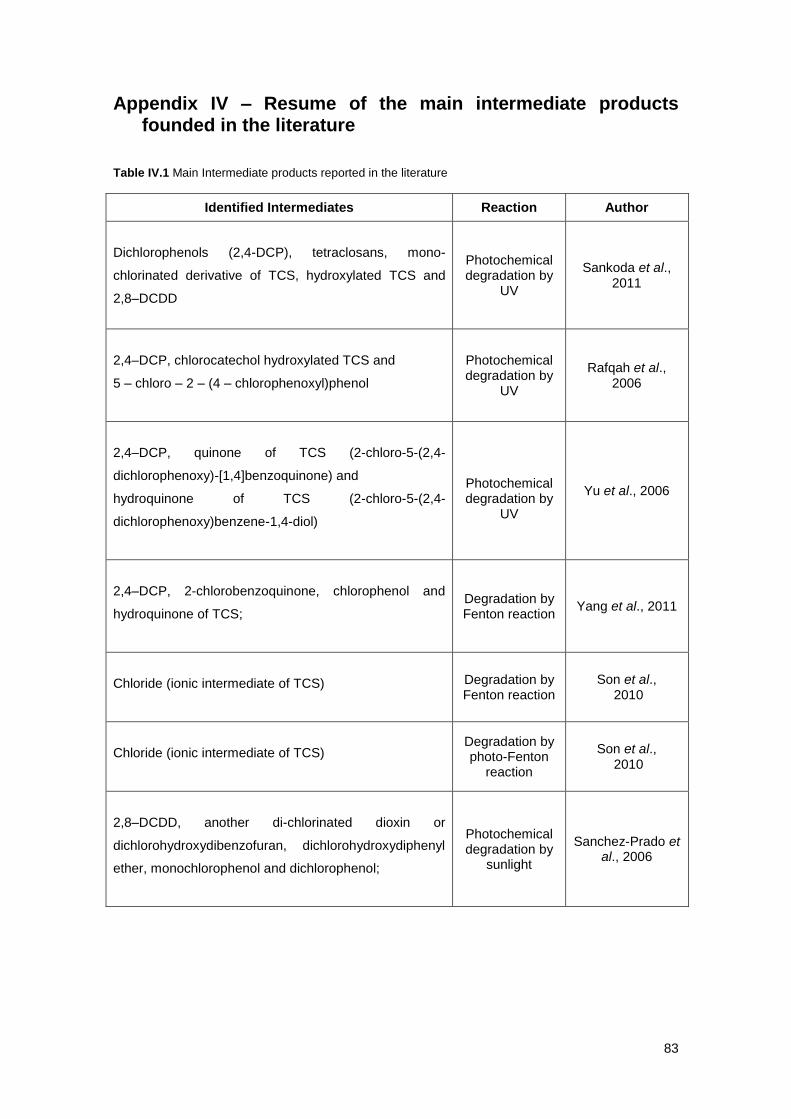
83
Appendix IV – Resume of the main intermediate products founded in the literature
Table IV.1 Main Intermediate products reported in the literature
Identified Intermediates Reaction Author
Dichlorophenols (2,4-DCP), tetraclosans, mono-
chlorinated derivative of TCS, hydroxylated TCS and
2,8–DCDD
Photochemical degradation by
UV
Sankoda et al., 2011
2,4–DCP, chlorocatechol hydroxylated TCS and
5 – chloro – 2 – (4 – chlorophenoxyl)phenol
Photochemical degradation by
UV
Rafqah et al., 2006
2,4–DCP, quinone of TCS (2-chloro-5-(2,4-
dichlorophenoxy)-[1,4]benzoquinone) and
hydroquinone of TCS (2-chloro-5-(2,4-
dichlorophenoxy)benzene-1,4-diol)
Photochemical degradation by
UV
Yu et al., 2006
2,4–DCP, 2-chlorobenzoquinone, chlorophenol and
hydroquinone of TCS;
Degradation by Fenton reaction
Yang et al., 2011
Chloride (ionic intermediate of TCS)
Degradation by Fenton reaction
Son et al., 2010
Chloride (ionic intermediate of TCS)
Degradation by photo-Fenton
reaction
Son et al., 2010
2,8–DCDD, another di-chlorinated dioxin or
dichlorohydroxydibenzofuran, dichlorohydroxydiphenyl
ether, monochlorophenol and dichlorophenol;
Photochemical degradation by
sunlight
Sanchez-Prado et al., 2006