photoelectric franck-hertz experiment and its...
TRANSCRIPT
PHYSICAL REVIEW E 85, 056409 (2012)
Photoelectric Franck-Hertz experiment and its kinetic analysis by Monte Carlo simulation
Peter Magyar, Ihor Korolov, and Zoltan DonkoResearch Institute for Solid State Physics and Optics of the Hungarian Academy of Sciences, P.O.B. 49, H-1525 Budapest, Hungary
(Received 21 December 2011; revised manuscript received 20 April 2012; published 18 May 2012)
The electrical characteristics of a photoelectric Franck-Hertz cell are measured in argon gas over a widerange of pressure, covering conditions where elastic collisions play an important role, as well as conditionswhere ionization becomes significant. Photoelectron pulses are induced by the fourth harmonic UV light of adiode-pumped Nd:YAG laser. The electron kinetics, which is far more complex compared to the naive picture ofthe Franck-Hertz experiment, is analyzed via Monte Carlo simulation. The computations provide the electricalcharacteristics of the cell, the energy and velocity distribution functions, and the transport parameters of theelectrons, as well as the rate coefficients of different elementary processes. A good agreement is obtainedbetween the cell’s measured and calculated electrical characteristics, the peculiarities of which are understoodby the simulation studies.
DOI: 10.1103/PhysRevE.85.056409 PACS number(s): 52.80.Dy, 52.65.Pp
I. INTRODUCTION
It was about 100 years ago when James Franck and GustavLudwig Hertz carried out their famous experiment [1] thatdemonstrated the quantized nature of atomic energy levels,postulated in Bohr’s model of atoms. “For their discovery ofthe laws governing the impact of an electron upon an atom” [2]they were awarded with the Nobel Prize in Physics in 1925.
In their experiment Franck and Hertz studied the behaviorof electrons under the effect of electric fields, in the presenceof mercury vapor. Their experimental cell had a cathode-grid-anode configuration. They launched electrons from athermionic cathode in the first region of their experimentalcell and accelerated them by a variable voltage (Vcg > 0). Inthe second region of the cell, which was separated from thefirst region by a wire grid, a decelerating voltage (Vga < 0)was applied. In the case of no significant energy loss in thefirst region, the electrons were able to overcome this potentialdifference and arrived at the anode (creating an anode currentIa), provided that Vcg > |Vag|. Franck and Hertz have observedthat as Vcg was increased (at fixed Vag), a sudden decrease ofthe anode current Ia took place. This effect was explainedby the possibility that the accelerated electrons excite adiscrete energy level of the Hg atom in inelastic collisions,resulting in a well-defined energy loss, which prevented theseelectrons from reaching the anode. With further increasingVcg a series of peaks and valleys was recorded in the Ia(Vcg)characteristic, with a constant separation of the peaks at�ε ∼= 4.9 eV. The periodicity of the peak-valley structurehas been the consequence of multiple excitation processesby individual electrons. Light emission from Hg vapor atλ = 253.7 nm has also been observed, which wavelengthcorresponds to an excitation threshold of 4.9 eV, according to�ε = hc/λ.
During the past decades the Franck-Hertz (FH) experimenthas become a standard subject of undergraduate physicslaboratories, and its theoretical analysis has been a topicof continued interest, e.g., Refs. [3–7]. Besides Hg vapor,experiments with noble gases have been reported as well, but,however, without a detailed analysis.
Franck-Hertz tubes with four electrodes (referred toas “extended FH cells”) have also been developed; these
experimental arrangements provide the possibility to resolvevarious excitation levels (critical potentials) of atoms [8–10].In Ref. [10] the experimental conditions were optimized for themeasurements of the critical potentials of mercury, while in asubsequent paper [11], an analytical theory was developed thatexplained the prominent features, including the double-layerformation, in the extended Franck-Hertz experiment.
The correct description of the FH experiment, which intendsto go beyond qualitative explanations, requires a treatment atthe level of the kinetic theory [12,13] due to the appearanceof nonequilibrium effects [14] in the electron transport. Weemphasize that the term “nonequilibrium” is used here tocharacterize transport and not the thermodynamical state ofthe system. In the thermodynamical sense, low-temperatureweakly ionized plasmas are in most cases nonequilibriumsystems, as the electron velocity distribution function (VDF)usually differs from Maxwellian.
Nonequilibrium effects in the particle transport typicallyshow up near the boundaries of the systems, as well as in caseswhen the electric field varies rapidly in space and/or time. Insuch cases the requirement for the “hydrodynamic” or “(localfield) equilibrium” transport, viz., that the electron velocitydistribution function is defined by the local electric field togas density ratio, E(r,t)/n, is violated [14]. We note that theterms “nonequilibrium” [14–18] and “nonlocal” [19–22], tocharacterize particle transport, have been used synonymouslyin the literature by different groups of authors. The conditionsfor the onset of this particular behavior of charged particleshave been analyzed in details in previous works; see, e.g.,Ref. [20].
Complex spatial structures in the electron VDF may alsodevelop in a homogeneous electric field. Let us consider aspatial region with homogeneous electric field (E), into whichwe inject particles from a point source with a certain velocitydistribution. The equilibration of the particle swarm withthe reduced electric field (the relaxation of the initial VDFtoward the equilibrium VDF) requires a certain characteristiclength Leq, and the equilibrium VDF is expected to formonly beyond this distance. The equilibration of the swarmcan be quite complex process, and, depending on E/n andthe gas itself, extended spatially periodic structures may exist
056409-11539-3755/2012/85(5)/056409(10) ©2012 American Physical Society
PETER MAGYAR, IHOR KOROLOV, AND ZOLTAN DONKO PHYSICAL REVIEW E 85, 056409 (2012)
even in a homogeneous electric field. During the past yearsconsiderable attention has been devoted to studies of theseperiodic structures [23–27]. The “window” phenomenon, i.e.,the range of voltages and gas pressures, within which electronproperties oscillate, and outside of which properties simplydecay monotonically in space, has been studied in Ref. [28]by means of a fluid model. The effect of magnetic fieldperpendicular to the electric field on the spatial relaxationof a swarm of charged particles in an idealized steady-stateTownsend experiment was described by the solution of theBoltzmann equation in [29].
We also note that striations in gas discharges (see, e.g.,Ref. [30]), where, however, the electric field is modulated,also bear some similarities to the phenomena occurring inFH cells, although in the latter the electric field is notperturbed by the charged particles to a considerable extent. Thephysics of striations in rare gases is relatively well understood[30]. Numerical simulations of argon DC discharges havereproduced certain types of moving striations under limitedrange of discharge conditions [25,30].
In Franck-Hertz cells, the lengths of the two spatial regionsare typically much shorter than Leq. Therefore, electrontransport in these systems is inherently of nonequilibriumcharacter [14]. To cope with the task of a kinetic descriptionof the electrons’ behavior one can either turn to the solutionof the Boltzmann equation [24,25,31–35] or apply MonteCarlo simulation [36–43] to trace the electrons. Boltzmannequation analysis of the FH experiment in Hg vapor wasaccomplished by Sigeneger et al. [44,45] for a cylindricalgeometry and by Robson et al. [46] for a parallel-planegeometry. These analyses have revealed the complex behaviorof the energy transfer processes and of the isotropic andanisotropic parts of the electron distribution function, aswell as the “macroscopic properties” (mean energy, currentdensity, etc.) of the electrons. They have, however, notcompared the theoretical results to any recent experimentaldata.
Considering the fact that all previous works, that we areaware of, have dealt either with an experiment (without arigorous kinetic analysis) or with the kinetic description ofthe phenomena taking place in FH cells (without a rigorouscomparison to a recent experiment), a combined experimentaland kinetic modeling study could provide a more coherentphysical picture of the electron kinetics in FH cells, and thussuch an investigation would be in order. Our aim is to carryout and present such a study:
(1) We develop an experimental Franck-Hertz cell, whichavoids the need for a thermionic cathode and operates on thebasis of photoemission. By eliminating the need for a heatedcathode we can ensure a uniform gas density distribution insidethe FH cell, which makes modeling more straightforward.We are not aware of (i) any previous experiment based onphotoelectrons and (ii) any study that takes into accountthe nonuniform gas density distribution in the models of“thermionic” FH cells.
(2) We develop a model, which gives an exact descriptionof the electron kinetics by Monte Carlo simulation, based onfirst principles. In contrast with previous modeling studies oursimulation is two-dimensional and accounts for the finite sizeof the FH cell in all dimensions.
(3) We carry out measurements over a wide domain ofpressures, spanning E/n values between conditions whereelastic energy losses are significant and conditions whereionization becomes appreciable. We give a critical quanti-tative comparison between the experimental and simulationresults for the whole domain of experimental conditions andpresent detailed information about the electron kinetics in ourFH cell.
To our best knowledge no previous studies have set thesegoals together; thus the present investigation represents astep toward the understanding of the complex nonequilibriumelectron kinetics in the Franck-Hertz experiment.
In Secs. II A and II B, respectively we describe ourexperimental apparatus and the data acquisition techniques,and present the experimental results. Section III A brieflydiscusses the Monte Carlo procedure and the modeling as-sumptions, while in Sec. III B we discuss the modeling results,starting with their comparison with the experimental data, andfollowing with the presentation of the characteristics of theelectron swarms in the FH cell under different conditions.Section IV gives the conclusions of our studies.
II. EXPERIMENTAL
A. Experimental setup
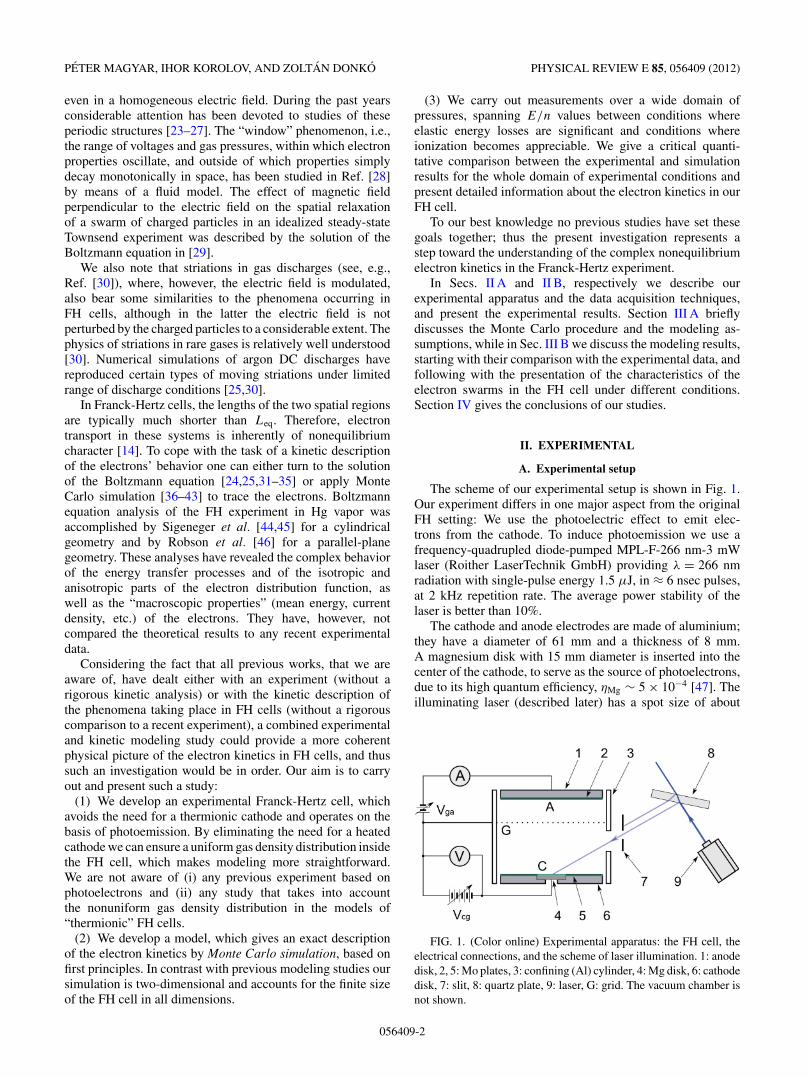
The scheme of our experimental setup is shown in Fig. 1.Our experiment differs in one major aspect from the originalFH setting: We use the photoelectric effect to emit elec-trons from the cathode. To induce photoemission we use afrequency-quadrupled diode-pumped MPL-F-266 nm-3 mWlaser (Roither LaserTechnik GmbH) providing λ = 266 nmradiation with single-pulse energy 1.5 μJ, in ≈ 6 nsec pulses,at 2 kHz repetition rate. The average power stability of thelaser is better than 10%.
The cathode and anode electrodes are made of aluminium;they have a diameter of 61 mm and a thickness of 8 mm.A magnesium disk with 15 mm diameter is inserted into thecenter of the cathode, to serve as the source of photoelectrons,due to its high quantum efficiency, ηMg ∼ 5 × 10⁻⁴ [47]. Theilluminating laser (described later) has a spot size of about
FIG. 1. (Color online) Experimental apparatus: the FH cell, theelectrical connections, and the scheme of laser illumination. 1: anodedisk, 2, 5: Mo plates, 3: confining (Al) cylinder, 4: Mg disk, 6: cathodedisk, 7: slit, 8: quartz plate, 9: laser, G: grid. The vacuum chamber isnot shown.
056409-2
PHOTOELECTRIC FRANCK-HERTZ EXPERIMENT AND ITS . . . PHYSICAL REVIEW E 85, 056409 (2012)
10 × 1 mm on the Mg disk, due to the high angle of incidence(see Fig. 1). To suppress photoemission (originating fromscattered light) from the cathode outside the Mg disk, as well asfrom the anode, these surfaces are covered with thin (50 μm)molybdenum plates, expected to have a significantly lowerphotoelectric yield than Al (ηAl ∼ 3 × 10⁻⁵ [48]) when theMo surface is not treated.
The grid (wire mesh) is held at xg = 14.9 ± 0.2 mm heightabove the cathode surface by an Al cylinder (part 3 in Fig. 1),to which it is electrically connected. This cylinder surroundsthe cathode and the anode, and holds the latter, by ceramicspacers, at a distance dga = 7 ± 0.2 mm above the grid. Using aproper mesh is crucial in the experiments. We use a rectangularNi mesh with T = 90% geometric transmission, with squareopenings and 70 lines/inch density, manufactured by PrecisionEforming LLC (type MN17). A high transmission is neededfor acceptable signal intensity. A high density minimizes theeffect of uneven potential distribution in the plane of the meshand the penetration of the electric field from either side ofthe grid into the other side (see, e.g., Ref, [49]). Such effectshave a smoothing effect on the FH characteristics and wouldcomplicate the treatment of the grid in the simulation (seelater). The thickness of the mesh is about 7 μm.
The FH cell is situated in a vacuum chamber (described indetails in Ref. [50]). To enhance the purity of the system:(1) the vacuum part of the apparatus is pumped down bya turbo-molecular pump to ≈10−7 mbar and is heated to∼100◦ C by heating tapes, for several hours, preceding themeasurements, (2) the experiments are conducted using 6.0purity argon gas with a slow flow (�10 sccm), and (3) priorto entering the vacuum chamber, the gas is fed through a coldtrap filled with liquid nitrogen.
The light of the laser is fed through a quartz window intothe vacuum chamber and reaches the Mg cathode via a slit onthe Al cylinder (see Fig. 1). With direct illumination of thecathode by the laser beam we observed the effect of Coulombcollisions of photoelectrons that showed up as a smoothingeffect (decreased modulation) of the FH characteristics due tothe energy spreading of the electrons. To avoid this effect weuse for illumination a beam of the laser reflected from a quartzplate, resulting in ∼10% of the initial intensity.
To minimize electrical noise we use batteries to establishthe voltages Vcg and Vga. The latter is set to a fixed valueVga = −3.05 V, while Vcg is scanned between 0 and 55 V. Thisscanning is realized by a isolated amplifier circuit connectedto a National Instruments (USB-6251) card controlled byLabView software running on a personal computer. The samecard is used as well for the data collection. The voltage Vcg
is measured by a digital multimeter (type Metex M-6000M,shown schematically as a voltage meter in Fig. 1) connected viaRS232 to the computer. The anode current Ia is first amplifiedby a Keithley 427 current amplifier (shown schematically asa current meter in Fig. 1) and is sampled by the USB-6251card. As Ia is usually in the nA regime proper shielding ofthe electrical connections proved to be essential. During thecourse of measurements data obtained for 80 000 pulses areaveraged at each value of Vcg. The integration time of the dataacquisition is set in a way to ensure that all charges producedin the photoelectron initiated avalanches are collected. Wemeasure the FH characteristics in relative units, as it was not
possible for us to carry out an accurate absolute calibration ofthe system.
B. Experimental results
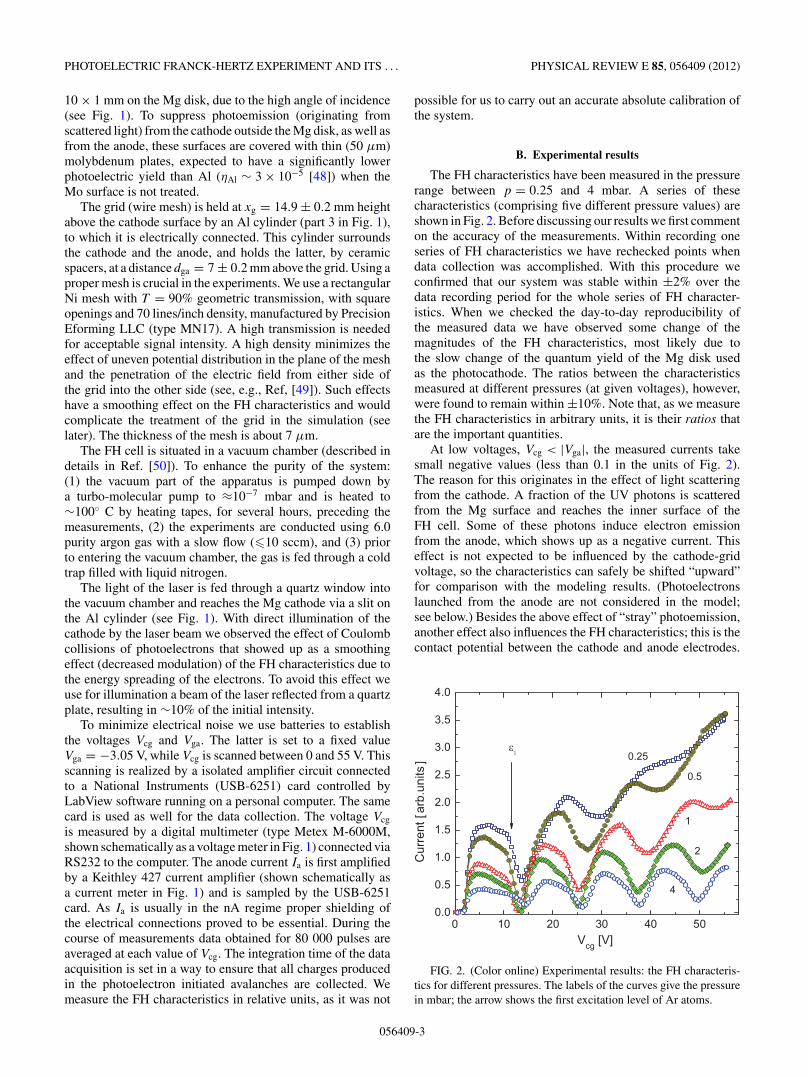
The FH characteristics have been measured in the pressurerange between p = 0.25 and 4 mbar. A series of thesecharacteristics (comprising five different pressure values) areshown in Fig. 2. Before discussing our results we first commenton the accuracy of the measurements. Within recording oneseries of FH characteristics we have rechecked points whendata collection was accomplished. With this procedure weconfirmed that our system was stable within ±2% over thedata recording period for the whole series of FH character-istics. When we checked the day-to-day reproducibility ofthe measured data we have observed some change of themagnitudes of the FH characteristics, most likely due tothe slow change of the quantum yield of the Mg disk usedas the photocathode. The ratios between the characteristicsmeasured at different pressures (at given voltages), however,were found to remain within ±10%. Note that, as we measurethe FH characteristics in arbitrary units, it is their ratios thatare the important quantities.
At low voltages, Vcg < |Vga|, the measured currents takesmall negative values (less than 0.1 in the units of Fig. 2).The reason for this originates in the effect of light scatteringfrom the cathode. A fraction of the UV photons is scatteredfrom the Mg surface and reaches the inner surface of theFH cell. Some of these photons induce electron emissionfrom the anode, which shows up as a negative current. Thiseffect is not expected to be influenced by the cathode-gridvoltage, so the characteristics can safely be shifted “upward”for comparison with the modeling results. (Photoelectronslaunched from the anode are not considered in the model;see below.) Besides the above effect of “stray” photoemission,another effect also influences the FH characteristics; this is thecontact potential between the cathode and anode electrodes.
FIG. 2. (Color online) Experimental results: the FH characteris-tics for different pressures. The labels of the curves give the pressurein mbar; the arrow shows the first excitation level of Ar atoms.
056409-3
PETER MAGYAR, IHOR KOROLOV, AND ZOLTAN DONKO PHYSICAL REVIEW E 85, 056409 (2012)
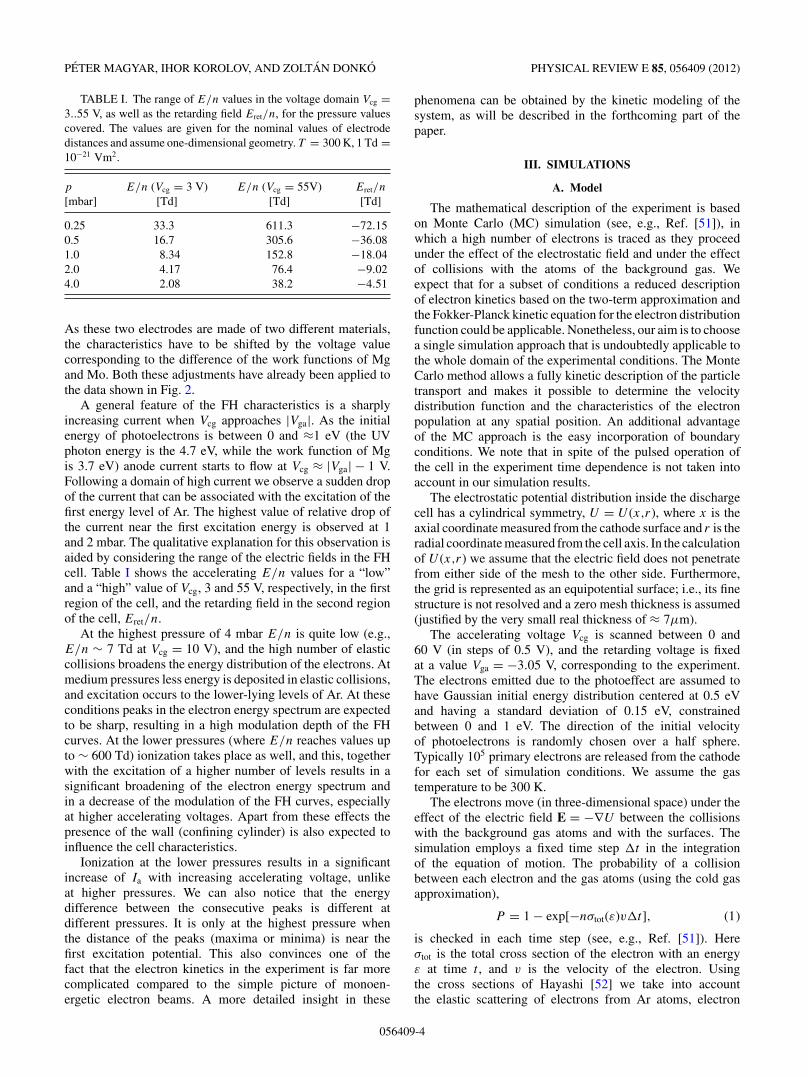
TABLE I. The range of E/n values in the voltage domain Vcg =3..55 V, as well as the retarding field Eret/n, for the pressure valuescovered. The values are given for the nominal values of electrodedistances and assume one-dimensional geometry. T = 300 K, 1 Td =10−21 Vm2.
p E/n (Vcg = 3 V) E/n (Vcg = 55V) Eret/n
[mbar] [Td] [Td] [Td]
0.25 33.3 611.3 −72.150.5 16.7 305.6 −36.081.0 8.34 152.8 −18.042.0 4.17 76.4 −9.024.0 2.08 38.2 −4.51
As these two electrodes are made of two different materials,the characteristics have to be shifted by the voltage valuecorresponding to the difference of the work functions of Mgand Mo. Both these adjustments have already been applied tothe data shown in Fig. 2.
A general feature of the FH characteristics is a sharplyincreasing current when Vcg approaches |Vga|. As the initialenergy of photoelectrons is between 0 and ≈1 eV (the UVphoton energy is the 4.7 eV, while the work function of Mgis 3.7 eV) anode current starts to flow at Vcg ≈ |Vga| − 1 V.Following a domain of high current we observe a sudden dropof the current that can be associated with the excitation of thefirst energy level of Ar. The highest value of relative drop ofthe current near the first excitation energy is observed at 1and 2 mbar. The qualitative explanation for this observation isaided by considering the range of the electric fields in the FHcell. Table I shows the accelerating E/n values for a “low”and a “high” value of Vcg, 3 and 55 V, respectively, in the firstregion of the cell, and the retarding field in the second regionof the cell, Eret/n.
At the highest pressure of 4 mbar E/n is quite low (e.g.,E/n ∼ 7 Td at Vcg = 10 V), and the high number of elasticcollisions broadens the energy distribution of the electrons. Atmedium pressures less energy is deposited in elastic collisions,and excitation occurs to the lower-lying levels of Ar. At theseconditions peaks in the electron energy spectrum are expectedto be sharp, resulting in a high modulation depth of the FHcurves. At the lower pressures (where E/n reaches values upto ∼ 600 Td) ionization takes place as well, and this, togetherwith the excitation of a higher number of levels results in asignificant broadening of the electron energy spectrum andin a decrease of the modulation of the FH curves, especiallyat higher accelerating voltages. Apart from these effects thepresence of the wall (confining cylinder) is also expected toinfluence the cell characteristics.
Ionization at the lower pressures results in a significantincrease of Ia with increasing accelerating voltage, unlikeat higher pressures. We can also notice that the energydifference between the consecutive peaks is different atdifferent pressures. It is only at the highest pressure whenthe distance of the peaks (maxima or minima) is near thefirst excitation potential. This also convinces one of thefact that the electron kinetics in the experiment is far morecomplicated compared to the simple picture of monoen-ergetic electron beams. A more detailed insight in these
phenomena can be obtained by the kinetic modeling of thesystem, as will be described in the forthcoming part of thepaper.
III. SIMULATIONS
A. Model
The mathematical description of the experiment is basedon Monte Carlo (MC) simulation (see, e.g., Ref. [51]), inwhich a high number of electrons is traced as they proceedunder the effect of the electrostatic field and under the effectof collisions with the atoms of the background gas. Weexpect that for a subset of conditions a reduced descriptionof electron kinetics based on the two-term approximation andthe Fokker-Planck kinetic equation for the electron distributionfunction could be applicable. Nonetheless, our aim is to choosea single simulation approach that is undoubtedly applicable tothe whole domain of the experimental conditions. The MonteCarlo method allows a fully kinetic description of the particletransport and makes it possible to determine the velocitydistribution function and the characteristics of the electronpopulation at any spatial position. An additional advantageof the MC approach is the easy incorporation of boundaryconditions. We note that in spite of the pulsed operation ofthe cell in the experiment time dependence is not taken intoaccount in our simulation results.
The electrostatic potential distribution inside the dischargecell has a cylindrical symmetry, U = U (x,r), where x is theaxial coordinate measured from the cathode surface and r is theradial coordinate measured from the cell axis. In the calculationof U (x,r) we assume that the electric field does not penetratefrom either side of the mesh to the other side. Furthermore,the grid is represented as an equipotential surface; i.e., its finestructure is not resolved and a zero mesh thickness is assumed(justified by the very small real thickness of ≈ 7μm).
The accelerating voltage Vcg is scanned between 0 and60 V (in steps of 0.5 V), and the retarding voltage is fixedat a value Vga = −3.05 V, corresponding to the experiment.The electrons emitted due to the photoeffect are assumed tohave Gaussian initial energy distribution centered at 0.5 eVand having a standard deviation of 0.15 eV, constrainedbetween 0 and 1 eV. The direction of the initial velocityof photoelectrons is randomly chosen over a half sphere.Typically 105 primary electrons are released from the cathodefor each set of simulation conditions. We assume the gastemperature to be 300 K.
The electrons move (in three-dimensional space) under theeffect of the electric field E = −∇U between the collisionswith the background gas atoms and with the surfaces. Thesimulation employs a fixed time step �t in the integrationof the equation of motion. The probability of a collisionbetween each electron and the gas atoms (using the cold gasapproximation),
P = 1 − exp[−nσtot(ε)v�t], (1)
is checked in each time step (see, e.g., Ref. [51]). Hereσtot is the total cross section of the electron with an energyε at time t , and v is the velocity of the electron. Usingthe cross sections of Hayashi [52] we take into accountthe elastic scattering of electrons from Ar atoms, electron
056409-4

PHOTOELECTRIC FRANCK-HERTZ EXPERIMENT AND ITS . . . PHYSICAL REVIEW E 85, 056409 (2012)
impact excitation to 25 electronic levels, as well as ionization.The collision kinematics follows the procedures given byNanbu [53]. Electrons created in ionization processes are alsofollowed in the same way as the “parent” electrons. Quantitiesof interest (velocity distribution, mean electron energy, etc.)are sampled in each time step.
The electrons are traced until they get absorbed by anyof the surfaces: at the cathode, at the anode, at the confiningcylinder, or at the mesh. The reflection from all these metalsurfaces is assumed to be elastic and to have a probability thatdepends on the angle of incidence (θ ):
R(θ ) = R0 exp[c(1 − cos(θ )], (2)
where c is constant chosen in a way that R(90◦) = 1. Atthe low electron energies considered here it is reasonable toassume that R0 has a relatively high value, as observed insome previous investigations [54,55]. Our calculations indicatethat the best agreement with the experimental data can beobtained when R0 = 0.7 is used. The model could clearlybe improved at this point by using precise electron reflectiondata (including both energy and angular dependence of R)for all the different metals (Al, Mg, Mo, Ni) present in theFH cell. Such data are, however, not available, and thereforewe decide to handle the reflection process in a unified way,independently of the material. The reproducibility of the exper-imental electrical characteristics by the modeling calculations(discussed in the next section) confirms that this is a reasonableapproach.
The effect of the mesh can be accounted for in the simulationin a simple manner, by assigning a transmission coefficientT , provided that the mesh is “dense enough” (as explainedin Sec. II A). We take T to be the geometric transmission(90%). Whenever an electron crosses the mesh plane it istransmitted with a probability T and a reflection process[characterized by a reflection coefficient given by (2)] takesplace with a probability 1 − T . As the free path of the electronsis much shorter than the dimension of the FH cell, and asthe velocity distribution function of the electrons is expectedto be nearly isotropic, at least for the lower values of E/n,the electrons cross the mesh plane several times, in contrastwith the naive picture of the FH experiment. This is the factwhy the transmission of the grid has a strong effect on theanode current, and why a high-transmission mesh is crucialfor acceptable signal levels in the experiment.
It is noted that besides the effect of the external UVlaser beam other particles may contribute as well to electronproduction in the cathode surface. These are the ions andmetastable atoms created in collision processes as well asthe VUV photons resulting from the decay of excited Aratoms. In self-sustained discharges ions play a crucial rolein the maintenance of the discharge. Our FH cell is, however,not a self-sustained system and operates in a pulsed mode(as described in Sec. II A) at 2 kHz repetition frequencyand with about 6 nsec laser pulse length, resulting in aduty cycle of about 10−5. The laser-induced photoelectronsand the additional electrons created in ionizations completetheir flight to the electrodes over a time within a few tensof nanonseconds. For the ions it takes a much longer timeto reach the electrodes, and thus we can safely assume that
they create a continuous current, which is, however, extremelysmall, as it is spread in time. Metastables can in principlecontribute to the emission of secondary electrons (like theions) and, additionally, create ionization in the gas phase.Their influence to secondary electron production can be ruledout on the same basis as for the ions. As to gas-phaseprocesses, ionization may occur due to a stepwise processin electron-metastable collisions and in metastable-metastablecollisions. Considering the extremely low currents (our peakcurrents are in the nA regime) and the small duty cycle, anappreciable metastable density, which would be necessary forthese processes to take place, cannot build up in our system.Finally, resonance VUV photons are imprisoned in the gas, andtheir flux at the electrodes is also expected to spread in time,compared to the electron current peaks that we measure. Theeffect of all the above discussed particles is further reduced bythe small typical secondary electron yield values 0.01 � γ �0.1. Consequently, it is justified to disregard the contributionof these species to the measured signal, which is indeed avery important point of the model and keeps it reasonablysimple.
B. Simulation results
Figures 3(a)–3(e) show the comparison of the measured andcalculated FH current-voltage characteristics, at all differentpressure values used in the experiment. We note that thecomputationally intensive nature of the Monte Carlo approachdoes not represent any concern here. To compute the FHcurrent-voltage characteristics for all the pressure values 600runs (5 pressure values × 120 voltage values) have to be carriedout, amounting a total CPU time on the order of 100 days.Running the jobs on 30 CPUs of our computer cluster the timenecessary to carry out all computations was reduced to a fewdays.
In the simulation the anode current is measured in arbitraryunits, as the ratio of the number of electrons absorbed atthe anode and the number of photoelectrons leaving thecathode. As the current is also measured in arbitrary unitsin the experiment, a scaling factor F is used here to matchthe two current values; i.e., we compare the values of FIa,calc
to those of Ia,meas. Note that we use the same scaling factorfor all the conditions (pressure, cathode-grid voltage), andwe do not use any additional fitting parameters to matchthe experimental and simulation results. Thanks to the highnumber of simulated electrons (see Sec. III A) a good statisticsis obtained in the calculations. Repetitive calculations resultedin FH characteristics that differ less than 2% from each otherat any pressure and voltage values.
A very good general agreement is obtained between thetwo sets of curves, which verifies our model and justifiesits assumptions. Furthermore, it is this agreement that givesconfidence in the additional simulation results for whichno direct comparison with experimental data is possible. Inthe following we will present such results characterizing theelectron kinetics in the FH cell.
First, we analyze the fluxes of electrons to the different elec-trodes, as a function of discharge conditions. Besides reachingthe anode and creating the current that we can measure, the tra-jectories of the photoelectrons may as well end at the cathode,
056409-5

PETER MAGYAR, IHOR KOROLOV, AND ZOLTAN DONKO PHYSICAL REVIEW E 85, 056409 (2012)
at the grid, and at the outer confining cylinder. Figure 4shows these different current components, normalized by theemitted photoelectron current at the cathode. (In the absenceof ionization the sum of these current components is one.)
The behavior of the electron flux at the anode has alreadybeen discussed. Our analysis shows that a significant fractionof the primary electrons is backscattered to the cathode andis absorbed there. This effect is most important at low E/n,as discussed in Ref. [56]. We find that at the highest pressureof 4 mbar only ≈35% of the photoelectrons leave the vicinityof the cathode at Vcg → 0. This portion rapidly grows withincreasing Vcg and with decreasing pressure. At the lowestpressure and highest Vcg the fraction of “escaping” electronsreaches nearly 100%.
The electron current absorbed at the grid varies with Vcg
in antiphase compared to the anode current. The additional
FIG. 3. (Color online) Comparison of the measured (solid lines)and calculated (dashed lines) FH current-voltage characteristics atdifferent pressures.
current component of electrons, absorbed at the confiningcylinder, exhibits the same behavior. The fact that the fluxesat the confining cylinder and at the grid are comparable inmagnitude for a wide range of conditions, points out theimportance of taking into account the finite radial extent ofthe FH cell in the simulation.
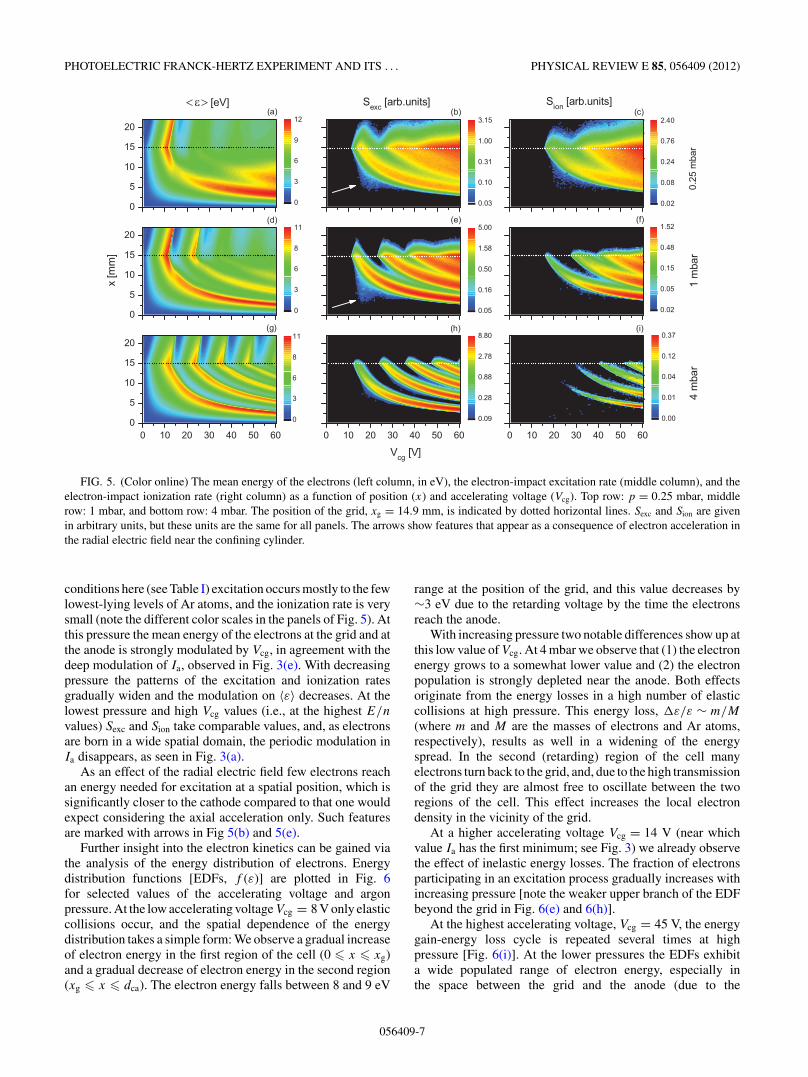
Figure 5 shows the dependence of the mean energy of theelectrons (left column), the electron-impact excitation rate Sexc
(middle column) and the electron-impact ionization rate Sion
(right column) on the spatial position (x) and acceleratingvoltage (Vcg). The different rows correspond to differentpressures, ranging from p = 0.25 to 4 mbar.
These distributions (as well as those presented later inFig. 6) represent radially averaged quantities. We note here,that, besides the axial electric field, which has a dominanteffect on the motion of most of the electrons, the radial electricfield near the cylindrical confining wall may accelerate anumber of electrons as well. Some of the features seen inFigs. 5 and 6 can only be understood by considering thiseffect.
The most regular patterns in all distributions are observedat the highest pressure, 4 mbar. Under the relatively low E/n
FIG. 4. (Color online) Normalized currents of electrons to thedifferent electrode surfaces, as a function of Vcg, at the pressuresindicated. Only the current flowing to the anode is measuredexperimentally.
056409-6
PHOTOELECTRIC FRANCK-HERTZ EXPERIMENT AND ITS . . . PHYSICAL REVIEW E 85, 056409 (2012)
FIG. 5. (Color online) The mean energy of the electrons (left column, in eV), the electron-impact excitation rate (middle column), and theelectron-impact ionization rate (right column) as a function of position (x) and accelerating voltage (Vcg). Top row: p = 0.25 mbar, middlerow: 1 mbar, and bottom row: 4 mbar. The position of the grid, xg = 14.9 mm, is indicated by dotted horizontal lines. Sexc and Sion are givenin arbitrary units, but these units are the same for all panels. The arrows show features that appear as a consequence of electron acceleration inthe radial electric field near the confining cylinder.
conditions here (see Table I) excitation occurs mostly to the fewlowest-lying levels of Ar atoms, and the ionization rate is verysmall (note the different color scales in the panels of Fig. 5). Atthis pressure the mean energy of the electrons at the grid and atthe anode is strongly modulated by Vcg, in agreement with thedeep modulation of Ia, observed in Fig. 3(e). With decreasingpressure the patterns of the excitation and ionization ratesgradually widen and the modulation on 〈ε〉 decreases. At thelowest pressure and high Vcg values (i.e., at the highest E/n
values) Sexc and Sion take comparable values, and, as electronsare born in a wide spatial domain, the periodic modulation inIa disappears, as seen in Fig. 3(a).
As an effect of the radial electric field few electrons reachan energy needed for excitation at a spatial position, which issignificantly closer to the cathode compared to that one wouldexpect considering the axial acceleration only. Such featuresare marked with arrows in Fig 5(b) and 5(e).
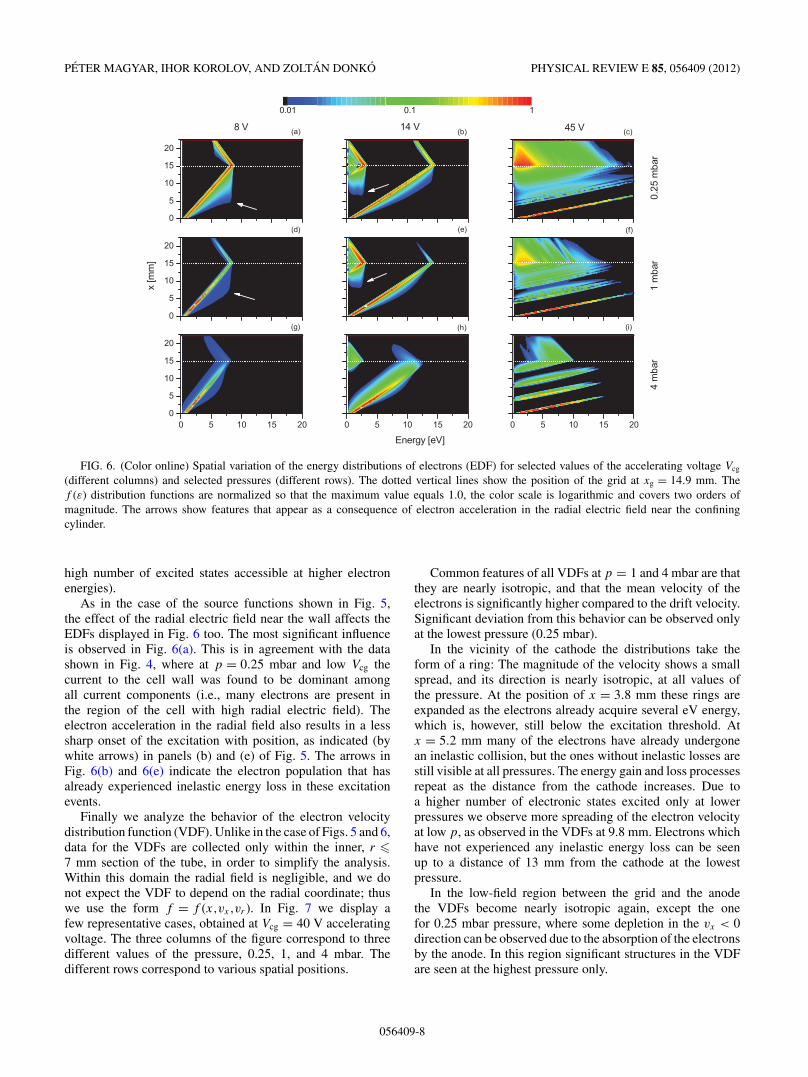
Further insight into the electron kinetics can be gained viathe analysis of the energy distribution of electrons. Energydistribution functions [EDFs, f (ε)] are plotted in Fig. 6for selected values of the accelerating voltage and argonpressure. At the low accelerating voltage Vcg = 8 V only elasticcollisions occur, and the spatial dependence of the energydistribution takes a simple form: We observe a gradual increaseof electron energy in the first region of the cell (0 � x � xg)and a gradual decrease of electron energy in the second region(xg � x � dca). The electron energy falls between 8 and 9 eV
range at the position of the grid, and this value decreases by∼3 eV due to the retarding voltage by the time the electronsreach the anode.
With increasing pressure two notable differences show up atthis low value of Vcg. At 4 mbar we observe that (1) the electronenergy grows to a somewhat lower value and (2) the electronpopulation is strongly depleted near the anode. Both effectsoriginate from the energy losses in a high number of elasticcollisions at high pressure. This energy loss, �ε/ε ∼ m/M
(where m and M are the masses of electrons and Ar atoms,respectively), results as well in a widening of the energyspread. In the second (retarding) region of the cell manyelectrons turn back to the grid, and, due to the high transmissionof the grid they are almost free to oscillate between the tworegions of the cell. This effect increases the local electrondensity in the vicinity of the grid.
At a higher accelerating voltage Vcg = 14 V (near whichvalue Ia has the first minimum; see Fig. 3) we already observethe effect of inelastic energy losses. The fraction of electronsparticipating in an excitation process gradually increases withincreasing pressure [note the weaker upper branch of the EDFbeyond the grid in Fig. 6(e) and 6(h)].
At the highest accelerating voltage, Vcg = 45 V, the energygain-energy loss cycle is repeated several times at highpressure [Fig. 6(i)]. At the lower pressures the EDFs exhibita wide populated range of electron energy, especially inthe space between the grid and the anode (due to the
056409-7
PETER MAGYAR, IHOR KOROLOV, AND ZOLTAN DONKO PHYSICAL REVIEW E 85, 056409 (2012)
FIG. 6. (Color online) Spatial variation of the energy distributions of electrons (EDF) for selected values of the accelerating voltage Vcg
(different columns) and selected pressures (different rows). The dotted vertical lines show the position of the grid at xg = 14.9 mm. Thef (ε) distribution functions are normalized so that the maximum value equals 1.0, the color scale is logarithmic and covers two orders ofmagnitude. The arrows show features that appear as a consequence of electron acceleration in the radial electric field near the confiningcylinder.
high number of excited states accessible at higher electronenergies).
As in the case of the source functions shown in Fig. 5,the effect of the radial electric field near the wall affects theEDFs displayed in Fig. 6 too. The most significant influenceis observed in Fig. 6(a). This is in agreement with the datashown in Fig. 4, where at p = 0.25 mbar and low Vcg thecurrent to the cell wall was found to be dominant amongall current components (i.e., many electrons are present inthe region of the cell with high radial electric field). Theelectron acceleration in the radial field also results in a lesssharp onset of the excitation with position, as indicated (bywhite arrows) in panels (b) and (e) of Fig. 5. The arrows inFig. 6(b) and 6(e) indicate the electron population that hasalready experienced inelastic energy loss in these excitationevents.
Finally we analyze the behavior of the electron velocitydistribution function (VDF). Unlike in the case of Figs. 5 and 6,data for the VDFs are collected only within the inner, r �7 mm section of the tube, in order to simplify the analysis.Within this domain the radial field is negligible, and we donot expect the VDF to depend on the radial coordinate; thuswe use the form f = f (x,vx,vr ). In Fig. 7 we display afew representative cases, obtained at Vcg = 40 V acceleratingvoltage. The three columns of the figure correspond to threedifferent values of the pressure, 0.25, 1, and 4 mbar. Thedifferent rows correspond to various spatial positions.
Common features of all VDFs at p = 1 and 4 mbar are thatthey are nearly isotropic, and that the mean velocity of theelectrons is significantly higher compared to the drift velocity.Significant deviation from this behavior can be observed onlyat the lowest pressure (0.25 mbar).
In the vicinity of the cathode the distributions take theform of a ring: The magnitude of the velocity shows a smallspread, and its direction is nearly isotropic, at all values ofthe pressure. At the position of x = 3.8 mm these rings areexpanded as the electrons already acquire several eV energy,which is, however, still below the excitation threshold. Atx = 5.2 mm many of the electrons have already undergonean inelastic collision, but the ones without inelastic losses arestill visible at all pressures. The energy gain and loss processesrepeat as the distance from the cathode increases. Due toa higher number of electronic states excited only at lowerpressures we observe more spreading of the electron velocityat low p, as observed in the VDFs at 9.8 mm. Electrons whichhave not experienced any inelastic energy loss can be seenup to a distance of 13 mm from the cathode at the lowestpressure.
In the low-field region between the grid and the anodethe VDFs become nearly isotropic again, except the onefor 0.25 mbar pressure, where some depletion in the vx < 0direction can be observed due to the absorption of the electronsby the anode. In this region significant structures in the VDFare seen at the highest pressure only.
056409-8

PHOTOELECTRIC FRANCK-HERTZ EXPERIMENT AND ITS . . . PHYSICAL REVIEW E 85, 056409 (2012)
FIG. 7. (Color online) Electron velocity distribution functions(VDF) calculated at Vcg = 40 V accelerating voltage. The data havebeen collected in the inner r � 7 mm part of the cell to discard effectsof the radial electric field near the cell wall. Each VDF is normalizedso that the maximum value equals 1.0; the color scale is logarithmicand covers three orders of magnitude.
IV. CONCLUSIONS
We have carried out a combined experimental and theoreti-cal (modeling) study on a Franck-Hertz cell with plane-parallelelectrode configuration. Our experimental cell operated onthe basis of photoemission; UV photons of a frequency-quadrupled Nd:YAG laser were used to create primary
electrons. By eliminating the need for a heated cathode wewere able to ensure a uniform gas density distribution inside theFH cell, which made modeling more straightforward. We arenot aware of any previous experiment based on photoelectronsand of any study that took into account the nonuniformgas density distribution in the models of “thermionic” FHcells.
In the experiment we have recorded the anode current-accelerating voltage characteristics of the cell in argon gas, atdifferent pressures between 0.25 and 4 mbar. This range ofpressure covered highly collisional conditions with significantelastic collisional energy losses (high pressures) as well asconditions when the ionization rate becomes comparable tothe excitation rate (low pressure and high Vcg).
Our modeling study has been based on Monte Carlosimulation, which provided an exact description of the electronkinetics under nonequilibrium (nonhydrodynamic) conditionsfor electron transport, typical for FH settings.
The experimental cell characteristics have been reproducedrather accurately by the modeling calculations. The cold-cathode operation achieved in the experiment allowed theassumption of a uniform gas density distribution in ourmodeling studies. The simulations made it possible as wellto obtain the spatial variation of the velocity and energydistributions of the electrons, their transport parameters, andthe rates of excitation and ionization processes.
The simulations took into account the finite radial size ofthe FH cell. Calculation of the currents flowing to the differentelectrodes showed the effect of the “back diffusion” of theelectrons to the cathode at low E/n, and a significant electronflux to the confining cylinder of the tube at low pressures,where collision-free paths are long. We have demonstrated theeffect of the finite radial size of the tube and the consequentradial electric field on the spatial distribution of the excitationand ionization rates, and on the energy distribution of theelectrons (Figs. 5 and 6, respectively).
For simplicity, the electron velocity distribution function(VDF) has been analyzed within the inner (near-axis) partthe tube, to disregard its dependence on the radial coordinate.The VDFs have been found to be nearly isotropic at higherpressures; significant deviation from this behavior was seenonly at 0.25 mbar. We note that the mean velocity of theelectrons was found to be significantly higher compared tothe drift velocity. It also follows from the nearly isotropiccharacteristic of the VDF for most of the conditions, thatelectrons cross the mesh plane several times until eventuallygetting absorbed there, or at the anode. (This is the reason whya high transmission grid has to be used in the experiment.)
The effects of elastic collisions, excitations, and ionizationprocesses were identified on plots of rate coefficients, electronenergy, and velocity distribution functions, under varyingconditions at different pressures and different acceleratingvoltages, uncovering the complex electron kinetics in theFranck-Hertz experiment.
ACKNOWLEDGMENTS
This work has been supported by the Grant No. OTKAK-77653. We thank L. C. Pitchford, F. Sigeneger, P. Hartmann,and K. Rozsa for useful discussions, as well as J. Thoman
056409-9

PETER MAGYAR, IHOR KOROLOV, AND ZOLTAN DONKO PHYSICAL REVIEW E 85, 056409 (2012)
Forgacs, J. Toth, and Gy. Csaszar for their contributions to theconstruction of the experimental apparatus, and L. Varga for
supplying the Mg disk used as the cathode in the experimentalcell.
[1] J. Franck and G. Hertz, Verh. Deut. Phys. Ges. 16, 457 (1914).[2] [http://www.nobelprize.org/nobel_prize/physics/laureates/1925/].[3] J. S. Huebner, Am. J. Phys. 44, 302 (1976).[4] W. Buhr, W. Klein, and S. Pressler, Am. J. Phys. 51, 810
(1983).[5] G. F. Hanne, Am. J. Phys. 56, 696 (1988).[6] D. R. A. McMahon, Am. J. Phys. 51, 1086 (1983).[7] G. Rapior, K. Sengstock, and V. Baeva, Am. J. Phys. 74, 423
(2006).[8] A. D. Martin and P. J. Quinn, Am. J. Phys. 52, 1114 (1984).[9] F. H. Liu, Am. J. Phys. 55, 366 (1987).
[10] P. Nicoletopoulos, Eur. J. Phys. 23, 533 (2002).[11] P. Nicoletopoulos, Phys. Rev. E 78, 026403 (2008).[12] Z. L. Petrovic, Z. M. Raspopovic, S. Dujko, and T. Makabe,
Appl. Surf. Sci. 192, 1 (2002).[13] R. Winkler, S. Arndt, D. Loffhagen, and D. Uhrlandt, Contrib.
Plasma Phys. 44, 437 (2004).[14] L. C. Pitchford, J.-P. Boeuf, P. Segur, and E. Marode, in Non-
equilibrium Effects in Ion and Electron Transport, edited byJ. W. Gallagher (Plenum, New York, 1990).
[15] J.-P. Boeuf and L. C. Pitchford, IEEE Trans. Plasma Sci. 19, 286(1991).
[16] G. R. G. Raju and J. Liu, IEEE Trans. Dielectr. Electr. Insul. 2,1016 (1995).
[17] R. E. Robson, R. D. White and Z. Lj. Petrovic, Rev. Mod. Phys.77, 1303 (2005).
[18] R. D. White, S. Dujko, R. E. Robson, Z. Lj. Petrovic, and R. P.McEachran, Plasma Sources Sci. Technol. 19, 034001 (2010).
[19] L. D. Tsendin, Plasma Sources Sci. Technol. 4, 200 (1995).[20] L. D. Tsendin, Phys. Usp. 53, 133 (2010).[21] V. I. Kolobov and V. A. Godyak, IEEE Trans. Plasma Sci. 23,
503 (1995).[22] V. A. Godyak, IEEE Trans. Plasma Sci. 34, 755 (2006).[23] D. Loffhagen, R. Winkler, and Z. Donko, Eur. Phys. J. Appl.
Phys. 18, 189 (2002).[24] V. I. Kolobov, Comp. Mat. Science 28, 302 (2003).[25] V. I. Kolobov and R. R. Arslanbekov, IEEE Trans. Plasma. Sci.
34, 895 (2006).[26] S. Dujko, R. D. White, and Z. Lj. Petrovic, J. Phys. D 41, 245205
(2008).[27] R. D. White, R. E. Robson, S. Dujko, P. Nicoletopoulos, and
B. Li, J. Phys. D 42, 194001 (2009).[28] P. Nicoletopoulos and R. E. Robson, Phys. Rev. Lett. 100,
124502 (2008).[29] B. Li, R. E. Robson, and R. D. White, Phys. Rev. E 74, 026405
(2006).
[30] V. I. Kolobov, J. Phys. D 39, 487R (2006), and referencestherein.
[31] K. Maeda, T. Makabe, N. Nakano, S. Bzenic, and Z. Lj. Petrovic,Phys. Rev. E 55, 5901 (1997).
[32] R. E. Robson, R. Winkler, and F. Sigeneger, Phys. Rev. E 65,056410 (2002).
[33] G. J. M. Hagelaar and L. C. Pitchford, Plasma Sources Sci.Technol. 14, 722 (2005).
[34] S. Dujko, R. D. White, Z. Lj. Petrovic, and R. E. Robson, Phys.Rev. E 81, 046403 (2010).
[35] S. Dujko, U. Ebert, R. D. White, and Z. Lj. Petrovic, Jpn. J.Appl. Phys. 50, 08JC01 (2011).
[36] J.-P. Boeuf and E. Marode, J. Phys. D: Appl. Phys. 15, 2169(1982).
[37] N. Sato and H. Tagashira, J. Phys. D: Appl. Phys. 18, 2451(1985).
[38] G. L. Braglia, Contrib. Plasma Phys. 25, 567 (1985).[39] A. Alkaa, P. Segur, and A. Zahraoui, and M. Kadri-H, Phys. Rev.
E 50, 3006 (1994).[40] M. Yousfi, A. Hennad, and A. Alkaa, Phys. Rev. E 49, 3264
(1994).[41] N. A. Dyatko and A. P. Napartovich, J. Phys. D 32, 3169 (1999).[42] A. Settaouti and L. Settaouti, Int. J. Mod. Phys. 20, 1233 (2006).[43] S. Longo, Plasma Sources Sci. Technol. 15, S181 (2006).[44] F. Sigeneger and R. Winkler, Eur. Phys. J. Appl. Phys. 19, 211
(2002).[45] F. Sigeneger, R. Winkler, and R. E. Robson, Contrib. Plasma
Phys. 43, 178 (2003).[46] R. E. Robson, B. Li, and R. D. White, J. Phys. B 33, 507 (2000).[47] X. J. Wang, T. S. Rao, K. Batchelor, I. Ben-Zvi, and J. Fischer,
Nucl. Instrum. Methods Phys. Res., Sect. A 356, 159 (1995).[48] E. Chevallay, J. Durand, S. Hutchins, G. Suberlucq, and
M. Wurgel, Nucl. Instrum. Methods Phys. Res., Sect. A P340,146 (1994).
[49] C. Bohm and J. Perrin, Rev. Sci. Instrum. 64, 31 (1993).[50] A. Derzsi, P. Hartmann, I. Korolov, G. Bano, J. Karacsony, and
Z. Donko, J. Phys. D 42, 225204 (2009).[51] Z. Donko, Plasma Sources Sci. Technol. 20, 024001 (2011).[52] M. Hayashi, Nagoya Institute of Technology Report IPPJ-AM-
19 (unpublished).[53] K. Nanbu, IEEE Trans. Plasma Sci. 28, 971 (2000).[54] E. G. McRae and C. W. Caldwell, Surf. Sci. 57, 63 (1976).[55] H. J. Herlt, R. Feder, G. Meister, and E. G. Bauer, Solid State
Commun. 38, 973 (1981).[56] A. V. Phelps and Z. Lj. Petrovic, Plasma Sources Sci. Technol.
8, R21 (1999).
056409-10