photoemission study of the spinel-type (ni,zn,fe,ti) o...
TRANSCRIPT
Photoemission study
of the spinel-type
(Ni,Zn,Fe,Ti)3O4 thin films
exhibiting
photo-induced magnetism
Master Thesis
Yasuhiro Ooki
Department of Complexity Science
and Engineering,
University of Tokyo
February, 2007

Contents
1 Background 3
2 Principles of photoemission spectroscopy and X-ray absorption
spectroscopy 9
2.1 Photoemission spectroscopy . . . . . . . . . . . . . . . . . . . . . 9
2.2 Resonant photoemission spectroscopy . . . . . . . . . . . . . . . . 11
2.3 X-ray absorption spectroscopy . . . . . . . . . . . . . . . . . . . . 13
2.4 Cluster-model analyses of PES spectra . . . . . . . . . . . . . . . 14
3 Physical properties of (Ni,Zn,Fe,Ti)3O4 thin films 17
4 Photoemission and X-ray absorption studies of valence states
in (Ni,Zn,Fe,Ti)3O4 thin films and the origin of photoinduced
magnetization 21
4.1 Introduction . . . . . . . . . . . . . . . . . . . . . . . . . . . . . . 21
4.2 Experimental . . . . . . . . . . . . . . . . . . . . . . . . . . . . . 22
4.3 Result and Discussion . . . . . . . . . . . . . . . . . . . . . . . . 23
4.4 Conclusion . . . . . . . . . . . . . . . . . . . . . . . . . . . . . . . 27
5 Photoemission study of (Ni,Zn,Fe,Ti)3O4 thin film with light ir-
radiation 29
5.1 Introduction . . . . . . . . . . . . . . . . . . . . . . . . . . . . . . 29
5.2 Experimental . . . . . . . . . . . . . . . . . . . . . . . . . . . . . 30
5.3 Result and discussion . . . . . . . . . . . . . . . . . . . . . . . . . 31
5.4 Conclusion . . . . . . . . . . . . . . . . . . . . . . . . . . . . . . . 33
6 Summary 35

2 CONTENTS
Acknowledgement 36
Reference 39
Chapter 1
Background
According to the crystal the structure spinel-type ferrites are natural superlat-
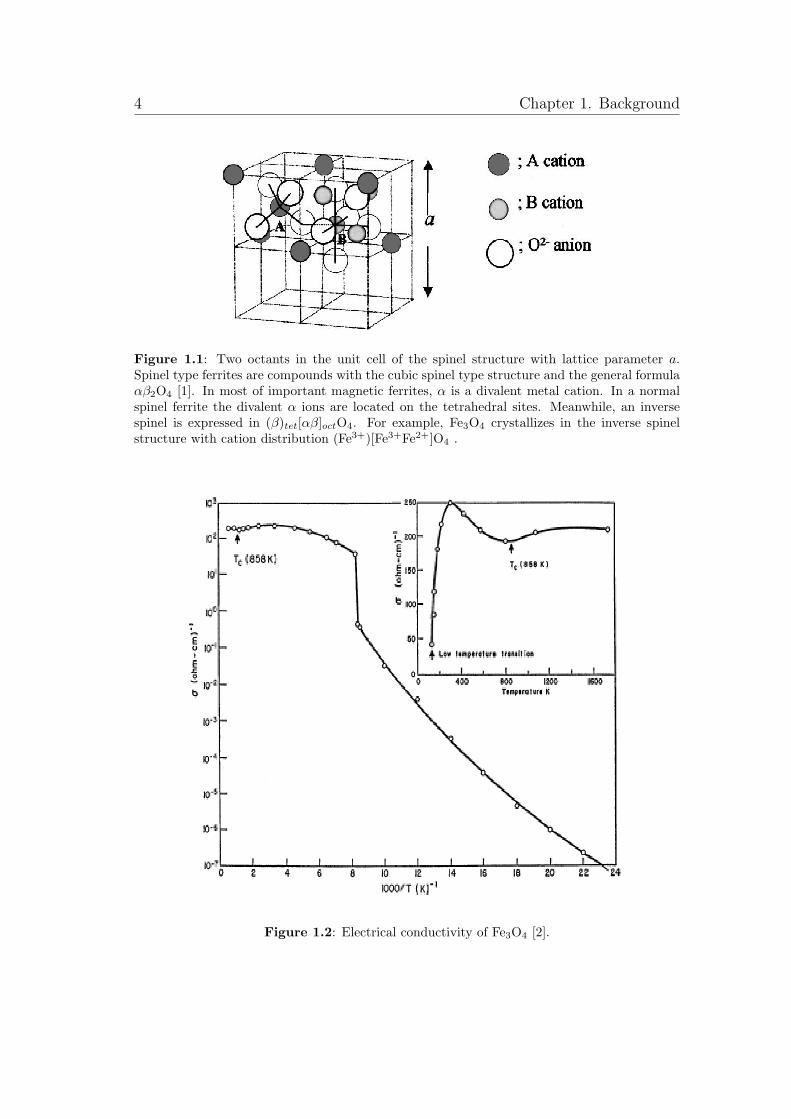
tices. The general formula of the spinel structure is αβ2O4 (see Fig. 1.1). It has
the tetrahedral (A) sites and the octahedral (B) sites in the crystal structure,
and shows various magnetic properties depending on the composition and cation
distribution. In addition to the normal spinel ferrite of αβ2O4, the divalent metal
cation ions are located on the tetrahedral sites: (α2+)tet[β3+β3+]octO4. Fe3O4,
or magnetite, crystallizes in the inverse spinel structure, with cation distribution
(β3+)tet[α2+β3+]octO4. Various cations can be placed at the A site and the B site
to tune its magnetic properties. Depending on the A site and the B site cations,
it can exhibit ferrimagnetic, antiferromagnetic, spin glass, and paramagnetic be-
haviors. Due to their remarkable behavior of magnetic and electric properties
they are the subjects of investigations for application purposes, too. For exam-
ple, Fe3O4 is the earliest discovered magnet and crystallizes in the inverse spinel
structure. It undergoes a first-order phase transition, the so-called Verwey tran-
sition at Tv = 122 K, in which electrical conductivity increases by two orders of
magnitude on heating through Tv [2] (see Fig. 1.2). Though extensive studies of
magnetite with considerable effort have been carried out over the past 50 years,
the Verwey transition remains a problem to be solved.
Because of the interesting electronic, magnetic, and transport properties as
well as the potential industrial applications in magnetic multilayer devices, mag-
netite has attracted renewed attention in recent years. For example, in the spinel
type Zn1−xNixFe2O4, colossal magnetoresistance (CMR) was found [3]. Magne-
toresistance (MR) refers to a change of electrical resistance in the presence of
4 Chapter 1. Background
Figure 1.1: Two octants in the unit cell of the spinel structure with lattice parameter a.Spinel type ferrites are compounds with the cubic spinel type structure and the general formulaαβ2O4 [1]. In most of important magnetic ferrites, α is a divalent metal cation. In a normalspinel ferrite the divalent α ions are located on the tetrahedral sites. Meanwhile, an inversespinel is expressed in (β)tet[αβ]octO4. For example, Fe3O4 crystallizes in the inverse spinelstructure with cation distribution (Fe3+)[Fe3+Fe2+]O4 .
Figure 1.2: Electrical conductivity of Fe3O4 [2].
BACKGROUND 5
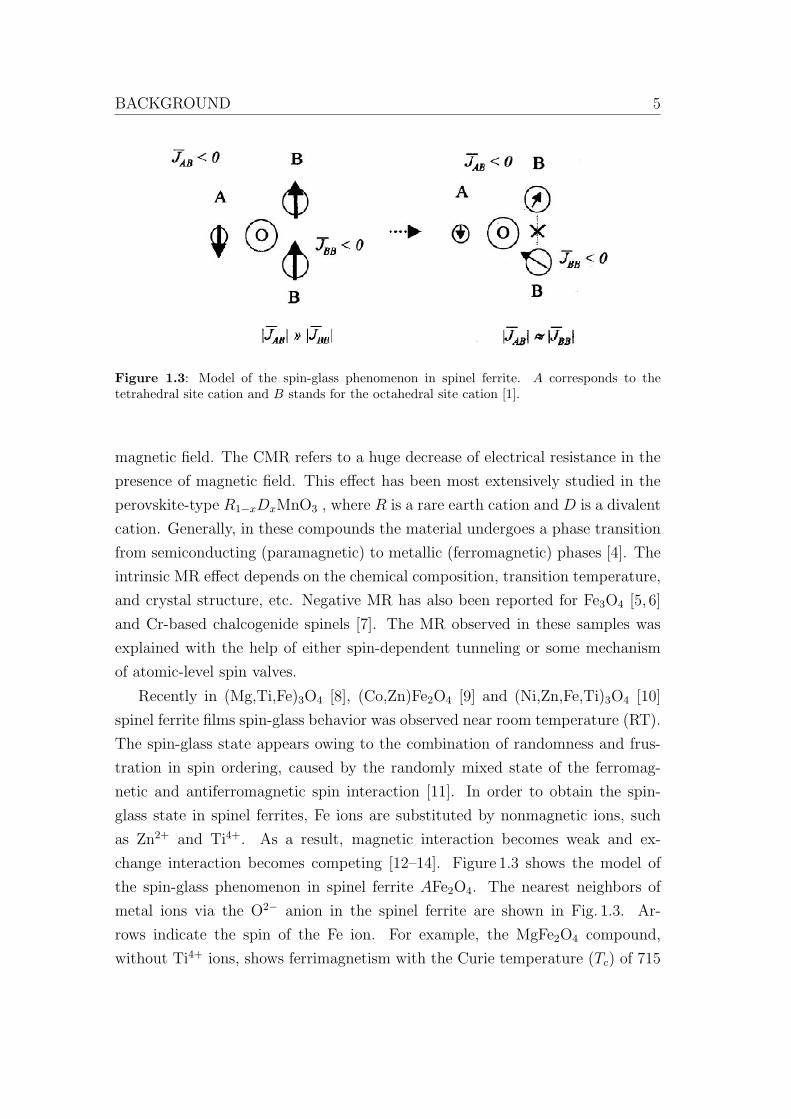
Figure 1.3: Model of the spin-glass phenomenon in spinel ferrite. A corresponds to thetetrahedral site cation and B stands for the octahedral site cation [1].
magnetic field. The CMR refers to a huge decrease of electrical resistance in the
presence of magnetic field. This effect has been most extensively studied in the
perovskite-type R1−xDxMnO3 , where R is a rare earth cation and D is a divalent
cation. Generally, in these compounds the material undergoes a phase transition
from semiconducting (paramagnetic) to metallic (ferromagnetic) phases [4]. The
intrinsic MR effect depends on the chemical composition, transition temperature,
and crystal structure, etc. Negative MR has also been reported for Fe3O4 [5, 6]
and Cr-based chalcogenide spinels [7]. The MR observed in these samples was
explained with the help of either spin-dependent tunneling or some mechanism
of atomic-level spin valves.
Recently in (Mg,Ti,Fe)3O4 [8], (Co,Zn)Fe2O4 [9] and (Ni,Zn,Fe,Ti)3O4 [10]
spinel ferrite films spin-glass behavior was observed near room temperature (RT).
The spin-glass state appears owing to the combination of randomness and frus-
tration in spin ordering, caused by the randomly mixed state of the ferromag-
netic and antiferromagnetic spin interaction [11]. In order to obtain the spin-
glass state in spinel ferrites, Fe ions are substituted by nonmagnetic ions, such
as Zn2+ and Ti4+. As a result, magnetic interaction becomes weak and ex-
change interaction becomes competing [12–14]. Figure 1.3 shows the model of
the spin-glass phenomenon in spinel ferrite AFe2O4. The nearest neighbors of
metal ions via the O2− anion in the spinel ferrite are shown in Fig. 1.3. Ar-
rows indicate the spin of the Fe ion. For example, the MgFe2O4 compound,
without Ti4+ ions, shows ferrimagnetism with the Curie temperature (Tc) of 715

6 Chapter 1. Background
Figure 1.4: Illustration of the photo-induced magnetization (PIM). Arrows correspond to thespin. Left: freezing of spins without external field. Middle: melt of spins by external field(photons hν, magnetic field H). Right: rearrangement of spins by magnetic field.
K. Cations of Mg2+ and Fe3+ are distributed on the A and B sites and the
formula is given as (Mg0.33Fe0.67)[Fe1.33Mg0.67]O4 [15]. In this material, all the
spin interactions are well defined as nearest-neighbor antiferomagnetic ones, with
|JAB| À |JBB| > |JAA| (J in Fig. 1.3 shows the average value of the spin interac-
tions). Thus, JAB renders the undiluted spinel ferrimagnetism, with all the A-site
moments oriented antiparallel to all B-site moments, with the BB and AA bonds
remaining unsatisfied (see the left side of Fig. 1.3). On dilution of Fe3+ ions at the
B site by Ti4+ ion substitution, magnetic order is broken and the frustration of
certain moments occurs for BB and AA bonds (see the right side of Fig. 1.3) [1].
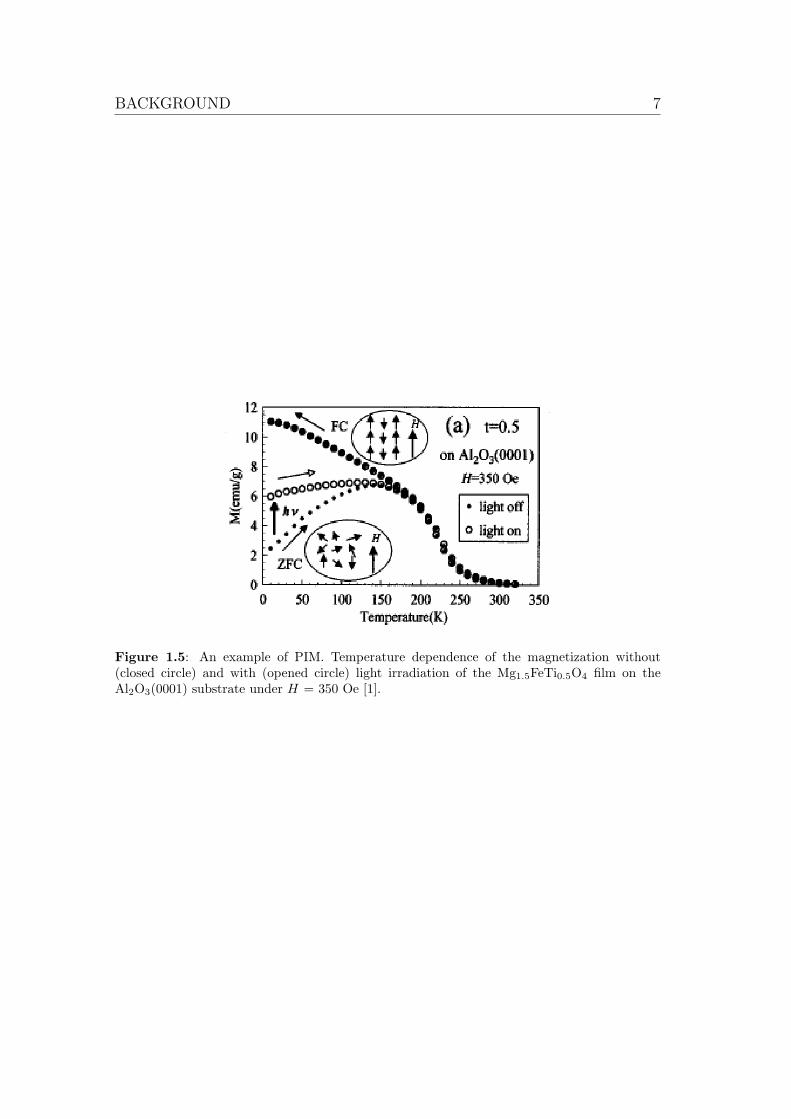
Moreover, (Mg,Ti,Fe)3O4, (Co,Zn)Fe2O4 and (Ni,Zn,Fe,Ti)3O4 films exhibited a
photoinduced magnetization (PIM) below the spin-freezing temperature Tf (see
Fig. 1.5). The PIM has been reported in diluted magnetic semiconductors [16],
spin-crossover complexes [17], and Prussian blue analogs [18]. These materials
exhibited the PIM only at lower temperatures below 50 K and required a high
external magnetic field of greater than 1 T. Therefore, these materials are diffi-
cult for practical application to use. However, in (Ni,Zn,Fe,Ti)3O4 films, a PIM
behavior was observed near RT under H = 100 Oe.
BACKGROUND 7
Figure 1.5: An example of PIM. Temperature dependence of the magnetization without(closed circle) and with (opened circle) light irradiation of the Mg1.5FeTi0.5O4 film on theAl2O3(0001) substrate under H = 350 Oe [1].

Chapter 2
Principles of photoemission
spectroscopy and X-ray
absorption spectroscopy
In this chapter, we describe the principles of photoemission spectroscopy, resonant
photoemission spectroscopy and X-ray absorption spectroscopy.
2.1 Photoemission spectroscopy
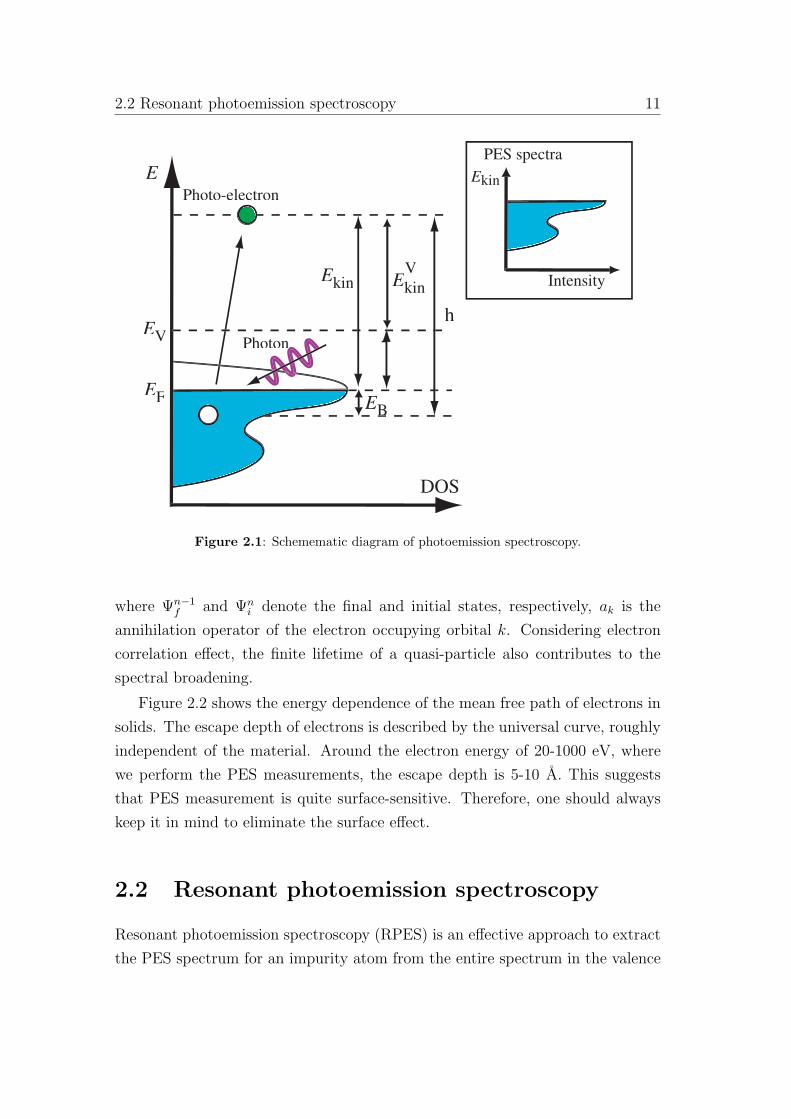
Photoemission spectroscopy (PES) is a useful technique to investigate the occu-
pied electronic structure in solids. Photoelectric effect, where an illuminated solid
emits electrons (photo-electrons), is utilized in PES. PES spectra are provided by
the measuring kinetic energy distribution of photo-electrons which escape from
the solid through the surface and overcome the vacuum level EV . Assuming that
when light with photon energy hν is illuminated on a solid, an electron with
binding energy EB, which is referenced to the Fermi level EF, is emited with
kinetic energy EVkin, which is referenced to EV . One can describe the relationship
between EB and EVkin using the energy conservation law:
EVkin = hν − φ − EB, (2.1)
where φ = EV − EF is the work function of the solid. The kinetic energy Ekin
reference to EF rather than EVkin is practically observed in PES measurements.
10 Chapter 2. Principles of photoemission spectroscopy and X-ray ...
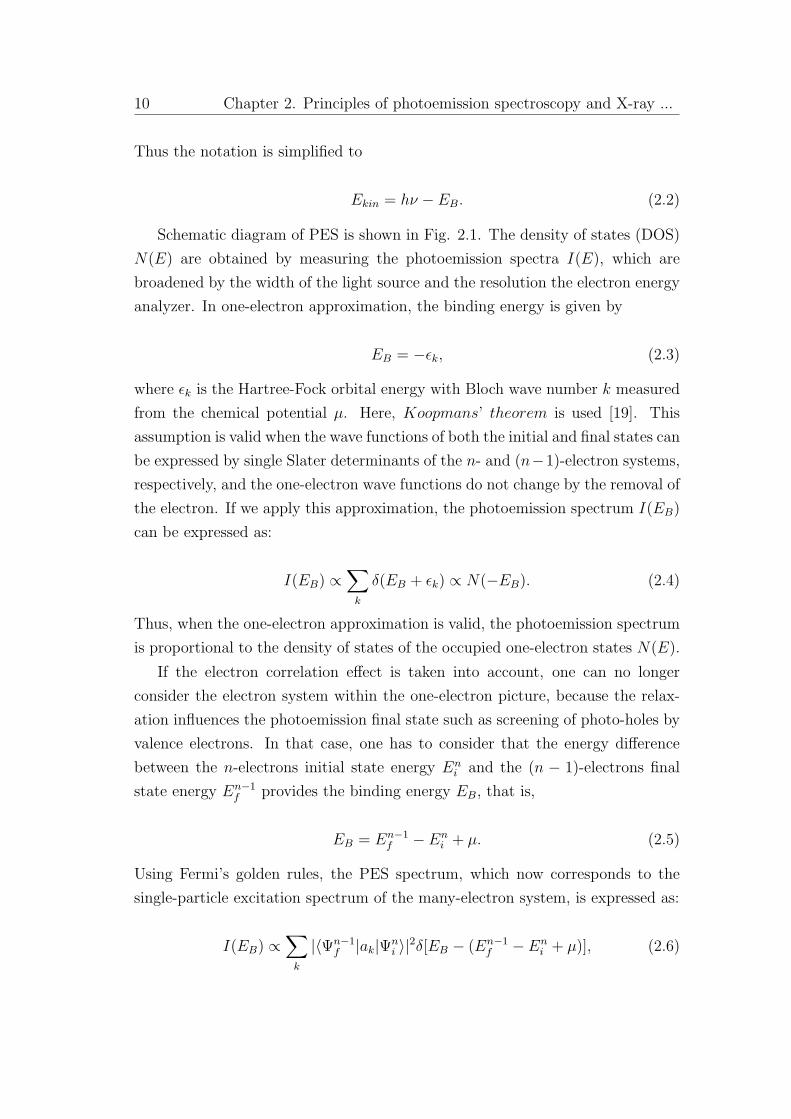
Thus the notation is simplified to
Ekin = hν − EB. (2.2)
Schematic diagram of PES is shown in Fig. 2.1. The density of states (DOS)
N(E) are obtained by measuring the photoemission spectra I(E), which are
broadened by the width of the light source and the resolution the electron energy
analyzer. In one-electron approximation, the binding energy is given by
EB = −εk, (2.3)
where εk is the Hartree-Fock orbital energy with Bloch wave number k measured
from the chemical potential µ. Here, Koopmans’ theorem is used [19]. This
assumption is valid when the wave functions of both the initial and final states can
be expressed by single Slater determinants of the n- and (n−1)-electron systems,
respectively, and the one-electron wave functions do not change by the removal of
the electron. If we apply this approximation, the photoemission spectrum I(EB)
can be expressed as:
I(EB) ∝∑
k
δ(EB + εk) ∝ N(−EB). (2.4)
Thus, when the one-electron approximation is valid, the photoemission spectrum
is proportional to the density of states of the occupied one-electron states N(E).
If the electron correlation effect is taken into account, one can no longer
consider the electron system within the one-electron picture, because the relax-
ation influences the photoemission final state such as screening of photo-holes by
valence electrons. In that case, one has to consider that the energy difference
between the n-electrons initial state energy Eni and the (n − 1)-electrons final
state energy En−1f provides the binding energy EB, that is,
EB = En−1f − En
i + µ. (2.5)
Using Fermi’s golden rules, the PES spectrum, which now corresponds to the
single-particle excitation spectrum of the many-electron system, is expressed as:
I(EB) ∝∑
k
|〈Ψn−1f |ak|Ψn
i 〉|2δ[EB − (En−1f − En
i + µ)], (2.6)
2.2 Resonant photoemission spectroscopy 11
Intensity
PES spectra
EkinEEE
EFEE
DOS
EVEEh
EkinEE
Photon
EBBEE
Photo-electron
n
EkinEEV
Figure 2.1: Schemematic diagram of photoemission spectroscopy.
where Ψn−1f and Ψn
i denote the final and initial states, respectively, ak is the
annihilation operator of the electron occupying orbital k. Considering electron
correlation effect, the finite lifetime of a quasi-particle also contributes to the
spectral broadening.
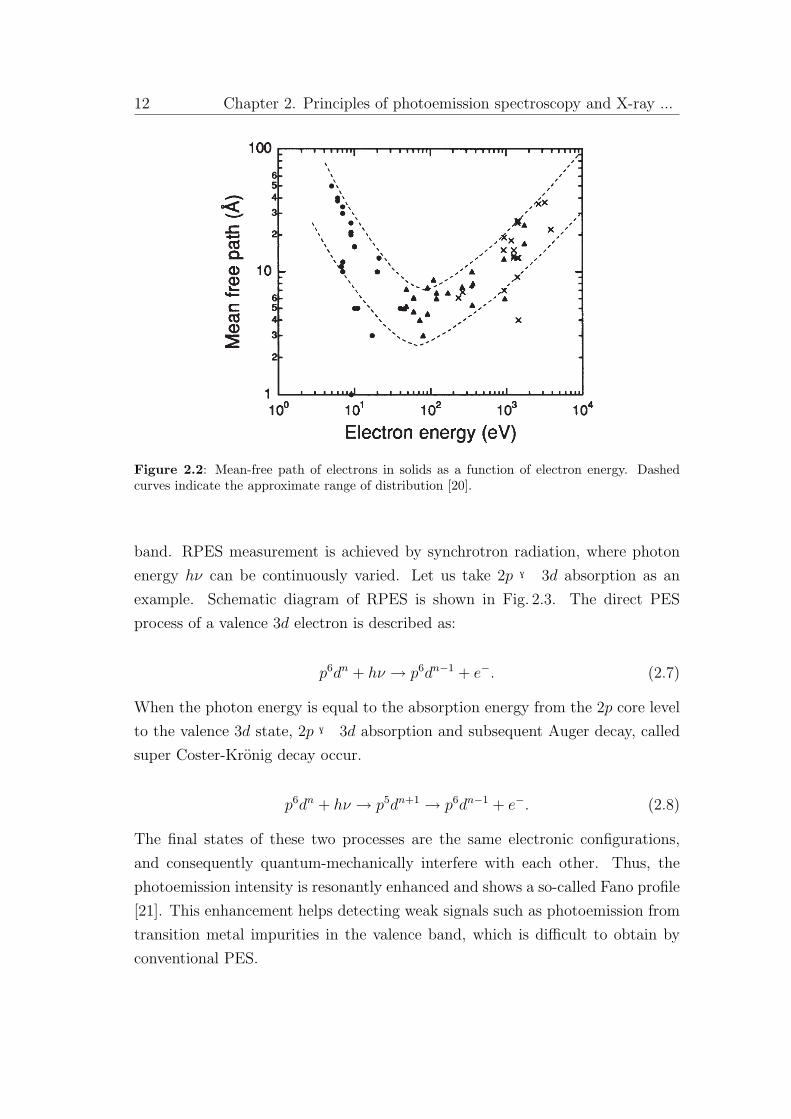
Figure 2.2 shows the energy dependence of the mean free path of electrons in
solids. The escape depth of electrons is described by the universal curve, roughly
independent of the material. Around the electron energy of 20-1000 eV, where
we perform the PES measurements, the escape depth is 5-10 A. This suggests
that PES measurement is quite surface-sensitive. Therefore, one should always
keep it in mind to eliminate the surface effect.
2.2 Resonant photoemission spectroscopy
Resonant photoemission spectroscopy (RPES) is an effective approach to extract
the PES spectrum for an impurity atom from the entire spectrum in the valence
12 Chapter 2. Principles of photoemission spectroscopy and X-ray ...
Figure 2.2: Mean-free path of electrons in solids as a function of electron energy. Dashedcurves indicate the approximate range of distribution [20].
band. RPES measurement is achieved by synchrotron radiation, where photon
energy hν can be continuously varied. Let us take 2p → 3d absorption as an
example. Schematic diagram of RPES is shown in Fig. 2.3. The direct PES
process of a valence 3d electron is described as:
p6dn + hν → p6dn−1 + e−. (2.7)
When the photon energy is equal to the absorption energy from the 2p core level
to the valence 3d state, 2p → 3d absorption and subsequent Auger decay, called
super Coster-Kronig decay occur.
p6dn + hν → p5dn+1 → p6dn−1 + e−. (2.8)
The final states of these two processes are the same electronic configurations,
and consequently quantum-mechanically interfere with each other. Thus, the
photoemission intensity is resonantly enhanced and shows a so-called Fano profile
[21]. This enhancement helps detecting weak signals such as photoemission from
transition metal impurities in the valence band, which is difficult to obtain by
conventional PES.

2.3 X-ray absorption spectroscopy 13
Figure 2.3: Schemematic diagram of resonant photoemission process.
2.3 X-ray absorption spectroscopy
X-ray absorption spectroscopy (XAS) is a powerful technique to investigate the
unoccupied electronic structure in solids. The photo-absorption intensity for the
excitation of a core-level electron into unoccupied states as a function of photon
energy hν is given by
Iµ(hν) ∝∑
f
|〈Ψf |Tµ|Ψi〉|2δ(Ef − Ei − hν), (2.9)
where T is the dipole transition operator, µ is the index of light polarization, and
Ei and Ef are the energies of the initial and final states of the many-electron
system, respectively. In the 3d transition-metal compounds, transition-metal 2p
(L2,3-edge) XAS spectra reflect the electronic structure of the 3d states such as
the spin state and the crystal-field splitting. In order to interpret experimental
spectra, various theoretical calculations have been applied as described below
(2.4).
The measurement modes for XAS can be classified broadly into the trans-
mission mode and the total electron-yield mode. In the transmission mode, the
intensity of the x-rays is measure before and after the sample and the ratio of

14 Chapter 2. Principles of photoemission spectroscopy and X-ray ...
the transmitted x-rays is counted. Transmission-mode experiments are standard
for hard x-rays, while for soft x-rays, they are difficult to perform because of the
strong interaction of soft x-rays with the sample and hence strong absorption.
In the present work, we have adopted the total electron-yield mode, because all
measurements have been performed in the region of soft x-rays.
2.4 Cluster-model analyses of PES spectra
In order to take into consideration of the strong hybridization and charge transfer
between the 3d and ligand obitals, one uses a cluster model based on a configration
interaction (CI) approach to calculate the PES spectra of transition-metal oxides.
Then, the ground state ψg is expanded as a linear combination of the ligand-to-3d
charge-transfered electronic configurations:
ψg = a0ψ(dn) + a1ψ(dn+1L) + a2ψ(dn+2L2) + ..., (2.10)
where L denotes a hole in a anion ligand orbital. In this picture, covalency is
regarded as the interaction between different electronic configurations which arise
from the ligand-to-3d charge transfer. This picture is called configration interac-
tion (CI). In the CI cluster-model analysis of PES spectra, the final state wave
function of with a hole in a core level ψc is also expanded by linear combinations
of the charge-transfered states as
ψc = b0ψ(cdn) + b1ψ(cdn+1L) + b2ψ(cdn+2L2) + ..., (2.11)
where c denotes a core hole. CI interaction influences the binding energy and the
line shape of photoemission spectra such as the formation of satellite structures
through Eq. (2.5) and (2.6).
We calculate the spectra for each site by exactly diagonalizing the single-ion
Hamiltonian under a crystal field, where multipole interactions between the 3d-3d
and 3d-ligand cores are described by Slater integrals, and spin-orbit interaction
is included. The nonmultiplet Hamiltonian describing the valence states and the
effective interaction between electrons are parametrized by the 3d-3d and 3d-core
Coulomb interactions (Udd and Udc , respectively) and the hybridization strength
between the 3d and ligand obitals.
2.4 Cluster-model analyses of PES spectra 15
In addition, the charge fluctuation between the ligand 2p and cation 3d is also
taken into account through the chargetransfer energy defined by
∆ ≡ E(dn+1L) − E(dn), (2.12)
where E(dn+1L) and E(dn) are the average energies of the dn+1L and 3dn multi-
plets, respectively.
The Hatree-Fock values are adopted for the coupling constants of the ligand-
core and 3d spin-orbit interactions and 80% of the values are used for the Slater
integrals, which describe the 3d-3d and 3d-2p multiplet interactions in the Haml-
tonian. The values of the charge-transfer energy ∆, onsite Coulomb energies Udd
and Udc, and the hopping integrals (Vt2g and Veg) between the 3d atomic orbitals
and the oxygen 2p molecular orbitals are included to reproduce the experimental
spectra. In addition, we also use the octahedral crystal field parameter 10Dq and
the hybridization strength 2Tpp between the O 2p orbitals as fixed parameters:
10Dq = εd(eg) − εd(t2g), (2.13)
2Tpp = εL(eg) − εL(t2g). (2.14)
To reduce the number of free parameters, the empirical relationship between
Slater-Koster hopping integrals (pdσ) is assumed.
(pdσ) ≈ − 4√3(pdπ). (2.15)
With this assumption, V (eg) = −2V (t2g) for the octahedral site and V (t2g) =√3V (eg) for the tetrahedral site hold. In addition, the Fe-O bond length R depen-
dence of the hopping integral (pdσ) ∝ 1/R3.5 is further adopted [22]. To emulate
the ferrimagnetic order, a small molecular field is applied to the 3d electron spin.

Chapter 3
Physical properties of
(Ni,Zn,Fe,Ti)3O4 thin films
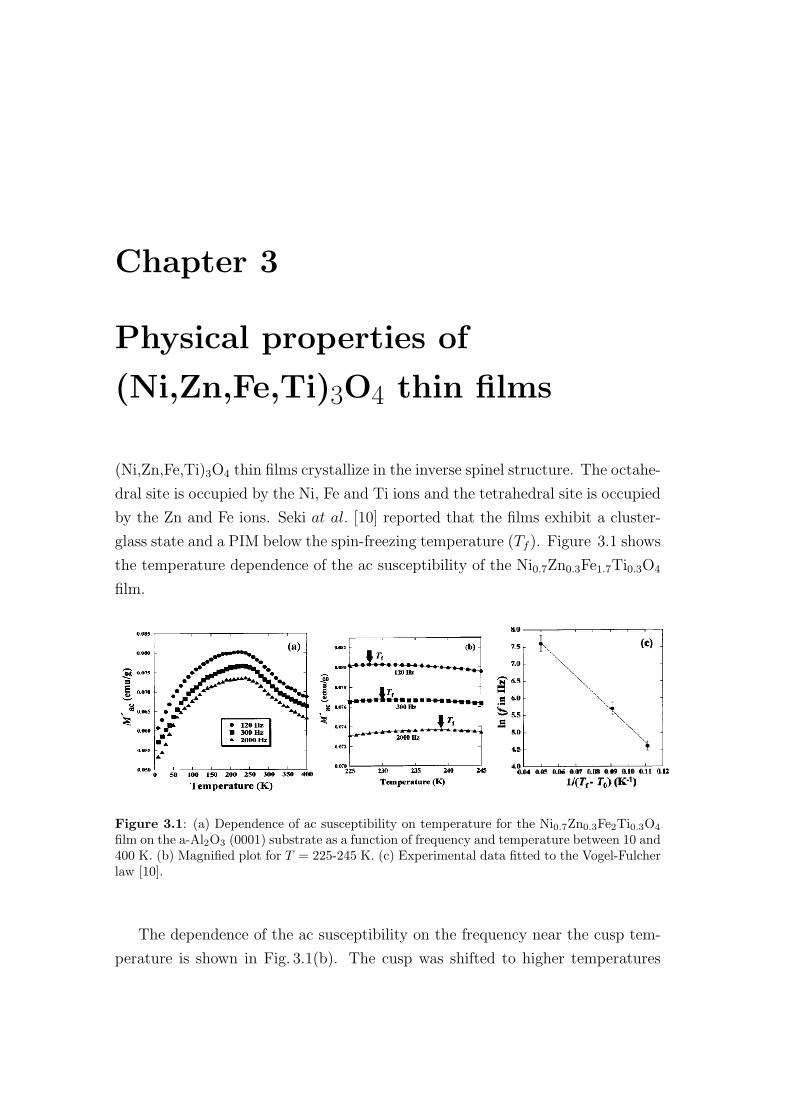
(Ni,Zn,Fe,Ti)3O4 thin films crystallize in the inverse spinel structure. The octahe-
dral site is occupied by the Ni, Fe and Ti ions and the tetrahedral site is occupied
by the Zn and Fe ions. Seki at al. [10] reported that the films exhibit a cluster-
glass state and a PIM below the spin-freezing temperature (Tf ). Figure 3.1 shows
the temperature dependence of the ac susceptibility of the Ni0.7Zn0.3Fe1.7Ti0.3O4
film.
Figure 3.1: (a) Dependence of ac susceptibility on temperature for the Ni0.7Zn0.3Fe2Ti0.3O4
film on the a-Al2O3 (0001) substrate as a function of frequency and temperature between 10 and400 K. (b) Magnified plot for T = 225-245 K. (c) Experimental data fitted to the Vogel-Fulcherlaw [10].
The dependence of the ac susceptibility on the frequency near the cusp tem-
perature is shown in Fig. 3.1(b). The cusp was shifted to higher temperatures
18 Chapter 3. Physical properties of (Ni,Zn,Fe,Ti)3O4 thin films
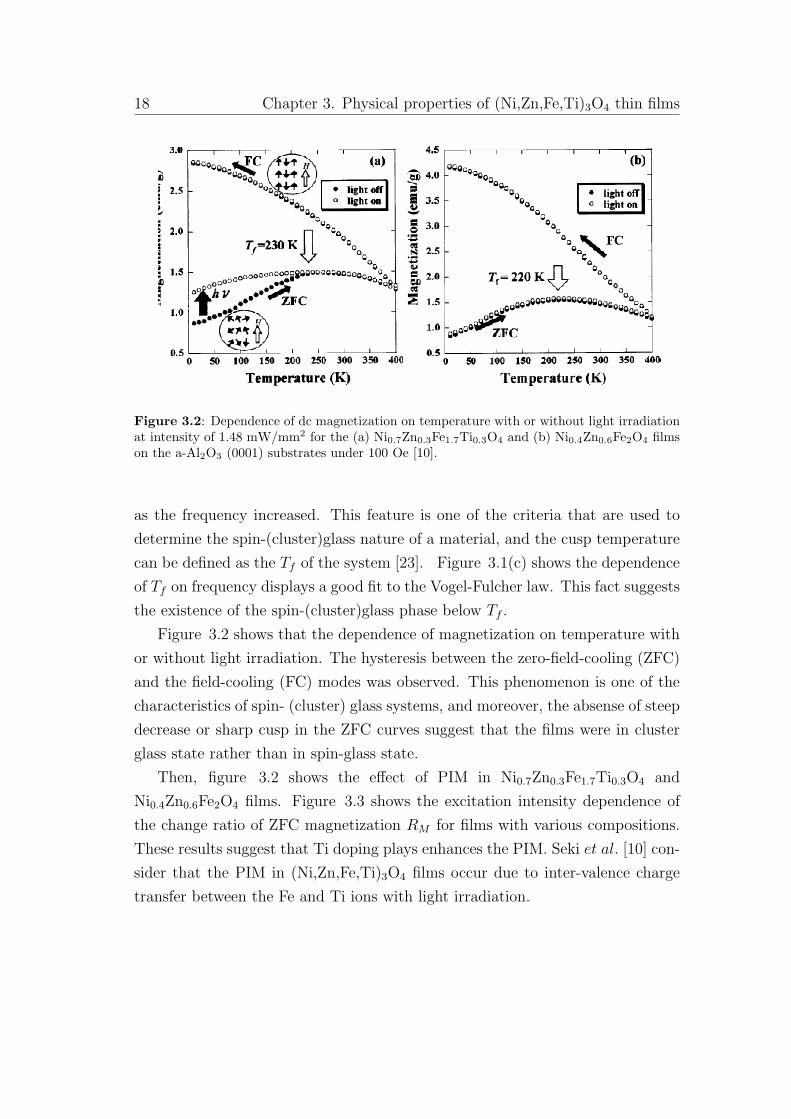
Figure 3.2: Dependence of dc magnetization on temperature with or without light irradiationat intensity of 1.48 mW/mm2 for the (a) Ni0.7Zn0.3Fe1.7Ti0.3O4 and (b) Ni0.4Zn0.6Fe2O4 filmson the a-Al2O3 (0001) substrates under 100 Oe [10].
as the frequency increased. This feature is one of the criteria that are used to
determine the spin-(cluster)glass nature of a material, and the cusp temperature
can be defined as the Tf of the system [23]. Figure 3.1(c) shows the dependence
of Tf on frequency displays a good fit to the Vogel-Fulcher law. This fact suggests
the existence of the spin-(cluster)glass phase below Tf .
Figure 3.2 shows that the dependence of magnetization on temperature with
or without light irradiation. The hysteresis between the zero-field-cooling (ZFC)
and the field-cooling (FC) modes was observed. This phenomenon is one of the
characteristics of spin- (cluster) glass systems, and moreover, the absense of steep
decrease or sharp cusp in the ZFC curves suggest that the films were in cluster
glass state rather than in spin-glass state.
Then, figure 3.2 shows the effect of PIM in Ni0.7Zn0.3Fe1.7Ti0.3O4 and
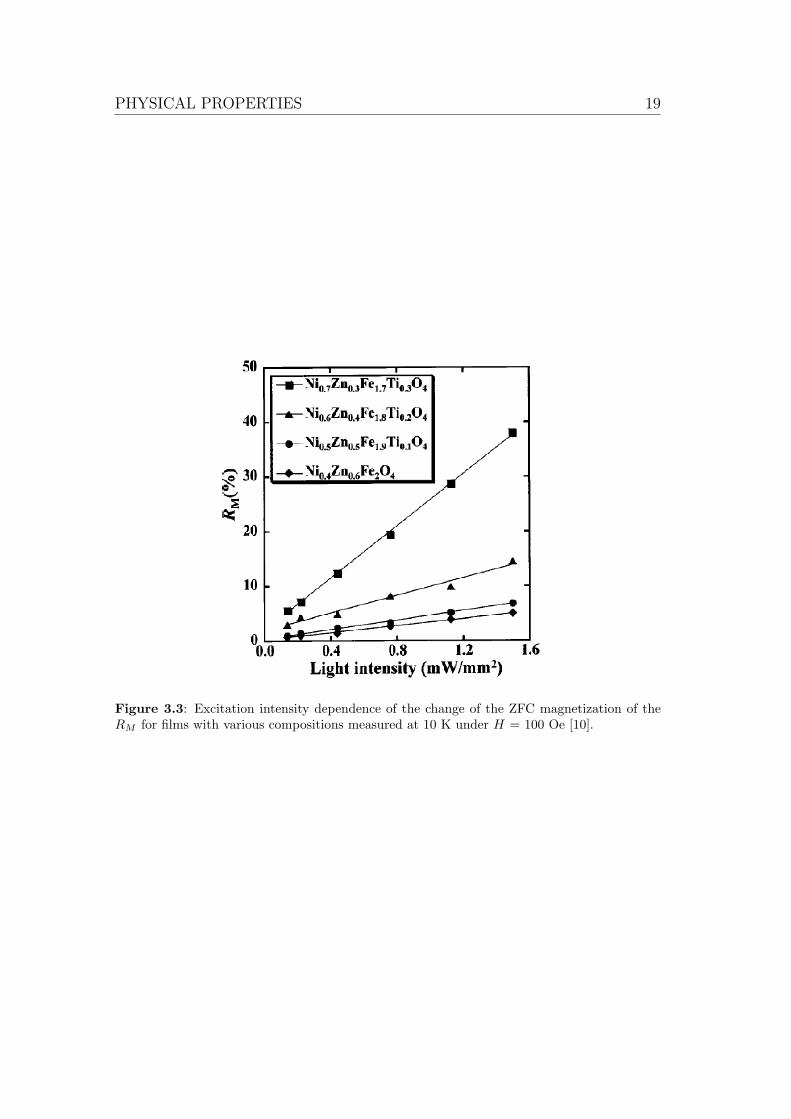
Ni0.4Zn0.6Fe2O4 films. Figure 3.3 shows the excitation intensity dependence of
the change ratio of ZFC magnetization RM for films with various compositions.
These results suggest that Ti doping plays enhances the PIM. Seki et al. [10] con-
sider that the PIM in (Ni,Zn,Fe,Ti)3O4 films occur due to inter-valence charge
transfer between the Fe and Ti ions with light irradiation.
PHYSICAL PROPERTIES 19
Figure 3.3: Excitation intensity dependence of the change of the ZFC magnetization of theRM for films with various compositions measured at 10 K under H = 100 Oe [10].


Chapter 4
Photoemission and X-ray
absorption studies of valence
states in (Ni,Zn,Fe,Ti)3O4 thin
films and the origin of
photoinduced magnetization
4.1 Introduction
Spinel ferrite oxides are typical magnetic materials, and show various magnetic
properties depending on the composition. The most advantageous feature of
spinel materials is that various ions can be placed either at the tetrahedral on
octahedral sites of the structure, which allows us to control the magnetic proper-
ties. Recently, cluster glass behavior was observed near room temperature (RT)
in spinel ferrite films, (Mg,Ti,Fe)3O4 [8], (Co,Zn)Fe2O4 [9] and (Ni,Zn,Fe,Ti)3O4
[10], and these films were reported to exhibit photoinduced magnetization (PIM)
below the spin-freezing temperature Tf . In these films, nonmagnetic ions such
as Ti4+ and Zn2+, are considered to disrupt the long-range ferromagnetic or-
der into magnetic clusters of various sizes. The spin-freezing state near RT is
expected to result from the frustration and randomness of cluster-cluster inter-
actions. Light irradiation causes the melting of the freezed spins with the result
that the magnetization increases. It was found that there was little change in
22 Chapter 4. Photoemission and X-ray absorption studies of valence states ...
the magnetization following light irradiation in Zn-substituted films [9] while Ti-
substituted films exhibited a large PIM [8]. In (Ni,Zn,Fe,Ti)3O4 thin films, a
PIM was much larger and from the results of excitation intensity dependence
of the ZFC magnetization with light irradiation the PIM was enhanced by the
increase of Ti concentration [10]. In addition, the excitation energy dependence
of PIM suggests that the inter-valence charge transfer Ti4++Fe2+ → Ti3++Fe3+
contributes to the observed enhancement of the PIM of (Ni,Zn,Fe,Ti)3O4 and the
Ti4+ ions are responsible for the large PIM. Therefore, to elucidate the mecha-
nism of the PIM, further systematic investigations concerning the role of Ti4+
ions in the PIM are desired.
4.2 Experimental
(Ni,Zn,Fe,Ti)3O4 thin films (Ni0.7Zn0.3Fe1.7Ti0.3O4, Ni0.6Zn0.4Fe1.8Ti0.2O4 and
Ni0.4Zn0.6Fe2.0O4) were prepared on a-Al2O3(0001) substrates using the pulsed-
laser deposition (PLD). Powdered NiO (99.9%), ZnO (99.999%) Fe2 O3 (99.99%),
and TiO2 (99.9%) were mixed in an approximate mole ratio and sintered at 1200◦C for 20 h in air and then cooled to room temperature at a rate of 5 0C/min.
Thin films were prepared on the a-Al2O3(0001) substrates by employing a PLD
using an ArF excimer laser (wavelength: 193 nm). The substrate temperature
at 500 ◦C was maintained and the oxygen pressure was maintained at 1.0×10⁻⁵
Torr. The typical thickness of the films was 200 nm and the film growth rate
was 3 nm/min. The structural properties were examined by a standard x-ray
diffraction (XRD) system using a monochromated Cu Kα radiation. Hereafter,
we denote Ni0.4Zn0.6Fe2.0O4, Ni0.6Zn0.4Fe1.8Ti0.2O4 and Ni0.7Zn0.3Fe1.7Ti0.3O4 by
Ti = 0.0, 0.2 and 0.3, respectively.
X-ray photoemission spectroscopy (XPS) measurements were performed using
the photon energy of hν = 1253.6 eV (the Mg Kα line). No treatment was made
for the sample surfaces. All the photoemission measurements were performed
under the base pressure of ∼ 10−10 Torr at room temperature. Photoelectrons
were collected using a Scienta SES-100 electron energy analyzer. The total en-
ergy resolution was about 800 meV. Binding energies were calibrated using the
Au 4f7/2 core-level peak at binding energy of 84.0 eV. Resonant photoemission
spectroscopy (RPES) and x-ray absorption spectroscopy (XAS) measurements

4.3 Result and Discussion 23
Figure 4.1: Schematic layout of the BL23-SU at SPring-8 [24].
were performed at the soft x-ray beamline BL23-SU of SPring-8. The total en-
ergy resolution was set to ∼ 200 meV. The sample surface was clean by annealing
at 400 ◦ C for 30 min.
4.3 Result and Discussion
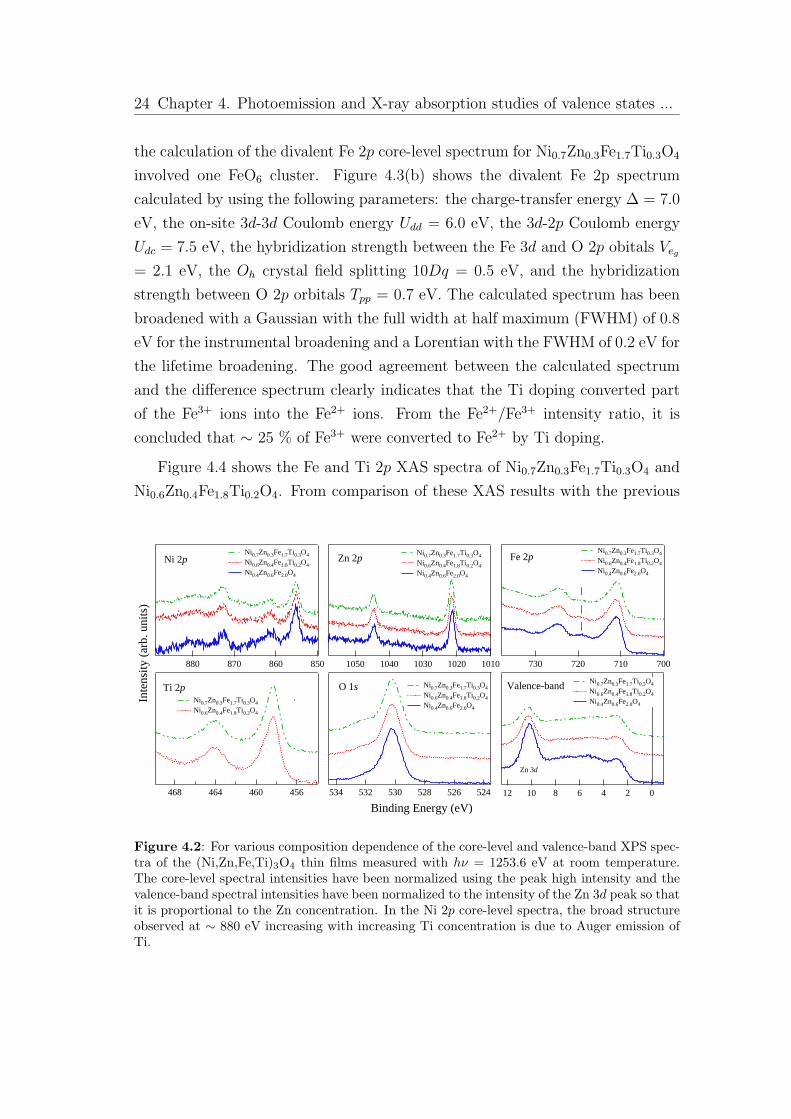
Figure 4.2 shows the Ti-composition dependence of the core-level XPS spectra of
the (Ni,Zn,Fe,Ti)3O4 thin films. Without Ti doping, the Fe 2p core-level spectrum
was similar to that of Fe3+ oxides [25]. With increasing Ti concentration, the
spectrum became a little similar to the Fe 2p spectrum of Fe3O4 concerning
the increase of the satellite structure between 2p1/2 and 2p3/2. We interpret
this observation in the scenario that Ti doping in the (Ni, Zn, Fe)3O4 thin film
induced overlapping Fe2+ component since the Fe2+ peak is located on the lower
binding energy side of the Fe3+ peak. Therefore, we extracted the Fe2+ component
in Ni0.7Zn0.3Fe1.7Ti0.3O4 by taking the difference between the Fe 2p core-level
spectra of Ni0.7Zn0.3Fe1.7Ti0.3O4 and Ni0.4Zn0.6Fe2.0O4 as shown in Fig. 4.3(a).
From comparison with the previous study [25], we indeed find that the difference
spectrum is similar to the Fe 2p core-level spectrum of FeO [26] with respect
to the energy position and the line shape. Furthermore, we have compared the
spectrum with a cluster-model calculation: in the case of Ni0.7Zn0.3Fe1.7Ti0.3O4,
all the divalent Fe ions are expected to occupy the octahedral sites. Therefore,
24 Chapter 4. Photoemission and X-ray absorption studies of valence states ...
the calculation of the divalent Fe 2p core-level spectrum for Ni0.7Zn0.3Fe1.7Ti0.3O4
involved one FeO6 cluster. Figure 4.3(b) shows the divalent Fe 2p spectrum
calculated by using the following parameters: the charge-transfer energy ∆ = 7.0
eV, the on-site 3d-3d Coulomb energy Udd = 6.0 eV, the 3d-2p Coulomb energy
Udc = 7.5 eV, the hybridization strength between the Fe 3d and O 2p obitals Veg
= 2.1 eV, the Oh crystal field splitting 10Dq = 0.5 eV, and the hybridization
strength between O 2p orbitals Tpp = 0.7 eV. The calculated spectrum has been
broadened with a Gaussian with the full width at half maximum (FWHM) of 0.8
eV for the instrumental broadening and a Lorentian with the FWHM of 0.2 eV for
the lifetime broadening. The good agreement between the calculated spectrum
and the difference spectrum clearly indicates that the Ti doping converted part
of the Fe3+ ions into the Fe2+ ions. From the Fe2+/Fe3+ intensity ratio, it is
concluded that ∼ 25 % of Fe3+ were converted to Fe2+ by Ti doping.
Figure 4.4 shows the Fe and Ti 2p XAS spectra of Ni0.7Zn0.3Fe1.7Ti0.3O4 and
Ni0.6Zn0.4Fe1.8Ti0.2O4. From comparison of these XAS results with the previous
1050 1040 1030 1020 1010 730 720 710 700880 870 860 850
468 464 460 456 534 532 530 528 526 524 12 10 8 6 4 2 0
Inte
nsity
(ar
b. u
nits
)
Binding Energy (eV)
Fe 2pZn 2pNi 2p
Ti 2p O 1s Valence-band
Ni0.7Zn0.3Fe1.7Ti0.3O4
Ni0.6Zn0.4Fe1.8Ti0.2O4
Ni0.4Zn0.6Fe2.0O4
Zn 3d
Ni0.7Zn0.3Fe1.7Ti0.3O4
Ni0.6Zn0.4Fe1.8Ti0.2O4
Ni0.4Zn0.6Fe2.0O4
Ni0.7Zn0.3Fe1.7Ti0.3O4
Ni0.6Zn0.4Fe1.8Ti0.2O4
Ni0.4Zn0.6Fe2.0O4
Ni0.7Zn0.3Fe1.7Ti0.3O4
Ni0.6Zn0.4Fe1.8Ti0.2O4
Ni0.4Zn0.6Fe2.0O4
Ni0.7Zn0.3Fe1.7Ti0.3O4
Ni0.6Zn0.4Fe1.8Ti0.2O4
Ni0.4Zn0.6Fe2.0O4 Ni0.7Zn0.3Fe1.7Ti0.3O4
Ni0.6Zn0.4Fe1.8Ti0.2O4
Figure 4.2: For various composition dependence of the core-level and valence-band XPS spec-tra of the (Ni,Zn,Fe,Ti)3O4 thin films measured with hν = 1253.6 eV at room temperature.The core-level spectral intensities have been normalized using the peak high intensity and thevalence-band spectral intensities have been normalized to the intensity of the Zn 3d peak so thatit is proportional to the Zn concentration. In the Ni 2p core-level spectra, the broad structureobserved at ∼ 880 eV increasing with increasing Ti concentration is due to Auger emission ofTi.
4.3 Result and Discussion 25
Inte
nsity
(ar
b. u
nits
)
730 720 710Binding Energy (eV)
730 720 710
O KLL
difference calculation
Ni0.7Zn0.3Fe1.7Ti0.3O4
Ni0.4Zn0.6Fe2.0O4
difference x 3
difference
(a) (b)Fe 2p XPS
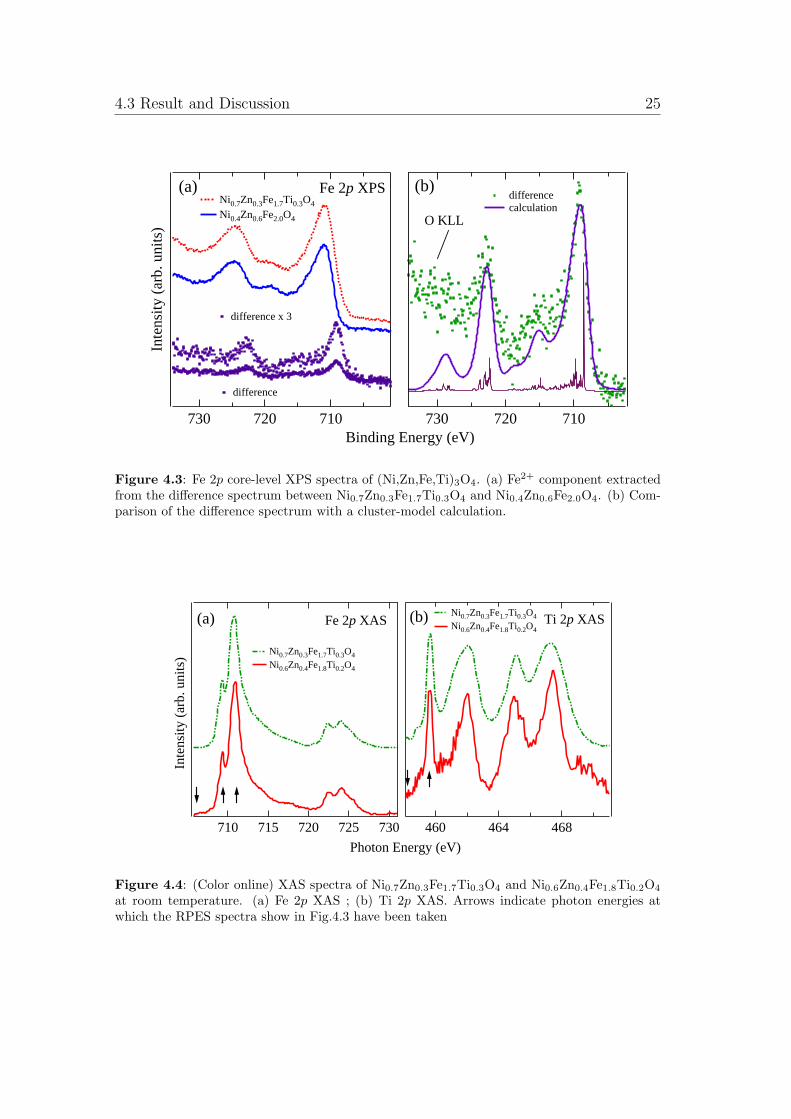
Figure 4.3: Fe 2p core-level XPS spectra of (Ni,Zn,Fe,Ti)3O4. (a) Fe2+ component extractedfrom the difference spectrum between Ni0.7Zn0.3Fe1.7Ti0.3O4 and Ni0.4Zn0.6Fe2.0O4. (b) Com-parison of the difference spectrum with a cluster-model calculation.
Inte
nsity
(ar
b. u
nits
)
730725720715710
Photon Energy (eV)
468464460
Ni0.7Zn0.3Fe1.7Ti0.3O4
Ni0.6Zn0.4Fe1.8Ti0.2O4
Fe 2p XAS Ni0.7Zn0.3Fe1.7Ti0.3O4
Ni0.6Zn0.4Fe1.8Ti0.2O4Ti 2p XAS(a) (b)
Figure 4.4: (Color online) XAS spectra of Ni0.7Zn0.3Fe1.7Ti0.3O4 and Ni0.6Zn0.4Fe1.8Ti0.2O4
at room temperature. (a) Fe 2p XAS ; (b) Ti 2p XAS. Arrows indicate photon energies atwhich the RPES spectra show in Fig.4.3 have been taken
26 Chapter 4. Photoemission and X-ray absorption studies of valence states ...
ones on Fe and Ti oxides [27, 28], we conclude that Fe ions are dominated by
the trivalent state, and Ti ions are dominated by the tetravalent state. However,
a small change is seen in the structure at ∼ 709 eV of the Fe 2p XAS spectra,
which grows with increasing Ti concentration. We attribute this to the increase
of divalent Fe ions with increasing Ti ion concentration, and a larger amount of
divalent Fe ions exist Ni0.7Zn0.3Fe1.7Ti0.3O4 than in Ni0.6Zn0.4Fe1.8Ti0.2O4.
Inte
nsity
(ar
b. u
nits
)
12 8 4 0Binding Energy (eV)
1.5 0.0
711eV 709eV 704eV
(a) (b)
Ni0.7Zn0.3Fe1.7Ti0.3O4
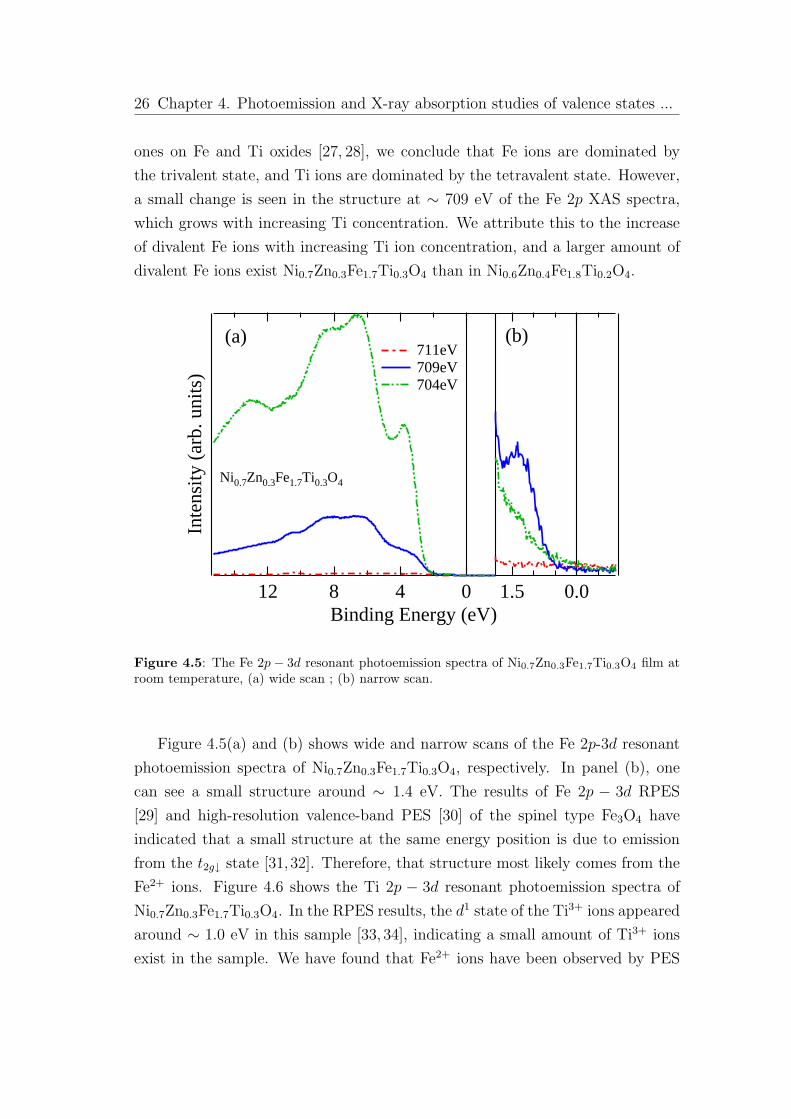
Figure 4.5: The Fe 2p − 3d resonant photoemission spectra of Ni0.7Zn0.3Fe1.7Ti0.3O4 film atroom temperature, (a) wide scan ; (b) narrow scan.
Figure 4.5(a) and (b) shows wide and narrow scans of the Fe 2p-3d resonant
photoemission spectra of Ni0.7Zn0.3Fe1.7Ti0.3O4, respectively. In panel (b), one
can see a small structure around ∼ 1.4 eV. The results of Fe 2p − 3d RPES
[29] and high-resolution valence-band PES [30] of the spinel type Fe3O4 have
indicated that a small structure at the same energy position is due to emission
from the t2g↓ state [31,32]. Therefore, that structure most likely comes from the
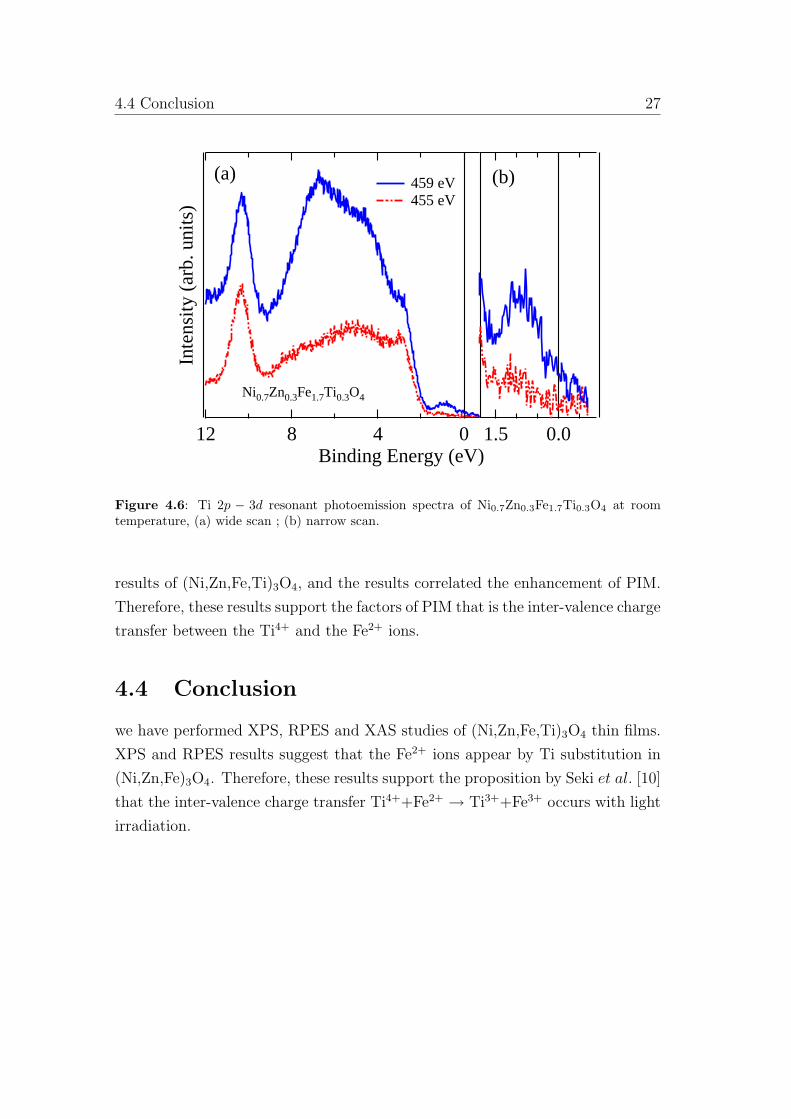
Fe2+ ions. Figure 4.6 shows the Ti 2p − 3d resonant photoemission spectra of
Ni0.7Zn0.3Fe1.7Ti0.3O4. In the RPES results, the d1 state of the Ti3+ ions appeared
around ∼ 1.0 eV in this sample [33, 34], indicating a small amount of Ti3+ ions
exist in the sample. We have found that Fe2+ ions have been observed by PES
4.4 Conclusion 27
Inte
nsity
(ar
b. u
nits
)
12 8 4 0Binding Energy (eV)
1.5 0.0
459 eV 455 eV
Ni0.7Zn0.3Fe1.7Ti0.3O4
(a) (b)
Figure 4.6: Ti 2p − 3d resonant photoemission spectra of Ni0.7Zn0.3Fe1.7Ti0.3O4 at roomtemperature, (a) wide scan ; (b) narrow scan.
results of (Ni,Zn,Fe,Ti)3O4, and the results correlated the enhancement of PIM.
Therefore, these results support the factors of PIM that is the inter-valence charge
transfer between the Ti4+ and the Fe2+ ions.
4.4 Conclusion
we have performed XPS, RPES and XAS studies of (Ni,Zn,Fe,Ti)3O4 thin films.
XPS and RPES results suggest that the Fe2+ ions appear by Ti substitution in
(Ni,Zn,Fe)3O4. Therefore, these results support the proposition by Seki et al. [10]
that the inter-valence charge transfer Ti4++Fe2+ → Ti3++Fe3+ occurs with light
irradiation.

Chapter 5
Photoemission study of
(Ni,Zn,Fe,Ti)3O4 thin film with
light irradiation
5.1 Introduction
(Ni,Zn,Fe,Ti)3O4 thin films have been shown to exhibit the effect of photo-
induced magnetism (PIM) by Seki et al [10]. They consider that the PIM in
(Ni,Zn,Fe,Ti)3O4 is caused by inter-valence charge transfer (IVCT) between Fe
and Ti ions. IVCT transitions are transitions in which an electron, through opti-
cal excitation, is transferred from one cation to a neighboring cation. Compounds
containing an element in two different oxidation states, mixed valence compounds,
often show intense absorption in the visible region which can be attributed to
IVCT transitions. Figure 5.1 shows the efficiency of PIM E = (1/I)(∆M/M0),
where I is the intensity of filtered light [35], ∆M is the increase in the ZFC mag-
netization following light irradiation, and M0 is the magnetization before light
irradiation [10], shows a maximum at approximately 2.2 eV. This value is close to
that of the energy for the inter-valence charge transfer between the Fe2+ and Ti4+
ions at the octahedral sites in the spinel structure [36, 37]. In addition, Seki et
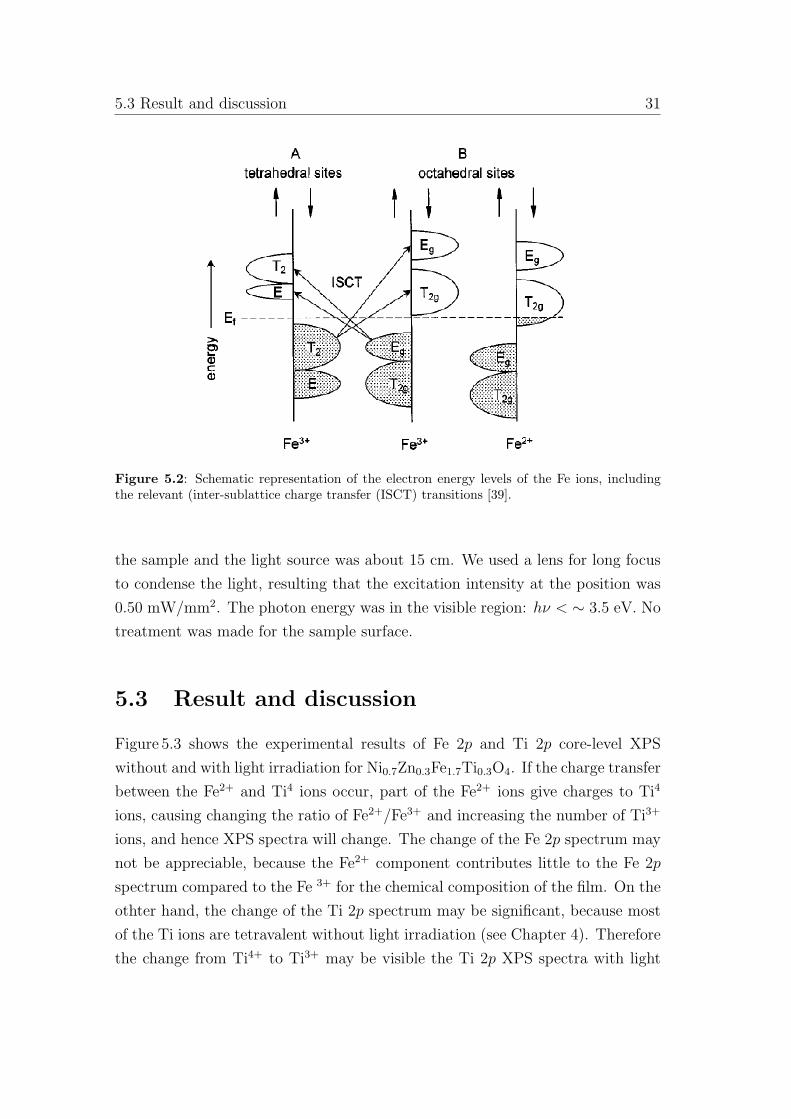
al. have proposed that the efficiency of PIM at ∼ 1.9 eV shown in Fig. 5.1 arises
from the charge transfer between the Fe ions at the octahedral site ; [Fe2+]t2g →[Fe2+]eg (see Fig. 5.2) [38,39]. On the other hand, they have interpreted the effect
of PIM as a photomagnetic effect in Si4+-doped yttrium iron garnet [35, 40, 41].

30 Chapter 5. Photoemission study of (Ni,Zn,Fe,Ti)3O4 thin films with ...
Figure 5.1: Optical absorption spectrum at 300 K and an efficiency of PIM E at 10 K for theNi0.7Zn0.3Fe2Ti0.3O4 film was grown on the a-Al2O3(0001) substrate. The intensity of filteredlight in the various energy regions was equally 0.92 mW/mm2 [10].
In this material, the IVCT causes the rearrangement of Fe2+ ions, resulting in the
a uniaxial magnetic anisotropy. As for the charge transfer in (Ni,Zn,Fe,Ti)3O4
has been not oveserved experimentally. In this thesis, we have performed the
x-ray photoemission spectroscopy, which is a useful technique to investigate the
occupied electronic structure of solids, with light irradiation.
5.2 Experimental
A Ni0.7Zn0.3Fe1.7Ti0.3O4 thin film was prepared on a-Al2O3(0001) substrates using
the PLD technique as described in chapter 4. XPS measurements were performed
using the photon energy of hν = 1253.6 eV (the Mg Kα line). All the photoe-
mission measurements were performed under the base pressure of ∼ 10−10 Torr
at room temperature. Photoelectrons were collected using a Scienta SES-100
electron energy analyzer. The total energy resolution was about ∼ 800 meV.
Binding energies were calibrated using the Au 4f7/2 core-level peak at the bind-
ing energy of 84.0 eV. A Xe lamp was used as the excitation light source for light
irradiation. The electric power of the lamp was 150 W. The light was introduced
from outside of the viewing port into the XPS system, and the distance between
5.3 Result and discussion 31
Figure 5.2: Schematic representation of the electron energy levels of the Fe ions, includingthe relevant (inter-sublattice charge transfer (ISCT) transitions [39].
the sample and the light source was about 15 cm. We used a lens for long focus
to condense the light, resulting that the excitation intensity at the position was
0.50 mW/mm2. The photon energy was in the visible region: hν < ∼ 3.5 eV. No
treatment was made for the sample surface.
5.3 Result and discussion
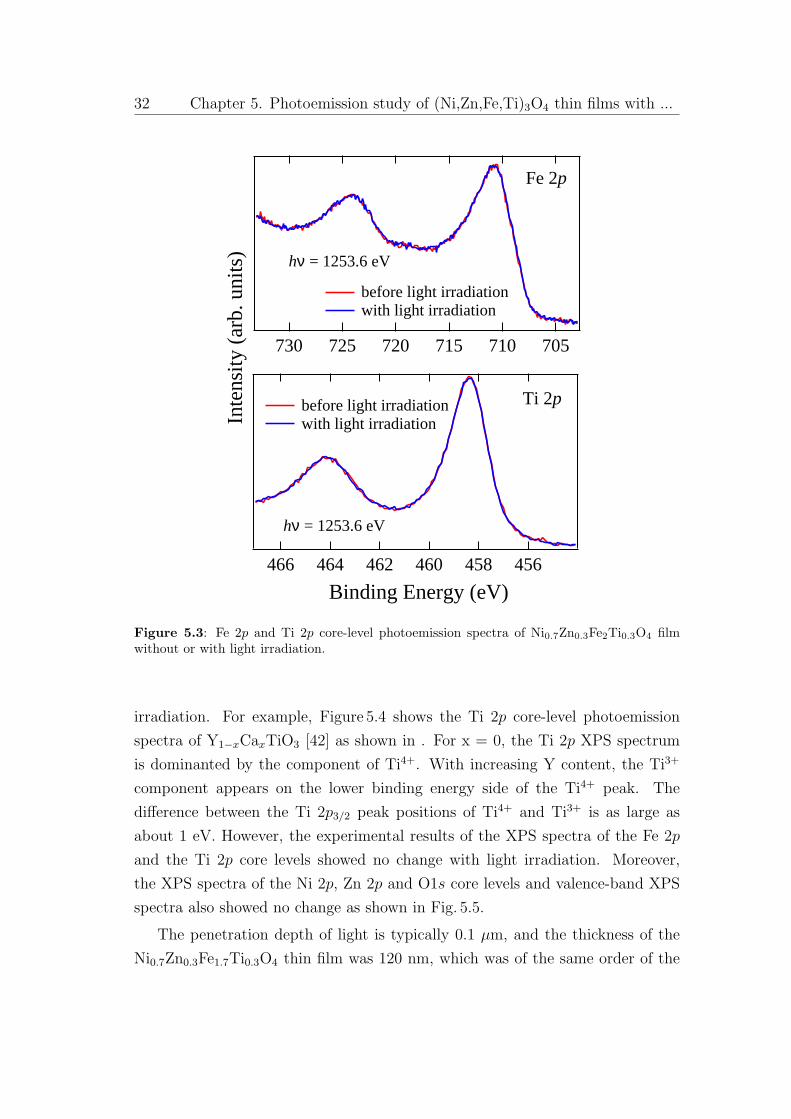
Figure 5.3 shows the experimental results of Fe 2p and Ti 2p core-level XPS
without and with light irradiation for Ni0.7Zn0.3Fe1.7Ti0.3O4. If the charge transfer
between the Fe2+ and Ti4 ions occur, part of the Fe2+ ions give charges to Ti4
ions, causing changing the ratio of Fe2+/Fe3+ and increasing the number of Ti3+
ions, and hence XPS spectra will change. The change of the Fe 2p spectrum may
not be appreciable, because the Fe2+ component contributes little to the Fe 2p
spectrum compared to the Fe 3+ for the chemical composition of the film. On the
othter hand, the change of the Ti 2p spectrum may be significant, because most
of the Ti ions are tetravalent without light irradiation (see Chapter 4). Therefore
the change from Ti4+ to Ti3+ may be visible the Ti 2p XPS spectra with light
32 Chapter 5. Photoemission study of (Ni,Zn,Fe,Ti)3O4 thin films with ...
466 464 462 460 458 456
before light irradiation with light irradiation
Binding Energy (eV)
730 725 720 715 710 705
before light irradiation with light irradiation
Inte
nsity
(ar
b. u
nits
) hν = 1253.6 eV
hν = 1253.6 eV
Fe 2p
Ti 2p
Figure 5.3: Fe 2p and Ti 2p core-level photoemission spectra of Ni0.7Zn0.3Fe2Ti0.3O4 filmwithout or with light irradiation.
irradiation. For example, Figure 5.4 shows the Ti 2p core-level photoemission
spectra of Y1−xCaxTiO3 [42] as shown in . For x = 0, the Ti 2p XPS spectrum
is dominanted by the component of Ti4+. With increasing Y content, the Ti3+
component appears on the lower binding energy side of the Ti4+ peak. The
difference between the Ti 2p3/2 peak positions of Ti4+ and Ti3+ is as large as
about 1 eV. However, the experimental results of the XPS spectra of the Fe 2p
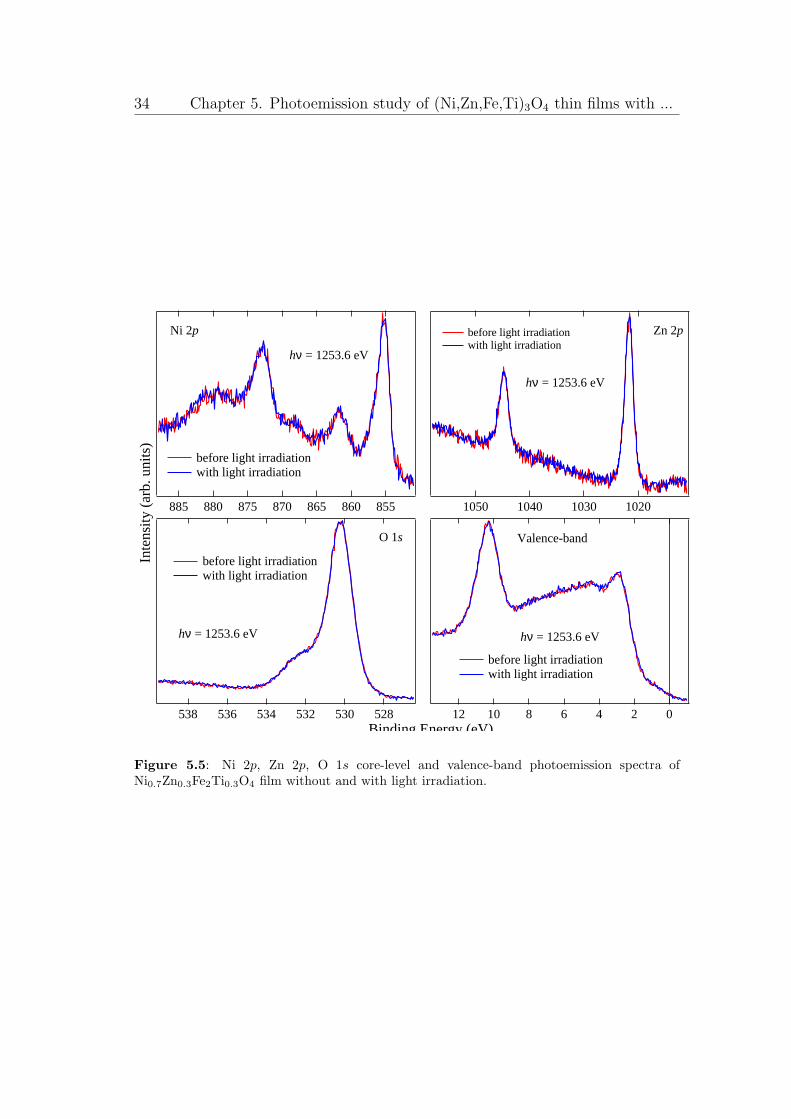
and the Ti 2p core levels showed no change with light irradiation. Moreover,
the XPS spectra of the Ni 2p, Zn 2p and O1s core levels and valence-band XPS
spectra also showed no change as shown in Fig. 5.5.
The penetration depth of light is typically 0.1 µm, and the thickness of the
Ni0.7Zn0.3Fe1.7Ti0.3O4 thin film was 120 nm, which was of the same order of the

5.4 Conclusion 33
Figure 5.4: Ti 2p core-level photoemission spectra of Y1−xCaxTiO3. At x = 0.0, most of theTi component is Ti3+ component. With increasing Ca, Ti4+ component increase [42].
light penetration depth. As regards this point, the IVCT between the Fe and
the Ti ions will occur all over the film. We could not detect the charge transfer,
probably because of the fast relaxation process of the charge transfer. Hence, the
spectra changed only very little, and the change will be over the detection limit
of the XPS system.
5.4 Conclusion
We have performed an XPS study of Ni0.7Zn0.3Fe1.7Ti0.3O4 thin film without and
with light irradiation. The film has been shown to exhibit the PIM which will be
caused by inter-valence charge transfer between the Fe and Ti ions. However, we
could not detect the charge transfer. Further experiments are necessary to detect
the inter-valence charge transfer.
34 Chapter 5. Photoemission study of (Ni,Zn,Fe,Ti)3O4 thin films with ...
538 536 534 532 530 528
before light irradiation with light irradiation
885 880 875 870 865 860 855
before light irradiation with light irradiation
12 10 8 6 4 2 0
before light irradiation with light irradiation
Inte
nsity
(ar
b. u
nits
)
Binding Energy (eV)
hν = 1253.6 eV
hν = 1253.6 eV
hν = 1253.6 eV hν = 1253.6 eV
1050 1040 1030 1020
before light irradiation with light irradiation
hν = 1253.6 eV
Ni 2p Zn 2p
O 1s Valence-band
Figure 5.5: Ni 2p, Zn 2p, O 1s core-level and valence-band photoemission spectra ofNi0.7Zn0.3Fe2Ti0.3O4 film without and with light irradiation.
Chapter 6
Summary
In summary, we have performed XPS, resonant PES and XAS experi-
ments on the spinel type (Ni,Zn,Fe,Ti)3O4 thin films (Ni0.7Zn0.3Fe1.7Ti0.3O4,
Ni0.6Zn0.4Fe1.8Ti0.2O4 and Ni0.4Zn0.6Fe2.0O4). We have found out that Fe2+ ions
have been observed by PES results of (Ni,Zn,Fe,Ti)3O4, and the results corre-
lated the enhancement of PIM. Therefore, these results support the factors of
PIM that is the inter-valence charge transfer between Ti4+ and2+ ions. In addi-
tion, we have performed XPS study of Ni0.7Zn0.3Fe1.7Ti0.3O4 thin film without or
with light irradiation. Seki et al. suggest that the the charge trancefer between
Fe2+ ions and Ti4 occur with light irradiation in Ni0.7Zn0.3Fe1.7Ti0.3O4 thin film,
but we could not detect the charge trancefer.

Acknowledgement
The present thesis is a productive result of the continuous collaboration with
Prof. Atsushi Fujimori and the following excellent co-workers.
First of all, I would like to express my heartfelt gratitude to Prof. Atsushi Fu-
jimori, who has given me a lot of attentive guidance and valuable advice through-
out this work. I have always got an impression by his knowledge and foresight in
the field of condensed matter physics. Thanks to his pertinent advice, I have been
able to go ahead with my investigation in an efficient manner so far. I also thank
to Prof. Takashi Mizokawa for his instructive advice about the interpretation of
the experimental results. I am deeply thankful to Dr. Teppei Yoshida for a lot
of useful counsel. The experiments at BL23-SU of SPring-8 were supported by
a number of people. I am indebted to the members, Dr. Yukiharu Takeda, Dr.
Shin-ichi Fujimori, Dr. Kouta Terai, Dr. Tetsuo Okane, Dr. Yuji Saito, and Prof.
Hiroshi Yamagami, for their valuable technical support during the beamtimes at
BL23SU of SPring-8.
I am very grateful to Dr. M. Seki, Prof. H. Tabata, and Prof. T. Kawai
for providing me with such interacting and excellent samples of (Ni,Zn,Fe,Ti)3O4
and Fe3O4 with valuable advice and suggestions.
I would like to thank the members of Fujimori-Mizokawa Group. Mr. Jong-Il
Hwang always gave me suggestive advice about the interpretation of experimental
results and taught me how to use and maintain photoemission instruments. Mr.
Kazuaki Ebata gave me a helping hand with my work when I was in trouble.
Mr. Masaki Kobayashi gave me valuable comments on my experimental results
and helped me at Spring-8. Mr. Masaru Takizawa gave me a lot of useful
advice about the necessary things to analyze the experimental data. Mr. Kyong
Sok Song helped me with the maintenance of photoemission instruments and
experiments. I also wish to thank Dr. Kiyohisa Tanaka, Dr.Yukiaki Ishida, Dr.

38 ACKNOWLEDGEMENT
Hajime Yagi, Mr. Hiroki Wadati, Mr. Makoto Hashimoto, Mr. Masaki Ikeda,
Mr. Walid Malaeb, Mr. Yoshitaka Osafune, Mr. Koji Maekawa, Mr. Satoru
Kudou, Dr. Jin-Yong Son, Dr. Daishuke Asakura, Mr. Thang Trung Tran, Mr.
Kou Takubo, Mr. Takashi Iida, Mr. Osamu Iwata, Mr. Takaaki Sudayama, Mr.
Yuki Wakisaka, and Ms. Ayako Fukuya for their cordial supports.
Finally, I am most grateful to my friends and family for their advice and
encouragement.
Kashiwa, Chiba
January 2007
Yasuhiro Ooki
Reference
[1] Y. Muraoka, H. Tabata, and T. Kawai, J. Appl. Phys. 88, 7223 (2000).
[2] P. A. Miles, W. B. Westphal, and A. von Hippel, Rev. Mod. Phys. 29, 279
(1957).
[3] A. K. M. A. Hossain, M. Seki, T. Kawai, and H. Tabata, J. Appl. Phys. 96,
1273 (2004).
[4] A. P. Ramirez, J. Phys.: Condens. Mat. 9, 8171 (1997).
[5] H. Masumoto and Y. Shirakawa, Phys. Rev. 60, 835 (1941).
[6] S. B. Ogale, K. Ghosh, R. P. Sharma, R. L. Greene, R. Ramesh, and T.
Venkatesan, Phys. Rev. B 57, 7823 (1998).
[7] A. P. Ramirez, R. J. Cava, and J. Krajewski, Nature 386, 156 (1997).
[8] Y. Muraoka, H. Tabata, and T. Kawai, Appl. Phys. Lett. 76, 1179 (2000).
[9] Y. Muraoka, H. Tabata, and T. Kawai, Solid State Commun. 120, 225
(2001).
[10] M. Seki, A. K. M. A. Hossain, T. Kawai, and H. Tabata, Appl. Phys. Lett.
97, 083541 (2005).
[11] S. F. Edwards and P. W. Anderson, J. Phys. F: Met. Phys 5, 965 (1975).
[12] Y. Syono, A. Ito, and O. Horie, J. Phys. Soc. Jpn. 46, 793 (1979).
[13] Y. Yoshurun, M. B. Salamon, K. V. Rao, and H. S. Chen, Phys. Rev. Lett.
45, 1366 (1981).
40 REFERENCE
[14] R. A. Brand, H. G. Gibert, J. Hubsch, and J. A. Heller, J. Phys. F: Met.
Phys 15, 1987 (1985).
[15] E. D. Grave, A. Govaert, D. Chambaere, and G. Robbrecht, Physica B 96,
103 (1979).
[16] H. Munekata, A. Oiwa, and T. Slupinski, Physica E (Amsterdam) 13, 516
(2002).
[17] P. Gutlich, A. Hauser, and H. Spiering, Angew. Chem. 33, 2024 (1994).
[18] T. I. O. Sato, A. Fujishima, and K. Hashimoto, Science 272, 704 (1996).
[19] T. A. Koopmans, Physica 1, 104 (1933).
[20] S. Hufner, Photoelectron Spectroscopy (Springer-Verlag, Berlin, 2003).
[21] U. Fano, Phys. Rev. 124, 1866 (1961).
[22] W. A. Harrison, Electronic Structure and Physical Properties of Solids (Free-
man, San Francisco, 1980).
[23] J. A. Mydosh, Spin Glass: An Experimental Introduction (Taylor & Francis,
London, 1993).
[24] Y. Saitoh, T. Nakatani, T. Matsushita, A. Agui, A. Yoshigoe, Y. Teraoka,
and A. Yokoya, Nucl. Inst. Meth. A 474, 253 (2001).
[25] P. C. J. Graat and M. A. J. Somers, Applied Surface Science 100/101, 36
(1996).
[26] G. Lee and S.-J. Oh, Phys. Rev. B 43, 14674 (1991).
[27] G. van der Laan and I. W. Kirkman, J. Phys.: Condens. Mat. 4, 4189 (1992).
[28] M. Abbate, F. M. F. de Groot, J. C. Fuggle, A. Fujimori, Y. Tokura, Y.
Fujishima, O. Strebel, M. Domke, G. Kaindl, J. van Elp, B. T. Thole, G. A.
Sawatzky, M.Sacchi, and N. Tsuda, Phys. Rev. B 44, 5419 (1991).
[29] J. Chan, D. J. Huang, A. Tanaka, C. F. Chang, S. C. Chung, W. B. Wu,
and C. T. Chen, Phys. Rev. B 69, 085107 (2004).
REFERENCE 41
[30] J.-H. Park, L. H. Tjeng, J. W. Allen, P. Metcalf, and C. T. Chen, Phys.
Rev. B 55, 12813 (1997).
[31] V. Anisimov, I. Elfimov, N. Hamada, and K. Terakura, Phys. Rev. B 54,
4387 (1996).
[32] H.-T. Jeng and G. Guo, Phys. Rev. B 65, 094429 (2002).
[33] K. Prince, V. Dhanak, P. Finetti, J. Walsh, R. Davis, C. Muryn, H. Dhariwal,
G. Thornton, and G. van der Laan, Phys. Rev. B 55, 9520 (1997).
[34] A. Thomas, W. Flavell, A. Kumarasinghe, A. Mallick, D. Tsoutsou, G.
Smith, R. Stockbauer, and S. Patel, Phys. Rev. B 67, 035110 (2003).
[35] U. Enz and H. van der Heide, Solid State Commun. 6, 347 (1968).
[36] R. G. J. Strens and B. J. Wood, Miner. Mag. 43, 347 (1979).
[37] D. M. Sherman, Phys. Chem. Miner 14, 364 (1987).
[38] W. F. J. Fontijn, P. J. van der Zaag, M. A. C. Devillers, V. A. M. Brabers,
and R. Metselaar, Phys. Rev. B 56, 5432 (1997).
[39] W. F. J. Fontijn, P. J. van der Zaag, and L. F. Feiner, J. Appl. Phys. 85,
5100 (1999).
[40] W. Teale and D. W. Temple, Phys. Rev. Lett. 19, 904 (1967).
[41] R. Albern, J. F. Dillon, E. M. Gyory, and J. P. Remeika, J. Appl. Phys. 42,
1447 (1971).
[42] K. Morikawa, T. Mizokawa, A. Fujimori, Y. Taguchi, and Y. Tokura, Phys.
Rev. B 54, 8446 (1996).