photographs courtesy of - earthlife
TRANSCRIPT
The Sustainable Energy and Climate Change Project seek a just transition to renewable energy and a low- carbon economy. The SECCP works to promote local and global environmental and social justice on sustainable energy and climate change issues, by changing policies and behaviour through building the awareness and capacity of civil society and government, to achieve an equitable future with respect for all. The SECCP is a campaign within Earthlife Africa Jhb.
Contact details for the SECCP are:
Sustainable Energy & Climate Change ProjectTel: +27 11 339 3662Fax: +27 11 339 3270Email: [email protected] O Box 32131Braamfontain 2107South Africa
www.earthlife.org.za
PHOTOGRAPHS COURTESY OF:
Page 82 Group: * front cover (Suspension tower) picture credit: Kriss Szkurlatowski* page 5 (Relay station on green grassland) picture credit: Gesine Kuhlmann * page 8 (cooking lunch on the campfire in Africa) picture credit: Spencer Britton* page 10 (Young boy studying for school - pointe Noire Congo) picture credit: Stock Xchng * page 20 (RDP Housing) picture credit: Heroes Ngqabutho Moyo* page 25 (Windmills in Palm Springs) picture credit: Ali Farid
*Back cover (City of Johannesburg) picture credit: Aldon Scott Mc Leod
Paul Weinberg:* page 13 (Power lines) credit: P. Weinberg

Contents
ACKNOWLEDGEMENTS..........................................................................................................................3
ABBREVIATIONS.........................................................................................................................................4
TABLES & ANNEXURE...............................................................................................................................4
1. EXECUTIVE SUMMARY..............................................................................................................5
2. INTRODUCTION..........................................................................................................................7
3. BACKGROUND.............................................................................................................................8
3.1. Electricity is fundamental to upliftment............................................................................8
3.2. A right to electricity..................................................................................................................10
4. GOVERNMENT POLICY – FREE BASIC SERVICES..............................................................13
4.1. Policy Challenges and Implementation Constraints ....................................................15
4.1.1. 50kWh............................................................................................................................................15
4.1.2. Pre-paid meters..........................................................................................................................16
4.1.3. 20 Amp limit................................................................................................................................16
4.1.4. Implementation.........................................................................................................................18
5. RESEARCH AND FINDINGS......................................................................................................20
5.1. Methodology...............................................................................................................................21
5.2. Energy Audit Findings..............................................................................................................22
5.3. Desktop Findings.......................................................................................................................22
5.4. Revised FBE for Eskom.............................................................................................................25
6. FUNDING MODEL.......................................................................................................................26
7. CONCLUSION...............................................................................................................................29
8. BIBLIOGRAPHY............................................................................................................................30
9. ANNEXURE....................................................................................................................................31

ACKNOWLEDGEMENTS
This research report was made possible through the valuable contributions from a number of people and organisations. The legal analysis was compiled by Jackie Dugard of SERI and the desktop analysis on 50kWh was completed by Dr Philip Goyns of Enerkey. Fundi Nzimande from NALEDI was key to obtaining useful statistics that informed the financial model. A special thanks to Ameera Patel for volunteering to do the data capturing.
Enormous gratitude to the women of the Gender Committee on Energy and Climate Change who never tired of completing the energy audits. Their support was a key motivator.
Finally, this report was made possible through the kind support of Oxfam Novib and Heinrich Böll Foundation. The views expressed in this report are not necessarily those of Oxfam Novib or Heinrich Böll Foundation.

TABLES
Table 1- Essential services (cooking, heating, hot water, refrigeration and lighting) and their combined power demand.............................................................................................................17
Table 2- Basic services and their energy demand........................................................................23Table 3- Essential services and their energy demand..................................................................24Table 4- Cost of FBE.....................................................................................................................28
ANNEXURE
Table 1-12: Eskom Residential Data for 2008/2009
ABBREVIATIONSAmp – Ampere
CAPEX – Capital Expenditure
CFO – Chief Financial Officer
DME – Department of Minerals and Energy
DoE – Department of Energy
FBE – Free Basic Electricity
FBS – Free Basic Services
GWh – Gigawatt hour
kWh – kilowatt hour
NALEDI – National Labour and Economic Development Institute
SERI – Socio Economic Rights Institute
UCT – University of Cape Town
1. EXECUTIVE SUMMARYThe South African government announced its policy to provide free basic services to the poor in
2000 – the main areas of focus being free basic water, sanitation and energy. With regards to
energy, government has focused mostly on electricity supply and in 2003 released the Free Basic
Electricity Policy. The rationale of the Free Basic Electricity (FBE) Policy was to provide “electricity
to all” through the provision of a ‘limited’ amount of free electricity to poor households. Subse-
quently, government decided on an amount of 50kWh per household per month.
On one hand, the policy has been lauded and welcomed as it represents a significant step toward
acknowledging that electricity is an important aspect to alleviating poverty. On the other, the policy
has led to debates on the amount of electricity being allocated and the method of rolling-out the free
electricity. In addition, there have been numerous challenges including a lack of consistency in the
way Eskom and local government are rolling-out the free allowance of electricity. For example, in
some areas, such as the Ekurhuleni Metropolitan Municipality, 100kWh of free electricity (instead of
the 50kWh proposed in the policy) is being provided to all households. Other areas require house-
holds to register for the free electricity allocation and therefore limited to a few households on the
indigent list. Furthermore, Eskom's current CAPEX programme, rising tariff costs, and spiralling
fossil fuel costs are causes for concern, as the rising costs of energy will leave poor households in
a deepening cycle of poverty and increasing the danger of economic disconnections.
In response to these deep problems and future concerns, Earthlife Africa Johannesburg undertook
this study to evaluate the Department of Energy’s (DoE) policy on free basic electricity, focussing on
the amount of free electricity being provided and the model to roll-out such a policy.
Government has acknowledged the relationship between having energy and alleviating poverty, which
led to the development of the Free Basic Electricity Policy. The Department of Minerals and Energy’s
(DME) Guidelines for FBE states “the provision of electricity supply makes a direct contribution to the
socio-economic well being of the poor, and has a particular incidence on women and female children
who are mainly responsible for carrying firewood, and other energy carriers necessary to maintain a
functional household.” The main aspects of the policy as well as some of the challenges are discussed
in brief, including the imposition of pre-paid meters, the lack of capacity in municipalities to roll-out free
basic electricity and the lack of education and awareness on how to access free electricity.
A vital element of this study is the summary and findings of the community surveys and energy audits
that were conducted over a number of days from 30 October 2009 to 30 November 2009. The energy
audits were carried out by members of the Gender Committee on Energy and Climate Change. The
audits involved thirty households in various parts of Gauteng. Three report-back workshops were held
to monitor the research and to respond to any concerns or queries experienced by the gender forum in
obtaining and understanding the data being collected.
The data obtained was then analysed and used to illustrate that 50kWh per household per month is
insufficient. In addition, an assessment of what 50kWh can be used for and how long this could be used
in a household was undertaken by Dr P Goyns of Enerkey . These results suggest that households
require more than 50kWh per household per month to meet the ‘basic’ needs in poor households. For
example, 4 light bulbs of 60W used for four hours a day for a month will consume 20kWh, an electric
stove that is used for one hour a day for a month uses 42kWh and boiling a kettle at least 30min a day
for a month uses 21kWh.
Based on the findings in this report, Earthlife Africa Johannesburg proposes an amount of 200kWh per
household per month. A funding model provides some insight into the cost of providing 200kWh to each
household. In addition, it motivates for a stepped-block tariff as a way forward and as a means to
partially finance Free Basic Electricity. The report proposes that other finance required for FBE should
be obtained from levies, taxes and cross-subsidisation.
It is hoped that this research will be used not only to influence policy in both the Executive and Legisla-
tive Branches of National Government but also to adapt and support policy making in municipalities
and Eskom, where it supplies electricity directly to households.
The DME was split after the national elections in 2009. Energy now falls under the Department of Energy
The EnerKey project is a South African – German collaboration, which aims to develop and implement innovative pathways and projects
in urban energy supply and use in order to improve the sustainability in the region of Gauteng, South Africa
The report foregrounds the links between energy and poverty. Without access to energy, poor house-
holds are unable to access basic necessities including cooking, heating, studying, lighting, communica-
tion, etc. Thus the report is framed by the notion that energy should be a fundamental right - an aspect
that is not covered completely in the Constitution. The legal and constitutional analysis, provided by the
Socio-Economic Rights Institute, explores this in some detail and states that there is a strongly implied
right to electricity in both international and South African domestic law.
6

2. INTRODUCTION
The notion of electricity as a basic human right is becoming more widely accepted and adopted in
countries across the globe. However the debate is now shifting from whether it is a right to what does
that mean for different governments. The South African government released its policy on Free Basic
Electricity in 2003. This report evaluates the FBE policy in South Africa by analysing the amount of
FBE provided as well as the manner in which it is being rolled-out.
The background provides insight into the importance of providing energy as a way of alleviating pov-
erty. It also alludes to the legal aspects of electricity. The next section explores government’s policy
on Free Basic Electricity highlighting the challenges and methods of implementation.
Section 5 summarises the research undertaken to assess whether 50kWh is sufficient. The two
methods used of energy audits and a desktop study are described in brief. The findings conclude that
200kWh should be provided per month per household for free.
Section 6 proposes a funding model to achieve a realistic roll-out of free basic electricity. One of the
main methods to fund FBE would be to utilise a step-block tariff (a rising tariff with increasing electric-
ity use).
7

3. BACKGROUND
“Ending energy poverty holds a vital key to ending absolute poverty.”
3.1. Electricity is fundamental to upliftment
Electricity is a key component to alleviating poverty. Electricity is used in almost every aspect of life. It is
necessary for cooking, storing food, space heating, information, lighting etc. Without sufficient electricity,
poor households cannot sufficiently respond to aspects of health, welfare, education and safety. There
are an estimated 1.6 billion people across the globe that lack access to electricity. Africa is the region of
the lowest electrification rate of only 25-30% in urban areas and only 6% in rural areas having access to
electricity . Interestingly, 75% of Africa’s population live in rural areas and thus more than 50% of the con-
tinent is living without electricity.
3
Cures Report (2009). Exploring Energy Poverty in South Africa.
http://www.g8energy2009.it/pdf/27.05/G8_Africa_Energy_Poverty_May9_Final_JS_clean.pdf
8
4
4
3

Cures Report (2009). Exploring Energy Poverty in South Africa.
Anthony Egan and Alex Wafer (2004), The Soweto Electrcity Crisis Committee, http://www.ukzn.ac.za/ccs/. (Retrieved November 16, 2009)
Cures Report (2009). Exploring Energy Poverty in South Africa.
Cures Report (2009). Exploring Energy Poverty in South Africa.
Agama Energy (2003). Employment Potential of Renewable Energy in South Africa.
UNDP (2005). www.undp.org/energyandenvironment/. (Retrieved January 2010)
Dugard, J. (2008). Power to the People?: A rights based analysis of electricity services in South Africa.
DME (1998). White Paper on the Energy Policy of the Republic of South Africa 9
Even though the picture for South Africa is less dismal, poor homes continue to face challenges accessing
electricity. South Africa, unlike many parts of the continent is largely electrified. Urban electrification rates
sits at about 80% while rural electrification rates are between 50% and 60%.
There are approximately 2.5 million rural and urban households that are not connected to the electricity
grid. In addition there are millions more who have been ‘cut off’ due to their inability to pay. Therefore
although the percentage of electrification is quite high compared to the rest of the continent, the poor are
unable to afford enough electricity to impact on the quality of their lives. Socio-economically, South Africa
is largely unequal. The poorest 50% of South Africans continue to receive only 3.3% of the national income
and 45% are considered poor to very poor. In addition, 40% of households have a family income of less
than R1000 per month. With such low family incomes, it is concerning that poorer urban homes in SA
spend between 12% and 20% of household income on energy. In contrast high-income urban homes
spend approximately 6% of their income on energy.
Furthermore, the lack of access to electricity and the increasing costs, forces most poor households to
depend on various energy sources for cooking, lighting, heating, etc. Interestingly, multiple fuel use applies
to homes that are electrified as well as unelectrified. The implication of this is that having access to electric-
ity does not necessarily mean that people can afford it. Poor homes will use electricity for lighting but rely
on paraffin or wood for heating and cooking. There are over 4 million who do not cook with electricity, 2
million households rely on candles for lighting, and over 50% of households rely to some extent on wood
fuel. The use of paraffin, wood and candles is not only expensive but also a health risk as they can result
in high levels of respiratory illness, burns and fires. Approximately 80 000 children are poisoned from acci-
dently drinking paraffin each year and paraffin related incidents cost the economy R104 billion annually .
Moreover, a significant amount of time is spent on energy related activities – especially for women and
young girls who spend as much as 6 hours a day gathering fuel-wood, water and cooking. It is thus
accepted that access to electricity improves the level of welfare and improves opportunities for low-income
families, and women in particular.
The South African government also acknowledges the close connection between access to energy and
poverty alleviation. It is this acceptance of the relationship between poverty alleviation and electricity
access that prompted the South African government to develop a policy on free basic services including
energy. In 2007, the then Deputy Minister of Minerals and Energy Ms S. Shabangu wrote that “energy is
the life-blood of development and that development is about reducing poverty and about increasing access
to basic needs so as to allow people the freedom of self-development.”
This analysis was submitted by J Dugard and is based on, and draws from, a chapter by J Dugard (2008),
entitled “Power to the People? A rights-based analysis of South Africa’s electricity services”, in D McDonald (ed)
Electric Capitalism: Reconnecting Africa on the Power Grid (HSRC Press). Jackie Dugard writes in her capacity
as Executive Director of Socio-Economic Rights Institute.
Section 27(1)(b) of the Constitution
Section 26(1) of the Constitution
3.2. A right to electricity
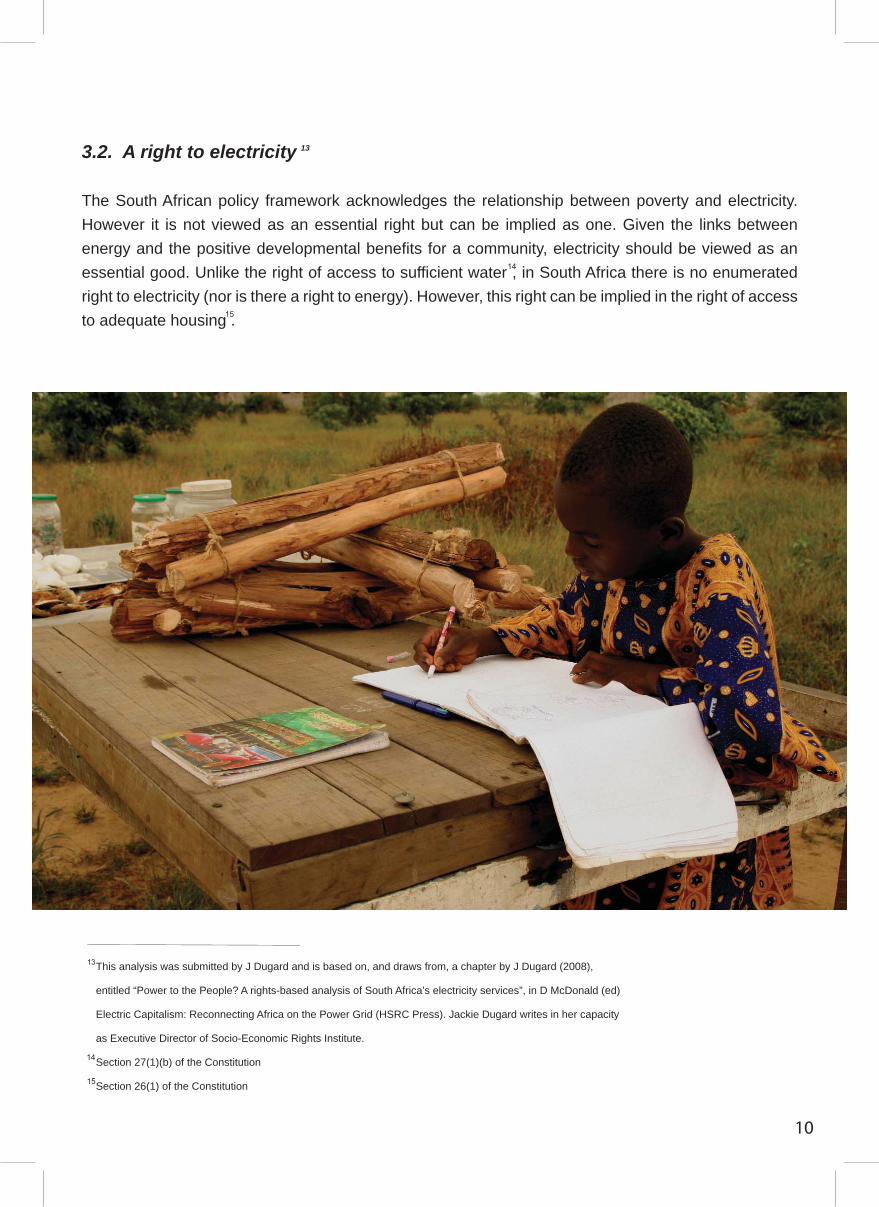
The South African policy framework acknowledges the relationship between poverty and electricity.
However it is not viewed as an essential right but can be implied as one. Given the links between
energy and the positive developmental benefits for a community, electricity should be viewed as an
essential good. Unlike the right of access to sufficient water , in South Africa there is no enumerated
right to electricity (nor is there a right to energy). However, this right can be implied in the right of access
to adequate housing .
13
10

The constitutional court declared in a landmark socio-economics rights case that the right to housing
implies more than merely having a roof over your head . According to the Court, the “state’s obliga-
tion to provide adequate housing depends on context, and may differ from province to province, from
city to city, from rural to urban areas and from person to person” and while “some may need access
to land and no more … some may need access to services such as water, sewage, electricity and
roads” . This means that, in the Court’s view, one of the factors relevant to a consideration of the right
to housing is electricity provision.
This interpretation of an implied right to electricity is supported in international law by the United
Nations Committee on Economic, Social and Cultural Rights (CESCR), which monitors compliance
with the International Covenant on Economic, Social and Cultural Rights (ICESCR). With respect to
the right to adequate housing (1991), the CESCR has stipulated, “all beneficiaries of the right to
adequate housing should have sustainable access” to “energy for cooking, heating and lighting”.
Although the reference is to energy rather than electricity specifically, the United Nations Special
Rapporteur on adequate housing, Miloon Kothari, has clarified in his reports that the right to
adequate housing “includes access to essential civic services such as electricity” .
Moreover, this right to energy is further entrenched through the Convention on the Elimination of All
Forms of Discrimination Against Women (1979), which states:
States Parties shall take all appropriate measures to eliminate discrimination against women in rural areas … to ensure
… the right … to enjoy adequate living conditions, particularly in relation to housing, sanitation, electricity and water
supply …
However despite being a signatory, South Africa has never ratified the ICESCR. Nonetheless, Sec-
tion 39(1)(b) of the Constitution stipulates that, when interpreting the Bill of Rights, a court “must con-
sider international law”. The Constitutional Court has established that, for the purposes of interpreta-
tion, “international law would include non-binding as well as binding law” . It is consequently clear
that the ICESCR is relevant to the interpretation of socio-economic rights in South Africa. Taken
together, there is therefore a strongly implied right to electricity in international and South African
domestic law.
The inference of an implied right to electricity is that it is subject to the same obligations as the other
socio-economic rights in the Bill of Rights; requiring the state to take “reasonable legislative and
other measures, within its available resources, to achieve the progressive realisation of the right” .
Government of the Republic of South Africa v Grootboom (2000).
Grootboom, para 37
Tully, S. (2006). “The contribution of human rights to universal energy access”.
S v Makwanyane 1995, para 35
Section 27(2) of the Constitution
11
12
Therefore government programmes must “respond to the needs of the most desperate” and must
ensure that social and economic rights are “made more accessible not only to a larger number of
people but to a wider range of people as time progresses”. Such pronouncements by the Constitu-
tional Court in the context of an implied right to electricity suggest that the state is constitutionally
obliged to provide more electricity to more people, but especially to vulnerable groups such as the
poor, over time.
This proposal is strengthened by the inclusion of electricity in the governments “free basic services”
package. Arguably, the allocation of FBE to qualifying households, alongside Free Basic Water, is an
implicit acknowledgement of a right to “sufficient” electricity along the same lines as the Constitutional
right of everyone to “access to sufficient food and water” .
Against the backdrop of apartheid’s legacy of unequal municipal services provision based on unfair
discrimination on the grounds of race (and, concomitantly, on class), section 9(2) enjoins the state to
take “legislative and other measures designed to protect or advance persons, or categories of
persons, disadvantaged by unfair discrimination”. In the case of City Council of Pretoria v Walker
(1998) the Constitutional Court clarified that positive discrimination policies aimed at correcting past
inequalities between formerly advantaged and disadvantaged groups do not amount to unfair
discrimination. Indeed, such essentially redistributive policies, designed to promote the achievement
of socio-economic equality, are not only permitted, they are constitutionally mandated. In relation to
electricity services, this means that the state is obliged to ensure that positive steps are taken to make
electricity increasingly accessible and affordable to poor people. In other words, the right to equality
of electricity services incorporates the right to redistributive policies and practices that aim to redress
socio-economic inequality.
Importantly for this rights-based analysis, section 16(1)(e) of the new Electricity Regulation Act allows
for “the cross-subsidy of tariffs to certain classes of customers”, which clearly permits the kind of
redistributive pricing policies that advance socio-economic equality.
In terms of service delivery, electricity, along with the other basic services (including water, sanitation,
and refuse collection), is governed by the overall policy framework for municipal service delivery,
which stresses the need to advance equal services to all members of the local community. Such
equality-focused imperatives are directly relevant to practices around tariff setting, FBE and customer
services.
Section 27(2) of the Constitution , paras 44-45
Section 27(1)(b)
Regardless of the commercialisation of Eskom and municipal electricity entities such as City Power (which operates in Johannesburg),
electricity remains a public service that is 100% state-owned. As such, all policy choices by the state in relation to electricity distribution
must comply with the section 9 right to equality. This right obliges the state to ensure that electricity provision is equal in the sense that
there should be no unfair discrimination between groups on any ground, including those listed in section 9(3) ). Going beyond this, section
9(2) requires the state to take steps to “promote the achievement of equality”. As such the imposition of pre-paid meters and current
limitations could be viewed as unfair and unequal.
Such criteria suggest that, where they fail to advance socio-economic equality and/or to redress pov-
erty, electricity services may be legally challenged.
Electricity as an implied right is thus imperative to ensuring that electricity is provided to all in an equita-
ble and just process. The implied right to electricity combined with the Free Basic Services policy
established the foundation that led to the development of the FBE policy.
4. GOVERNMENT POLICY – FREE BASIC SERVICES
In 2000, the South Africa government announced its policy to provide free basic services of water,
sanitation and energy to poor households. The FBE policy was released three years later and was
intended to ensure that a basic supply of electricity is made available free to the poor. Eskom supplies
about half the number of customers in South Africa and therefore Local Government together with
Eskom assume the major responsibility for the implementation of the policy.
13
Department of Minerals and Energy, (2003)24
The policy states that “an allocation of 50kWh per month be provided to all poor households con-
nected to the national electricity grid.” The amount is based on the UCT study that suggests that
on average “56% of households consume no more than 50kWh per month. This amount is deemed
sufficient energy to provide basic services for a poor household – basic lighting, Tv and radio, basic
ironing and basic cooking.”
For customers who are not connected to the grid, an allocation of up to 80% subsidy of the monthly
service fee will be provided for customers with non-grid systems.
In terms of the grid-connected households, there are two approaches suggested by the policy. The
first is a broad-based approach, which refers to the implementation of an agreed allocation of free
basic electricity to all legal household connections. The second is a self-targeted approach, which
has two possible methods of implementation. The self-targeted approach either requires that the
‘poor households’ apply for a current-limited electricity supply and then become eligible for the free
basic electricity allocation or that the responsible electricity Service Provider identifies households
consuming, on average, less than a pre-determined amount of electricity per month and then auto-
matically apply the free basic electricity allocation to such households. The DME has recom-
mended a ‘Self-Targeted Approach’ for the implementation of the first phase of the FBE roll-out as
it is supposedly “more accurately able to target the poor and would be less costly to implement and
fund.”
In terms of funding the FBE, the policy places the final responsibility for funding and implementa-
tion on the national government. It also alludes to cross-subsidisation and taxes from high electric-
ity consumers. In general the intention of the FBE policy seems to be positive and if rolled-out
correctly could be a useful instrument in addressing poverty alleviation. However, despite the
efforts of government, there are several challenges in the policy and its implementation.
14
4.1. Policy Challenges and Implementation Constraints
The first challenge relates to the 50kWh of free electricity proposed in the policy. In particular this section
focuses on whether this amount is reasonable to impact on the quality of life in poor communities. The
second reviews the use of pre-paid meters that are required in order for poor homes to access the free
electricity. The third challenge deals with the limits in the current that is being provided. A detailed desk-
top assessment provides evidence of the constraints of limiting the amount of current used. Finally, this
section reviews the various constraints with the methods of implementation proposed in the FBE policy.
4.1.1. 50kWh
The decision to allocate an amount of only 50kWh was based on the findings in the UCT study, which
suggested that 56% of homes use less than 50kWh per month. The study implied that 50kWh is suffi-
cient to provide basic lighting, TV, radio, ironing and cooking for a poor household. However the UCT
study does not expand on whether people use the small amount because 50kWh is sufficient for house-
holds or because they cannot afford to pay for more electricity. From the study, 50kWh is insufficient to
create a better life.
In addition, as stated previously, most poor households rely on more than one source for energy. Thus
it is possible that people would use the 50kWh for lighting but continue to use paraffin, coal and wood.
The intention of the policy was to ensure that a limited amount of electricity improved people’s lives and
that the health impacts and risks of fires are no longer a concern in their lives. Given that many people
still need to rely on additional sources of energy, 50kWh may not be sufficient to improve living condi-
tions. The Cures Report (2009) refers to an interview with Professor Anton Eberhard (Graduate School
of Business, University of Cape Town) who states “the 50 kWh amount is probably not suitable for urban
areas with big households and multiple energy demands, not least because the FBE amount does not
take into account the typically large sizes of low-income urban households.” Thus the limitations of the
UCT research raises concerns about the use of its findings to inform decisions about what constitutes a
suitable amount of free electricity.
15
16
4.1.2. Pre-paid meters
The FBE policy stipulates that indigent homes applying for free basic electricty will have to be fitted with
a pre-paid meter. The imposition of a pre-paid meter system is a further source of inequality in access
to energy. The irony then is that people have to buy vouchers to activate the free basic allowance.
Given the uncertainty of income in poor households, they are often unable to buy vouchers and as a
result homes are left without electricity. In addition, the unit cost of electricity is higher for those using a
pre-paid meter – almost 72c/kWh as compared to metered customers who pay approximately
59c/kWh.
4.1.3. 20 Ampere (Amp) limit
The policy states that poor households “generally have a low demand for electricity” and thus their
needs could adequately be met by restricting the current drawn from their supply to about 20 Amperes.
The limited current restricts what appliances can be used and often runs the risk of tripping the electric-
ity. As highlighted in the background, the implied right to electricity obliges the state to ensure that elec-
tricity provision is equal. This means that everyone should receive an equal and an equitable standard
of service. There should be no unfair discrimination between groups on any ground.
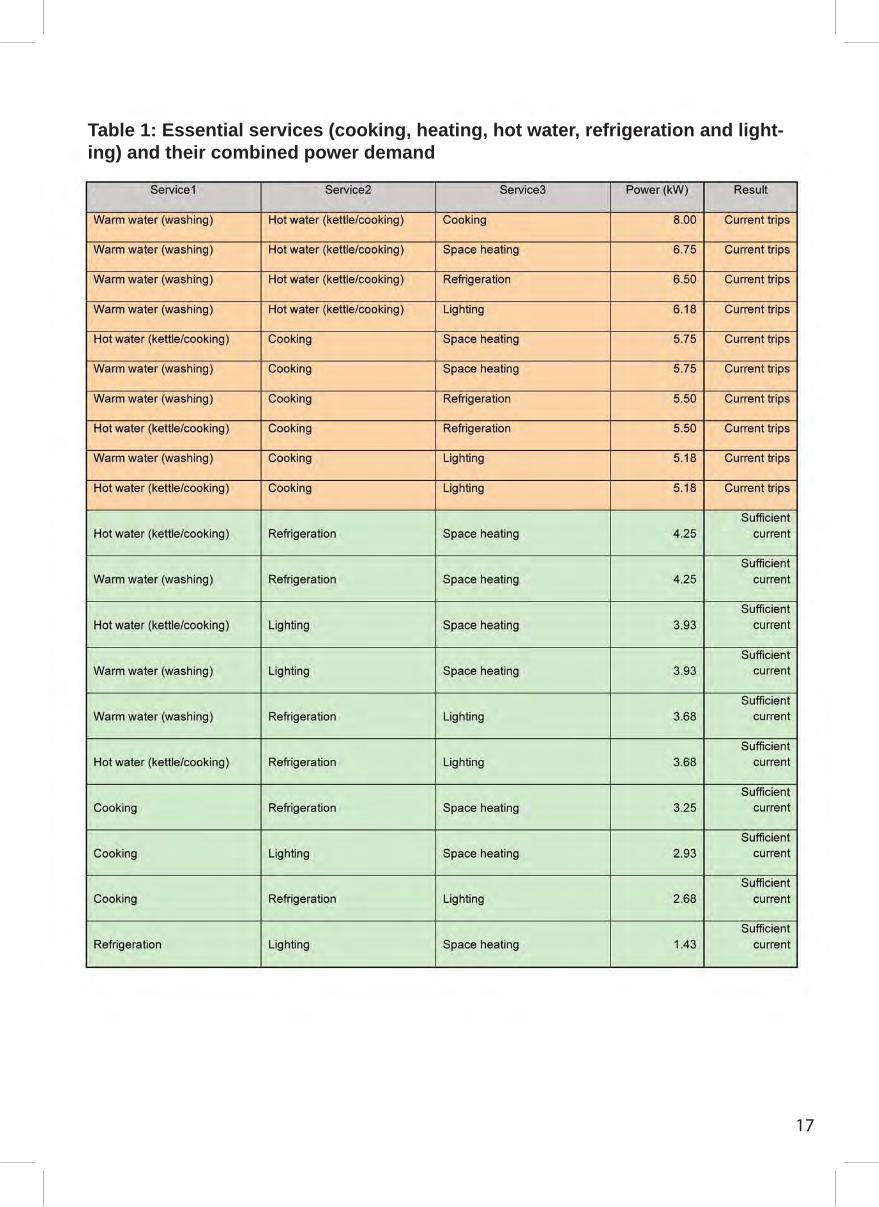
Dr Goyns assessed the impacts of using a 20Amp current limitation. Such a limit in current limits the
maximum power demand to approximately 4.5 kW. Table 1 provides all possible combinations of any
three of the essential services used in households to calculate a combined power demand for the
simultaneous use of these services. In other words, what appliances can be simultaneously used in a
home using a 20Amp limitation before the current trips? The results are shown in the next page.
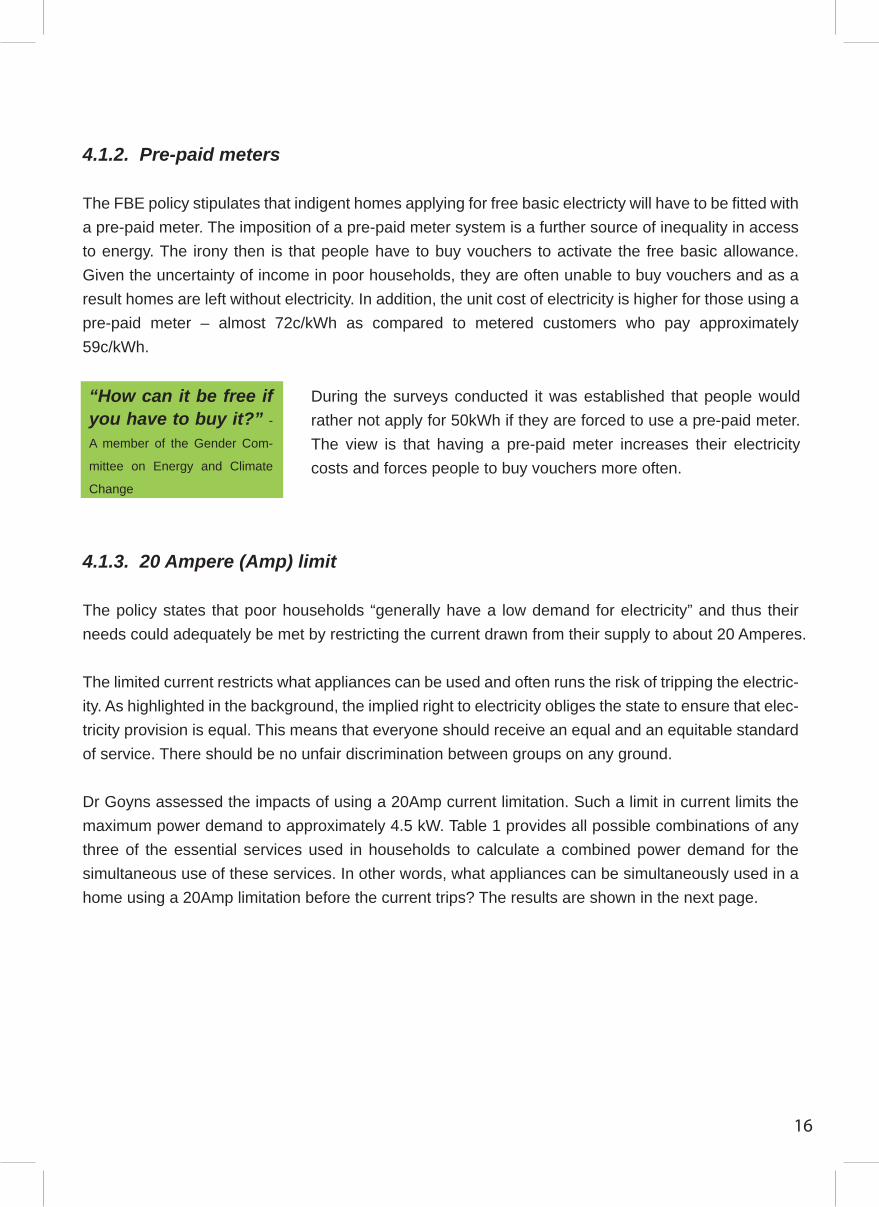
“How can it be free if you have to buy it?” -
A member of the Gender Com-
mittee on Energy and Climate
Change
During the surveys conducted it was established that people would
rather not apply for 50kWh if they are forced to use a pre-paid meter.
The view is that having a pre-paid meter increases their electricity
costs and forces people to buy vouchers more often.
17
Table 1: Essential services (cooking, heating, hot water, refrigeration and light-ing) and their combined power demand

Communication with Gauteng DLGH, January 2010 (DLGH, 2010)
18
The results in Table 1 show that half the possible combinations of heating services (cooking, heating
water, geysers) used simultaneously will result in exceeding or almost exceeding the 20 Amp limit of
4.5kW.
From the results the question to be asked is: Will the combination of services which result in exceeding
the current limitation occur in reality? This can be answered from surveys but it is probable that a kettle
can be boiled while food is being cooked and a heater is on, or that children may be bathed before cook-
ing resulting in the element in a geyser switching on during cooking.
The 20 Amp limit places restrictions, which are likely to inconvenience the low-income household in the
domestic tasks they may need to perform. In cases where thermostat controlled geysers are used there
may be frustrations due to not knowing when electricity is being used by the geyser and the use of other
devices would result in tripping the power.
4.1.4. Implementation
As with most policies, on paper they may look good but in practice there are difficulties. The FBE policy
is no different in this regard. There are four key implementation challenges that hinder the success of the
project roll-out. First is the lack of consistency in rolling-out FBE. The second problem is the lack of
capacity at local government level. The self-targeting approach is the next hindrance to implementation
as if forces people to use a system of pre-paid meters and current limiting technology. Finally, there is
insufficient education and training for both communities and electricity providers, aspects that were men-
tioned during the community surveys as well as communication with the Gauteng Department of Local
Government and Housing (DLGH).
First there is a high level of inconsistency in terms of roll-out of the project across the country. This is due
to the fact that there are different agents responsible for implementation in different areas or regions and
these agents don’t seem to stick to the same guidelines or standards. As mentioned previously, the
responsibility for the implementation of the policy lies with both local government and Eskom. The
manner in which FBE is rolled-out differs between areas being powered by the municipalities and those
being powered by Eskom. This has resulted in different services being provided. For example, some
areas receive 50kWh if registered with the municipality as an indigent home, while in places such as
Ekurhuleni Metropolitan Municipality, all customers are provided with 100kWh of FBE and others yet only
receive FBE if they change to pre-paid meters and current limiting technology.
Second the lack of local government capacity is a big obstacle to the implementation of the policy. Within
municipalities there seems to exist confusion as to whose responsibility it is to administer FBE. So for
example, there is confusion as to whether FBS reside in the Chief Financial Operator’s (CFO) office or
in the technical department. In some municipalities there are no structures to roll-out FBE.
Third the approach of self-targeting is another aspect of the policy that affects implementation. The policy
defines self-targeting as “a system whereby a household approaches the service provider, indicating the
intention to be considered for benefitting from the Free Basic Electricity programme.” Ironically, many of
the households interviewed implied that approaching the service provider means that their current will be
limited and that a pre-paid meter will be installed resulting in higher costs.
Fourth communities are often unaware of the availability of FBE. In addition, local authorities and Eskom
do not provide sufficient information to the technologies being used. As such there is inadequate commu-
nication and education with regards to the technology and service options available for communities.
19

5. RESEARCH AND FINDINGS
In order to explore some of these issues in further detail, the research embarked on a study to assess
the amount of electricity being used in homes. The study found that 50kWh is insufficient to provide
people with the basic requirements in a home.
20
21
Dr P Goyns provided a desktop analysis of energy use in his capacity as the coordinator of the Enerkey project in Gauteng. The
Enerkey project is an energy related partnership between Germany and South Africa.
5.1. Methodology
The selection of a research methodology is informed by the nature of question that needs to be
explored. In this instance the key research questions were:
• Is 50kWh of FBE sufficient?
• What amount of free electricity is reasonable?
In order to answer these questions, 30 homes were identified to provide a non-quantitative study. While
a quantitative study would have been better, this would have cost an alarming amount of money and
taken an extra-ordinary long time to complete. Under the circumstances an assessment of select
number of households would be sufficient to indicate whether 50kWh is adequate.
The analysis of the 50kWh allocation included two assessments. The first was an energy audit of 30
homes in Gauteng. The number of homes selected was due to the number of women in the Gender
Committee on Energy and Climate Change. The homes were located in low-income urban areas
including, Evaton, Kwa-Thema, Soshanguve, Winterveld, Alexandra, Khutsong, Soweto and Thokoza.
The houses ranged from RDP homes to electrified informal settlements.
The audits were carried out by the Gender Committee on Energy and Climate Change and were con-
ducted over a specific number of days. Numerous workshops were held to monitor the research and to
respond to any concerns or queries experienced by the gender forum in obtaining and understanding
the data being collected. Importantly, many of the women who participated in the research had
intimated that their understanding of energy use had increased and that they were more aware of how
to save energy and thus save their money. This aspect may have impacted on the final amount of elec-
tricity normally used in the homes and the figures may thus be less than before the research began.
Most of the women (75%) who participated in the research head the households and thus were ideally
situated to obtain the data required for the energy audits.
The second aspect of the research included a desk top study compiled by Dr P Goyns specifically on
what 50kWh can be used for and for how long. In addition, this part of the research assesses the
impacts of using a 20Amp current limitation. The process followed was to divide the 50kWh monthly
allowance into a daily consumption of 1.64kWh and then to consider what this would contribute to the
estimated energy consumption of the household.

5.2. Energy Audit Findings
The preliminary findings of the household surveys indicate that the average number of people per
home was five, with most homes headed by women. The type of homes ranged from RDP homes to
formal settlements and bonded homes. In general, most homes had an average monthly income of
R1300.00. Many homes did not have a stable source of income and thus this figure changes on a
monthly basis. The childcare and old age grants are vital to the survival of many families as it is often
the only source of income. There were only a few (approximately 25%) who had access to the FBE
allocation, while majority of the participating homes were using prepaid meters (65%). On average,
homes with pre-paid meters were purchasing electricity vouchers valued at R120.00 every week. In
general the amount spent on electricity depended on household income and varied from R100 to more
than R800. On average households spent about R310 a month on energy. Furthermore, it was very
clear that 50kWh per month is not sufficient to improve people’s basic living. The audits illustrated that
homes use on average 750kWh per month, which means that the free allocation is a mere 6.6% of
monthly electricity use. In households without geysers, approximately 500kWh to 600kWh is con-
sumed, while households with geysers consume between 900kWh and 1300kWh of energy.
Most of the electricity is used for cooking, refrigeration, water heating, and lighting. In cases where
homes have electric geysers, the audits showed that the bulk of energy (approximately 40%) is used
by geysers. The second major user of energy was used for cooking where in some cases was respon-
sible for almost 35% of energy use. The study was conducted during a warm period in South Africa and
thus the audits did not ascertain the amount of energy that would be used for space heating, which can
also be a substantial user of energy.
5.3. Desktop Findings
Dr Philip Goyns conducted a desktop study on what 50kWh can be used for and for how long. The
process followed was to divide the 50kWh monthly allowance into a daily consumption of 1.64kWh and
then to consider what this would contribute to the estimated energy consumption of the household.
Appliance information used was taken from the Eskom energy efficiency and demand side manage-
ment website. Additional appliances were added using typical power values from labels on house
appliances.
Appliances were grouped into nine services representing groups of activities that consume electricity
in the household. The services include: space heating; cleaning; communication/information; enter-
tainment; lighting; hot water (kettle/cooking); cooking; warm water (washing); and refrigeration.
An initial estimate of energy demand is calculated in Table 2 from the average power demand of the
nine services multiplied by the number of devices and an estimate of the number of hours they are
used per day.
22

Table 2: Basic services and their energy demand
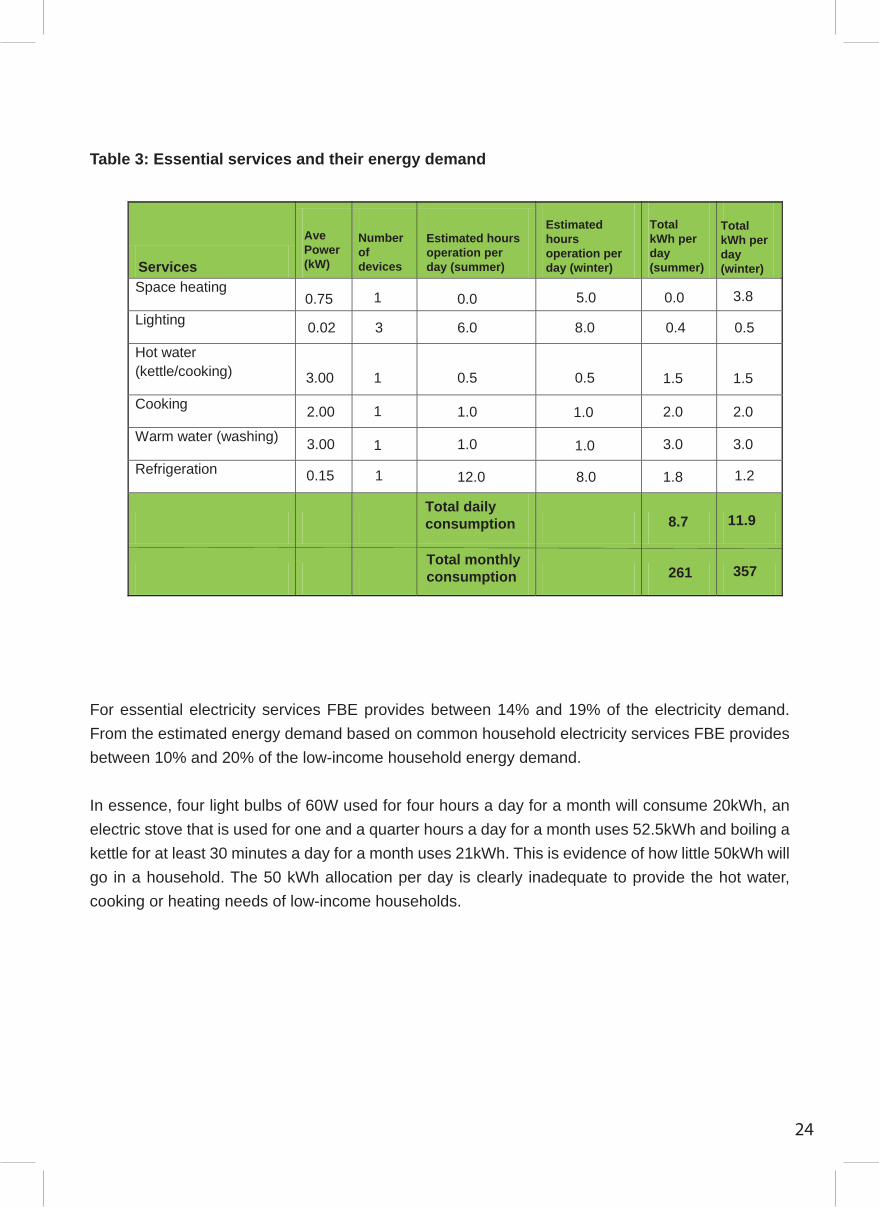
From the results in Table 2 the allowance of 1.64 kWh per day provides between 11% and 15% of
the required energy depending on the season. A second calculation was performed excluding non-
essential energy services. The services included and the results are shown in Table 3.
23
2
10.7
AvePower(kW)
Numberofdevices
Estimated hoursoperation perday (summer)
Estimated hoursoperation perday (winter)
TotalkWh perday(summer)
TotalkWh perday(winter)Services
Space heating
Cleaning
Communication/Information
Entertainment
Lighting
Hot Water (Kettle/Cooking)
Cooking
Warm Water (Washing)
Refrigeration
0.75 1 0.0 5.0 0.0
1.20 1 0.1 0.1 0.1 0.1
0.45 1 2.0 2.0 0.9 0.9
0.20 1 5.0 5.0 1.0 1.0
0.02 3 6.0 8.0 0.4 0.5
3.00 1 0.5 0.5 1.5 1.5
2.00 1 1.0 1.0 2.0 2.0
3.00 1 1.0 1.0 3.0 3.0
0.15 1 12.0 8.0 1.8 1.2
Total dailyconsumption 14.0
420 321Total monthlyconsumption
3.8
24
Space heating 0.75 1 0.0 5.0 0.0 3.8
Lighting 0.02 3 6.0 8.0 0.4 0.5
Hot water (kettle/cooking) 3.00 1 0.5 0.5 1.5 1.5
Cooking 2.00 1 1.0 1.0 2.0 2.0
Warm water (washing) 3.00 1 1.0 1.0 3.0 3.0
Refrigeration 0.15 1 12.0 8.0 1.8 1.2
8.7 11.9
261 357
AvePower(kW)
Numberofdevices
Estimated hoursoperation perday (summer)
Estimated hoursoperation perday (winter)
TotalkWh perday(summer)
TotalkWh perday(winter)Services
Total dailyconsumption
Total monthlyconsumption
Table 3: Essential services and their energy demand
For essential electricity services FBE provides between 14% and 19% of the electricity demand.
From the estimated energy demand based on common household electricity services FBE provides
between 10% and 20% of the low-income household energy demand.
In essence, four light bulbs of 60W used for four hours a day for a month will consume 20kWh, an
electric stove that is used for one and a quarter hours a day for a month uses 52.5kWh and boiling a
kettle for at least 30 minutes a day for a month uses 21kWh. This is evidence of how little 50kWh will
go in a household. The 50 kWh allocation per day is clearly inadequate to provide the hot water,
cooking or heating needs of low-income households.
5.4. Revised FBE for Eskom
It is clear from both the community surveys and desktop assessment that 50kWh per household per
month is insufficient to meet basic needs. The policy is important to uplift the lives of millions of poor
people; however, 50kWh will not achieve that goal. Earthlife Africa Jhb proposes that a minimum of
50kWh per household be provided per week. This will amount to a minimum of 200kWh per household
per month and amounts to only 26% of the monthly average of 750kWh calculated in the energy
surveys. Although this figure is still a bit low, it will be a bit more realistic in terms of what people need
to improve their lives and within the capacity of the current system to provide. In addition, Earthlife
proposes that this amount be given to all households with an increasing step-block tariff. Thus once
200kWh has been consumed then households will be charged according to their use.
The counter argument will probably revolve around the lack of electricity available to give the amount
to all households as well as the cost of providing free electricity. Both of these are dealt with in the
section below.
25

6. FUNDING MODEL
Department of Minerals and Energy, 2003
Eskom Summary of residential users 2008-2009, Annexure28
26
Earthlife Africa Johannesburg is proposing that 200kWh of free electricity be provided to all house-
holds each month. In 2002, the Department of Minerals and Energy stated that there were 6.4 million
households connected to the national grid. Eskom provides electricity to 4,163,263 households
according to Eskom’s 2008-2009 figures (See Annexure).
The FBE model proposed will equate to an increase of capacity from 8,263 GWh to 13,499GWh,
resulting in an additional 5,236GWh of electricity that will have to be sourced. Roughly, this amounts
to 17.5% of Medupi’s capacity or 50% of government’s renewable energy target. It must be noted that
relative to Megaflex users this amount is very small. Megaflex users consume 66% (146,189GWh) of
all electricity generated from Eskom's 13 coal-fired power stations (222,908GWh).
Furthermore, the model will result in a loss of earnings of approximately R1,586 billion to Eskom. It is
suggested that high energy users, especially industry, pay according to the amount of electricity used
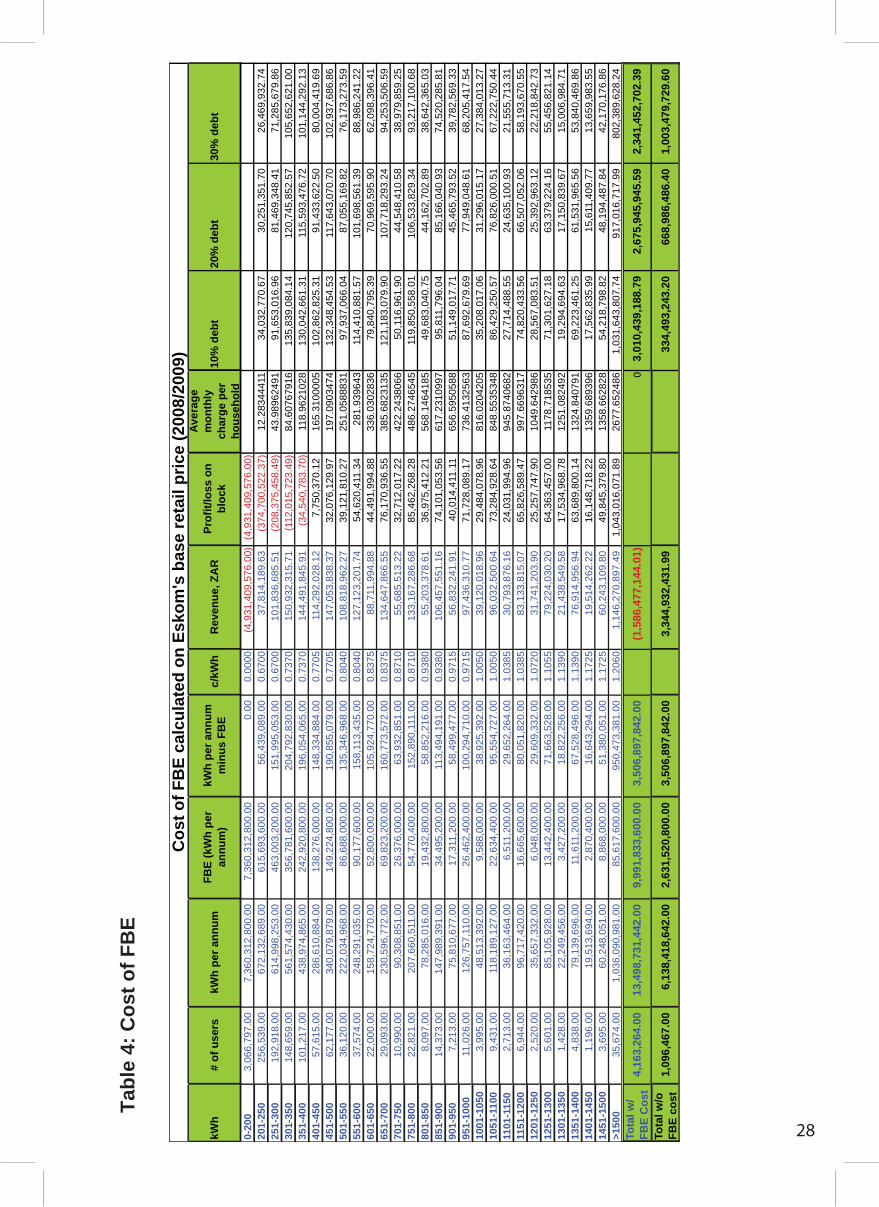
– the more you use the more you pay. Table 4 (below) provides a breakdown of the number of elec-
tricity users relative to the amount of electricity being used. The bulk of residential energy use is in
the 0 to 400 kWh range. The model proposes that the first 200kWh be provided free to all users after
which a step block tariff is implemented.
The cost was based on an average of the base retail price (R0.67) in 2008/2009 received from
Eskom. The step block tariff proposed increases every 100kWh. The first increase is 10% above the
base cost; thereafter the increase is 5% every 100kWh. As such, high-usage domestic users will be
subsidising low-usage domestic users. In this way, high level domestic users will be penalised for
their high usage while at the same time will have an incentive to reduce their use thus reducing peak
demand.
The bulk of Eskom’s new build (R1.3 trillion in total) will be used to meet the needs of large industry
users, yet the returns gained from sale to them are too low to fund new build in any meaningful
manner. It is thus proposed that there must be meaningful cross-subsidisation of low energy users.
For example, if bulk Megaflex users have to pay a 1.5c levy, it would amount to R2,193 billion – more
than enough to fund the FBE. Moreover the environmental levy being paid by Eskom could also be
directed to funding FBE. The 2009/2010 amount was R3,647 billion.
28
27
The costing structure outlined in this report starts with the assumption that Eskom would receive 100%
payment from domestic consumers. The rationale behind the assumption is that repayment is an
operational issue within Eskom (or a municipality) and not a specific policy issue. However, it is
reasonable to expect, even in the best run system, a level of default on payment for one reason or
another. The following indicates the cost of FBE given an average default on payments of 10%, 20%
and 30% for illustrative purposes:
1. With an average default rate of 10% per block, Eskom revenue would drop by a total of
R334million
2. With an average default rate of 20% per block, Eskom revenue would drop by a total of
R667million
3. With an average default rate of 30% per block, Eskom revenue would drop by a total of
R1billion
The other major factor in the cost structure of FBE with a rising block tariff is elasticity within consump-
tion patterns. It is probable that individuals (especially high-income users) will seek to reduce their
consumption through a variety of energy efficiency measures, such as solar water geysers, insulation,
PV panels, more efficient lights and appliances, heat pumps, natural gas, etc. This would have obvi-
ous financial impacts on revenue. However, reducing consumption would be one of the primary ben-
efits of the proposed system, as reductions in capacity requirements (especially peak power require-
ments) would be to the overall benefit. Also, there would be a boost to the domestic energy efficiency
sector and job creation within it.
In order to deal with elasticity issues, any proposed rising block tariff structure would have to be
reviewed and adapted on a yearly basis for the first three years of operation. This would enable fine-
tuning in response to customer adaptation and behaviour change.
The South African government often refers to “building a world class” city, country or province. The
definition of “world class” mostly relates to large infrastructure projects and deals such as the hosting
of the World Cup in “world class” stadia or creating a “world class” broadband link as being done by
Siemens and City of Johannesburg and costing at least R1 billion. In trying to reach this goal of “world
class”, government always manages to find funds for these large projects. However, when it comes to
socio-economic challenges, it seems as if the projects lack the same kind of enthusiasm. A “world
class” place should be one that has no hunger or poverty, no unemployment. As such government
should explore all options to fund such projects with the same passion and enthusiasm as seen in
relation to the World Cup.
Tab
le 4
: C
ost
of
FB
E
28kWh
# o
f u
sers
kWh
per
an
nu
mF
BE
(kW
h p
er
ann
um
)kW
h p
er a
nn
um
m
inu
s F
BE
c/kW
hR
even
ue,
ZA
RP
rofi
t/lo
ss o
n
blo
ck
Ave
rag
e m
on
thly
ch
arg
e p
er
ho
use
ho
ld
10%
deb
t20
% d
ebt
30%
deb
t
0-20
03,
066,
797.
007,
360,
312,
800.
007,
360,
312,
800.
000.
000.
0000
(4,9
31,4
09,5
76.0
0)(4
,931
,409
,576
.00)
201-
250
256,
539.
0067
2,13
2,68
9.00
615,
693,
600.
0056
,439
,089
.00
0.67
0037
,814
,189
.63
(374
,700
,522
.37)
12.2
8344
411
34,0
32,7
70.6
730
,251
,351
.70
26,4
69,9
32.7
425
1-30
019
2,91
8.00
614,
998,
253.
0046
3,00
3,20
0.00
151,
995,
053.
000.
6700
101,
836,
685.
51(2
08,3
75,4
58.4
9)43
.989
6249
191
,653
,016
.96
81,4
69,3
48.4
171
,285
,679
.86
301-
350
148,
659.
0056
1,57
4,43
0.00
356,
781,
600.
0020
4,79
2,83
0.00
0.73
7015
0,93
2,31
5.71
(112
,015
,723
.49)
84.6
0767
916
135,
839,
084.
1412
0,74
5,85
2.57
105,
652,
621.
0035
1-40
010
1,21
7.00
438,
974,
865.
0024
2,92
0,80
0.00
196,
054,
065.
000.
7370
144,
491,
845.
91(3
4,54
0,78
3.70
)11
8.96
2102
813
0,04
2,66
1.31
115,
593,
476.
7210
1,14
4,29
2.13
401-
450
57,6
15.0
028
6,61
0,88
4.00
138,
276,
000.
0014
8,33
4,88
4.00
0.77
0511
4,29
2,02
8.12
7,75
0,37
0.12
165.
3100
005
102,
862,
825.
3191
,433
,622
.50
80,0
04,4
19.6
945
1-50
062
,177
.00
340,
079,
879.
0014
9,22
4,80
0.00
190,
855,
079.
000.
7705
147,
053,
838.
3732
,076
,129
.97
197.
0903
474
132,
348,
454.
5311
7,64
3,07
0.70
102,
937,
686.
8650
1-55
036
,120
.00
222,
034,
968.
0086
,688
,000
.00
135,
346,
968.
000.
8040
108,
818,
962.
2739
,121
,810
.27
251.
0588
831
97,9
37,0
66.0
487
,055
,169
.82
76,1
73,2
73.5
955
1-60
037
,574
.00
248,
291,
035.
0090
,177
,600
.00
158,
113,
435.
000.
8040
127,
123,
201.
7454
,620
,411
.34
281.
9396
4311
4,41
0,88
1.57
101,
698,
561.
3988
,986
,241
.22
601-
650
22,0
00.0
015
8,72
4,77
0.00
52,8
00,0
00.0
010
5,92
4,77
0.00
0.83
7588
,711
,994
.88
44,4
91,9
94.8
833
6.03
0283
679
,840
,795
.39
70,9
69,5
95.9
062
,098
,396
.41
651-
700
29,0
93.0
023
0,59
6,77
2.00
69,8
23,2
00.0
016
0,77
3,57
2.00
0.83
7513
4,64
7,86
6.55
76,1
70,9
36.5
538
5.68
2313
512
1,18
3,07
9.90
107,
718,
293.
2494
,253
,506
.59
701-
750
10,9
90.0
090
,308
,851
.00
26,3
76,0
00.0
063
,932
,851
.00
0.87
1055
,685
,513
.22
32,7
12,0
17.2
242
2.24
3806
650
,116
,961
.90
44,5
48,4
10.5
838
,979
,859
.25
751-
800
22,8
21.0
020
7,66
0,51
1.00
54,7
70,4
00.0
015
2,89
0,11
1.00
0.87
1013
3,16
7,28
6.68
85,4
62,2
68.2
848
6.27
4654
511
9,85
0,55
8.01
106,
533,
829.
3493
,217
,100
.68
801-
850
8,09
7.00
78,2
85,0
16.0
019
,432
,800
.00
58,8
52,2
16.0
00.
9380
55,2
03,3
78.6
136
,975
,412
.21
568.
1464
185
49,6
83,0
40.7
544
,162
,702
.89
38,6
42,3
65.0
385
1-90
014
,373
.00
147,
989,
391.
0034
,495
,200
.00
113,
494,
191.
000.
9380
106,
457,
551.
1674
,101
,053
.56
617.
2310
997
95,8
11,7
96.0
485
,166
,040
.93
74,5
20,2
85.8
190
1-95
07,
213.
0075
,810
,677
.00
17,3
11,2
00.0
058
,499
,477
.00
0.97
1556
,832
,241
.91
40,0
14,4
11.1
165
6.59
5058
851
,149
,017
.71
45,4
65,7
93.5
239
,782
,569
.33
951-
1000
11,0
26.0
012
6,75
7,11
0.00
26,4
62,4
00.0
010
0,29
4,71
0.00
0.97
1597
,436
,310
.77
71,7
28,0
89.1
773
6.41
3256
387
,692
,679
.69
77,9
49,0
48.6
168
,205
,417
.54
1001
-105
03,
995.
0048
,513
,392
.00
9,58
8,00
0.00
38,9
25,3
92.0
01.
0050
39,1
20,0
18.9
629
,484
,078
.96
816.
0204
205
35,2
08,0
17.0
631
,296
,015
.17
27,3
84,0
13.2
710
51-1
100
9,43
1.00
118,
189,
127.
0022
,634
,400
.00
95,5
54,7
27.0
01.
0050
96,0
32,5
00.6
473
,284
,928
.64
848.
5535
348
86,4
29,2
50.5
776
,826
,000
.51
67,2
22,7
50.4
411
01-1
150
2,71
3.00
36,1
63,4
64.0
06,
511,
200.
0029
,652
,264
.00
1.03
8530
,793
,876
.16
24,0
31,9
94.9
694
5.87
4068
227
,714
,488
.55
24,6
35,1
00.9
321
,555
,713
.31
1151
-120
06,
944.
0096
,717
,420
.00
16,6
65,6
00.0
080
,051
,820
.00
1.03
8583
,133
,815
.07
65,8
26,5
89.4
799
7.66
9631
774
,820
,433
.56
66,5
07,0
52.0
658
,193
,670
.55
1201
-125
02,
520.
0035
,657
,332
.00
6,04
8,00
0.00
29,6
09,3
32.0
01.
0720
31,7
41,2
03.9
025
,257
,747
.90
1049
.642
986
28,5
67,0
83.5
125
,392
,963
.12
22,2
18,8
42.7
312
51-1
300
5,60
1.00
85,1
05,9
28.0
013
,442
,400
.00
71,6
63,5
28.0
01.
1055
79,2
24,0
30.2
064
,363
,457
.00
1178
.718
535
71,3
01,6
27.1
863
,379
,224
.16
55,4
56,8
21.1
413
01-1
350
1,42
8.00
22,2
49,4
56.0
03,
427,
200.
0018
,822
,256
.00
1.13
9021
,438
,549
.58
17,5
34,9
68.7
812
51.0
8249
219
,294
,694
.63
17,1
50,8
39.6
715
,006
,984
.71
1351
-140
04,
838.
0079
,139
,696
.00
11,6
11,2
00.0
067
,528
,496
.00
1.13
9076
,914
,956
.94
63,6
89,8
00.1
413
24.8
4079
169
,223
,461
.25
61,5
31,9
65.5
653
,840
,469
.86
1401
-145
01,
196.
0019
,513
,694
.00
2,87
0,40
0.00
16,6
43,2
94.0
01.
1725
19,5
14,2
62.2
216
,148
,718
.22
1359
.689
396
17,5
62,8
35.9
915
,611
,409
.77
13,6
59,9
83.5
514
51-1
500
3,69
5.00
60,2
48,0
51.0
08,
868,
000.
0051
,380
,051
.00
1.17
2560
,243
,109
.80
49,8
45,3
79.8
013
58.6
6282
854
,218
,798
.82
48,1
94,4
87.8
442
,170
,176
.86
>15
0035
,674
.00
1,03
6,09
0,98
1.00
85,6
17,6
00.0
095
0,47
3,38
1.00
1.20
601,
146,
270,
897.
491,
043,
016,
071.
8926
77.6
5248
61,
031,
643,
807.
7491
7,01
6,71
7.99
802,
389,
628.
24
Tota
l w/
FB
E C
ost
4,16
3,26
4.00
13,4
98,7
31,4
42.0
09,
991,
833,
600.
003,
506,
897,
842.
00(1
,586
,477
,144
.01)
03,
010,
439,
188.
792,
675,
945,
945.
592,
341,
452,
702.
39
Tota
l w/o
F
BE
co
st1,
096,
467.
006,
138,
418,
642.
002,
631,
520,
800.
003,
506,
897,
842.
003,
344,
932,
431.
9933
4,49
3,24
3.20
668,
986,
486.
401,
003,
479,
729.
60
Co
st o
f F
BE
cal
cula
ted
on
Esk
om
's b
ase
reta
il p
rice
(20
08/2
009)

7. CONCLUSION
Poverty alleviation is an important challenge for the country. The links between poverty and energy are
clear. As such the policy on free basic electricity is an important key to uplifting the poor. However, the
policy’s proposed 50kWh is insufficient to improve people’s lives as demonstrated by both the surveys
and desktop analysis. Instead of a policy taking a lead to positive change, it has resulted in stagnating
any hope of growth or development.
Earthlife Africa believes that a minimum of 200kWh per household per month is needed in order to
start making significant changes in poor people’s lives. The existing method of providing free electric-
ity has had some challenges including an incomplete indigent list, resistance to using pre-paid meters
and limiting current. It is thus proposed that all households be provided with FBE with an increasing
step block tariff based on the amount of electricity used. The shortfall should be obtained through
cross-subsidisation, levies and taxes. It is through ensuring that people’s lives are significantly better
that the war on poverty can be overcome.
29

8. BIBLIOGRAPHY
Agama Energy (2003). Employment Potential of Renewable Energy in South Africa . Johannesburg: The Sustainable Energy and
Climate Change Partnership of Earthlife Africa.
Anthony Egan and Alex Wafer (2004). The Soweto Electrcity Crisis Committee, http://www.ukzn.ac.za/ccs/. (Retrieved November 16,
2009)
Cures. (2009). Exploring Energy Poverty in South Africa. Cures Discussion Document .
Davie, K. (2009, November - December 27-3). Kilowatts at your fingertips. Mail and Guardian .
Department of Minerals and Energy. (2003). Electricity Basic Services Support Tariff (Free Basic Electrcity) Policy. Department of
Minerals and Energy.
Department of Local Government and Housing. Telephone conversation with R Musiyariwa (2010, January 18).
DME. (2003). Guidelines for the Introduction of Free Basic Electricity Service. DME.
DME. (1998). White Paper on the Energy Policy of the Republic of South Africa. Pretoria: DME.
Dugard, J. (2008). Power to the People?: A rights based analysis of electricity services in South Africa.
Earthlife Africa Johannesburg. (2009). SE Briefing: Eskom costs and tariffs. Sustainable Energy Briefing 18 . Johannesburg.
Eberhard, A. (2004, April). (PESD, Stanford University) Retrieved November 15, 2009, from http://pesd.stanford.edu.
Eberhard, A. (2004, July 29).
http://fsi.stanford.edu/news/electricity_reform_in_south_africa_is_at_a_crtical_juncture_says_anton_eberhard_20040831. Retrieved
November 17, 2009
Edited by Mark Butler and David Hallowes. (2002). The cost of living: how selling basic services excludes the poor. Durban: Groundwork.
Fiil-Flynn, M. (2001). "The electricity crisis in Soweto”. Occasional Paper no. 4. Cape Town: Municipal Services Project (MSP).
Gaunt, C. T. (2003). Meeting electrification's social objectives in South Africa, and implications for developing countries.
http://www.sciencedirect.com/science Retrieved November 15, 2009
Hallowes, D. (2009). The World bank and Eskom: Banking on Climate Destruction. Groundwork Report . Pietermaritzburg: groundWork.
Kothari, M. (2002). “Report of the Special Rapporteur on adequate housing as a component of the right to an adequate standard of
living”. United Nations Commission on Human Rights E/CN.4/2002/59.
Kumar, A. (2009). http://www.engineeringreview.com.pk/Articles.htm. Retrieved November 16, 2009
Mark Howells, D. G. (2005, July). Working Paper number 42. (PESD, Stanford University) Retrieved November 15, 2009, from
http://pesd.standford.edu.
Nefale, M. a. (2003). “Promoting access to affordable electricity: Comments on the draft Electricity Distribution Industry Restructuring
Bill”. Economic & Social Rights (ESR) Review 4, no. 4.
Stephen Davis, A. H. (2008, August). Working Paper number 80. (PESD, Stanford University) Retrieved November 16, 2009, from
http://pesd.stanford.edu.
Tully, S. (2006). “The contribution of human rights to universal energy access”. . Northwestern University Journal of International Human
Rights 4.
UCT, Eskom, & DME. (2002). Options for a Basic Electricity Support Tariff: Analysis, issues and recommendations.
UNDP. (2005, August). Retrieved January 2010, from www.undp.org/energyandenvironment/.
World Economic Forum. Energy and Poverty. http://www.weforum.org/en/initiatives/EnergyPovertyAction/index.htm. Retrieved February
01, 2010
30

ANNEXUREThe tables were obtained from Eskom and provide statistics of residential electricity use
for 2008/2009.
31
Total for all residential tariffs exl Homepower Bulk
Total for all residential tariffs exl Homepower Bulk
1. Total consumption per annum
2. Average consumption per month
3. Average no of customers
4. Average consumption per month
5. Total revenue (R)
6. Average payment per customer (R)
7. Average price (c/kWh)
0-50 110,518,672 9,209,889 1,629,374 6 R 5,597,399 R 3.44 60.7851-100 471,356,520 39,279,710 541,093 73 R 25,518,924 R 47.16 64.97101-150 745,114,374 62,092,864 505,473 123 R 38,438,878 R 76.05 61.91151-200 798,329,958 66,527,497 390,857 170 R 42,150,667 R 107.84 63.36201-250 672,132,689 56,011,057 256,539 218 R 34,734,698 R 135.40 62.01251-300 614,998,253 51,249,854 192,918 266 R 33,163,637 R 171.91 64.71301-350 561,574,430 46,797,869 148,659 315 R 29,291,446 R 197.04 62.59351-400 438,974,865 36,581,239 101,217 361 R 24,380,002 R 240.87 66.65401-450 286,610,884 23,884,240 57,615 415 R 14,856,302 R 257.85 62.20451-500 340,079,879 28,339,990 62,177 456 R 19,195,526 R 308.72 67.73501-550 222,034,968 18,502,914 36,120 512 R 11,575,137 R 320.47 62.56551-600 248,291,035 20,690,920 37,574 551 R 13,923,389 R 370.56 67.29601-650 158,724,770 13,227,064 22,000 601 R 8,405,619 R 382.08 63.55651-700 230,596,772 19,216,398 29,093 661 R 12,756,664 R 438.48 66.38701-750 90,308,851 7,525,738 10,990 685 R 4,686,254 R 426.41 62.27751-800 207,660,511 17,305,043 22,821 758 R 11,400,079 R 499.54 65.88801-850 78,285,016 6,523,751 8,097 806 R 4,049,106 R 500.07 62.07851-900 147,989,391 12,332,449 14,373 858 R 7,982,395 R 555.37 64.73901-950 75,810,677 6,317,556 7,213 876 R 4,004,179 R 555.15 63.38951-1000 126,757,110 10,563,092 11,026 958 R 6,771,797 R 614.15 64.111001-1050 48,513,392 4,042,783 3,995 1012 R 2,487,575 R 622.65 61.531051-1100 118,189,127 9,849,094 9,431 1044 R 6,258,498 R 663.58 63.541101-1150 36,163,464 3,013,622 2,713 1111 R 1,864,321 R 687.26 61.861151-1200 96,717,420 8,059,785 6,944 1161 R 5,037,978 R 725.57 62.511201-1250 35,657,332 2,971,444 2,520 1179 R 1,872,812 R 743.13 63.031251-1300 85,105,928 7,092,161 5,601 1266 R 4,405,308 R 786.57 62.121301-1350 22,249,456 1,854,121 1,428 1298 R 1,149,744 R 805.05 62.011351-1400 79,139,696 6,594,975 4,838 1363 R 3,883,940 R 802.76 58.891401-1450 19,513,694 1,626,141 1,196 1360 R 1,006,012 R 841.50 61.861451-1500 60,248,051 5,020,671 3,695 1359 R 3,307,461 R 895.24 65.88>1500 1,036,090,981 86,340,915 35,674 2420 R 51,535,238 R 1,444.64 59.69Total 8,263,738,167 688,644,847 4,163,263 165 R 435,690,987 R 104.65 63.27
32
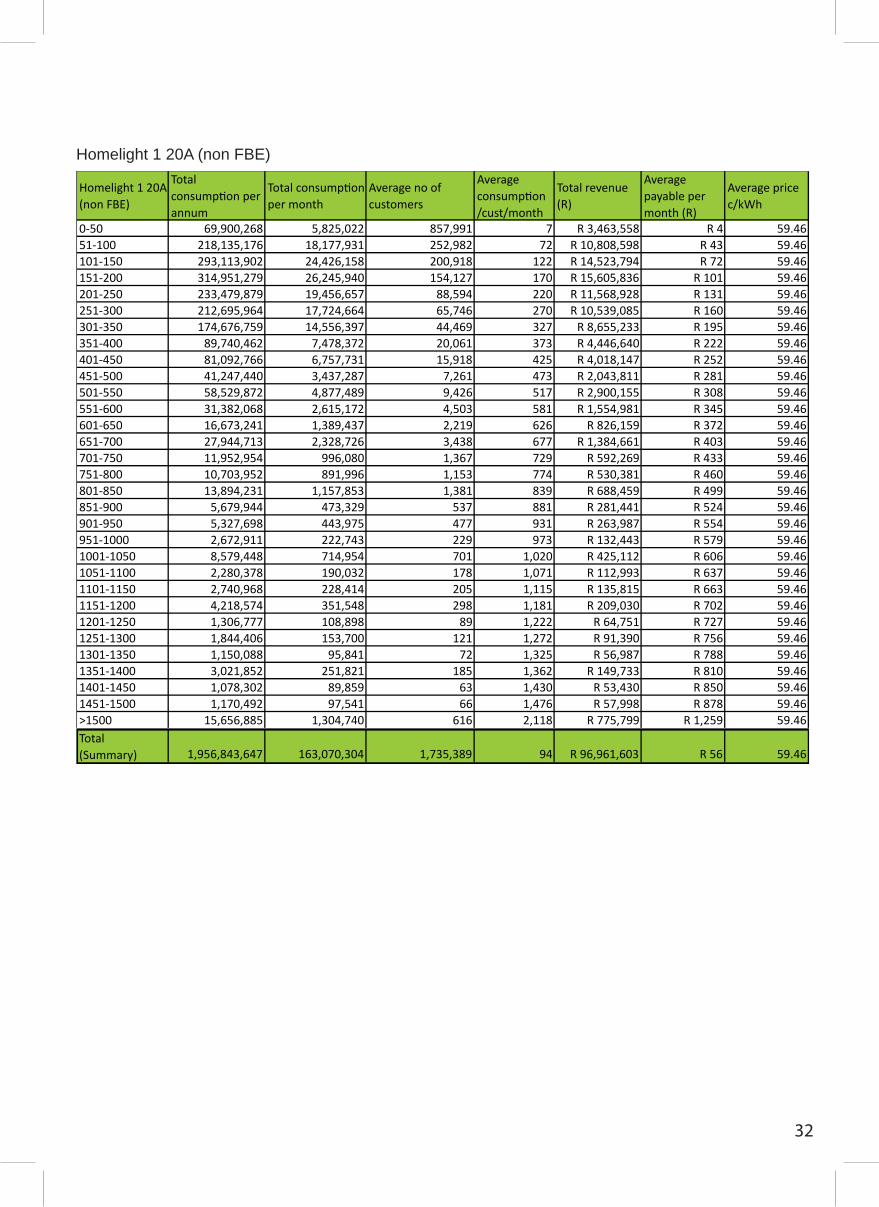
Homelight 1 20A (non FBE)
Homelight 1 20A (non FBE)
Total consumption per annum
Total consumption per month
Average no of customers
Average consumption /cust/month
Total revenue (R)
Average payable per month (R)
Average price c/kWh
0-50 69,900,268 5,825,022 857,991 7 R 3,463,558 R 4 59.4651-100 218,135,176 18,177,931 252,982 72 R 10,808,598 R 43 59.46101-150 293,113,902 24,426,158 200,918 122 R 14,523,794 R 72 59.46151-200 314,951,279 26,245,940 154,127 170 R 15,605,836 R 101 59.46201-250 233,479,879 19,456,657 88,594 220 R 11,568,928 R 131 59.46251-300 212,695,964 17,724,664 65,746 270 R 10,539,085 R 160 59.46301-350 174,676,759 14,556,397 44,469 327 R 8,655,233 R 195 59.46351-400 89,740,462 7,478,372 20,061 373 R 4,446,640 R 222 59.46401-450 81,092,766 6,757,731 15,918 425 R 4,018,147 R 252 59.46451-500 41,247,440 3,437,287 7,261 473 R 2,043,811 R 281 59.46501-550 58,529,872 4,877,489 9,426 517 R 2,900,155 R 308 59.46551-600 31,382,068 2,615,172 4,503 581 R 1,554,981 R 345 59.46601-650 16,673,241 1,389,437 2,219 626 R 826,159 R 372 59.46651-700 27,944,713 2,328,726 3,438 677 R 1,384,661 R 403 59.46701-750 11,952,954 996,080 1,367 729 R 592,269 R 433 59.46751-800 10,703,952 891,996 1,153 774 R 530,381 R 460 59.46801-850 13,894,231 1,157,853 1,381 839 R 688,459 R 499 59.46851-900 5,679,944 473,329 537 881 R 281,441 R 524 59.46901-950 5,327,698 443,975 477 931 R 263,987 R 554 59.46951-1000 2,672,911 222,743 229 973 R 132,443 R 579 59.461001-1050 8,579,448 714,954 701 1,020 R 425,112 R 606 59.461051-1100 2,280,378 190,032 178 1,071 R 112,993 R 637 59.461101-1150 2,740,968 228,414 205 1,115 R 135,815 R 663 59.461151-1200 4,218,574 351,548 298 1,181 R 209,030 R 702 59.461201-1250 1,306,777 108,898 89 1,222 R 64,751 R 727 59.461251-1300 1,844,406 153,700 121 1,272 R 91,390 R 756 59.461301-1350 1,150,088 95,841 72 1,325 R 56,987 R 788 59.461351-1400 3,021,852 251,821 185 1,362 R 149,733 R 810 59.461401-1450 1,078,302 89,859 63 1,430 R 53,430 R 850 59.461451-1500 1,170,492 97,541 66 1,476 R 57,998 R 878 59.46>1500 15,656,885 1,304,740 616 2,118 R 775,799 R 1,259 59.46Total (Summary) 1,956,843,647 163,070,304 1,735,389 94 R 96,961,603 R 56 59.46

33
Homelight 1 20A (FBE)
Homelight 1 20A (FBE)
1. Total consumption per annum
2. Total consumption per month
3. Average no of customers
4. Average consumption /cust/month
5. Total revenue (R)
6. Average payable per month (R)
7. Average price c/kWh
0-50 3,102,935 258,578 239,595 1 R 153,750 R 0 0.0051-100 103,981,364 8,665,114 111,342 78 R 5,152,277 R 17 21.26101-150 167,093,995 13,924,500 114,193 122 R 8,279,507 R 43 35.08151-200 179,708,299 14,975,692 87,670 171 R 8,904,546 R 72 42.06201-250 160,910,825 13,409,235 60,932 220 R 7,973,131 R 101 45.95251-300 120,591,058 10,049,255 37,274 270 R 5,975,287 R 131 48.43301-350 99,210,949 8,267,579 25,789 321 R 4,915,903 R 161 50.19351-400 69,861,930 5,821,828 15,564 374 R 3,461,659 R 193 51.51401-450 52,021,322 4,335,110 10,208 425 R 2,577,657 R 223 52.46451-500 33,843,926 2,820,327 5,947 474 R 1,676,967 R 252 53.19501-550 24,103,426 2,008,619 3,843 523 R 1,194,325 R 281 53.77551-600 20,876,980 1,739,748 3,047 571 R 1,034,454 R 310 54.25601-650 15,842,255 1,320,188 2,112 625 R 784,984 R 342 54.70651-700 9,307,406 775,617 1,146 677 R 461,182 R 373 55.07701-750 8,624,460 718,705 989 727 R 427,342 R 402 55.37751-800 7,027,783 585,649 753 777 R 348,227 R 432 55.64801-850 4,713,459 392,788 475 827 R 233,552 R 462 55.87851-900 4,426,545 368,879 418 883 R 219,335 R 495 56.09901-950 3,148,990 262,416 281 934 R 156,032 R 525 56.28951-1000 1,951,996 162,666 166 980 R 96,721 R 553 56.431001-1050 1,544,140 128,678 126 1,025 R 76,512 R 580 56.561051-1100 2,001,315 166,776 156 1,070 R 99,165 R 607 56.681101-1150 1,587,580 132,298 118 1,119 R 78,665 R 636 56.801151-1200 1,089,404 90,784 78 1,169 R 53,980 R 665 56.921201-1250 1,235,310 102,943 84 1,227 R 61,210 R 700 57.041251-1300 710,900 59,242 46 1,276 R 35,225 R 729 57.131301-1350 591,452 49,288 37 1,323 R 29,306 R 757 57.211351-1400 586,047 48,837 36 1,372 R 29,039 R 786 57.291401-1450 669,921 55,827 39 1,416 R 33,195 R 812 57.361451-1500 605,705 50,475 34 1,470 R 30,013 R 844 57.44>1500 6,043,413 503,618 196 2,576 R 299,451 R 1,502 58.31
Total 1,107,015,089 92,251,257 722,694 128 R 54,852,598 R 46 36.17

34
Homelight 1 60A (non FBE)
Homelight 1 60A (non FBE)
1. Total consumption per annum
2. Total consumption per month
3. Average no of customers
4. Average consumption /cust/month
5. Total revenue (R)
6. Average payable per month (R)
7. Average price c/kWh
0-50 32,208,525 2,684,044 375,972 7 R 1,796,430 R 5 66.9351-100 100,218,690 8,351,557 113,735 73 R 5,589,697 R 49 66.93101-150 188,133,516 15,677,793 120,563 130 R 10,493,147 R 87 66.93151-200 158,644,093 13,220,341 74,832 177 R 8,848,374 R 118 66.93201-250 159,153,039 13,262,753 58,778 226 R 8,876,761 R 151 66.93251-300 126,844,838 10,570,403 39,059 271 R 7,074,771 R 181 66.93301-350 183,760,586 15,313,382 48,540 315 R 10,249,247 R 211 66.93351-400 110,491,193 9,207,599 24,436 377 R 6,162,646 R 252 66.93401-450 65,086,057 5,423,838 12,835 423 R 3,630,175 R 283 66.93451-500 110,424,041 9,202,003 19,790 465 R 6,158,901 R 311 66.93501-550 65,326,537 5,443,878 10,335 527 R 3,643,588 R 353 66.93551-600 39,257,768 3,271,481 5,697 574 R 2,189,602 R 384 66.93601-650 74,600,965 6,216,747 10,128 614 R 4,160,869 R 411 66.93651-700 42,200,832 3,516,736 5,222 673 R 2,353,751 R 451 66.93701-750 24,997,807 2,083,151 2,877 724 R 1,394,253 R 485 66.93751-800 53,472,416 4,456,035 5,818 766 R 2,982,424 R 513 66.93801-850 21,514,491 1,792,874 2,165 828 R 1,199,971 R 554 66.93851-900 15,407,222 1,283,935 1,472 872 R 859,338 R 584 66.93901-950 37,393,611 3,116,134 3,411 914 R 2,085,629 R 611 66.93951-1000 15,100,543 1,258,379 1,285 979 R 842,233 R 655 66.931001-1050 11,488,698 957,391 928 1,031 R 640,782 R 690 66.931051-1100 18,608,939 1,550,745 1,457 1,065 R 1,037,914 R 713 66.931101-1150 10,279,108 856,592 760 1,127 R 573,317 R 755 66.931151-1200 7,062,796 588,566 500 1,177 R 393,927 R 787 66.931201-1250 16,275,691 1,356,308 1,119 1,213 R 907,777 R 812 66.931251-1300 6,896,299 574,692 450 1,278 R 384,641 R 855 66.931301-1350 6,935,391 577,949 438 1,320 R 386,821 R 883 66.931351-1400 9,881,868 823,489 604 1,363 R 551,161 R 913 66.931401-1450 5,835,093 486,258 340 1,429 R 325,452 R 957 66.931451-1500 2,577,209 214,767 145 1,479 R 143,744 R 990 66.93>1500 87,692,395 7,307,700 3,472 2,105 R 4,891,043 R 1,409 66.93
Homelight 1 60A (non FBE) 1,807,770,255 150,647,521 947,161 159 R 100,828,386 R 106 66.93
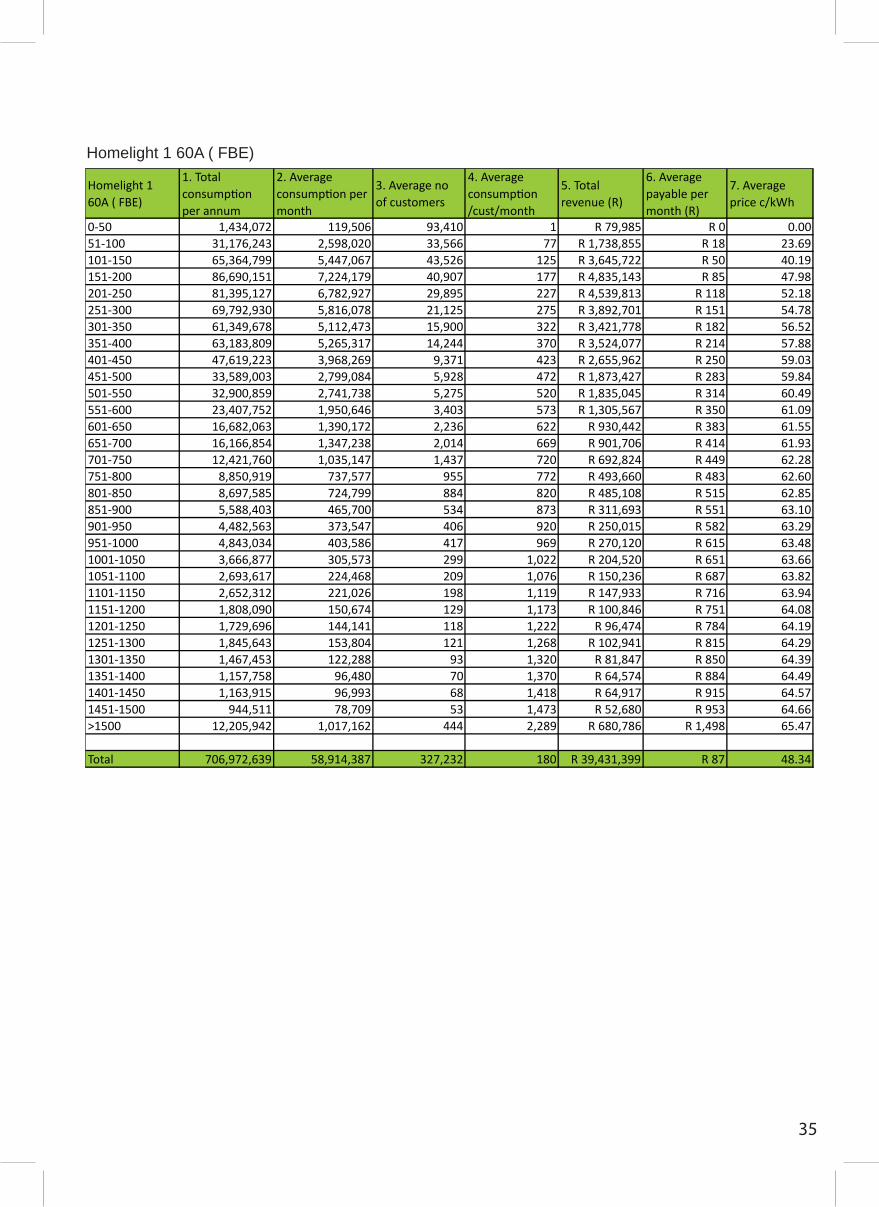
35
Homelight 1 60A ( FBE)
Homelight 1 60A ( FBE)
1. Total consumption per annum
2. Average consumption per month
3. Average no of customers
4. Average consumption /cust/month
5. Total revenue (R)
6. Average payable per month (R)
7. Average price c/kWh
0-50 1,434,072 119,506 93,410 1 R 79,985 R 0 0.0051-100 31,176,243 2,598,020 33,566 77 R 1,738,855 R 18 23.69101-150 65,364,799 5,447,067 43,526 125 R 3,645,722 R 50 40.19151-200 86,690,151 7,224,179 40,907 177 R 4,835,143 R 85 47.98201-250 81,395,127 6,782,927 29,895 227 R 4,539,813 R 118 52.18251-300 69,792,930 5,816,078 21,125 275 R 3,892,701 R 151 54.78301-350 61,349,678 5,112,473 15,900 322 R 3,421,778 R 182 56.52351-400 63,183,809 5,265,317 14,244 370 R 3,524,077 R 214 57.88401-450 47,619,223 3,968,269 9,371 423 R 2,655,962 R 250 59.03451-500 33,589,003 2,799,084 5,928 472 R 1,873,427 R 283 59.84501-550 32,900,859 2,741,738 5,275 520 R 1,835,045 R 314 60.49551-600 23,407,752 1,950,646 3,403 573 R 1,305,567 R 350 61.09601-650 16,682,063 1,390,172 2,236 622 R 930,442 R 383 61.55651-700 16,166,854 1,347,238 2,014 669 R 901,706 R 414 61.93701-750 12,421,760 1,035,147 1,437 720 R 692,824 R 449 62.28751-800 8,850,919 737,577 955 772 R 493,660 R 483 62.60801-850 8,697,585 724,799 884 820 R 485,108 R 515 62.85851-900 5,588,403 465,700 534 873 R 311,693 R 551 63.10901-950 4,482,563 373,547 406 920 R 250,015 R 582 63.29951-1000 4,843,034 403,586 417 969 R 270,120 R 615 63.481001-1050 3,666,877 305,573 299 1,022 R 204,520 R 651 63.661051-1100 2,693,617 224,468 209 1,076 R 150,236 R 687 63.821101-1150 2,652,312 221,026 198 1,119 R 147,933 R 716 63.941151-1200 1,808,090 150,674 129 1,173 R 100,846 R 751 64.081201-1250 1,729,696 144,141 118 1,222 R 96,474 R 784 64.191251-1300 1,845,643 153,804 121 1,268 R 102,941 R 815 64.291301-1350 1,467,453 122,288 93 1,320 R 81,847 R 850 64.391351-1400 1,157,758 96,480 70 1,370 R 64,574 R 884 64.491401-1450 1,163,915 96,993 68 1,418 R 64,917 R 915 64.571451-1500 944,511 78,709 53 1,473 R 52,680 R 953 64.66>1500 12,205,942 1,017,162 444 2,289 R 680,786 R 1,498 65.47
Total 706,972,639 58,914,387 327,232 180 R 39,431,399 R 87 48.34
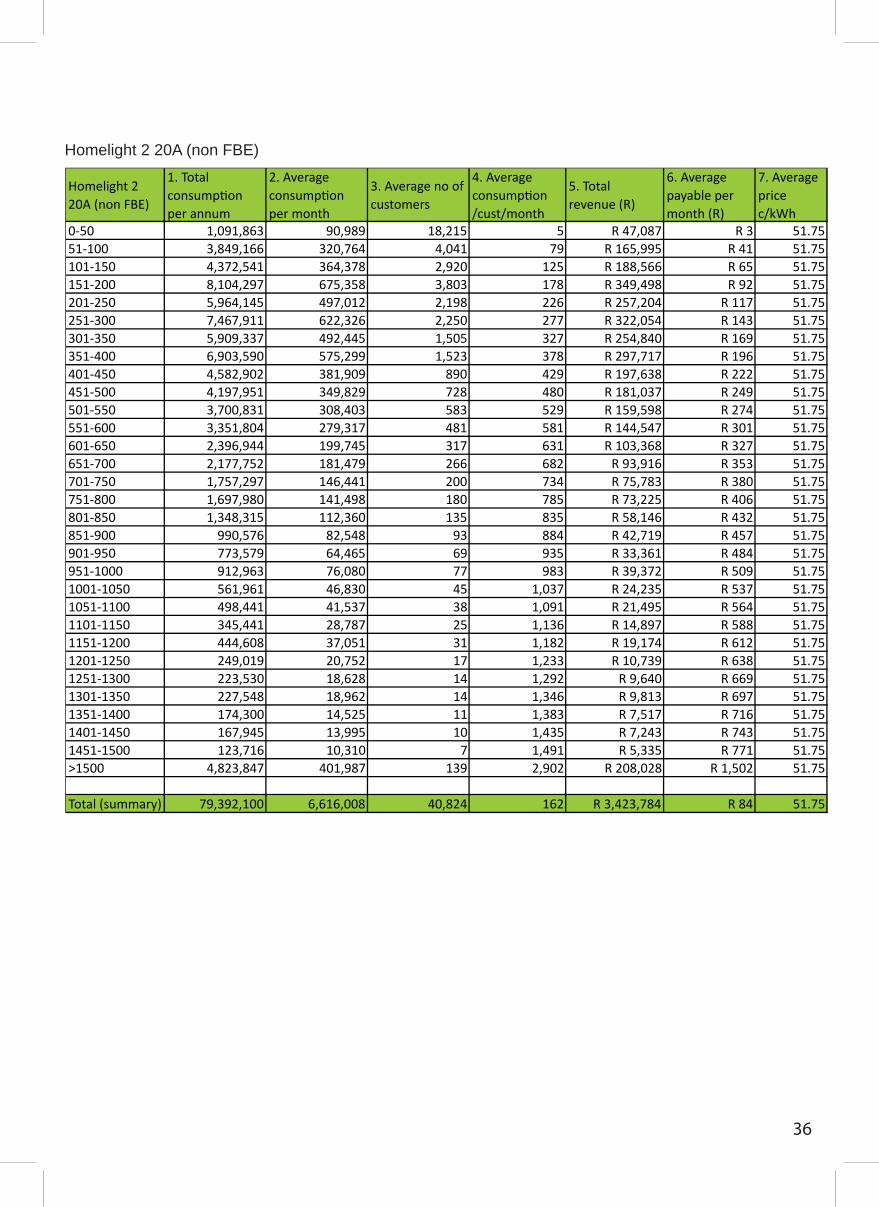
36
Homelight 2 20A (non FBE)
Homelight 2 20A (non FBE)
1. Total consumption per annum
2. Average consumption per month
3. Average no of customers
4. Average consumption /cust/month
5. Total revenue (R)
6. Average payable per month (R)
7. Average price c/kWh
0-50 1,091,863 90,989 18,215 5 R 47,087 R 3 51.7551-100 3,849,166 320,764 4,041 79 R 165,995 R 41 51.75101-150 4,372,541 364,378 2,920 125 R 188,566 R 65 51.75151-200 8,104,297 675,358 3,803 178 R 349,498 R 92 51.75201-250 5,964,145 497,012 2,198 226 R 257,204 R 117 51.75251-300 7,467,911 622,326 2,250 277 R 322,054 R 143 51.75301-350 5,909,337 492,445 1,505 327 R 254,840 R 169 51.75351-400 6,903,590 575,299 1,523 378 R 297,717 R 196 51.75401-450 4,582,902 381,909 890 429 R 197,638 R 222 51.75451-500 4,197,951 349,829 728 480 R 181,037 R 249 51.75501-550 3,700,831 308,403 583 529 R 159,598 R 274 51.75551-600 3,351,804 279,317 481 581 R 144,547 R 301 51.75601-650 2,396,944 199,745 317 631 R 103,368 R 327 51.75651-700 2,177,752 181,479 266 682 R 93,916 R 353 51.75701-750 1,757,297 146,441 200 734 R 75,783 R 380 51.75751-800 1,697,980 141,498 180 785 R 73,225 R 406 51.75801-850 1,348,315 112,360 135 835 R 58,146 R 432 51.75851-900 990,576 82,548 93 884 R 42,719 R 457 51.75901-950 773,579 64,465 69 935 R 33,361 R 484 51.75951-1000 912,963 76,080 77 983 R 39,372 R 509 51.751001-1050 561,961 46,830 45 1,037 R 24,235 R 537 51.751051-1100 498,441 41,537 38 1,091 R 21,495 R 564 51.751101-1150 345,441 28,787 25 1,136 R 14,897 R 588 51.751151-1200 444,608 37,051 31 1,182 R 19,174 R 612 51.751201-1250 249,019 20,752 17 1,233 R 10,739 R 638 51.751251-1300 223,530 18,628 14 1,292 R 9,640 R 669 51.751301-1350 227,548 18,962 14 1,346 R 9,813 R 697 51.751351-1400 174,300 14,525 11 1,383 R 7,517 R 716 51.751401-1450 167,945 13,995 10 1,435 R 7,243 R 743 51.751451-1500 123,716 10,310 7 1,491 R 5,335 R 771 51.75>1500 4,823,847 401,987 139 2,902 R 208,028 R 1,502 51.75
Total (summary) 79,392,100 6,616,008 40,824 162 R 3,423,784 R 84 51.75
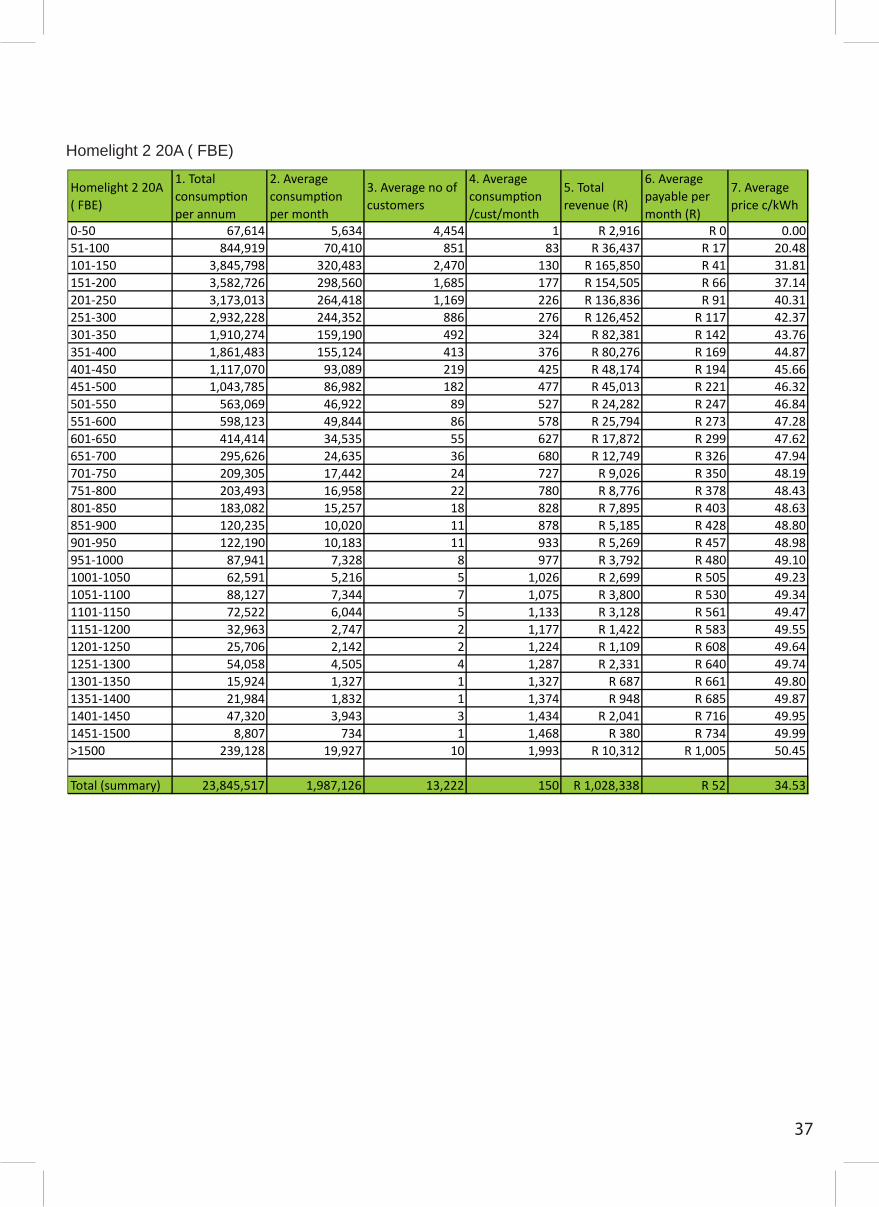
37
Homelight 2 20A ( FBE)
Homelight 2 20A ( FBE)
1. Total consumption per annum
2. Average consumption per month
3. Average no of customers
4. Average consumption /cust/month
5. Total revenue (R)
6. Average payable per month (R)
7. Average price c/kWh
0-50 67,614 5,634 4,454 1 R 2,916 R 0 0.0051-100 844,919 70,410 851 83 R 36,437 R 17 20.48101-150 3,845,798 320,483 2,470 130 R 165,850 R 41 31.81151-200 3,582,726 298,560 1,685 177 R 154,505 R 66 37.14201-250 3,173,013 264,418 1,169 226 R 136,836 R 91 40.31251-300 2,932,228 244,352 886 276 R 126,452 R 117 42.37301-350 1,910,274 159,190 492 324 R 82,381 R 142 43.76351-400 1,861,483 155,124 413 376 R 80,276 R 169 44.87401-450 1,117,070 93,089 219 425 R 48,174 R 194 45.66451-500 1,043,785 86,982 182 477 R 45,013 R 221 46.32501-550 563,069 46,922 89 527 R 24,282 R 247 46.84551-600 598,123 49,844 86 578 R 25,794 R 273 47.28601-650 414,414 34,535 55 627 R 17,872 R 299 47.62651-700 295,626 24,635 36 680 R 12,749 R 326 47.94701-750 209,305 17,442 24 727 R 9,026 R 350 48.19751-800 203,493 16,958 22 780 R 8,776 R 378 48.43801-850 183,082 15,257 18 828 R 7,895 R 403 48.63851-900 120,235 10,020 11 878 R 5,185 R 428 48.80901-950 122,190 10,183 11 933 R 5,269 R 457 48.98951-1000 87,941 7,328 8 977 R 3,792 R 480 49.101001-1050 62,591 5,216 5 1,026 R 2,699 R 505 49.231051-1100 88,127 7,344 7 1,075 R 3,800 R 530 49.341101-1150 72,522 6,044 5 1,133 R 3,128 R 561 49.471151-1200 32,963 2,747 2 1,177 R 1,422 R 583 49.551201-1250 25,706 2,142 2 1,224 R 1,109 R 608 49.641251-1300 54,058 4,505 4 1,287 R 2,331 R 640 49.741301-1350 15,924 1,327 1 1,327 R 687 R 661 49.801351-1400 21,984 1,832 1 1,374 R 948 R 685 49.871401-1450 47,320 3,943 3 1,434 R 2,041 R 716 49.951451-1500 8,807 734 1 1,468 R 380 R 734 49.99>1500 239,128 19,927 10 1,993 R 10,312 R 1,005 50.45
Total (summary) 23,845,517 1,987,126 13,222 150 R 1,028,338 R 52 34.53
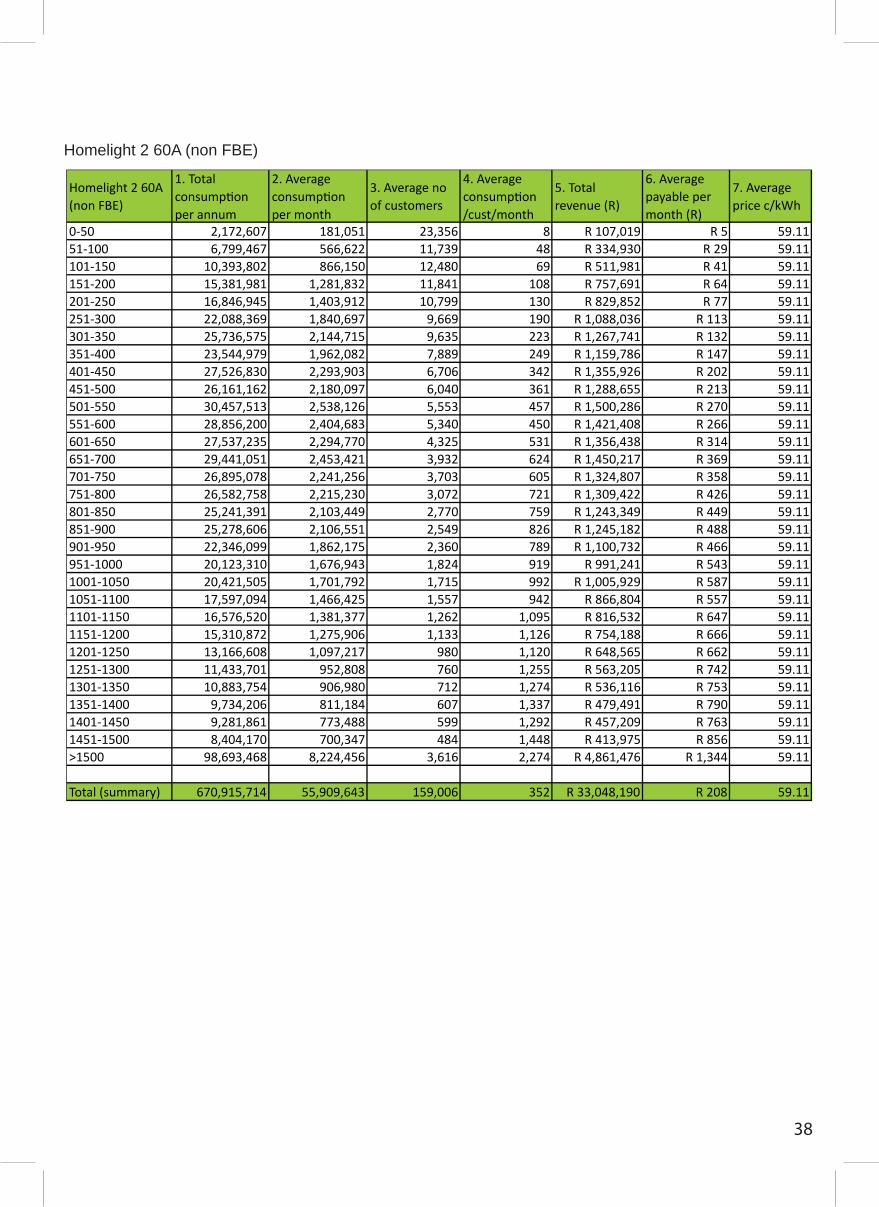
38
Homelight 2 60A (non FBE)
Homelight 2 60A (non FBE)
1. Total consumption per annum
2. Average consumption per month
3. Average no of customers
4. Average consumption /cust/month
5. Total revenue (R)
6. Average payable per month (R)
7. Average price c/kWh
0-50 2,172,607 181,051 23,356 8 R 107,019 R 5 59.1151-100 6,799,467 566,622 11,739 48 R 334,930 R 29 59.11101-150 10,393,802 866,150 12,480 69 R 511,981 R 41 59.11151-200 15,381,981 1,281,832 11,841 108 R 757,691 R 64 59.11201-250 16,846,945 1,403,912 10,799 130 R 829,852 R 77 59.11251-300 22,088,369 1,840,697 9,669 190 R 1,088,036 R 113 59.11301-350 25,736,575 2,144,715 9,635 223 R 1,267,741 R 132 59.11351-400 23,544,979 1,962,082 7,889 249 R 1,159,786 R 147 59.11401-450 27,526,830 2,293,903 6,706 342 R 1,355,926 R 202 59.11451-500 26,161,162 2,180,097 6,040 361 R 1,288,655 R 213 59.11501-550 30,457,513 2,538,126 5,553 457 R 1,500,286 R 270 59.11551-600 28,856,200 2,404,683 5,340 450 R 1,421,408 R 266 59.11601-650 27,537,235 2,294,770 4,325 531 R 1,356,438 R 314 59.11651-700 29,441,051 2,453,421 3,932 624 R 1,450,217 R 369 59.11701-750 26,895,078 2,241,256 3,703 605 R 1,324,807 R 358 59.11751-800 26,582,758 2,215,230 3,072 721 R 1,309,422 R 426 59.11801-850 25,241,391 2,103,449 2,770 759 R 1,243,349 R 449 59.11851-900 25,278,606 2,106,551 2,549 826 R 1,245,182 R 488 59.11901-950 22,346,099 1,862,175 2,360 789 R 1,100,732 R 466 59.11951-1000 20,123,310 1,676,943 1,824 919 R 991,241 R 543 59.111001-1050 20,421,505 1,701,792 1,715 992 R 1,005,929 R 587 59.111051-1100 17,597,094 1,466,425 1,557 942 R 866,804 R 557 59.111101-1150 16,576,520 1,381,377 1,262 1,095 R 816,532 R 647 59.111151-1200 15,310,872 1,275,906 1,133 1,126 R 754,188 R 666 59.111201-1250 13,166,608 1,097,217 980 1,120 R 648,565 R 662 59.111251-1300 11,433,701 952,808 760 1,255 R 563,205 R 742 59.111301-1350 10,883,754 906,980 712 1,274 R 536,116 R 753 59.111351-1400 9,734,206 811,184 607 1,337 R 479,491 R 790 59.111401-1450 9,281,861 773,488 599 1,292 R 457,209 R 763 59.111451-1500 8,404,170 700,347 484 1,448 R 413,975 R 856 59.11>1500 98,693,468 8,224,456 3,616 2,274 R 4,861,476 R 1,344 59.11
Total (summary) 670,915,714 55,909,643 159,006 352 R 33,048,190 R 208 59.11
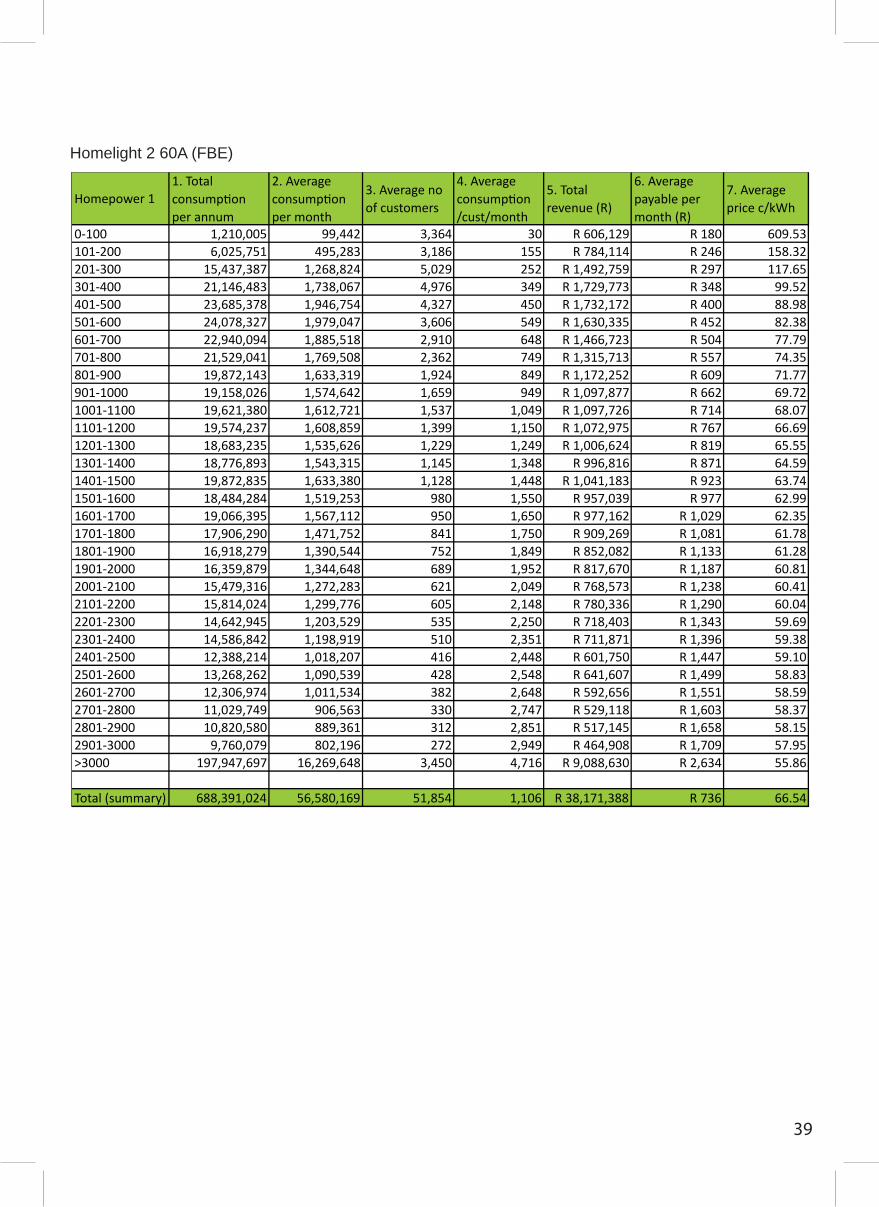
39
Homelight 2 60A (FBE)
Homepower 11. Total consumption per annum
2. Average consumption per month
3. Average no of customers
4. Average consumption /cust/month
5. Total revenue (R)
6. Average payable per month (R)
7. Average price c/kWh
0-100 1,210,005 99,442 3,364 30 R 606,129 R 180 609.53101-200 6,025,751 495,283 3,186 155 R 784,114 R 246 158.32201-300 15,437,387 1,268,824 5,029 252 R 1,492,759 R 297 117.65301-400 21,146,483 1,738,067 4,976 349 R 1,729,773 R 348 99.52401-500 23,685,378 1,946,754 4,327 450 R 1,732,172 R 400 88.98501-600 24,078,327 1,979,047 3,606 549 R 1,630,335 R 452 82.38601-700 22,940,094 1,885,518 2,910 648 R 1,466,723 R 504 77.79701-800 21,529,041 1,769,508 2,362 749 R 1,315,713 R 557 74.35801-900 19,872,143 1,633,319 1,924 849 R 1,172,252 R 609 71.77901-1000 19,158,026 1,574,642 1,659 949 R 1,097,877 R 662 69.721001-1100 19,621,380 1,612,721 1,537 1,049 R 1,097,726 R 714 68.071101-1200 19,574,237 1,608,859 1,399 1,150 R 1,072,975 R 767 66.691201-1300 18,683,235 1,535,626 1,229 1,249 R 1,006,624 R 819 65.551301-1400 18,776,893 1,543,315 1,145 1,348 R 996,816 R 871 64.591401-1500 19,872,835 1,633,380 1,128 1,448 R 1,041,183 R 923 63.741501-1600 18,484,284 1,519,253 980 1,550 R 957,039 R 977 62.991601-1700 19,066,395 1,567,112 950 1,650 R 977,162 R 1,029 62.351701-1800 17,906,290 1,471,752 841 1,750 R 909,269 R 1,081 61.781801-1900 16,918,279 1,390,544 752 1,849 R 852,082 R 1,133 61.281901-2000 16,359,879 1,344,648 689 1,952 R 817,670 R 1,187 60.812001-2100 15,479,316 1,272,283 621 2,049 R 768,573 R 1,238 60.412101-2200 15,814,024 1,299,776 605 2,148 R 780,336 R 1,290 60.042201-2300 14,642,945 1,203,529 535 2,250 R 718,403 R 1,343 59.692301-2400 14,586,842 1,198,919 510 2,351 R 711,871 R 1,396 59.382401-2500 12,388,214 1,018,207 416 2,448 R 601,750 R 1,447 59.102501-2600 13,268,262 1,090,539 428 2,548 R 641,607 R 1,499 58.832601-2700 12,306,974 1,011,534 382 2,648 R 592,656 R 1,551 58.592701-2800 11,029,749 906,563 330 2,747 R 529,118 R 1,603 58.372801-2900 10,820,580 889,361 312 2,851 R 517,145 R 1,658 58.152901-3000 9,760,079 802,196 272 2,949 R 464,908 R 1,709 57.95>3000 197,947,697 16,269,648 3,450 4,716 R 9,088,630 R 2,634 55.86
Total (summary) 688,391,024 56,580,169 51,854 1,106 R 38,171,388 R 736 66.54

40
Homepower 1
Homepower 11. Total consumption per annum
2. Average consumption per month
3. Average no of customers
4. Average consumption /cust/month
5. Total revenue (R)
6. Average payable per month (R)
7. Average price c/kWh
0-100 1,210,005 99,442 3,364 30 R 606,129 R 180 609.53101-200 6,025,751 495,283 3,186 155 R 784,114 R 246 158.32201-300 15,437,387 1,268,824 5,029 252 R 1,492,759 R 297 117.65301-400 21,146,483 1,738,067 4,976 349 R 1,729,773 R 348 99.52401-500 23,685,378 1,946,754 4,327 450 R 1,732,172 R 400 88.98501-600 24,078,327 1,979,047 3,606 549 R 1,630,335 R 452 82.38601-700 22,940,094 1,885,518 2,910 648 R 1,466,723 R 504 77.79701-800 21,529,041 1,769,508 2,362 749 R 1,315,713 R 557 74.35801-900 19,872,143 1,633,319 1,924 849 R 1,172,252 R 609 71.77901-1000 19,158,026 1,574,642 1,659 949 R 1,097,877 R 662 69.721001-1100 19,621,380 1,612,721 1,537 1,049 R 1,097,726 R 714 68.071101-1200 19,574,237 1,608,859 1,399 1,150 R 1,072,975 R 767 66.691201-1300 18,683,235 1,535,626 1,229 1,249 R 1,006,624 R 819 65.551301-1400 18,776,893 1,543,315 1,145 1,348 R 996,816 R 871 64.591401-1500 19,872,835 1,633,380 1,128 1,448 R 1,041,183 R 923 63.741501-1600 18,484,284 1,519,253 980 1,550 R 957,039 R 977 62.991601-1700 19,066,395 1,567,112 950 1,650 R 977,162 R 1,029 62.351701-1800 17,906,290 1,471,752 841 1,750 R 909,269 R 1,081 61.781801-1900 16,918,279 1,390,544 752 1,849 R 852,082 R 1,133 61.281901-2000 16,359,879 1,344,648 689 1,952 R 817,670 R 1,187 60.812001-2100 15,479,316 1,272,283 621 2,049 R 768,573 R 1,238 60.412101-2200 15,814,024 1,299,776 605 2,148 R 780,336 R 1,290 60.042201-2300 14,642,945 1,203,529 535 2,250 R 718,403 R 1,343 59.692301-2400 14,586,842 1,198,919 510 2,351 R 711,871 R 1,396 59.382401-2500 12,388,214 1,018,207 416 2,448 R 601,750 R 1,447 59.102501-2600 13,268,262 1,090,539 428 2,548 R 641,607 R 1,499 58.832601-2700 12,306,974 1,011,534 382 2,648 R 592,656 R 1,551 58.592701-2800 11,029,749 906,563 330 2,747 R 529,118 R 1,603 58.372801-2900 10,820,580 889,361 312 2,851 R 517,145 R 1,658 58.152901-3000 9,760,079 802,196 272 2,949 R 464,908 R 1,709 57.95>3000 197,947,697 16,269,648 3,450 4,716 R 9,088,630 R 2,634 55.86
Total (summary) 688,391,024 56,580,169 51,854 1,106 R 38,171,388 R 736 66.54
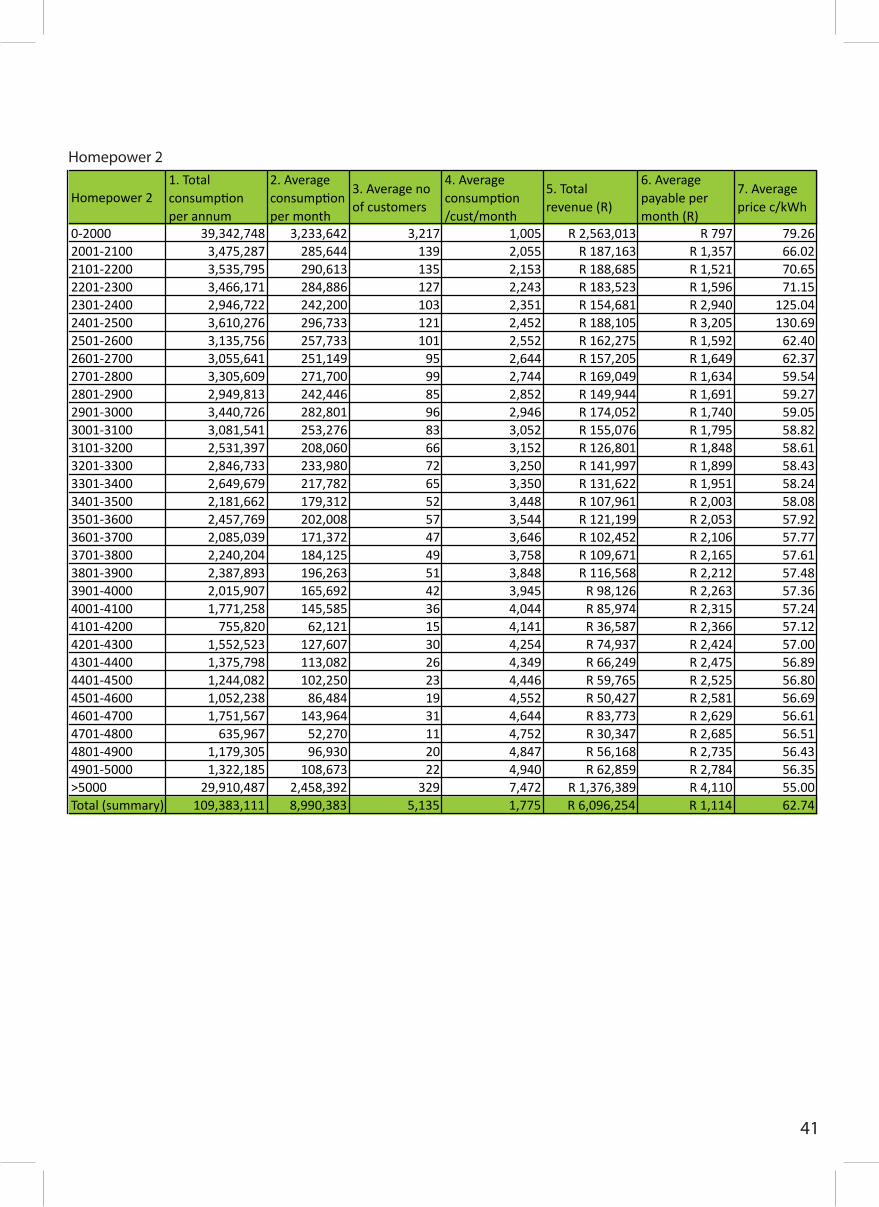
41
Homepower 2
Homepower 21. Total consumption per annum
2. Average consumption per month
3. Average no of customers
4. Average consumption /cust/month
5. Total revenue (R)
6. Average payable per month (R)
7. Average price c/kWh
0-2000 39,342,748 3,233,642 3,217 1,005 R 2,563,013 R 797 79.262001-2100 3,475,287 285,644 139 2,055 R 187,163 R 1,357 66.022101-2200 3,535,795 290,613 135 2,153 R 188,685 R 1,521 70.652201-2300 3,466,171 284,886 127 2,243 R 183,523 R 1,596 71.152301-2400 2,946,722 242,200 103 2,351 R 154,681 R 2,940 125.042401-2500 3,610,276 296,733 121 2,452 R 188,105 R 3,205 130.692501-2600 3,135,756 257,733 101 2,552 R 162,275 R 1,592 62.402601-2700 3,055,641 251,149 95 2,644 R 157,205 R 1,649 62.372701-2800 3,305,609 271,700 99 2,744 R 169,049 R 1,634 59.542801-2900 2,949,813 242,446 85 2,852 R 149,944 R 1,691 59.272901-3000 3,440,726 282,801 96 2,946 R 174,052 R 1,740 59.053001-3100 3,081,541 253,276 83 3,052 R 155,076 R 1,795 58.823101-3200 2,531,397 208,060 66 3,152 R 126,801 R 1,848 58.613201-3300 2,846,733 233,980 72 3,250 R 141,997 R 1,899 58.433301-3400 2,649,679 217,782 65 3,350 R 131,622 R 1,951 58.243401-3500 2,181,662 179,312 52 3,448 R 107,961 R 2,003 58.083501-3600 2,457,769 202,008 57 3,544 R 121,199 R 2,053 57.923601-3700 2,085,039 171,372 47 3,646 R 102,452 R 2,106 57.773701-3800 2,240,204 184,125 49 3,758 R 109,671 R 2,165 57.613801-3900 2,387,893 196,263 51 3,848 R 116,568 R 2,212 57.483901-4000 2,015,907 165,692 42 3,945 R 98,126 R 2,263 57.364001-4100 1,771,258 145,585 36 4,044 R 85,974 R 2,315 57.244101-4200 755,820 62,121 15 4,141 R 36,587 R 2,366 57.124201-4300 1,552,523 127,607 30 4,254 R 74,937 R 2,424 57.004301-4400 1,375,798 113,082 26 4,349 R 66,249 R 2,475 56.894401-4500 1,244,082 102,250 23 4,446 R 59,765 R 2,525 56.804501-4600 1,052,238 86,484 19 4,552 R 50,427 R 2,581 56.694601-4700 1,751,567 143,964 31 4,644 R 83,773 R 2,629 56.614701-4800 635,967 52,270 11 4,752 R 30,347 R 2,685 56.514801-4900 1,179,305 96,930 20 4,847 R 56,168 R 2,735 56.434901-5000 1,322,185 108,673 22 4,940 R 62,859 R 2,784 56.35>5000 29,910,487 2,458,392 329 7,472 R 1,376,389 R 4,110 55.00Total (summary) 109,383,111 8,990,383 5,135 1,775 R 6,096,254 R 1,114 62.74
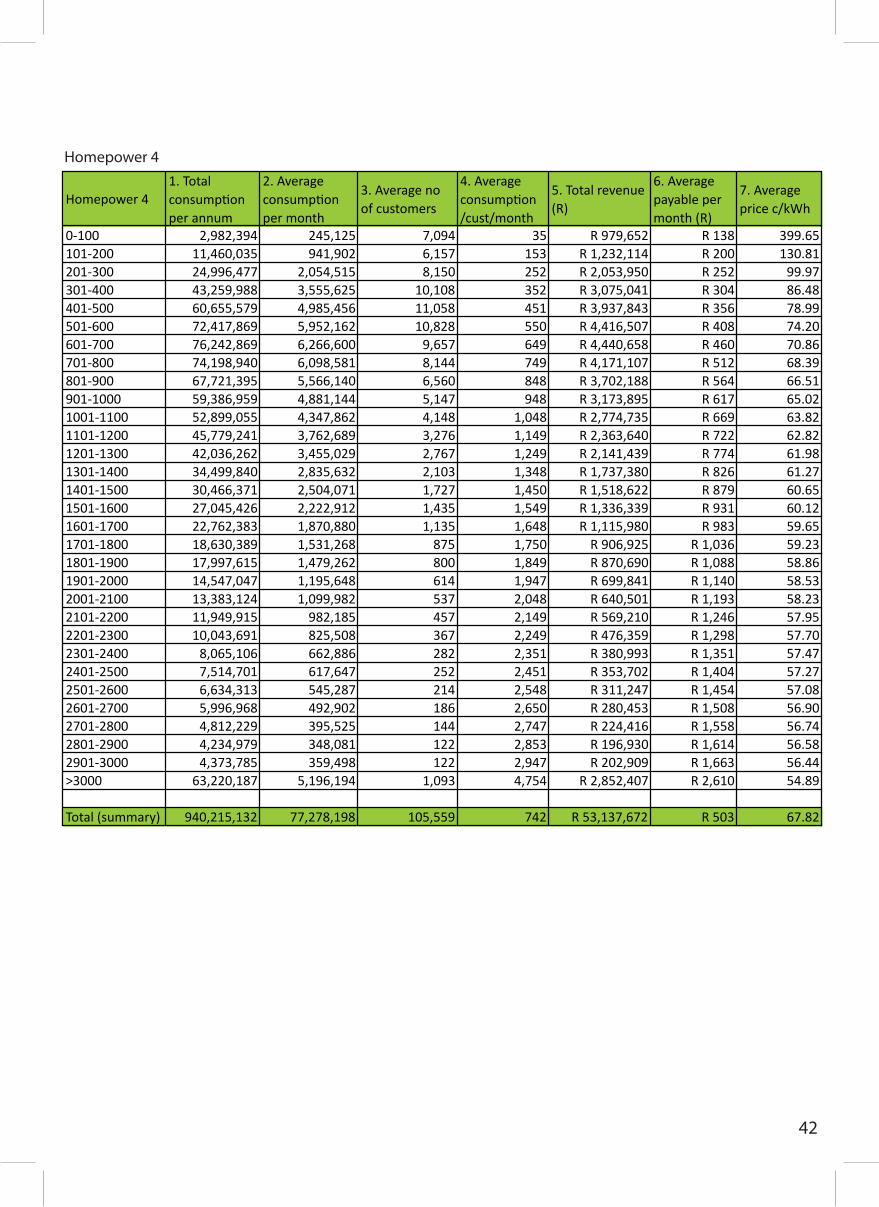
42
Homepower 4
Homepower 41. Total consumption per annum
2. Average consumption per month
3. Average no of customers
4. Average consumption /cust/month
5. Total revenue (R)
6. Average payable per month (R)
7. Average price c/kWh
0-100 2,982,394 245,125 7,094 35 R 979,652 R 138 399.65101-200 11,460,035 941,902 6,157 153 R 1,232,114 R 200 130.81201-300 24,996,477 2,054,515 8,150 252 R 2,053,950 R 252 99.97301-400 43,259,988 3,555,625 10,108 352 R 3,075,041 R 304 86.48401-500 60,655,579 4,985,456 11,058 451 R 3,937,843 R 356 78.99501-600 72,417,869 5,952,162 10,828 550 R 4,416,507 R 408 74.20601-700 76,242,869 6,266,600 9,657 649 R 4,440,658 R 460 70.86701-800 74,198,940 6,098,581 8,144 749 R 4,171,107 R 512 68.39801-900 67,721,395 5,566,140 6,560 848 R 3,702,188 R 564 66.51901-1000 59,386,959 4,881,144 5,147 948 R 3,173,895 R 617 65.021001-1100 52,899,055 4,347,862 4,148 1,048 R 2,774,735 R 669 63.821101-1200 45,779,241 3,762,689 3,276 1,149 R 2,363,640 R 722 62.821201-1300 42,036,262 3,455,029 2,767 1,249 R 2,141,439 R 774 61.981301-1400 34,499,840 2,835,632 2,103 1,348 R 1,737,380 R 826 61.271401-1500 30,466,371 2,504,071 1,727 1,450 R 1,518,622 R 879 60.651501-1600 27,045,426 2,222,912 1,435 1,549 R 1,336,339 R 931 60.121601-1700 22,762,383 1,870,880 1,135 1,648 R 1,115,980 R 983 59.651701-1800 18,630,389 1,531,268 875 1,750 R 906,925 R 1,036 59.231801-1900 17,997,615 1,479,262 800 1,849 R 870,690 R 1,088 58.861901-2000 14,547,047 1,195,648 614 1,947 R 699,841 R 1,140 58.532001-2100 13,383,124 1,099,982 537 2,048 R 640,501 R 1,193 58.232101-2200 11,949,915 982,185 457 2,149 R 569,210 R 1,246 57.952201-2300 10,043,691 825,508 367 2,249 R 476,359 R 1,298 57.702301-2400 8,065,106 662,886 282 2,351 R 380,993 R 1,351 57.472401-2500 7,514,701 617,647 252 2,451 R 353,702 R 1,404 57.272501-2600 6,634,313 545,287 214 2,548 R 311,247 R 1,454 57.082601-2700 5,996,968 492,902 186 2,650 R 280,453 R 1,508 56.902701-2800 4,812,229 395,525 144 2,747 R 224,416 R 1,558 56.742801-2900 4,234,979 348,081 122 2,853 R 196,930 R 1,614 56.582901-3000 4,373,785 359,498 122 2,947 R 202,909 R 1,663 56.44>3000 63,220,187 5,196,194 1,093 4,754 R 2,852,407 R 2,610 54.89
Total (summary) 940,215,132 77,278,198 105,559 742 R 53,137,672 R 503 67.82
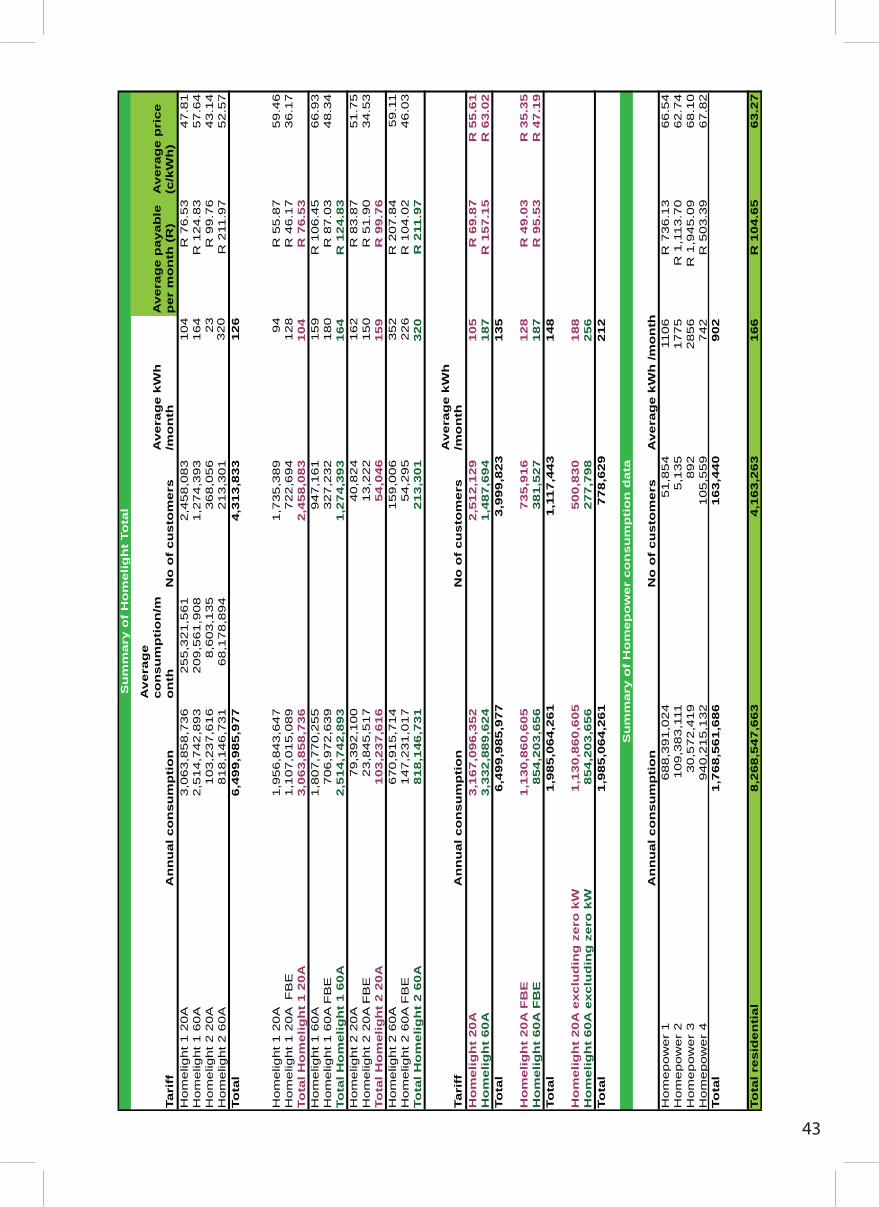
Ta
riff
An
nu
al
co
ns
um
pti
on
Av
era
ge
c
on
su
mp
tio
n/m
on
thN
o o
f c
us
tom
ers
Av
era
ge
kW
h
/mo
nth
Av
era
ge
pa
ya
ble
p
er
mo
nth
(R
)A
ve
rag
e p
ric
e
(c/k
Wh
)H
om
elig
ht
1 2
0A
3,0
63
,85
8,7
36
25
5,3
21
,56
1
2,4
58
,08
3
10
4R
76
.53
47
.81
Ho
me
lig
ht
1 6
0A
2,5
14
,74
2,8
93
20
9,5
61
,90
8
1,2
74
,39
3
16
4R
12
4.8
35
7.6
4H
om
elig
ht
2 2
0A
10
3,2
37
,61
6
8,6
03
,13
5
36
8,0
56
23
R 9
9.7
64
3.1
4H
om
elig
ht
2 6
0A
81
8,1
46
,73
1
68
,17
8,8
94
213,3
01
32
0R
211
.97
52
.57
To
tal
6,4
99
,98
5,9
77
4,3
13
,83
3
12
6
Ho
me
lig
ht
1 2
0A
1
,95
6,8
43
,64
7
1
,73
5,3
89
9
4R
55
.87
59
.46
Ho
me
lig
ht
1 2
0A
F
BE
1,1
07
,01
5,0
89
72
2,6
94
12
8R
46
.17
36
.17
To
tal
Ho
me
lig
ht
1 2
0A
3,0
63
,85
8,7
36
2,4
58
,08
3
10
4R
76
.53
Ho
me
lig
ht
1 6
0A
1,8
07
,77
0,2
55
94
7,1
61
15
9R
10
6.4
56
6.9
3H
om
elig
ht
1 6
0A
FB
E7
06
,97
2,6
39
3
27
,23
2
1
80
R 8
7.0
34
8.3
4To
tal
Ho
me
lig
ht
1 6
0A
2,5
14
,74
2,8
93
1,2
74
,39
3
16
4R
12
4.8
3H
om
elig
ht
2 2
0A
79
,39
2,1
00
40
,82
4
16
2R
83
.87
51
.75
Ho
me
lig
ht
2 2
0A
FB
E2
3,8
45
,51
7
1
3,2
22
1
50
R 5
1.9
03
4.5
3To
tal
Ho
me
lig
ht
2 2
0A
10
3,2
37
,61
6
54
,04
6
15
9R
99
.76
Ho
me
lig
ht
2 6
0A
67
0,9
15
,71
4
15
9,0
06
35
2R
20
7.8
45
9.1
1H
om
elig
ht
2 6
0A
FB
E1
47
,23
1,0
17
5
4,2
95
2
26
R 1
04
.02
46
.03
To
tal
Ho
me
lig
ht
2 6
0A
81
8,1
46
,73
1
21
3,3
01
32
0R
211
.97
Ta
riff
An
nu
al
co
ns
um
pti
on
No
of
cu
sto
me
rsA
ve
rag
e k
Wh
/m
on
thH
om
eli
gh
t 2
0A
3,1
67
,09
6,3
52
2,5
12
,12
9
10
5R
69
.87
R 5
5.6
1H
om
eli
gh
t 6
0A
3,3
32
,88
9,6
24
1,4
87
,69
4
18
7R
15
7.1
5R
63
.02
To
tal
6,4
99
,98
5,9
77
3,9
99
,82
31
35
Ho
me
lig
ht
20
A F
BE
1,1
30
,86
0,6
05
73
5,9
16
12
8R
49
.03
R 3
5.3
5H
om
eli
gh
t 6
0A
FB
E8
54
,20
3,6
56
3
81
,52
7
1
87
R 9
5.5
3R
47
.19
To
tal
1,9
85
,06
4,2
61
1,1
17
,44
31
48
Ho
me
lig
ht
20
A e
xc
lud
ing
ze
ro k
W1
,13
0,8
60
,60
55
00
,83
0
1
88
Ho
me
lig
ht
60
A e
xc
lud
ing
ze
ro k
W8
54
,20
3,6
56
2
77
,79
8
2
56
To
tal
1,9
85
,06
4,2
61
77
8,6
29
21
2
An
nu
al
co
ns
um
pti
on
No
of
cu
sto
me
rsA
ve
rag
e k
Wh
/m
on
thH
om
ep
ow
er
16
88
,39
1,0
24
51
,85
411
06
R 7
36
.13
66
.54
Ho
me
po
we
r 2
10
9,3
83
,111
5,1
35
17
75
R 1
,11
3.7
06
2.7
4H
om
ep
ow
er
33
0,5
72
,41
98
92
28
56
R 1
,94
5.0
96
8.1
0H
om
ep
ow
er
49
40
,21
5,1
32
10
5,5
59
74
2R
50
3.3
96
7.8
2To
tal
1,7
68
,56
1,6
86
16
3,4
40
90
2
To
tal
res
ide
nti
al
8,2
68
,54
7,6
63
4,1
63
,26
31
66
R 1
04
.65
63
.27
Su
mm
ar y
of
Ho
me
lig
ht
To
tal
Su
mm
ary
of
Ho
mep
ow
er
co
ns
um
pti
on
da
ta
43

Tari
ffA
nn
ual co
nsu
mp
tio
nN
o o
f cu
sto
mers
Avera
ge k
Wh
/m
on
thA
vera
ge p
ayab
le
per
mo
nth
(R
)A
vera
ge p
rice
(c/k
Wh
)H
om
elight 1 2
0A
-
-
-
-H
om
elight 1 6
0A
24,2
47,3
15
4,1
61
486
R 3
30.3
266.9
3H
om
elight 2 2
0A
50,4
37,1
94
12,5
80
334
R 1
75.9
351.7
5H
om
elight 2 6
0A
553,4
42,2
65
78,7
64
586
R 3
60.3
059.1
1To
tal
628,1
26,7
74
95,5
05
548
Hom
elight 1 2
0A
-
-
-
--
Hom
elight 1 2
0A
F
BE
-
-
-
--
To
tal H
om
elig
ht
1 2
0A
-
-
-
--
Hom
elight 1 6
0A
23,4
33,3
30
4,0
11
487
R 3
25.8
566.9
3H
om
elight 1 6
0A
FB
E813,9
85
150
452
R 2
69.2
059.5
3To
tal H
om
elig
ht
1 6
0A
24,2
47,3
15
4,1
61
486
Hom
elight 2 2
0A
49,4
77,9
71
12,3
51
334
R 1
72.7
651.7
5H
om
elight 2 2
0A
FB
E959,2
23
229
349
R 1
54.7
644.3
4To
tal H
om
elig
ht
2 2
0A
50,4
37,1
94
12,5
80
334
Hom
elight 2 6
0A
553,4
42,2
65
78,7
64
586
R 3
46.1
259.1
1H
om
elight 2 6
0A
FB
E53,1
94,1
89
9,1
47
485
R 2
56.9
153.0
1To
tal H
om
elig
ht
2 6
0A
606,6
36,4
54
87,9
11
575
681,3
20,9
63
Tari
ffA
nn
ual co
nsu
mp
tio
nN
o o
f cu
sto
mers
Avera
ge k
Wh
/m
on
thH
om
elig
ht
20A
50,4
37,1
94
12,5
80
334
R 1
72.7
651.7
5H
om
elig
ht
60A
630,8
83,7
69
92,0
72
571
R 3
35.9
963.0
2To
tal
681,3
20,9
63
104,6
52
543
Ho
melig
ht
20A
FB
E959,2
23
229
349
R 1
54.7
644.3
4H
om
elig
ht
60A
FB
E54,0
08,1
74
9,2
97
484
R 2
63.0
556.2
7To
tal
54,9
67,3
97
9,5
26
481
An
nu
al co
nsu
mp
tio
nN
o o
f cu
sto
mers
Avera
ge k
Wh
/m
on
thH
om
epow
er
1688,3
91,0
24
51,8
54
1106
R 7
36
66.5
4H
om
epow
er
2109,3
83,1
11
5,1
35
1,7
75
R 1
,368
64.3
8H
om
epow
er
330,5
72,4
19
892
2,8
56
R 2
,989
61.2
8H
om
epow
er
4940,2
15,1
32
105,5
59
742
R 5
03
67.8
2To
tal
1,7
68,5
61,6
86
163,4
40
902
To
tal co
nven
tio
nal
2,4
49,8
82,6
49
268,0
92
762
Su
mm
ar y
of
Ho
melig
ht
co
nven
tio
nal
Su
mm
ary
of
Ho
mep
ow
er
co
nsu
mp
tio
n d
ata
44
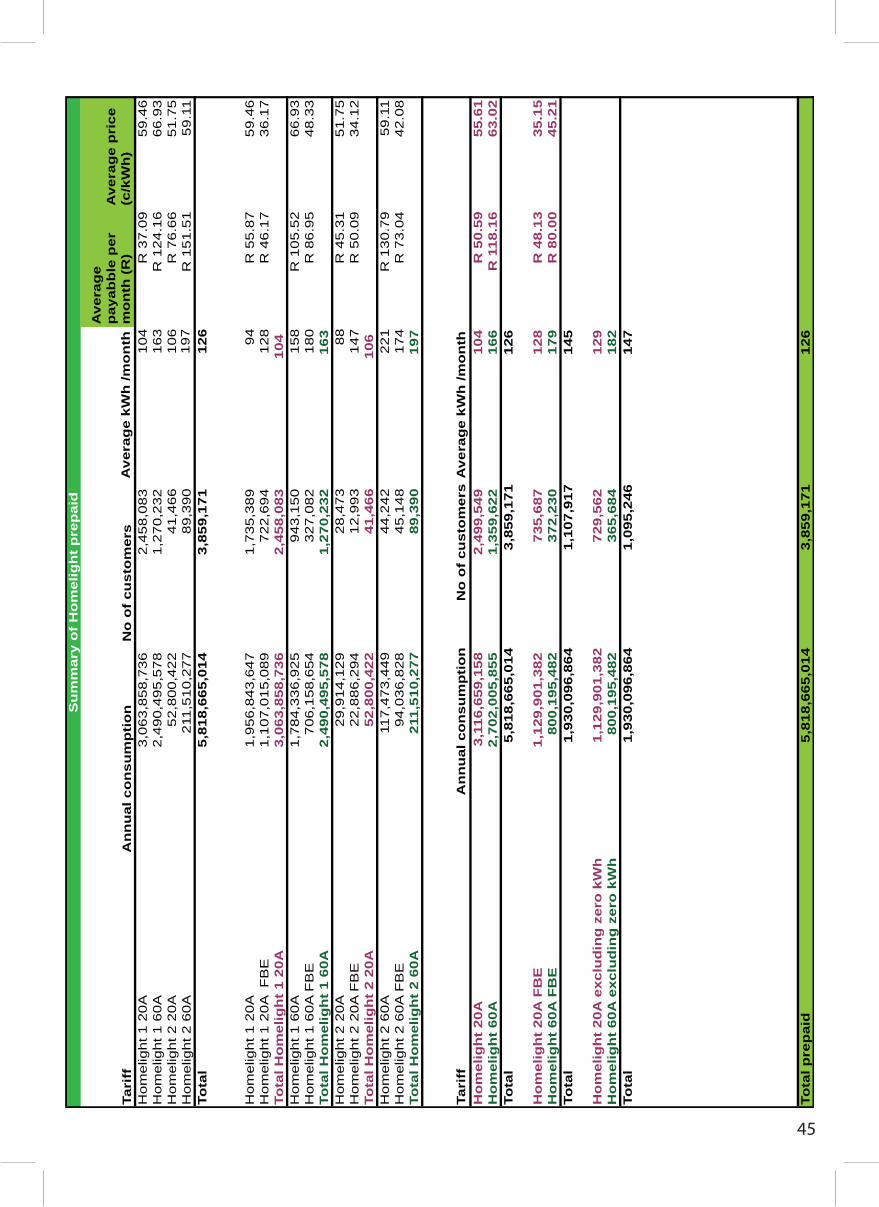
Ta
riff
An
nu
al
co
ns
um
pti
on
No
of
cu
sto
me
rsA
ve
rag
e k
Wh
/m
on
th
Av
era
ge
p
ay
ab
ble
pe
r m
on
th (
R)
Av
era
ge
pri
ce
(c
/kW
h)
Ho
me
ligh
t 1
20
A3
,06
3,8
58
,73
6
2
,45
8,0
83
10
4R
37
.09
59
.46
Ho
me
ligh
t 1
60
A2
,49
0,4
95
,57
8
1
,27
0,2
32
16
3R
12
4.1
66
6.9
3H
om
elig
ht
2 2
0A
52
,80
0,4
22
4
1,4
66
1
06
R 7
6.6
65
1.7
5H
om
elig
ht
2 6
0A
211
,51
0,2
77
89
,39
0
19
7R
15
1.5
15
9.1
1To
tal
5,8
18
,66
5,0
14
3,8
59
,17
1
1
26
Ho
me
ligh
t 1
20
A
1,9
56
,84
3,6
47
1,7
35
,38
9
9
4R
55
.87
59
.46
Ho
me
ligh
t 1
20
A
FB
E1
,10
7,0
15
,08
9
7
22
,69
4
1
28
R 4
6.1
73
6.1
7To
tal
Ho
me
lig
ht
1 2
0A
3,0
63
,85
8,7
36
2,4
58
,08
3
1
04
Ho
me
ligh
t 1
60
A1
,78
4,3
36
,92
5
9
43
,15
0
1
58
R 1
05
.52
66
.93
Ho
me
ligh
t 1
60
A F
BE
70
6,1
58
,65
4
3
27
,08
2
1
80
R 8
6.9
54
8.3
3To
tal
Ho
me
lig
ht
1 6
0A
2,4
90
,49
5,5
78
1,2
70
,23
2
1
63
Ho
me
ligh
t 2
20
A2
9,9
14
,12
9
28
,47
3
88
R 4
5.3
15
1.7
5H
om
elig
ht
2 2
0A
FB
E2
2,8
86
,29
4
12
,99
3
14
7R
50
.09
34
.12
To
tal
Ho
me
lig
ht
2 2
0A
52
,80
0,4
22
4
1,4
66
1
06
Ho
me
ligh
t 2
60
A11
7,4
73
,44
9
4
4,2
42
2
21
R 1
30
.79
59
.11
Ho
me
ligh
t 2
60
A F
BE
94
,03
6,8
28
4
5,1
48
1
74
R 7
3.0
44
2.0
8To
tal
Ho
me
lig
ht
2 6
0A
211
,51
0,2
77
89
,39
0
19
7
Ta
riff
An
nu
al
co
ns
um
pti
on
No
of
cu
sto
me
rsA
ve
rag
e k
Wh
/m
on
thH
om
eli
gh
t 2
0A
3,1
16
,65
9,1
58
2
,49
9,5
49
10
4R
50
.59
55
.61
Ho
me
lig
ht
60
A2
,70
2,0
05
,85
5
1
,35
9,6
22
16
6R
11
8.1
66
3.0
2To
tal
5,8
18
,66
5,0
14
3,8
59
,17
11
26
Ho
me
lig
ht
20
A F
BE
1,1
29
,90
1,3
82
73
5,6
87
12
8R
48
.13
35
.15
Ho
me
lig
ht
60
A F
BE
80
0,1
95
,48
2
3
72
,23
0
1
79
R 8
0.0
04
5.2
1To
tal
1,9
30
,09
6,8
64
1,1
07
,91
71
45
Ho
me
lig
ht
20
A e
xc
lud
ing
ze
ro k
Wh
1
,12
9,9
01
,38
27
29
,56
2
1
29
Ho
me
lig
ht
60
A e
xc
lud
ing
ze
ro k
Wh
8
00
,19
5,4
82
36
5,6
84
18
2To
tal
1,9
30
,09
6,8
64
1,0
95
,24
61
47
To
tal
pre
pa
id5
,81
8,6
65
,01
43
,85
9,1
71
12
6
Su
mm
ary
of
Ho
me
lig
ht
pre
pa
id
45
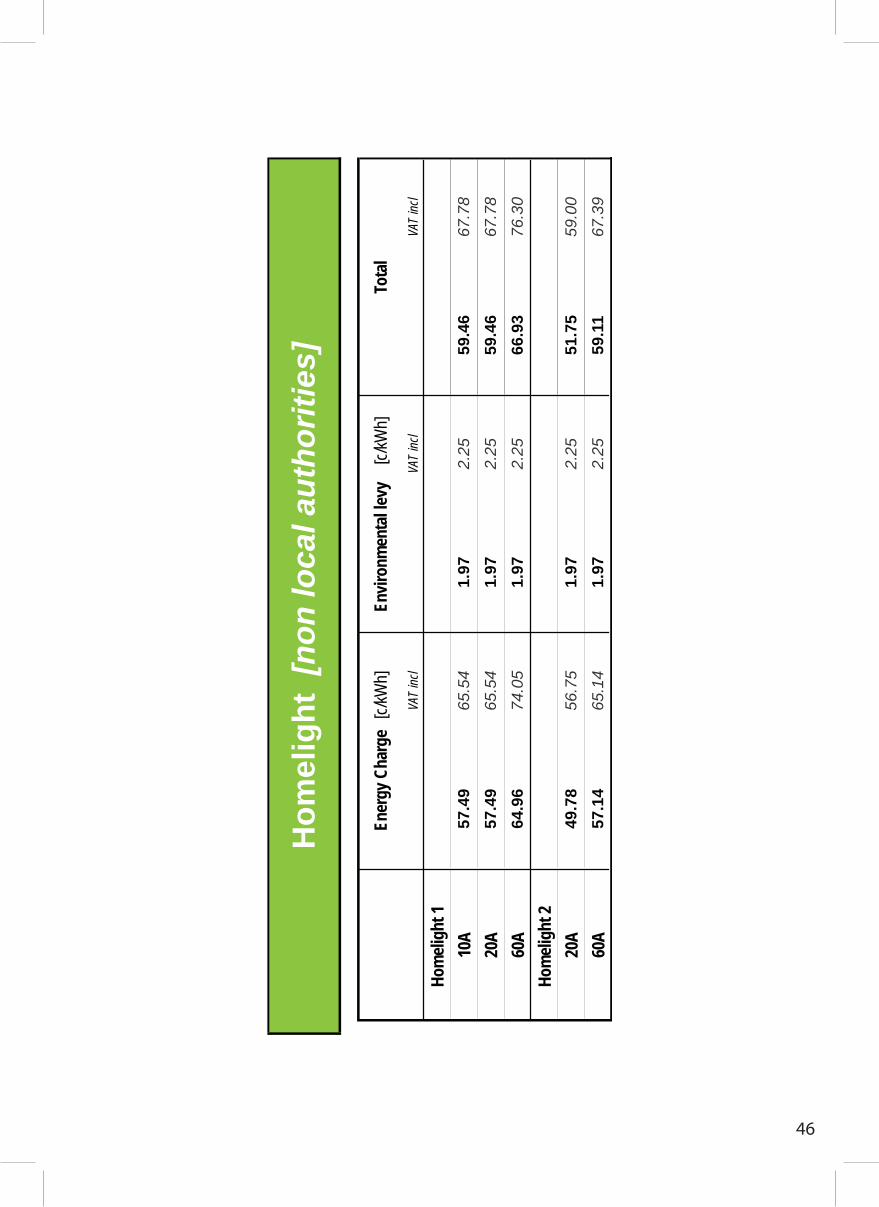
VAT
incl
VAT
incl
VAT
incl
Hom
elig
ht 1
10A
57.4
965
.54
1.97
2.25
59.4
667
.78
20A
57.4
965
.54
1.97
2.25
59.4
667
.78
60A
64.9
674
.05
1.97
2.25
66.9
376
.30
Hom
elig
ht 2
20A
49.7
856
.75
1.97
2.25
51.7
559
.00
60A
57.1
465
.14
1.97
2.25
59.1
167
.39
Ho
mel
igh
t [
no
n lo
cal a
uth
ori
ties
]
Ener
gy C
harg
e [c
/kW
h]En
viro
nmen
tal l
evy
[c/k
Wh]
Tota
l
46

Sustainable Energy and Climate Change Partnership (SECCP)A project of Earthlife Africa Johannesburg
+27 11 339 3662Fax: + 27 11 339 3270
Email: [email protected]: www.earthlife.org.za