photonics components modeled in code v - … figure 3: fiber coupling efficiency vs. wavelength for...
TRANSCRIPT

White Paper
November 2014
Photonics Components Modeled in CODE V
Authors
Craig Pansing
CODE V Application
Engineer
Bryan Stone
CODE V Principal
R&D Engineer
CODE V® is a comprehensive program for optical design, analysis, tolerancing, and fabrication support. It is used by organizations around the world to design a wide range of optical systems for a variety of products, including photonics components, photographic equipment, video cameras, medical instruments, aerospace systems, and much more. CODE V’s advanced features provide outstanding flexibility and ease of use, and Synopsys’ excellent technical support helps users maximize their benefit and productivity from the software.
CODE V features that are important for simulating components for the photonic and optical telecommunication industries include:
`` Ideal Gaussian beam propagator
`` General diffraction beam propagator
`` Coupling efficiency and polarization dependent loss calculations
`` Polarized beam propagation and ray tracing
`` Multilayer coating design and analysis
`` Diffractive optical elements
`` Gradient index materials
`` Birefringent materials
`` Tolerancing
`` Optimization of Gaussian beam waist size and location
`` Optimization of fiber coupling efficiency
`` Interface with system-level tools (RSoft™ Optical Communication Design Suite)
`` Interface with small-feature devices (RSoft Photonic Component Design Suite)
Examples of some photonics components that can be modeled with CODE V include:
`` Free-space optical interconnect
`` Single mode fiber to photodetector coupler
`` Fiber optic coupler
`` Microlens array
`` DWDM filter
`` Optical isolator
`` Tunable optical filter
`` WSS

2
Free Space Optical InterconnectA free-space optical interconnect can be used to transfer data between two components in large computing systems. Figure 1 shows a free space optical interconnect that is modeled after a design by Zheng, Marchand et al. in Appl. Opt., 38, 5632 (1999). The source is an array of 12 VCSELs operating at 850 nm on one side of the optical axis. The receiver is a linear array of 12 detectors on the other side of the axis. The detectors are 80 microns square.
Figure 1: Free-space optical interconnect
Using CODE V, the encircled energy of the diffraction spot size, as well as the fiber coupling efficiency can be measured. In Figure 2, the diffraction encircled energy is shown. The analysis shows that the spot’s energy is contained on the 80-micron detector. In Figure 3, the fiber coupling efficiency of the 4mm field is shown versus wavelength, and shows that -0.144dB at the VCSEL wavelength.
Figure 2: Encircled energy of a fiber 4mm and 7.5mm from the center axis
Linear arrayof detectors
Linear arrayof VCSELs
Substrate Lens Mirror10.00 mm
Enc
ircle
d e
nerg
y fr
actio
n 0.9
0.8
0.7
0.6
0.5
0.4
0.3
0.2
0.1
00 0.005 0.01 0.015 0.02 0.025
Diameter of circle (mm)
F1: (OBJ) 4.000 mmF2: (OBJ) 7.500 mm
Diffraction encircled energyfree space optical interconnect
Enc
ircle
d e
nerg
y fr
actio
n
0.9
0.8
0.7
0.6
0.5
0.4
0.3
0.2
0.1
00 0.005 0.01 0.015 0.02 0.025
Diameter of circle (mm)

3
Figure 3: Fiber coupling efficiency vs. wavelength for a fiber 4mm from the center axis
Single-Mode-Fiber-to-Photodetector CouplerA proposed system to couple light from a single-mode-fiber to a photodetector using a refractive ball lens and mirror surface is shown in Figure 4. The photodetector size is 20 x 20µm square area. A comparison using CODE V simulation tools is made between the collection efficiency using a spherical mirror and a parabolic mirror as the component’s reflector. When a spherical reflective surface is used to couple the fiber output, simulated results show that 97.6% of the light is collected by the photodetector. When the spherical mirror is replaced with a parabolic mirror, the coupler is able to collect 99.6% of the propagated light, indicting increased efficiency. Figure 5 shows a comparison of the irradiance at the photodetector when the spherical and parabolic mirrors are used.
Figure 4: Single-mode-fiber-to-photodetector coupler
SMF
1.5 mmBK7 ball lens
550 µm
300 µm
PD
Parabolic mirror550 µm radius
Fib
er c
oup
ling
effic
ienc
y (d
B)
-0.13
-0.135
-0.14
-0.145
-0.15
-0.155
-0.16750 775 800 825 850 875
CEF
Wavelength (nm)
Free space optical interconnect: fiber coupling efficiency vs. wavelength

4
Figure 5: Point spread function and irradiance at photodetector when a spherical and a parabolic mirror is used
Effects at the system level can be analyzed by injecting the complete optical signal into Synopsys’ RSoft OptSim software. See Mena, et al., SPIE Proceedings, Vol. 8991.
Fiber Optic CouplerFiber optic couplers are used to separate a signal from an input fiber to couple it to multiple output fibers. Fiber optic couplers can be used to split beams that contain multiple wavelengths or different polarization states into different channels. In Figure 6, a multi-wavelength input beam from a fiber is collimated and then dispersed by a grating, as described by J.J. Pan and Tian Zhu in Conference on Lasers and Electro-Optics, CLEO ’99, 159 (1999).
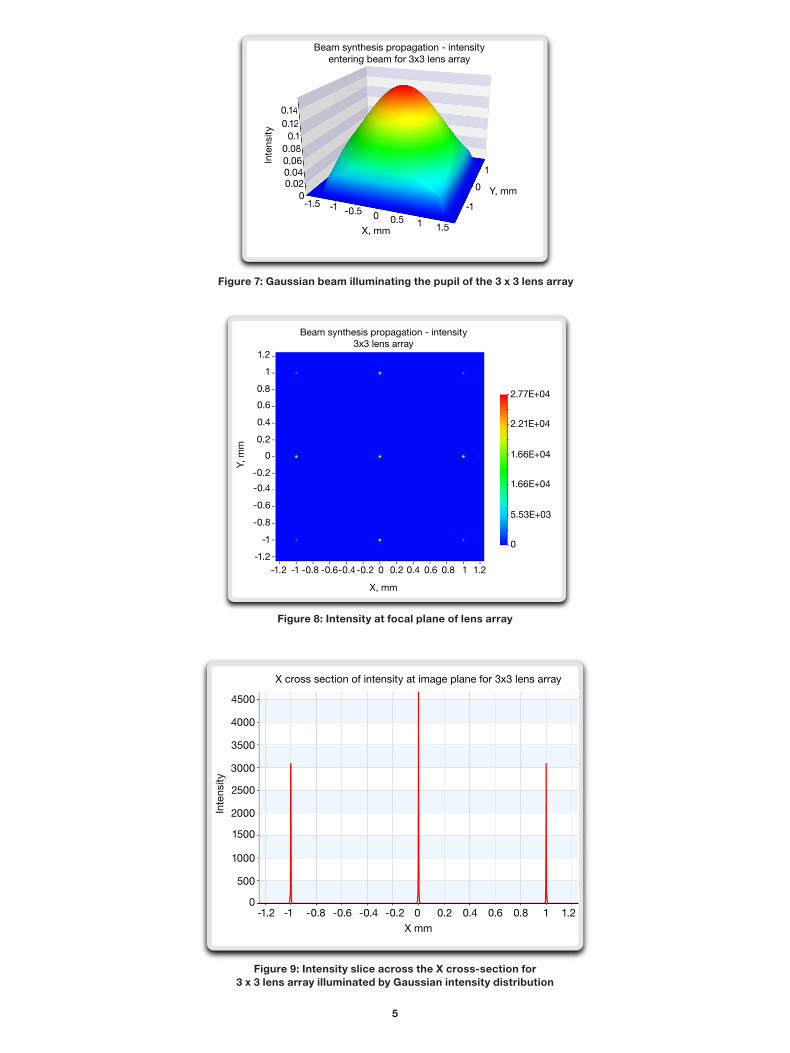
Microlens ArrayLens arrays can be used to split an incident beam into multiple channels. The beam propagation capability in CODE V can be used to analyze the energy distribution in each channel when the illumination pattern is non-uniform. A comparison of the relative illumination levels for each channel in a 3 x 3 array of lenses with an entrance pupil illuminated by a Gaussian beam is shown here. Figure 7 shows the Gaussian profile of the illumination filling the system’s entrance pupil. Figure 8 shows the image intensity of the nine channels at the focal plane. Figure 9 charts a cross-section of the X-axis, which reveals the differences in intensity levels across each channel due to the non-uniform illumination across the pupil.
GRIN lenses to match NA of fiber
Aspheric collimators
Inputfiber DOE Output
fibers5.00 mm
Figure 6: 1x4 fiber optic coupler
Beam synthesis propagation - irradiance (dB)Spherical mirror
Beam synthesis propagation - irradiance (dB)Parabolic mirror
0.01
0.005
0
-0.005
-0.01
Y, mm
0.01
0.005
0
-0.005
-0.01
Y, mm
0.010.0050-0.005-0.01X, mm
0.010.0050-0.005-0.01X, mm
41.8
-8.21
1.79
11.8
21.8
31.8
43
4.32
12.1
19.8
27.6
35.3
5
Figure 7: Gaussian beam illuminating the pupil of the 3 x 3 lens array
Beam synthesis propagation - intensityentering beam for 3x3 lens array
Y, mm
X, mm
0
1
-1
Inte
nsity
0
0.040.02
0.060.08
0.10.120.14
-1.5 -1 -0.5 0 0.5 1 1.5
Beam synthesis propagation - intensity3x3 lens array
1.2
1
0.8
0.6
0.4
0.2
0
-0.2
-0.4
-0.6
-0.8
-1
-1.2
Y, m
m
1.210.80.60.40.20-0.2-0.4-0.6-0.8-1-1.2
X, mm
2.77E+04
0
5.53E+03
1.66E+04
1.66E+04
2.21E+04
X cross section of intensity at image plane for 3x3 lens array
Inte
nsity
3000
2500
2000
1500
4500
4000
3500
1000
500
0-1.2 1.2-1 1-0.8 0.8-0.6 0.6-0.4 0.4-0.2 0.20
X mm
Figure 8: Intensity at focal plane of lens array
Figure 9: Intensity slice across the X cross-section for 3 x 3 lens array illuminated by Gaussian intensity distribution

6
DWDM FilterFigure 10 shows the spectral transmission of a narrow bandpass filter for a 200 Ghz channel spacing DWDM. It is a 142-layer stack with high and low index materials of Ta2O5 and SiO2, respectively. Results are shown for normal and 3 degrees incidence. The shift of the bandpass with respect to angle of incidence is about 0.3-nm/degree. This analysis was based on a design description in “High-Performance Filters for Dense Wavelength Division Multiplex Fiber Optic Communications,” by J. J. Pan of E-Tek Dynamics, Inc. (subsequently acquired by JDS Uniphase Corporation). Figure 11 shows the filter in a typical configuration. GRIN lenses are used for collimation and decollimation. The filter selects desired channel(s) from the incident wavelengths and rejects the rest. The rejected channels are routed to the circulator port while the selected channel propagates through fiber.
Figure 10: DWDM filter transmission
Figure 11: DWDM narrow bandpass filter unit
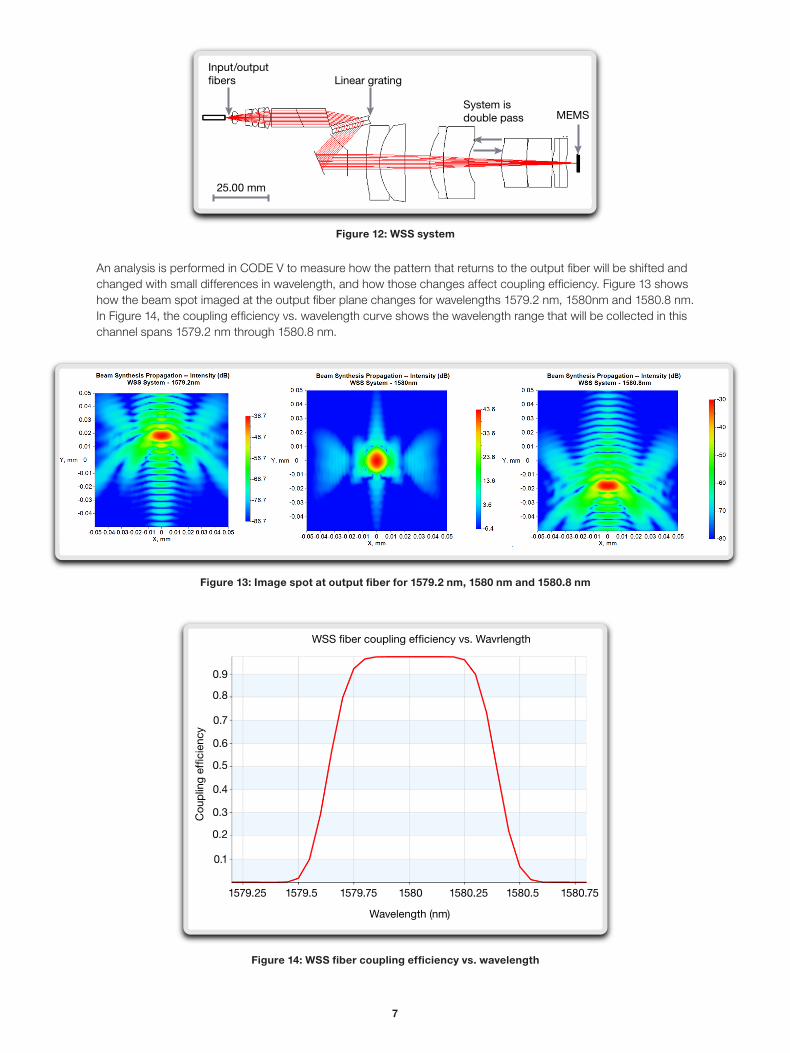
Wavelength Selective SwitchA Wavelength Selective Switch (WSS) system is used to route channels in an optical communication system. A MEMS-based WSS is shown in Figure 12. A linear grating is used to disperse light, which is imaged onto a reflective MEMS component. The MEMS component will route the light on the return pass into a different channel at the output fiber plane.
1.00 mm
DWDM narrow bandpass filter unit
Narrow bandpass filterInput andreflected signals
GRIN lens
Transmittedsignal
Narrow bandpass filter for 200 Ghz channel spacing WDME
ncirc
led
ene
rgy
frac
tion
0
-5
-10
-15
-20
-25
-301542 1543 1544 1545 1546 1547 1548 1549 1550 1551 1552
Wavelength (nm)
0 degrees
3 degrees
7
Figure 12: WSS system
An analysis is performed in CODE V to measure how the pattern that returns to the output fiber will be shifted and changed with small differences in wavelength, and how those changes affect coupling efficiency. Figure 13 shows how the beam spot imaged at the output fiber plane changes for wavelengths 1579.2 nm, 1580nm and 1580.8 nm. In Figure 14, the coupling efficiency vs. wavelength curve shows the wavelength range that will be collected in this channel spans 1579.2 nm through 1580.8 nm.
Figure 13: Image spot at output fiber for 1579.2 nm, 1580 nm and 1580.8 nm
Figure 14: WSS fiber coupling efficiency vs. wavelength
Linear gratingInput/outputfibers
MEMSSystem isdouble pass
25.00 mm
WSS fiber coupling efficiency vs. Wavrlength
Cou
plin
g ef
ficie
ncy
0.9
0.6
0.7
0.8
0.5
0.4
0.3
0.2
0.1
1579.25 1579.5 1579.75 1580 1580.25 1580.5 1580.75
Wavelength (nm)

8
Optical IsolatorFigure 15 is an optical isolator modeled after U.S. patent 5,208,876, now assigned to JDS Uniphase Corp., and designed by J. J. Pan. The patent references a previous design described by M. Shirasaki and K. Asama, Appl. Opt. 21, 4296 (1982). The isolator is used to prevent unwanted reflections from propagating backwards into the laser that feeds light into the input fiber. The basic components are a collimator (GRIN lens), a birefringent crystal with a 4° wedge, a 45° Faraday rotator, a second birefringent crystal with a 4° wedge and a focusing lens (GRIN lens). The crystal axes of the two crystals are oriented 45° to one another. In this case, the axis of the first crystal is at -22.5° to the wedge and the axis of the second is at 22.5° to the wedge, which allows the two birefringent wedges to be of the same design. The material in this case is Lithium Niobate. The Faraday rotator is made of Ytrium-Iron-Garnet (YIG) surrounded by a permanent magnet.
Figure 15: Optical isolator
The effect of the wedges is to shift the collimated beam slightly but not to change its direction into the second GRIN lens. The first birefringent crystal separates the beam into two orthogonal components, one seeing the ordinary index of refraction (no) and the other seeing the extraordinary index of refraction (ne). The Faraday rotator then rotates these orthogonal components by 45° and, since the second crystal axis is also rotated by 45°, the no component sees no in the second crystal and the ne component sees ne. The resulting beam is then focused on the center of the output fiber by the second GRIN lens. However, any reflections going in the opposite direction are affected differently. In this case, the component which sees no in the first crystal sees ne in the second crystal, and vice versa. The result is that the beam changes direction before entering the second GRIN lens and is focused away from the center of the input fiber. Thus, very little energy is reflected back into the input fiber. The values of parameters such as the wedge angle, the size of the elements and the focal length of the GRIN lenses depend on the fiber size and NA, the materials used and the performance and packaging requirements. This device is independent of the initial state of polarization of the beam.
Figures 16 and 17 show simulations in the forward and reverse directions of the focused beam on the fiber on a dB scale. For an 8.5µ diameter fiber mode, 89% of the energy is coupled into output fiber giving an insertion loss of -0.37 dB (for this effect only). Figure 18 shows the coupling efficiency as a function of wavelength. In the reverse case, the beam is split into two beams on either side of the input fiber and only 1.2% of the reflected light is coupled into the fiber (-19 dB). Assuming that 3% of the initial light is reflected backwards, this gives a total isolation of -34 dB (again, for this effect only).
Faraday rotator
Input fiber Output fiber
GRIN lens GRIN lens
LiNO3birefringentcrystal
LiNbO3birefringentcrystal
2.50 mm

9
Figure 16: Focused beam in the forward direction
Diffraction intensity spread function - dBOptical isolator - forward configuration
0 Y, mm
0.5
-0.5
-25
-30In
tens
ity (d
B)
-20
-15
-10
-5
0
0-0.04-0.02-0.06-0.08
X, mm
0.020.04 0.06 0.08
0
-30
-24
-18
-12
-6
0 Y, mm
0.5
-0.50-0.04-0.02
-0.06-0.08
X, mm
0.020.04 0.06 0.08
-25
-30
Inte
nsity
(dB
)
-20
-15
-10
-5
0
0
-30
-24
-18
-12
-6
Diffraction intensity spread function - dBOptical isolator - reverse configuration
Optical isolator: fiber coupling efficiency vs. wavelength
Fib
er c
oup
ling
effic
ienc
y (d
B)
0
-1
-2
-3
-4
-51270 1280 1290 1300 1310 1320 1330
Wavelength (nm)
Figure 17: Focused beam in the reverse direction
Figure 18: Coupling efficiency

10
Tunable Optical FilterFigure 19 shows a tunable optical filter modeled after U.S. patent 5,799,121, assigned to JDS Uniphase Corp., and designed by Gary Duck and Yihao Cheng. The basic components are a GRIN lens collimator and a narrow-pass DWDM filter with a bandpass of about 3 nm. The filter assembly provides for the selection of different wavelength bands, depending on the distance of the input and output fibers from the axis of the GRIN lens. As the fibers are moved farther apart, the collimated beam hits the DWDM filter at a higher angle of incidence, thus shifting the bandpass of the transmitted beam. In Figure 20, eight wavelength bands in the range of 1523–1548 nm propagate from the input fiber into the GRIN lens. The angle of incidence is such that wavelength band 4, centered at 1535 nm, is transmitted through the filter.
Input fiber
WDM filterGRIN lens
Wavelength 4
Wavelengths 1-8
Output fiber
Wavelengths 1-3, 5-8
1.00 mm
Tunable WDM filter: transmission vs. fiber offset
Tran
smis
sion
(dB
)
Wavelength (nm)
0
-10
-5
-15
-20
-25
-30
Offset 0(mm) 0.188000000.266000000.321000000.370000000.417000000.462000000.50500000
Figure 20: Spectral transmission
Figure 19: Tunable optical filter

11

11/14.AP.CS5106.
Synopsys, Inc. • 700 East Middlefield Road • Mountain View, CA 94043 • www.synopsys.com
©2014 Synopsys, Inc. All rights reserved. Synopsys is a trademark of Synopsys, Inc. in the United States and other countries. A list of Synopsys trademarks is available at http://www.synopsys.com/copyright.html . All other names mentioned herein are trademarks or registered trademarks of their respective owners.