photosynthetic artificial organelles sustain and control...
TRANSCRIPT

© 2
018
Nat
ure
Am
eric
a, In
c., p
art o
f Spr
inge
r Nat
ure.
All
right
s re
serv
ed.
nature biotechnology advance online publication
l e t t e r s
Inside cells, complex metabolic reactions are distributed across the modular compartments of organelles1,2. Reactions in organelles have been recapitulated in vitro by reconstituting functional protein machineries into membrane systems3–5. However, maintaining and controlling these reactions is challenging. Here we designed, built, and tested a switchable, light-harvesting organelle that provides both a sustainable energy source and a means of directing intravesicular reactions. An ATP (ATP) synthase and two photoconverters (plant-derived photosystem II and bacteria-derived proteorhodopsin) enable ATP synthesis. Independent optical activation of the two photoconverters allows dynamic control of ATP synthesis: red light facilitates and green light impedes ATP synthesis. We encapsulated the photosynthetic organelles in a giant vesicle to form a protocellular system and demonstrated optical control of two ATP-dependent reactions, carbon fixation and actin polymerization, with the latter altering outer vesicle morphology. Switchable photosynthetic organelles may enable the development of biomimetic vesicle systems with regulatory networks that exhibit homeostasis and complex cellular behaviors.
Biomimetic membrane systems have been used as bioreactors, permit-ting investigation of specific intracellular metabolic reactions using lipid vesicles in a simplified and isolated in vitro environment2,6,7. These approaches have been applied to study lipid–protein interactions8, membrane dynamics9,10, and cytoskeleton formation4,11,12, as well as synthesis of ATP13,14, DNA15, RNA16,17, and proteins18,19. However, this work has largely relied on spontaneous reactions, making it difficult to maintain, couple, and control cascade reactions. Photosynthesis could provide a sustainable energy source for biomimetic vesicle systems and a means of controlling coupled reactions. Converting light into energy requires at a minimum two membrane-bound proteins, a photocon-verter, and an ATP synthase5. The photoconverter establishes an elec-trochemical gradient across the membrane, generating a proton motive
force (PMF) that drives conversion of ADP to ATP by ATP synthase. ATP synthesis would provide the energy needed for ATP-dependent intravesicular metabolic reactions. As photoconverters from different species have diverse biophysical properties20, it should be possible to directly control PMF generation and ATP synthesis by selecting and combining photoconverters with specific properties. Pioneering studies have demonstrated that reconstituting a photoconverter and an ATP synthase into proteoliposomes enables ATP synthesis13,14. However, these proteoliposomes did not dynamically control chemical reactions or couple with other intravesicular reactions.
We engineered switchable photosynthetic organelles (~100 nm diameter) as energy modules and encapsulated them within a giant lipid vesicle (~10–100 µm diameter) embedded with ionophores to form an encapsulated organelle system (Fig. 1). Activation of the two photoconverters, plant-derived photosystem II (PSII) and bacteria-derived proteorhodopsin (PR), generates PMF across the artificial organelle’s membrane, inducing the ATP synthase to catalyze the conversion of ADP to ATP5 (Fig. 1a). We selected PSII and PR as photoconverters owing to their unique photophysical properties20. PSII is a large protein complex (350 kDa)21 containing 35 chloro-phyll molecules inside chromophores, and PR is a single protein (27 kDa)22 holding only a single retinal chromophore. Blue and red light activates electron transport chains in the PSII reaction center21, whereas mainly green light initiates direct proton pumping in PR22. Moreover, PR exhibits pH-dependent bidirectional proton-pumping ability, determined by the pKa of the primary proton acceptor residue (D97)23. At a higher pH, both PR and PSII work in conjunction to increase the PMF, but at lower pH, PR changes its pumping direc-tion, counteracting the action of PSII. Thus, ATP synthesis can be dynamically facilitated or impeded by stimulation of PSII and PR with red or green light, respectively (Fig. 1b). Finally, we coupled the switchable organelle photosynthesis with actin polymerization, enabling us to control actin assembly inside the giant lipid vesicle and the dynamic interaction between actin filament growth and the membrane (Fig. 1c).
Photosynthetic artificial organelles sustain and control AtP-dependent reactions in a protocellular systemKeel Yong Lee1–4 , Sung-Jin Park2,4, Keon Ah Lee5, Se-Hwan Kim5, Heeyeon Kim1, Yasmine Meroz6, L Mahadevan6,7 , Kwang-Hwan Jung5, Tae Kyu Ahn3, Kevin Kit Parker2,4 & Kwanwoo Shin1,4
1Institute of Biological Interfaces and Department of Chemistry, Sogang University, Seoul, Korea. 2Disease Biophysics Group, Wyss Institute for Biologically Inspired Engineering, John A. Paulson School of Engineering and Applied Sciences, Harvard University, Cambridge, Massachusetts, USA. 3Department of Energy Science, Sungkyunkwan University, Suwon, Korea. 4Sogang-Harvard Research Center for Disease Biophysics, Sogang University, Seoul, Korea. 5Department of Life Science and Institute of Biological Interfaces, Sogang University, Seoul, Korea. 6John A. Paulson School of Engineering and Applied Sciences, Harvard University, Cambridge, Massachusetts, USA. 7Department of Organismic and Evolutionary Biology, Department of Physics, Wyss Institute for Biologically Inspired Engineering, Kavli Institute for Nanobio Science and Technology, Harvard University, Cambridge, Massachusetts, USA. Correspondence should be addressed to K.S. ([email protected]), K.K.P. ([email protected]), T.K.A. ([email protected]), or K.-H.J. ([email protected]).
Received 5 April 2017; accepted 11 April 2018; published online 28 May 2018; doi:10.1038/nbt.4140

© 2
018
Nat
ure
Am
eric
a, In
c., p
art o
f Spr
inge
r Nat
ure.
All
right
s re
serv
ed.
advance online publication nature biotechnology
l e t t e r s
We assembled and tested the encapsulated organelle system pro-gressively: first, the proteoliposome (reconstitution of photoconvert-ers into vesicles), then the photosynthetic organelle (reconstitution of ATP synthase into proteoliposomes), and, finally, the photo-synthetic protocellular system (encapsulating the photosynthetic organelles into a giant lipid vesicle; see Supplementary Fig. 1 for detailed information about lipid compositions and ionic solutions used during testing).
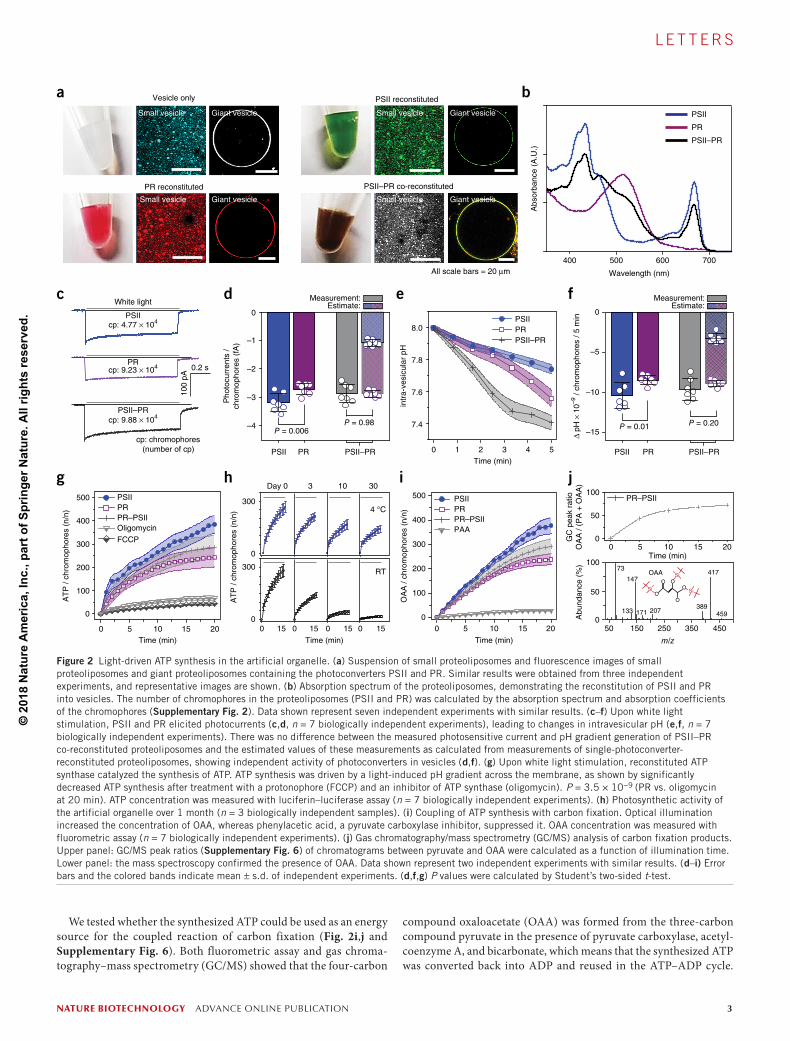
We purified recombinantly expressed PR22 from Gamma proteobac-terium and PSII from Spinacia oleracea and reconstituted the purified proteins into vesicles (Fig. 2a, and Supplementary Fig. 2, and Online Methods). The coexistence of the two proteins in the PSII–PR co-reconstituted proteoliposomes was demonstrated by their black color, resulting from the summation of the individual absorbance bands of PSII (440 nm and 670 nm peaks) and PR (520 nm peak) (Fig. 2b). Upon white light illumination, the PSII–PR co-reconstituted prote-oliposomes generated PMF across their membrane. Ratiometric pH measurement with an encapsulated pH indicator (SNARF-1) (Supplementary Figs. 3 and 4) and patch clamp recording revealed that the two photoconverters in the lipid bilayers that formed on planar patch clamp glass chips produced photocurrent (Fig. 2c,d), which led to a change in the intravesicular pH of the proteoliposomes (Fig. 2e,f and Supplementary Fig. 3e). The photosensitive current and the change in the intravesicular pH of the PSII–PR co-reconstituted proteoliposomes were in ranges similar to the estimated values as
calculated from measurements of single PSII or PR reconstituted pro-teoliposomes (Fig. 2d,f), indicating robust performance of the two photoconverters in the lipid membrane. In addition, the pH gradient was sharply decreased by removing a negatively charged phospholi-pid, 1-palmitoyl-2-oleoyl-sn-glycero-3-phospho-(1′-rac-glycerol) (2.4 × for PR, 2.9 × for PSII), which confirmed that the negatively charged phospholipid improved the orientation and activity of PSII and PSII24,25 (Supplementary Fig. 5).
Next, ATP synthase purified from Bacillus pseudofirmus was reconstituted into PSII–PR co-reconstituted proteoliposomes. The PMF driven by optical activation was sufficient to induce ATP synthesis. The maximum turnover number for ATP synthesis was 4.3 ± 0.1 s−1, measured by the luciferin–luciferase assay. This indi-cates that the ATP synthesis per ATP synthase achieved was up to 13.3–32.3% of the ATP turnover number of Escherichia coli (13–33 s−1)26 (Supplementary Note 1). ATP was produced outside the artificial organelles at the sites where ATP synthases were integrated into the proteoliposomes (Fig. 2g). ATP synthesis sharply decreased upon treatment with a protonophore (carbonyl cyanide-p- trifluoromethoxyphenylhydrazone) and an inhibitor of ATP synthase (oligomycin), demonstrating that ATP synthesis was directly coupled with the light-driven electrochemical potential gradient (Fig. 2g). The artificial organelle sustained ATP conversion for 3 days (half-maximum efficiency) at room temperature and 1 month at 4 °C (Fig. 2h).
c
ProtonRed light:facilitation signalATPADP
Green light:impediment signal
ATP
ADP
Giant vesicle Ionophore
Actin filamentsActin
polymerization
Photosyntheticorganelle
H+ depletion
H+ generation
ATP
synthesis
b
Green
ADP ATP
H+
PR PSII
H+
depletion
PR PSII
Green light immediatelyimpedes ATP synthesis
Red light facilitates ATP synthesis
ATP synthase
ATP synthase
Reda
Proton
ATP
ADP
Water
H+ ∆pH
PR
PSII
ATP synthase
(1) Activation of
photoconvertors
(3) ATP
synthesis
(2) PMF
generation
generation
Figure 1 Design and applications of the photosynthetic artificial organelle. (a) Upon optical stimulation, the artificial organelle synthesizes ATP by the coordinated activation of two complementary photoconverters (PSII and PR) and an ATP synthase reconstituted into the organelle’s membrane. (b) Activation of PSII with red light facilitates ATP synthesis by generating protons inside the organelle, while activation of PR with green light impedes ATP synthesis by depleting protons. (c) After organelle energy modules are encapsulated in a giant vesicle, optical stimulation couples ATP synthesis with ATP-dependent actin polymerization and morphological change of the vesicle.
© 2
018
Nat
ure
Am
eric
a, In
c., p
art o
f Spr
inge
r Nat
ure.
All
right
s re
serv
ed.
nature biotechnology advance online publication
l e t t e r s
We tested whether the synthesized ATP could be used as an energy source for the coupled reaction of carbon fixation (Fig. 2i,j and Supplementary Fig. 6). Both fluorometric assay and gas chroma-tography–mass spectrometry (GC/MS) showed that the four-carbon
compound oxaloacetate (OAA) was formed from the three-carbon compound pyruvate in the presence of pyruvate carboxylase, acetyl-coenzyme A, and bicarbonate, which means that the synthesized ATP was converted back into ADP and reused in the ATP–ADP cycle.
White light
AT
P /
chro
mop
hore
s (n
/n)
PR
PSII–PR
PSIIcp: 4.77 × 10⁴
cp: 9.23 × 10⁴
cp: 9.88 × 10⁴
c
g
0.2 s
100
pA
cp: chromophores(number of cp)
PR reconstituted
PSII reconstituted
PSII–PR co-reconstituted
All scale bars = 20 µm
Vesicle onlyaSmall vesicle Giant vesicle Small vesicle Giant vesicle
Small vesicle Giant vesicle Small vesicle Giant vesicle
b
Wavelength (nm)
Abs
orba
nce
(A.U
.)
400 500 600 700
PSII
PR
PSII–PR
Time (min)0 5 10 15 20
0
100
200
300
400
500 PSII PR PR–PSII Oligomycin
FCCP
e
i
8.0
7.8
7.6
7.4
0 1 2 3 4 5Time (min)
PSIIPRPSII–PR
Time (min)
OA
A /
chro
mop
hore
s (n
/n)
0 5 10 15 20
200
300
400
500 PSII PR PR–PSII PAA
0
100
intr
a-ve
sicu
lar
pH
AT
P /
chro
mop
hore
s (n
/n)
d
h
0
300
0
300
Day 0 3 10 30
4 °C
RT
0 15 0 15 0 15 0 15
Time (min)
Estimate:Measurement:
Pho
tocu
rren
ts /
chro
mop
hore
s (f
A)
–2
–1
0
–3
–4 P = 0.98P = 0.006
PSII PR PSII–PR
f
j
0
50
100
PR–PSII
50 150 250 350 450
m/z
Abu
ndan
ce (
%)
0
50
100
GC
pea
k ra
tioO
AA
/ (P
A +
OA
A)
OAA73
417147
389133 207171 459
Time (min)0 5 10 15 20
SiO
O
OO
O
Si
Si
PSII PR PSII–PR
Estimate:Measurement:
∆ pH
× 1
0–9 /
chro
mop
hore
s / 5
min
–10
–5
0
–15P = 0.01 P = 0.20
Figure 2 Light-driven ATP synthesis in the artificial organelle. (a) Suspension of small proteoliposomes and fluorescence images of small proteoliposomes and giant proteoliposomes containing the photoconverters PSII and PR. Similar results were obtained from three independent experiments, and representative images are shown. (b) Absorption spectrum of the proteoliposomes, demonstrating the reconstitution of PSII and PR into vesicles. The number of chromophores in the proteoliposomes (PSII and PR) was calculated by the absorption spectrum and absorption coefficients of the chromophores (Supplementary Fig. 2). Data shown represent seven independent experiments with similar results. (c–f) Upon white light stimulation, PSII and PR elicited photocurrents (c,d, n = 7 biologically independent experiments), leading to changes in intravesicular pH (e,f, n = 7 biologically independent experiments). There was no difference between the measured photosensitive current and pH gradient generation of PSII–PR co-reconstituted proteoliposomes and the estimated values of these measurements as calculated from measurements of single-photoconverter-reconstituted proteoliposomes, showing independent activity of photoconverters in vesicles (d,f). (g) Upon white light stimulation, reconstituted ATP synthase catalyzed the synthesis of ATP. ATP synthesis was driven by a light-induced pH gradient across the membrane, as shown by significantly decreased ATP synthesis after treatment with a protonophore (FCCP) and an inhibitor of ATP synthase (oligomycin). P = 3.5 × 10⁻⁹ (PR vs. oligomycin at 20 min). ATP concentration was measured with luciferin–luciferase assay (n = 7 biologically independent experiments). (h) Photosynthetic activity of the artificial organelle over 1 month (n = 3 biologically independent samples). (i) Coupling of ATP synthesis with carbon fixation. Optical illumination increased the concentration of OAA, whereas phenylacetic acid, a pyruvate carboxylase inhibitor, suppressed it. OAA concentration was measured with fluorometric assay (n = 7 biologically independent experiments). (j) Gas chromatography/mass spectrometry (GC/MS) analysis of carbon fixation products. Upper panel: GC/MS peak ratios (Supplementary Fig. 6) of chromatograms between pyruvate and OAA were calculated as a function of illumination time. Lower panel: the mass spectroscopy confirmed the presence of OAA. Data shown represent two independent experiments with similar results. (d–i) Error bars and the colored bands indicate mean ± s.d. of independent experiments. (d,f,g) P values were calculated by Student’s two-sided t-test.
© 2
018
Nat
ure
Am
eric
a, In
c., p
art o
f Spr
inge
r Nat
ure.
All
right
s re
serv
ed.
advance online publication nature biotechnology
l e t t e r s
The conversion of pyruvate into OAA was abolished by phenylace-tic acid, an inhibitor of pyruvate carboxylase activity, indicating direct coupling of carbon fixation with ATP synthesis (Fig. 2i and Supplementary Fig. 7).
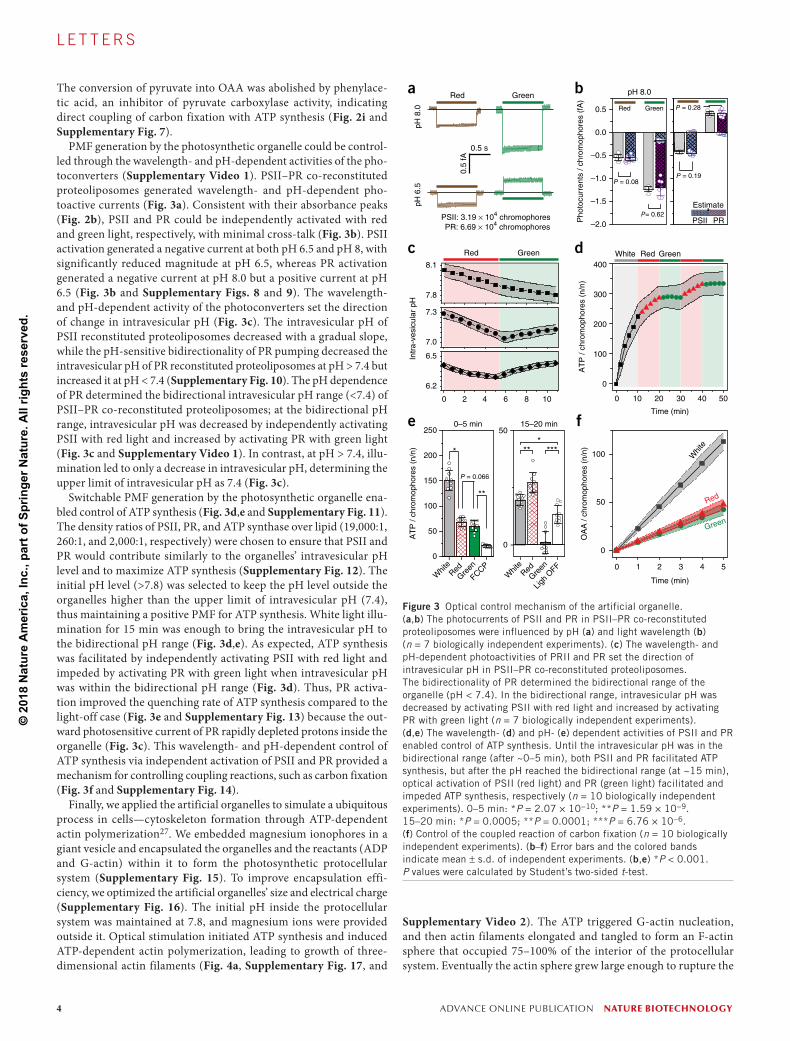
PMF generation by the photosynthetic organelle could be control-led through the wavelength- and pH-dependent activities of the pho-toconverters (Supplementary Video 1). PSII–PR co-reconstituted proteoliposomes generated wavelength- and pH-dependent pho-toactive currents (Fig. 3a). Consistent with their absorbance peaks (Fig. 2b), PSII and PR could be independently activated with red and green light, respectively, with minimal cross-talk (Fig. 3b). PSII activation generated a negative current at both pH 6.5 and pH 8, with significantly reduced magnitude at pH 6.5, whereas PR activation generated a negative current at pH 8.0 but a positive current at pH 6.5 (Fig. 3b and Supplementary Figs. 8 and 9). The wavelength- and pH-dependent activity of the photoconverters set the direction of change in intravesicular pH (Fig. 3c). The intravesicular pH of PSII reconstituted proteoliposomes decreased with a gradual slope, while the pH-sensitive bidirectionality of PR pumping decreased the intravesicular pH of PR reconstituted proteoliposomes at pH > 7.4 but increased it at pH < 7.4 (Supplementary Fig. 10). The pH dependence of PR determined the bidirectional intravesicular pH range (<7.4) of PSII–PR co-reconstituted proteoliposomes; at the bidirectional pH range, intravesicular pH was decreased by independently activating PSII with red light and increased by activating PR with green light (Fig. 3c and Supplementary Video 1). In contrast, at pH > 7.4, illu-mination led to only a decrease in intravesicular pH, determining the upper limit of intravesicular pH as 7.4 (Fig. 3c).
Switchable PMF generation by the photosynthetic organelle ena-bled control of ATP synthesis (Fig. 3d,e and Supplementary Fig. 11). The density ratios of PSII, PR, and ATP synthase over lipid (19,000:1, 260:1, and 2,000:1, respectively) were chosen to ensure that PSII and PR would contribute similarly to the organelles’ intravesicular pH level and to maximize ATP synthesis (Supplementary Fig. 12). The initial pH level (>7.8) was selected to keep the pH level outside the organelles higher than the upper limit of intravesicular pH (7.4), thus maintaining a positive PMF for ATP synthesis. White light illu-mination for 15 min was enough to bring the intravesicular pH to the bidirectional pH range (Fig. 3d,e). As expected, ATP synthesis was facilitated by independently activating PSII with red light and impeded by activating PR with green light when intravesicular pH was within the bidirectional pH range (Fig. 3d). Thus, PR activa-tion improved the quenching rate of ATP synthesis compared to the light-off case (Fig. 3e and Supplementary Fig. 13) because the out-ward photosensitive current of PR rapidly depleted protons inside the organelle (Fig. 3c). This wavelength- and pH-dependent control of ATP synthesis via independent activation of PSII and PR provided a mechanism for controlling coupling reactions, such as carbon fixation (Fig. 3f and Supplementary Fig. 14).
Finally, we applied the artificial organelles to simulate a ubiquitous process in cells—cytoskeleton formation through ATP-dependent actin polymerization27. We embedded magnesium ionophores in a giant vesicle and encapsulated the organelles and the reactants (ADP and G-actin) within it to form the photosynthetic protocellular system (Supplementary Fig. 15). To improve encapsulation effi-ciency, we optimized the artificial organelles’ size and electrical charge (Supplementary Fig. 16). The initial pH inside the protocellular system was maintained at 7.8, and magnesium ions were provided outside it. Optical stimulation initiated ATP synthesis and induced ATP-dependent actin polymerization, leading to growth of three-dimensional actin filaments (Fig. 4a, Supplementary Fig. 17, and
Supplementary Video 2). The ATP triggered G-actin nucleation, and then actin filaments elongated and tangled to form an F-actin sphere that occupied 75–100% of the interior of the protocellular system. Eventually the actin sphere grew large enough to rupture the
pH 8
.0
0.5 s
0.5
fA
Green
PSII: 3.19 × 10⁴ chromophoresPR: 6.69 × 10⁴ chromophores
Pho
tocu
rren
ts /
chro
mop
hore
s (f
A)
pH 6
.5
Red
0 2 4 6 8 10
7.8
8.1
7.0
7.3
6.2
6.5
0 1 2 3 4 5
Whi
te
Red
Green
Time (min)
0
50
100
OA
A /
chro
mop
hore
s (n
/n)
Red Green
pH 8.0
Intr
a-ve
sicu
lar
pH
Estimate
PSII PR
P = 0.28
P = 0.19
a b
c
AT
P /
chro
mop
hore
s (n
/n)
0–5 min 15–20 min
0
Whit
eRed
Green
FCCPW
hite
RedGre
en
Ligh
OFF
0
50
50
150
100
200
250
P = 0.066
e
AT
P /
chro
mop
hore
s (n
/n)
0 10 20 30 40
Time (min)
50
0
100
200
300
400Red GreenWhited
f
–2.0
–1.5
–1.0
–0.5
0.0
0.5 Red Green
P = 0.08
P= 0.62
** **
**
***
Figure 3 Optical control mechanism of the artificial organelle. (a,b) The photocurrents of PSII and PR in PSII–PR co-reconstituted proteoliposomes were influenced by pH (a) and light wavelength (b) (n = 7 biologically independent experiments). (c) The wavelength- and pH-dependent photoactivities of PRII and PR set the direction of intravesicular pH in PSII–PR co-reconstituted proteoliposomes. The bidirectionality of PR determined the bidirectional range of the organelle (pH < 7.4). In the bidirectional range, intravesicular pH was decreased by activating PSII with red light and increased by activating PR with green light (n = 7 biologically independent experiments). (d,e) The wavelength- (d) and pH- (e) dependent activities of PSII and PR enabled control of ATP synthesis. Until the intravesicular pH was in the bidirectional range (after ~0–5 min), both PSII and PR facilitated ATP synthesis, but after the pH reached the bidirectional range (at ~15 min), optical activation of PSII (red light) and PR (green light) facilitated and impeded ATP synthesis, respectively (n = 10 biologically independent experiments). 0–5 min: *P = 2.07 × 10⁻¹⁰; **P = 1.59 × 10⁻⁹. 15–20 min: *P = 0.0005; **P = 0.0001; ***P = 6.76 × 10⁻⁶. (f) Control of the coupled reaction of carbon fixation (n = 10 biologically independent experiments). (b–f) Error bars and the colored bands indicate mean ± s.d. of independent experiments. (b,e) *P < 0.001. P values were calculated by Student’s two-sided t-test.

© 2
018
Nat
ure
Am
eric
a, In
c., p
art o
f Spr
inge
r Nat
ure.
All
right
s re
serv
ed.
nature biotechnology advance online publication
l e t t e r s
membrane (Fig. 4b and Supplementary Video 3). Red light facili-tated and green light impeded filament growth via independent PSII and PR activation (Fig. 4c and Supplementary Video 4). In addi-tion, PR activation by green light improved the quenching rate of actin polymerization compared with the light-off case (Fig. 4d and Supplementary Video 5).
Both our analytical model and our experimental results demon-strated that ATP synthesis by the artificial organelles was the dominant process in actin filament growth. In the analytical model, the increase of the radius of the F-actin sphere was predicted to be proportional to the amount of ATP produced over time, that is, R(t) ∝ ATP(t), when the growth-rate-limiting process is associated with diffusion of synthesized ATP from the organelles to the existing F-actin sphere. Figures 2g and 3d show white-light-induced ATP production that follows the relation ATP ∝ t1/2, while Figure 4b shows that the projected area of the F-actin sphere grows linearly in time, that is, R2(t) ∝ t, which is consistent with the argument that ATP diffu-sion is the limiting process. These observations yield R(t) ∝ ATP(t) (Supplementary Fig. 18 and Supplementary Note 1). In addition,
actin filaments did not form in the absence of light stimulation, arti-ficial organelles, or ADP, indicating that actin polymerization was completely dependent on ATP synthesized by the artificial organelles (Supplementary Fig. 19 and Supplementary Videos 6–9).
Moreover, cytoskeleton formation and manipulation induced morphological change of the outer membrane of the protocel-lular system via membrane–actin interactions27,28. As actin fila-ments grew, they protruded into the outer membrane, deforming and eventually rupturing it (Fig. 4b and Supplementary Videos 3 and 10–12). This behavior confirmed that the elastic interaction between the actin filaments and the membrane was the sole cause of membrane deformation, without additional bundling or the for-mation of tip-complex proteins11,12. To control membrane–actin interactions, we used three different membrane mixtures exhibiting a range of attraction–repulsion interactions with actin filaments: a liquid-disordered phase mixture (Ld) composed of polyunsaturated phospholipids that produced a strong attractive interaction, a liquid-ordered phase mixture (Lo1) composed of sphingomyelin and choles-terol that produced a weak attractive interaction, and a liquid-ordered
Red: membrane (Lo1 phase)Green: organelle
White: actinGreen: Ld phase
White: actin
Red: Lo2 phase
20 µm 20 µm
h i j
Actin
Organelle
Ld phase:AttractiveInteraction
Lo2 phaseRepulsive Interaction
Phase-separatedouter membrane
Z (µm)
X (µm)
Y (µ
m)
060 00
5050
Green: organelleRed: membrane
White: actin
a b c d15 min
F-actin sphere growthburst
F-actin
elongation
Time (min)
Pro
ject
ed a
ctin
are
a (%
)
60 135 280 310
0 50 100 150 200 250 3000
20
40
60
80
Nucleation
20 µm
Pro
ject
ed a
ctin
are
a(%
) / m
in
0.0
0.2
0.1
0.4
0.3
Red
P = 0.02
P = 3 × 10⁻⁴
e f g
Red: membraneGreen: organelleWhite: actin
Ld phase
actin
Photosyntheticorganelle
Strong attractive interaction (Ld phase)
Curvature (µm–1)
–0.1 0.0 0.1
20 µm 20 µm
Curvature (µm–1) Curvature (µm–1)–0.1 0.0 0.1Red: membrane
Green: organelleWhite: actin
Lo2 phase
PEG2000
Strong repulsive interaction (Lo2 phase)
Fra
ctio
n
–0.1 0.0 0.10.0
0.4
0.2
Lo2Ld
Phase FWHM0.0080.065
Pro
ject
ed a
ctin
are
a (%
)
Time (min)120 180 240 300
0
10
20
30
40
Red Green Red
Green
OFF
Figure 4 Control of actin polymerization and membrane shape of the photosynthetic protocellular system by light. (a) Three-dimensional reconstruction of the complete system from confocal microscopy images. The ATP-dependent polymerization of actin filaments (white lines) was triggered by red light activation of the artificial organelles. Similar results were obtained from two independent experiments, and representative images are shown. (b) Optical stimulation initiated G-actin nucleation (~15 min) and F-actin elongation (~60 min), leading to formation of a single F-actin sphere (~135 min). The F-actin sphere grew until the membrane ruptured (260 min). Similar results were obtained from three independent experiments, and representative images and data are shown. (c) Actin polymerization was controlled by red and green light. The data are representative of four independent experiments with similar results. (d) Optical control of actin growth (n = 4 biologically independent experiments). Error bars indicate mean ± s.d. of four independent experiments. P values were calculated by Student’s two-sided t-test. (e–j) Membrane deformation caused by impingement of polymerized actin on the outer membrane. (e,f) Local deformation of a liquid-disordered (Ld) or a liquid-ordered (Lo2) phase membrane. Polymerized actin was strongly attached to the Ld phase membrane (e) but was separated from the Lo2 membrane by a gap (f). (g) Strong attractive interactions between the Ld phase membrane and actin filaments deformed the local membrane, leading to a broad distribution of local curvature, while the inhibition of membrane–actin interactions between the Lo2 phase membrane and actin filaments maintained a circular membrane shape with a narrow distribution of local curvature. (h) The global deformation of phase-separated membranes composed of Ld and Lo mixtures. (i,j) Actin polymerization deformed the spherical membrane system into teardrop (i) or mushroom (j) shapes via heterogeneous membrane–actin interactions. (e–j) The data and images are representative of three independent experiments with similar results.

© 2
018
Nat
ure
Am
eric
a, In
c., p
art o
f Spr
inge
r Nat
ure.
All
right
s re
serv
ed.
advance online publication nature biotechnology
l e t t e r s
phase mixture (Lo2) composed of sphingomyelin, cholesterol, and polysaturated 1,2-dioleoyl-sn-glycero-3-phosphoethanolamine-N-[methoxy(polyethylene glycol)-2000] (polysaturated-PEG2000-PE) that produced a strong repulsive interaction (Supplementary Fig. 20). Upon optical stimulation, the single-phase membrane system made of Ld and Lo1 altered local membrane curvature owing to the attrac-tive interaction, but the system made of Lo2 maintained a spherical shape owing to the repulsive interaction (Fig. 4e–g, Supplementary Fig. 20, and Supplementary Videos 10–12). In the phase-separated membrane systems made of two different mixtures (such as Ld-Lo1 and Ld-Lo2) (Fig. 4h and Supplementary Fig. 21), the difference between local membrane–actin interactions induced changes in the global cell curvature, deforming the spherical cells into teardrop or mushroom shapes (Fig. 4i,j, Supplementary Figs. 21 and 22, and Supplementary Video 13).
Our demonstration that switchable photosynthetic organelles can control ATP-dependent cytoskeleton formation and thus the morphology of the protocellular system supports the possibility of developing artificial cell-like systems that replicate homeostasis and complex cellular behaviors, in vitro. Just like chloroplasts and mito-chondria in nature, the photosynthetic artificial organelle presented here served as an energy module for the protocellular system. The resulting system was able to induce and control cascading metabolic reactions (carbon fixation, actin polymerization) as well as exhibit cell-like behavior (morphological change). We envision that our bot-tom-up approach could be used to create isolated modules repre-senting additional organelles, such as the endoplasmic reticulum for protein metabolism or nucleus for genetic replication. Introducing networks of proteins and organelles into artificial cell-like environ-ments may contribute to achieving the long-standing goal of building a cell de novo29,30.
MeTHodSMethods, including statements of data availability and any associated accession codes and references, are available in the online version of the paper.
Note: Any Supplementary Information and Source Data files are available in the online version of the paper.
AcKnowLedgMenTSThis work was supported by the Mid-Career Researcher Programs (2016R1A2B3015239 and 2011-0017539), Foreign Research Institute Recruitment Program (2013K1A4A3055268), 2015R1D1A1A01058917, and DRC-14-03-KRICT through the National Research Foundation, funded by the Ministry of Science and ICT, Korea. K.Y.L. and T.K.A. acknowledge the support provided by the Woo Jang Chun Special Project of the Rural Development Administration, Korea (PJ009106022013).
AUTHoR conTRIBUTIonSK.Y.L., S.-J.P., K.-H.J., T.K.A., K.K.P., and K.S. developed the concept and supervised experiments. K.Y.L., K.A.L., and S.-H.K. carried out purification of photoconverters and ATP synthase. K.Y.L. and H.K. calibrated intravesicular pH. K.Y.L. and S.-J.P. performed photocurrent measurements. K.Y.L., S.-J.P., and K.S. designed the photosynthetic protocellular system with artificial organelles and performed reconstitution experiments. Y.M., K.Y.L., S.-J.P., and L.M. worked out the theoretical description. All authors discussed the results and contributed to the writing of the final manuscript.
coMPeTIng InTeReSTSThe author declares no competing interests.
reprints and permissions information is available online at http://www.nature.com/reprints/index.html. Publisher’s note: springer Nature remains neutral with regard to jurisdictional claims in published maps and institutional affiliations.
1. Purnick, P.E.M. & Weiss, R. The second wave of synthetic biology: from modules to systems. Nat. Rev. Mol. Cell Biol. 10, 410–422 (2009).
2. Adamala, K.P., Martin-Alarcon, D.A., Guthrie-Honea, K.R. & Boyden, E.S. Engineering genetic circuit interactions within and between synthetic minimal cells. Nat. Chem. 9, 431–439 (2017).
3. Liu, A.P. & Fletcher, D.A. Biology under construction: in vitro reconstitution of cellular function. Nat. Rev. Mol. Cell Biol. 10, 644–650 (2009).
4. Rivas, G., Vogel, S.K. & Schwille, P. Reconstitution of cytoskeletal protein assemblies for large-scale membrane transformation. Curr. Opin. Chem. Biol. 22, 18–26 (2014).
5. Wang, L., Roth, J.S., Han, X. & Evans, S.D. Photosynthetic proteins in supported lipid bilayers: towards a biokleptic approach for energy capture. Small 11, 3306–3318 (2015).
6. Gardner, P.M., Winzer, K. & Davis, B.G. Sugar synthesis in a protocellular model leads to a cell signalling response in bacteria. Nat. Chem. 1, 377–383 (2009).
7. Elani, Y., Law, R.V. & Ces, O. Vesicle-based artificial cells as chemical microreactors with spatially segregated reaction pathways. Nat. Commun. 5, 5305 (2014).
8. Rossman, J.S., Jing, X., Leser, G.P. & Lamb, R.A. Influenza virus M2 protein mediates ESCRT-independent membrane scission. Cell 142, 902–913 (2010).
9. Lingwood, D. & Simons, K. Lipid rafts as a membrane-organizing principle. Science 327, 46–50 (2010).
10. Keber, F.C. et al. Topology and dynamics of active nematic vesicles. Science 345, 1135–1139 (2014).
11. Carvalho, K. et al. Cell-sized liposomes reveal how actomyosin cortical tension drives shape change. Proc. Natl. Acad. Sci. USA 110, 16456–16461 (2013).
12. Liu, A.P. et al. Membrane-induced bundling of actin filaments. Nat. Phys. 4, 789–793 (2008).
13. Choi, H.-J. & Montemagno, C.D. Artificial organelle: ATP synthesis from cellular mimetic polymersomes. Nano Lett. 5, 2538–2542 (2005).
14. Feng, X., Jia, Y., Cai, P., Fei, J. & Li, J. Coassembly of photosystem II and ATPase as artificial chloroplast for light-driven ATP Synthesis. ACS Nano 10, 556–561 (2016).
15. Kurihara, K. et al. A recursive vesicle-based model protocell with a primitive model cell cycle. Nat. Commun. 6, 8352 (2015).
16. Tsuji, G., Fujii, S., Sunami, T. & Yomo, T. Sustainable proliferation of liposomes compatible with inner RNA replication. Proc. Natl. Acad. Sci. USA 113, 590–595 (2016).
17. Chan, V., Novakowski, S.K., Law, S., Klein-Bosgoed, C. & Kastrup, C.J. Controlled transcription of exogenous mRNA in platelets using protocells. Angew. Chem. Int. Ed. 54, 13590–13593 (2015).
18. Noireaux, V. & Libchaber, A. A vesicle bioreactor as a step toward an artificial cell assembly. Proc. Natl. Acad. Sci. USA 101, 17669–17674 (2004).
19. Kapoor, V. & Wendell, D. Engineering bacterial efflux pumps for solar-powered bioremediation of surface waters. Nano Lett. 13, 2189–2193 (2013).
20. Hohmann-Marriott, M.F. & Blankenship, R.E. Evolution of photosynthesis. Annu. Rev. Plant Biol. 62, 515–548 (2011).
21. Umena, Y., Kawakami, K., Shen, J.R. & Kamiya, N. Crystal structure of oxygen-evolving photosystem II at a resolution of 1.9 Å. Nature 473, 55–60 (2011).
22. Béjà, O. et al. Bacterial rhodopsin: evidence for a new type of phototrophy in the sea. Science 289, 1902–1906 (2000).
23. Bamann, C., Bamberg, E., Wachtveitl, J. & Glaubitz, C. Proteorhodopsin. Biochim. Biophys. Acta 1837, 614–625 (2014).
24. Tunuguntla, R. et al. Lipid bilayer composition can influence the orientation of proteorhodopsin in artificial membranes. Biophys. J. 105, 1388–1396 (2013).
25. Bogdanov, M., Xie, J., Heacock, P. & Dowhan, W. To flip or not to flip: lipid-protein charge interactions are a determinant of final membrane protein topology. J. Cell Biol. 182, 925–935 (2008).
26. Tomashek, J.J., Glagoleva, O.B. & Brusilow, W.S.A. The Escherichia coli F1F0 ATP synthase displays biphasic synthesis kinetics. J. Biol. Chem. 279, 4465–4470 (2004).
27. Pollard, T.D. & Borisy, G.G. Cellular motility driven by assembly and disassembly of actin filaments. Cell 112, 453–465 (2003).
28. Fletcher, D.A. & Mullins, R.D. Cell mechanics and the cytoskeleton. Nature 463, 485–492 (2010).
29. Rafelski, S.M. & Marshall, W.F. Building the cell: design principles of cellular architecture. Nat. Rev. Mol. Cell Biol. 9, 593–602 (2008).
30. Walde, P. Building artificial cells and protocell models: experimental approaches with lipid vesicles. BioEssays 32, 296–303 (2010).
© 2
018
Nat
ure
Am
eric
a, In
c., p
art o
f Spr
inge
r Nat
ure.
All
right
s re
serv
ed.
nature biotechnologydoi:10.1038/nbt.4140
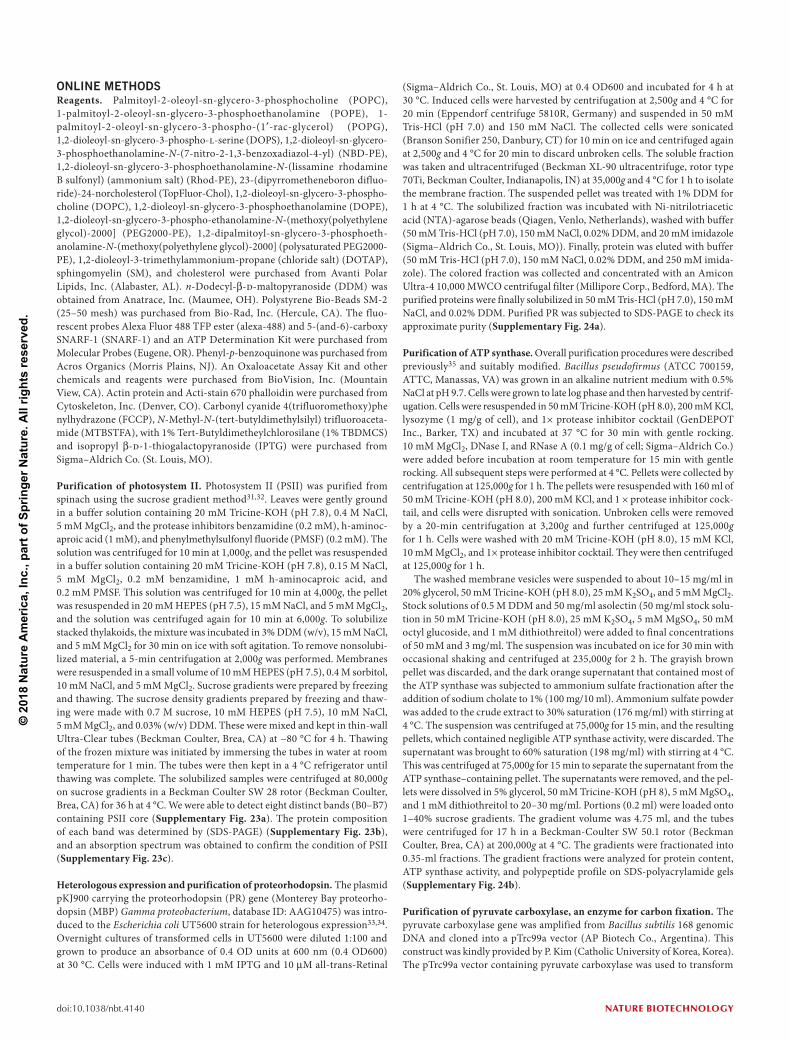
oNLINe MeTHodSReagents. Palmitoyl-2-oleoyl-sn-glycero-3-phosphocholine (POPC), 1-palmitoyl-2-oleoyl-sn-glycero-3-phosphoethanolamine (POPE), 1-palmitoyl-2-oleoyl-sn-glycero-3-phospho-(1′-rac-glycerol) (POPG), 1,2-dioleoyl-sn-glycero-3-phospho-l-serine (DOPS), 1,2-dioleoyl-sn-glycero-3-phosphoethanolamine-N-(7-nitro-2-1,3-benzoxadiazol-4-yl) (NBD-PE), 1,2-dioleoyl-sn-glycero-3-phosphoethanolamine-N-(lissamine rhodamine B sulfonyl) (ammonium salt) (Rhod-PE), 23-(dipyrrometheneboron difluo-ride)-24-norcholesterol (TopFluor-Chol), 1,2-dioleoyl-sn-glycero-3-phospho-choline (DOPC), 1,2-dioleoyl-sn-glycero-3-phosphoethanolamine (DOPE), 1,2-dioleoyl-sn-glycero-3-phospho-ethanolamine-N-(methoxy(polyethylene glycol)-2000] (PEG2000-PE), 1,2-dipalmitoyl-sn-glycero-3-phosphoeth-anolamine-N-(methoxy(polyethylene glycol)-2000] (polysaturated PEG2000-PE), 1,2-dioleoyl-3-trimethylammonium-propane (chloride salt) (DOTAP), sphingomyelin (SM), and cholesterol were purchased from Avanti Polar Lipids, Inc. (Alabaster, AL). n-Dodecyl-β-d-maltopyranoside (DDM) was obtained from Anatrace, Inc. (Maumee, OH). Polystyrene Bio-Beads SM-2 (25–50 mesh) was purchased from Bio-Rad, Inc. (Hercule, CA). The fluo-rescent probes Alexa Fluor 488 TFP ester (alexa-488) and 5-(and-6)-carboxy SNARF-1 (SNARF-1) and an ATP Determination Kit were purchased from Molecular Probes (Eugene, OR). Phenyl-p-benzoquinone was purchased from Acros Organics (Morris Plains, NJ). An Oxaloacetate Assay Kit and other chemicals and reagents were purchased from BioVision, Inc. (Mountain View, CA). Actin protein and Acti-stain 670 phalloidin were purchased from Cytoskeleton, Inc. (Denver, CO). Carbonyl cyanide 4(trifluoromethoxy)phenylhydrazone (FCCP), N-Methyl-N-(tert-butyldimethylsilyl) trifluoroaceta-mide (MTBSTFA), with 1% Tert-Butyldimetheylchlorosilane (1% TBDMCS) and isopropyl β-d-1-thiogalactopyranoside (IPTG) were purchased from Sigma–Aldrich Co. (St. Louis, MO).
Purification of photosystem II. Photosystem II (PSII) was purified from spinach using the sucrose gradient method31,32. Leaves were gently ground in a buffer solution containing 20 mM Tricine-KOH (pH 7.8), 0.4 M NaCl, 5 mM MgCl2, and the protease inhibitors benzamidine (0.2 mM), h-aminoc-aproic acid (1 mM), and phenylmethylsulfonyl fluoride (PMSF) (0.2 mM). The solution was centrifuged for 10 min at 1,000g, and the pellet was resuspended in a buffer solution containing 20 mM Tricine-KOH (pH 7.8), 0.15 M NaCl, 5 mM MgCl2, 0.2 mM benzamidine, 1 mM h-aminocaproic acid, and 0.2 mM PMSF. This solution was centrifuged for 10 min at 4,000g, the pellet was resuspended in 20 mM HEPES (pH 7.5), 15 mM NaCl, and 5 mM MgCl2, and the solution was centrifuged again for 10 min at 6,000g. To solubilize stacked thylakoids, the mixture was incubated in 3% DDM (w/v), 15 mM NaCl, and 5 mM MgCl2 for 30 min on ice with soft agitation. To remove nonsolubi-lized material, a 5-min centrifugation at 2,000g was performed. Membranes were resuspended in a small volume of 10 mM HEPES (pH 7.5), 0.4 M sorbitol, 10 mM NaCl, and 5 mM MgCl2. Sucrose gradients were prepared by freezing and thawing. The sucrose density gradients prepared by freezing and thaw-ing were made with 0.7 M sucrose, 10 mM HEPES (pH 7.5), 10 mM NaCl, 5 mM MgCl2, and 0.03% (w/v) DDM. These were mixed and kept in thin-wall Ultra-Clear tubes (Beckman Coulter, Brea, CA) at −80 °C for 4 h. Thawing of the frozen mixture was initiated by immersing the tubes in water at room temperature for 1 min. The tubes were then kept in a 4 °C refrigerator until thawing was complete. The solubilized samples were centrifuged at 80,000g on sucrose gradients in a Beckman Coulter SW 28 rotor (Beckman Coulter, Brea, CA) for 36 h at 4 °C. We were able to detect eight distinct bands (B0–B7) containing PSII core (Supplementary Fig. 23a). The protein composition of each band was determined by (SDS-PAGE) (Supplementary Fig. 23b), and an absorption spectrum was obtained to confirm the condition of PSII (Supplementary Fig. 23c).
Heterologous expression and purification of proteorhodopsin. The plasmid pKJ900 carrying the proteorhodopsin (PR) gene (Monterey Bay proteorho-dopsin (MBP) Gamma proteobacterium, database ID: AAG10475) was intro-duced to the Escherichia coli UT5600 strain for heterologous expression33,34. Overnight cultures of transformed cells in UT5600 were diluted 1:100 and grown to produce an absorbance of 0.4 OD units at 600 nm (0.4 OD600) at 30 °C. Cells were induced with 1 mM IPTG and 10 µM all-trans-Retinal
(Sigma–Aldrich Co., St. Louis, MO) at 0.4 OD600 and incubated for 4 h at 30 °C. Induced cells were harvested by centrifugation at 2,500g and 4 °C for 20 min (Eppendorf centrifuge 5810R, Germany) and suspended in 50 mM Tris-HCl (pH 7.0) and 150 mM NaCl. The collected cells were sonicated (Branson Sonifier 250, Danbury, CT) for 10 min on ice and centrifuged again at 2,500g and 4 °C for 20 min to discard unbroken cells. The soluble fraction was taken and ultracentrifuged (Beckman XL-90 ultracentrifuge, rotor type 70Ti, Beckman Coulter, Indianapolis, IN) at 35,000g and 4 °C for 1 h to isolate the membrane fraction. The suspended pellet was treated with 1% DDM for 1 h at 4 °C. The solubilized fraction was incubated with Ni-nitrilotriacetic acid (NTA)-agarose beads (Qiagen, Venlo, Netherlands), washed with buffer (50 mM Tris-HCl (pH 7.0), 150 mM NaCl, 0.02% DDM, and 20 mM imidazole (Sigma–Aldrich Co., St. Louis, MO)). Finally, protein was eluted with buffer (50 mM Tris-HCl (pH 7.0), 150 mM NaCl, 0.02% DDM, and 250 mM imida-zole). The colored fraction was collected and concentrated with an Amicon Ultra-4 10,000 MWCO centrifugal filter (Millipore Corp., Bedford, MA). The purified proteins were finally solubilized in 50 mM Tris-HCl (pH 7.0), 150 mM NaCl, and 0.02% DDM. Purified PR was subjected to SDS-PAGE to check its approximate purity (Supplementary Fig. 24a).
Purification of ATP synthase. Overall purification procedures were described previously35 and suitably modified. Bacillus pseudofirmus (ATCC 700159, ATTC, Manassas, VA) was grown in an alkaline nutrient medium with 0.5% NaCl at pH 9.7. Cells were grown to late log phase and then harvested by centrif-ugation. Cells were resuspended in 50 mM Tricine-KOH (pH 8.0), 200 mM KCl, lysozyme (1 mg/g of cell), and 1× protease inhibitor cocktail (GenDEPOT Inc., Barker, TX) and incubated at 37 °C for 30 min with gentle rocking. 10 mM MgCl2, DNase I, and RNase A (0.1 mg/g of cell; Sigma–Aldrich Co.) were added before incubation at room temperature for 15 min with gentle rocking. All subsequent steps were performed at 4 °C. Pellets were collected by centrifugation at 125,000g for 1 h. The pellets were resuspended with 160 ml of 50 mM Tricine-KOH (pH 8.0), 200 mM KCl, and 1 × protease inhibitor cock-tail, and cells were disrupted with sonication. Unbroken cells were removed by a 20-min centrifugation at 3,200g and further centrifuged at 125,000g for 1 h. Cells were washed with 20 mM Tricine-KOH (pH 8.0), 15 mM KCl, 10 mM MgCl2, and 1× protease inhibitor cocktail. They were then centrifuged at 125,000g for 1 h.
The washed membrane vesicles were suspended to about 10–15 mg/ml in 20% glycerol, 50 mM Tricine-KOH (pH 8.0), 25 mM K2SO4, and 5 mM MgCl2. Stock solutions of 0.5 M DDM and 50 mg/ml asolectin (50 mg/ml stock solu-tion in 50 mM Tricine-KOH (pH 8.0), 25 mM K2SO4, 5 mM MgSO4, 50 mM octyl glucoside, and 1 mM dithiothreitol) were added to final concentrations of 50 mM and 3 mg/ml. The suspension was incubated on ice for 30 min with occasional shaking and centrifuged at 235,000g for 2 h. The grayish brown pellet was discarded, and the dark orange supernatant that contained most of the ATP synthase was subjected to ammonium sulfate fractionation after the addition of sodium cholate to 1% (100 mg/10 ml). Ammonium sulfate powder was added to the crude extract to 30% saturation (176 mg/ml) with stirring at 4 °C. The suspension was centrifuged at 75,000g for 15 min, and the resulting pellets, which contained negligible ATP synthase activity, were discarded. The supernatant was brought to 60% saturation (198 mg/ml) with stirring at 4 °C. This was centrifuged at 75,000g for 15 min to separate the supernatant from the ATP synthase–containing pellet. The supernatants were removed, and the pel-lets were dissolved in 5% glycerol, 50 mM Tricine-KOH (pH 8), 5 mM MgSO4, and 1 mM dithiothreitol to 20–30 mg/ml. Portions (0.2 ml) were loaded onto 1–40% sucrose gradients. The gradient volume was 4.75 ml, and the tubes were centrifuged for 17 h in a Beckman-Coulter SW 50.1 rotor (Beckman Coulter, Brea, CA) at 200,000g at 4 °C. The gradients were fractionated into 0.35-ml fractions. The gradient fractions were analyzed for protein content, ATP synthase activity, and polypeptide profile on SDS-polyacrylamide gels (Supplementary Fig. 24b).
Purification of pyruvate carboxylase, an enzyme for carbon fixation. The pyruvate carboxylase gene was amplified from Bacillus subtilis 168 genomic DNA and cloned into a pTrc99a vector (AP Biotech Co., Argentina). This construct was kindly provided by P. Kim (Catholic University of Korea, Korea). The pTrc99a vector containing pyruvate carboxylase was used to transform

© 2
018
Nat
ure
Am
eric
a, In
c., p
art o
f Spr
inge
r Nat
ure.
All
right
s re
serv
ed.
nature biotechnology doi:10.1038/nbt.4140
Escherichia coli strain BL21 (Novagen, Darmstadt, Germany) for expression and purification. The transformant was grown in lysogeny broth medium in the presence of ampicillin (50 µg/ml) (Duchefa Biochemie B.V., Netherlands) at 37 °C. Overnight cultures were diluted 1:100 and grown to produce an absorbance of 0.4 OD units at 600 nm at 37 °C. Cells were induced with 0.1 mM IPTG and grown for another 4 h at 37 °C. Cells were collected by centrifugation at 2,750g for 15 min at 4 °C. After cells were disrupted by sonica-tion, unlysed cells and cell debris were removed by centrifugation at 4,000g for 20 min at 4 °C. The soluble fraction was obtained, and pyruvate carboxylase was purified using Ni-nitrilotriacetic acid (NTA)-agarose beads (Qiagen, Venlo, Netherlands)). Finally, purified pyruvate carboxylase was subjected to SDS-PAGE to check its approximate purity (Supplementary Fig. 24c).
Preparation of small unilamellar vesicles, proteoliposomes, and photosyn-thetic artificial organelles. Small unilamellar vesicles (SUVs) were prepared from POPC, POPE, POPG, and cholesterol at a molar ratio of 2:1:1:1, and 0.25 mol% of NBD-PE or 0.25 mol% of Rhod-PE was added for visualiza-tion. Lipids were mixed in chloroform in a glass test tube, and the thin film obtained was kept in nitrogen gas and then under high vacuum for more than 1 h to remove organic solvent residue. Lipids were hydrated in a defined volume of desired buffer solution (0.2 M sucrose, 2 mM HEPES (pH 8.0), and 2 mM MgSO4) to yield a total lipid concentration of 5 mg/ml. This was then vortexed at a temperature above that of phase transition for 1 h. Frozen and thawed SUVs were obtained by repeating the following cycle 5 times: freez-ing the vesicles in liquid nitrogen and thawing the sample in a water bath at 40 ± 1 °C. The extrusion was performed by a mini-extruder (Avanti Polar Lipids, Alabaster, AL). The lipid solution was extruded with 100-nm polycarbonate membrane filters (Whatman, Inc., Newton, MA) and passed through the membrane filter 11 times, and the size distribution of vesicles was measured by dynamic light scattering.
Proteoliposomes containing photoconverters (PSII and PR) were reconsti-tuted into SUVs by a detergent-mediated method36. SUVs were solubilized into mixed micelles at detergent/lipid ratios of 1.5 (w/w) with DDM, and the solubilized photoconverters (PSII and PR) were added to the detergent–lipid mixture. After a 30-min incubation for micellar equilibration, the DDM was removed at 4 °C by adding prewashed Bio-Beads SM-2. DDM was removed by a slow procedure consisting of four sequential additions of 15 mg Bio-Beads SM-2 per milligram of DDM for 1 h each, followed by a fifth addition of 30 mg Bio-Beads SM-2 per milligram of DDM36. The number of chromo-phores in the photoconverters (PSII and PR) was calculated by the absorp-tion spectrum and absorption coefficients of the chromophores. The concentration of chlorophyll-a in PSII was calculated by applying an equation (µg/ml = 12.25·A663.6–2.55·A646.6)37, and the concentration of PR was cal-culated from the retinal absorption using a molar absorption coefficient of 50,000 M−1 cm−1 (ref. 38). To estimate the ratios of phospholipids to chromo-phores in the photoconverters, their concentrations were divided. The number of phospholipids in a single giant proteoliposome (15-µm diameter vesicle = 1.96 × 10⁹ lipid molecules), a lipid bilayers patch (2-µm diameter patch = 8.70 × 10⁶ lipid molecules), and a single small proteoliposome (0.1-µm diameter vesicle = 8.70 × 10⁴ lipid molecules) were calculated based on POPC molecules39. Supplementary Figure 2 shows the number of lipid molecules divided by the number of chromophores.
Artificial organelles containing ATP synthases were reconstituted into proteoliposomes prepared by a detergent-mediated method. The prote-oliposomes were suspended in a solution containing 0.2 M sucrose, 2 mM HEPES (pH 8.0), 2 mM MgSO4, 0.1 mM phenyl-p-benzoquinone, 2 mM ADP, 2.5 mM NaH2PO4, 2.5 mM KH2PO4, and 5 mM NaHCO3. Proteoliposomes were solubilized into mixed micelles at detergent/lipid ratios of 1 (w/w) for DDM, and the solubilized photoconverters (PSII and PR) were added to the detergent–lipid mixture. After a 30-min incubation for micellar equilibration, the DDM was removed at 4 °C by adding prewashed Bio-Beads SM-2. DDM was removed by a slow procedure consisting of four sequential additions of 15 mg Bio-Beads per milligram of DDM for 1 h each, followed by a fifth addition of 30 mg Bio-Beads per milligram of DDM36.
Proteoliposomes and artificial organelles were transferred to a 100,000 MW Amicon ultra-filter device (Millipore Inc., Billerica, MA) to remove photo-converter residues and then centrifuged at 2,000g for 30 min. The pellets
were resuspended in the desired buffer solution and then frozen and thawed using three freeze-thaw cycles consisting of 5 min freezing in liquid nitrogen followed by 3 min thawing at room temperature.
Preparation of giant unilamellar vesicles and giant proteoliposomes. Giant unilamellar vesicles (GUVs) were synthesized by the electroformation method40. For calibration of intravesicular pH, GUVs were prepared from a 1 mg/ml solution of lipids in chloroform and POPC, POPE, POPG, and cho-lesterol at a molar ratio of 2:1:1:1 and an additional 0.25 mol% of NBD-PE for visualization. 200 µl of the lipid solution was deposited on the conductive side of two-sided indium-tin oxide–coated glass slides (9 cm2 area, 30–50Ω) with nitrogen gas. Organic solvents on the glass slides were removed by evaporation by placing the slides in a vacuum desiccator for 1 h. After drying, electroforma-tion chambers were constructed by positioning 3-mm silicon spacers between two lipid-coated indium-tin oxide–coated glass slides. The lipids were rehy-drated with 0.2 M sucrose, 2 µM SNARF-1 (a pH-sensitive dye), and 2 mM HEPES at a pH of 6–9, and a 10-Hz sine wave of 1.2 V was applied across the chamber for 4 h using an arbitrary function generator (Tektronix Inc., OR). To detach the GUVs, a 4-Hz sine wave of 2 V was applied to the lipid-coated slides for 30 min. GUVs were then harvested using a wide-bore pipette tip and diluted 1:100 in resuspension buffer solution (0.2 M glucose, 2 mM HEPES at pH 6–9 to dilute the external SNARF-1 dye.
Giant proteoliposomes were prepared through dehydration of small prote-oliposomes in suspension41,42. Small proteoliposomes were prepared as above and diluted to 1 mg/ml. 200 µl of the lipid solution was dehydrated on the con-ductive side of two-sided indium-tin oxide-coated slides (9 cm2 area, 30–50Ω) using a vacuum desiccator at 4 °C for 3 h. The lipids were rehydrated with 0.2 M sucrose, 2 µM SNARF-1, 2 mM HEPES (pH 8.0), and 2 mM MgSO4, and then a 10-Hz sine wave of 1.2 V was applied across the chamber for 8 h using an arbitrary function generator. To detach the GUVs, a 4-Hz sine wave of 2 V was applied to the lipid-coated slides for 30 min. GUVs were then harvested using a wide-bore pipette tip, diluted 1:100 in resuspension buffer solution (0.2 M glucose, 2 mM MgSO4, 0.1 mM phenyl-p-benzoquinone, and 2 mM HEPES (pH 8.0)) and allowed to settle for 30 min before use. Giant prote-oliposomes were imaged in confocal dishes that had been blocked with 1% Pluronic F-127 (Sigma–Aldrich Co., St. Louis, MO) for 1 h before use. All giant proteoliposomes were imaged within 4 h of electroformation.
Preparation of protocellular system. Giant unilamellar vesicles (GUVs) were prepared as above with DOPC, POPE, DOPS, and cholesterol at a molar ratio of 2:1:2:1, 1 mol% PEG2000-PE to prevent nonspecific interactions, 0.25 mol% of Rhod-PE for visualization, 1 mol% calcium ionophore A23187 (Sigma–Aldrich Co., St. Louis, MO), and 1 mol% magnesium ionophore I (Sigma–Aldrich Co., St. Louis, MO). The lipids were rehydrated with 2 mg/ml of photosynthetic organelles, 0.2 M sucrose, 20 mM Tris-HCl (pH 7.8), 0.1 mg/ml G-actin, 5 mM ADP, 3 mM NaH2PO4, 3 mM KH2PO4, 0.2 mM CaCl2, and 0.1 µM Acti-stain 670 phalloidin for actin filament staining. Electroformation causes membrane swelling, which allows encapsulation of artificial organelles (100 nm) and other biological molecules (Supplementary Fig. 15a,b).
To investigate membrane–actin interactions, GUVs were prepared from a liquid-disordered phase mixture (Ld) and from two different liquid-ordered phase mixtures (Lo1 and Lo2). Ld GUVs were prepared with DOPC, DOPS, and cholesterol at a molar ratio of 2:1:1. Lo1 GUVs were prepared with SM and cholesterol at a molar ratio of 1:1. Lo2 GUVs were prepared with SM and cholesterol at a molar ratio of 1:1 and 3 mol% PEG2000-PE to prevent mem-brane–actin interactions. To enable visualization, 0.25 mol% of Rhod-PE was added. Lipid hydration and electroformation were performed as above.
For phase-separated protocellular system43, phase-separated GUVs (Ld and Lo1) were prepared with a 2:1:3:1.5 molar ratio of DOPC:DOPS:SM:cholesterol incorporating 0.25 mol% of TopFluor-Chol or 0.25 mol% of Rhod-PE. An additional 3 mol% polysaturated PEG2000-PE was added to Ld and Lo2 phase-separated GUVs. Lipid hydration and electroformation were performed as above.
Confocal microscopy. Confocal microscopy was conducted using a Leica SP5 confocal microscope (Leica-Microsystems, Mannheim, Germany) equipped with ultraviolet and visible laser lines. GUVs, giant proteoliposomes, and

© 2
018
Nat
ure
Am
eric
a, In
c., p
art o
f Spr
inge
r Nat
ure.
All
right
s re
serv
ed.
nature biotechnologydoi:10.1038/nbt.4140
SNARF-1 were excited at 488 and 532 nm at 10% laser power, and a pinhole was set at 1 or 3 units using a 63× oil immersion lens. SNARF-1 fluorescence emissions were captured in three channels at 520 ± 20 nm, 570 ± 20 nm, and 630 ± 20 nm. As SNARF-1 has been shown previously to be responsive to temperature44, temperature was maintained between 22 °C and 24 °C during GUV observation. The use of 532 nm as the excitation wavelength minimized chlorophyll and other autofluorescence, as 532 nm lies outside of the absorp-tion spectra of chlorophyll and autofluorescence.
For imaging protocellular systems, a Zeiss LSM 710 confocal laser-scanning fluorescence microscope (Carl Zeiss GmbH, Jena, Germany) equipped with a C-Apochromat 40×/1.2 water immersion objective was used in multitrack mode. NBD-PE and TopFluor-Chol samples were excited at 488 nm using an argon laser line with a 488/543/633 beam splitter and imaged at 493–563 nm on track 1. Rhod-PE samples were excited at 543 nm using an HeNe laser line with a 488/543/633 beam splitter and imaged at 563–628 nm on track 2. Actin-stain 670 phalloidin samples were excited at 633 nm using an HeNe laser line with a 488/543/633 beam splitter and imaged at 638–755 nm on track 2. All images and three-dimensional reconstructions of images were analyzed and processed using image-processing software (ImageJ, NIH, Bethesda, MD) and Zeiss Zen 2012 (Carl Zeiss GmbH, Jena, Germany). To minimize any side effects from the laser source, the cells were imaged at 1.97 fps, and it was con-firmed that the confocal microscope’s scanning laser sources did not influence pH during imaging (Supplementary Fig. 4a).
Calibration of intravesicular pH. Intravesicular pH was measured by ratio-metric analysis of SNARF-1 fluorescence45. GUVs were prepared by electro-formation with 2 µM SNARF-1 encapsulated in buffer solution (0.2 M sucrose, 2 mM HEPES) at pH 6–9. GUVs were then harvested using a wide-bore pipette tip and diluted 1:200 in resuspension buffer solution (0.2 M glucose, 2 mM HEPES) to dilute the external SNARF-1 dye. GUVs containing SNARF-1 were imaged with a confocal microscope with a HeNe laser source tuned to 543 nm. The ratio of fluorescence intensity of SNARF-1 was detected at 570/630 nm, and this was calibrated at a pH of 6–9. A lipid film containing POPC, POPE, POPG, and cholesterol at a molar ratio of 2:1:1:1 was gener-ated from a 1 mg/ml solution of lipids in chloroform. To assist visualization of GUVs by light microscopy, we added 0.25 mol% of NBD-PE to the lipid solutions. Giant vesicles with a diameter of 15–30 µm were collected for use in calibrating intravesicular pH.
Measuring the photocurrents of PSII and PR. The photocurrents of PSII, PR, and both photoconverters in the bilayer were measured with the Port-a-Patch automated patch clamp system (Nanion Technologies GmbH, Munich, Germany). We used giant proteoliposomes (i.e., GUVs reconstituted with PSII, PR, or both photoconverters) to form a bilayer46,47 in an aperture (approxi-mately 2 µm in diameter) of a patch clamp chip (NPC-1, Nanion Technologies GmbH, Munich, Germany).
For the formation of a planar lipid bilayer containing PR, 10 µl of the pro-teoliposome-containing solution was pipetted onto a patch clamp micro-con-structed chip. Giant proteoliposomes were positioned on the aperture of the micro-constructed chip by applying negative pressure. Generally, −5 to −20 mbar was sufficient for reliable positioning within a few seconds after giant proteoli-posome addition. When the giant proteoliposomes touched the glass surface of the chip, they burst and formed planar bilayers with a seal resistance of at least 1 GΩ46. Membrane capacitance could be estimated on the order of a few femtofarads. Owing to the small volumes required, rapid perfusion was a necessity. Photocurrents were induced by illumination by a SPECTRA light engine (Lumencor, Beaverton, OR) at 1.14 mW/cm2, which was filtered by blue (438 ± 24 nm), green (540 ± 27 nm), or red (660 ± 52 nm) band-pass filters. Light was directed onto the lipid bilayer via an optical fiber (Doric Lens Inc., Quebec, Canada). All experiments were carried out at room temperature.
Measurement of light-induced intravesicular pH. The intravesicular pH of giant proteoliposomes was measured by ratiometric analysis of SNARF-1 fluorescence45. Choosing to measure single giant proteoliposomes minimized the side effects of reducing the unincorporated vesicles and residues. Giant proteoliposomes were prepared through dehydration of a solution of small proteoliposomes41,42. Small proteoliposomes were prepared as described above
and diluted to 1 mg/ml. 200 µl of the solution was dehydrated on the conduc-tive side of two-sided indium-tin oxide–coated slides (9 cm2 area, 30–50Ω) using a vacuum desiccator at 4 °C for 3 h. The lipids were rehydrated with 0.2 M sucrose, 2 µM SNARF-1, 2 mM HEPES (pH 8.0), and 2 mM MgSO4, and then a 10-Hz sine wave of 1.2 V was applied across the chamber for 8 h using an arbitrary function generator. GUVs were then harvested using a wide-bore pipette tip and diluted 1:100 in resuspension buffer solution (0.2 M glucose, 2 mM MgSO4, 0.1 mM phenyl-p-benzoquinone, and 2 mM HEPES (pH 8.0)) and allowed to settle for 30 min before use. The giant proteoliposomes were illuminated with a fiber-optic illuminator with a halogen bulb equipped with heat-absorbing filters (Fiber Lite PL-800, Dolan-Jenner Industries, Lawrence, MA) that emitted broadband white light or light that was filtered by blue (438 ± 24 nm), green (540 ± 27 nm), or red (660 ± 52 nm) band-pass filters at 1.14 mW/cm2 by controlling a neutral density filter (NDL-25C-4, Thorlabs, Newton, NJ) with a power meter (PM160, Thorlabs, Newton, NJ). The giant proteoliposomes were illuminated every 2 min, and the light was turned off during imaging.
Quantification of ATP synthesis of artificial organelles. ATP synthesis by artificial organelles was determined with the luciferin–luciferase system48 in bulk-vesicle solution using an ATP Determination Kit (Molecular Probes, Eugene, OR) and following the manufacturer’s protocol. The procedure was adapted from a paper by Andrea Hazard et al.49. Artificial organelles con-taining PR, PSII, and ATP synthase were prepared as described above. The artificial organelles were suspended in a solution containing 20 mM Tris-HCl (pH 8.0), 3 mM KH2PO4, 3 mM NaH2PO4, 5 mM NaHCO3, 5 mM ADP, 2 mM MgCl2, and reaction buffer. 1 µM FCCP (a protonophore) and 1 µM oli-gomycin (an inhibitor of ATP synthase) were added as the negative control. The stirred suspension was illuminated with a fiber-optic illuminator with a halo-gen bulb equipped with heat-absorbing filters (Fiber Lite PL-800; Dolan-Jenner Industries, Lawrence, MA) that emitted broadband white light or light that was filtered by blue (438 ± 24 nm), green (540 ± 27 nm), or red (660 ± 52 nm) band-pass filters at 1.14 mW/cm2 by controlling a neutral density filter (NDL-25C-4, Thorlabs, Newton, NJ) with a power meter. Multiple samples in a quartz cuvette were illuminated with various light wavelengths and for various durations (1–33 min, 1-min intervals). Samples were analyzed by measur-ing fluorescence emission at 560 nm using an F-7000 FL Spectrophotometer (Hitachi, Tokyo, Japan).
Quantification of carbon fixation of artificial organelles. To determine the level of oxaloacetate (OAA), an OAA fluorometric assay kit (BioVision Inc., CA) and the gas chromatography/mass spectrometry (GC/MS) method were used. The artificial organelles were suspended in a solution containing 20 mM Tris-HCl (pH 8.0), 3 mM KH2PO4, 3 mM NaH2PO4, 5 mM NaHCO3, 5 mM ADP, 2 mM MgCl2, 5 µM pyruvate, 0.5 µM pyruvate carboxylase, 0.1 µM acetyl-coenzyme A (acetyl-CoA), and reaction buffer. The result-ing suspension was mixed with buffer mix solution containing the assay kit’s enzyme, developer, and probe. 2 mM phenylacetic acid (inhibitor of pyruvate carboxylase) were added as a negative control. The stirred suspension was illuminated with a fiber-optic illuminator with a halogen bulb equipped with heat-absorbing filters (Fiber Lite PL-800; Dolan-Jenner Industries, Lawrence, MA) that emitted broadband white light or light that was filtered by blue (438 ± 24 nm), green (540 ± 27 nm), or red (660 ± 52 nm) band-pass filters at 1.14 mW/cm2 by controlling a neutral density filter (NDL-25C-4, Thorlabs, Newton, NJ) with a power meter. Multiple samples in a quartz cuvette were illuminated with various light wavelengths and for various durations (1–20 min, 1-min intervals). Samples were analyzed by measuring fluorescence emission using an F-7000 FL Spectrophotometer (Hitachi, Tokyo, Japan). For GC/MS analysis, artificial organelles containing PSII-PR photoconverters that were illuminated for 1, 5, 10, 15, and 20 min were transferred to a 3,000 MW Amicon ultra filter device (Millipore Inc., Billerica, MA) to collect reactants and then centrifuged at 4,000g for 30 min. The pellets were taken and dried in a vacuum concentrator at room temperature. For the derivatization of pyruvate and OAA, dried residues were resuspended in 25 µl MTBSTFA + 1% TBDMCS and 25 µL of acetonitrile and then incubated for 1 h at 60 °C. Silylated deriva-tives of pyruvate and OAA were separated on a DB-5 capillary column (30 m × 0.250 mm, 0.25 µm; Agilent Technologies, Foster City, CA). Analyses
© 2
018
Nat
ure
Am
eric
a, In
c., p
art o
f Spr
inge
r Nat
ure.
All
right
s re
serv
ed.
nature biotechnology doi:10.1038/nbt.4140
were performed with an Agilent 6890 gas chromatograph coupled to an Agilent 5973 mass-selective detector (MSD) with the following chromato-graphic conditions: initial temperature 50 °C for 2 min, increasing to 150 °C at 20 °C/min over 5 min and finally to 300 °C at 8 °C/min for 20 min. The front inlet temperature was 250 °C operating with a split ratio of 1:10. The MSD ion source and interface temperature were 280 °C. Helium was used as carrier gas (1.0 ml/min). The MSD operated in EI mode at 70 eV. A scan mode of 15–650 m/z was used for the analyses. GC/MS data were acquired and processed using Agilent MassHunter WorkStation software.
Polymerization of actin in photosynthetic protocellular systems. A sus-pension of protocellular systems was transferred to confocal dishes that had been blocked with 1% Pluronic F-127 (Sigma–Aldrich Co., St. Louis, MO) for 1 h before use to prevent nonspecific interactions between the bottom of the glass and actin. The suspension of protocellular systems was diluted 1:10 in resuspension buffer solution (0.2 M glucose, 20 mM Tris-HCl (pH 7.8), 0.5 mM CaCl2, and 0.5 mM MgCl2). After incubation at room temperature for 30 min to allow ions to be transported into the cells, actin polymerization was induced in the protocellular systems by illuminating them with a fiber-optic illuminator that emitted either broadband white light at 1.14 mW/cm2 or light that was filtered by green (540 ± 27 nm) or red (660 ± 52 nm) band-pass filters at 1.14 mW/cm2 by controlling a neutral density filter (NDL-25C-4, Thorlabs, Newton, NJ) with a power meter (PM160, Thorlabs, Newton, NJ). The samples in confocal dishes were illuminated using light at various wave-lengths and for various durations. To minimize any side effects from the laser source, the cells were imaged at 1.97 fps and the light was turned off during the measurements.
Calculating the area of the actin sphere and the contour curvature of protocellular systems. The area of the actin sphere was calculated using the ImageJ program and the following equation:
Projected area Actinsphere area area of protocellular system(%) /= ss
To calculate the contour curvature of the protocellular systems, the Rhod-PE–labeled outer membranes of protocellular systems were reanalyzed with a cubic spline–based method of curvature estimation. All automated curvature analysis was performed with custom-written MATLAB routines correspond-ing to pixels in the original gray-scale image. The distance between knots (polynomial join sites in the splines) was 22 pixels. Digital curves with fewer than 22 pixels were ignored in the analysis. Cubic splines ((x(t), y(t)) were then fit to the polyfit. Curvature was measured at points one pixel apart along the filament curve by applying the following definition of curvature:
k x y y xx y
= ′ ′′ − ′ ′′′ + ′( ) /2 2 3 2
where all derivatives are with respect to t. The first and last two pixels of each digital curve were ignored to avoid end effects. The probability distribution of contour curvatures was calculated as a histogram with fixed bin widths and bin positions for each time point (Supplementary Note 2).
Statistics. Data are presented as mean ± s.d. The significance between data sets was measured using two-tailed unpaired Student’s t-test. P values were not con-sidered significant when P > 0.05 and significant when P < 0.05 and P < 0.01.
Code availability. Custom code for calculating contour curvature of protocellu-lar system organelle membrane systems is supplied in Supplementary Note 2.
Life Sciences Reporting Summary. Further information on experimental design is available in the Nature Research Reporting Summary linked to this article.
Data availability. The authors confirm that the data supporting the findings of this study are available within the paper and its supplementary informa-tion files. Additional source data are available from the corresponding author upon reasonable request.
31. Caffarri, S., Kouril, R., Kereïche, S., Boekema, E.J. & Croce, R. Functional architecture of higher plant photosystem II supercomplexes. EMBO J. 28, 3052–3063 (2009).
32. Wang, Z.G., Xu, T.H., Liu, C. & Yang, C.H. Fast isolation of highly active photosystem II core complexes from spinach. J. Integr. Plant Biol. 52, 793–800 (2010).
33. Kim, S.Y., Waschuk, S.A., Brown, L.S. & Jung, K.H. Screening and characterization of proteorhodopsin color-tuning mutations in Escherichia coli with endogenous retinal synthesis. Bba-Bioenergetics 1777, 504–513 (2008).
34. Dioumaev, A.K. et al. Proton transfers in the photochemical reaction cycle of proteorhodopsin. Biochemistry 41, 5348–5358 (2002).
35. Hicks, D.B. & Krulwich, T.A. Purification and reconstitution of the F1F0-ATP synthase from alkaliphilic Bacillus firmus OF4. Evidence that the enzyme translocates H+ but not Na+. J. Biol. Chem. 265, 20547–20554 (1990).
36. Rigaud, J.L. & Lévy, D. Reconstitution of membrane proteins into liposomes. Methods Enzymol. 372, 65–86 (2003).
37. Porra, R.J. The chequered history of the development and use of simultaneous equations for the accurate determination of chlorophylls a and b. Photosynth. Res. 73, 149–156 (2002).
38. Béjà, O., Spudich, E.N., Spudich, J.L., Leclerc, M. & DeLong, E.F. Proteorhodopsin phototrophy in the ocean. Nature 411, 786–789 (2001).
39. Walde, P., Cosentino, K., Engel, H. & Stano, P. Giant vesicles: preparations and applications. ChemBioChem 11, 848–865 (2010).
40. Angelova, M.I. & Dimitrov, D.S. Liposome electroformation. Faraday Discuss. Chem. Soc. 81, 303–311 (1986).
41. Girard, P. et al. A new method for the reconstitution of membrane proteins into giant unilamellar vesicles. Biophys. J. 87, 419–429 (2004).
42. Schmid, E.M., Richmond, D.L. & Fletcher, D.A. Reconstitution of proteins on electroformed giant unilamellar vesicles. Methods Cell Biol. 128, 319–338 (2015).
43. Kaiser, H.J. et al. Order of lipid phases in model and plasma membranes. Proc. Natl. Acad. Sci. USA 106, 16645–16650 (2009).
44. Seksek, O., Henry-Toulmé, N., Sureau, F. & Bolard, J. SNARF-1 as an intracellular pH indicator in laser microspectrofluorometry: a critical assessment. Anal. Biochem. 193, 49–54 (1991).
45. Heider, E.C., Myers, G.A. & Harris, J.M. Spectroscopic microscopy analysis of the interior pH of individual phospholipid vesicles. Anal. Chem. 83, 8230–8238 (2011).
46. Kreir, M., Farre, C., Beckler, M., George, M. & Fertig, N. Rapid screening of membrane protein activity: electrophysiological analysis of OmpF reconstituted in proteoliposomes. Lab Chip 8, 587–595 (2008).
47. Gutsmann, T., Heimburg, T., Keyser, U., Mahendran, K.R. & Winterhalter, M. Protein reconstitution into freestanding planar lipid membranes for electrophysiological characterization. Nat. Protoc. 10, 188–198 (2015).
48. Pitard, B., Richard, P., Duñach, M., Girault, G. & Rigaud, J.L. ATP synthesis by the F0F1 ATP synthase from thermophilic Bacillus PS3 reconstituted into liposomes with bacteriorhodopsin. 1. Factors defining the optimal reconstitution of ATP synthases with bacteriorhodopsin. Eur. J. Biochem. 235, 769–778 (1996).
49. Hazard, A. & Montemagno, C. Improved purification for thermophilic F1F0 ATP synthase using n-dodecyl beta-d-maltoside. Arch. Biochem. Biophys. 407, 117–124 (2002).

1
nature research | life sciences reporting summ
aryJune 2017
Corresponding author(s): K-H. Jung, T. Ahn, K. Parker, K. Shin
Initial submission Revised version Final submission
Life Sciences Reporting SummaryNature Research wishes to improve the reproducibility of the work that we publish. This form is intended for publication with all accepted life science papers and provides structure for consistency and transparency in reporting. Every life science submission will use this form; some list items might not apply to an individual manuscript, but all fields must be completed for clarity.
For further information on the points included in this form, see Reporting Life Sciences Research. For further information on Nature Research policies, including our data availability policy, see Authors & Referees and the Editorial Policy Checklist.
Experimental design1. Sample size
Describe how sample size was determined. No statistical methods were used to predetermine sample size
2. Data exclusions
Describe any data exclusions. No data were excluded for proteoliposome and artificial organelles experiments. For encapsulated organelle membrane system, It is excluded that the encapsulation does not proceed stochastically (See Supplementary Figure 16b).
3. Replication
Describe whether the experimental findings were reliably reproduced.
No attempts at replication failed.
4. Randomization
Describe how samples/organisms/participants were allocated into experimental groups.
For purification of membrane proteins, a random selection of spinach and protein expressed e.coli was chosen. For proteolipsomes and artificial orangelles, there was no biased use of particular sample tubes or chemical reagents. Though across batches, individuals were randomly processed. No other randomization is applicable for this study.
5. Blinding
Describe whether the investigators were blinded to group allocation during data collection and/or analysis.
Not applicable. Group allocation was not a feature for experiments and associated data for in-vitro experiments.
Note: all studies involving animals and/or human research participants must disclose whether blinding and randomization were used.
6. Statistical parameters For all figures and tables that use statistical methods, confirm that the following items are present in relevant figure legends (or in the Methods section if additional space is needed).
n/a Confirmed
The exact sample size (n) for each experimental group/condition, given as a discrete number and unit of measurement (animals, litters, cultures, etc.)
A description of how samples were collected, noting whether measurements were taken from distinct samples or whether the same sample was measured repeatedly
A statement indicating how many times each experiment was replicated
The statistical test(s) used and whether they are one- or two-sided (note: only common tests should be described solely by name; more complex techniques should be described in the Methods section)
A description of any assumptions or corrections, such as an adjustment for multiple comparisons
The test results (e.g. P values) given as exact values whenever possible and with confidence intervals noted
A clear description of statistics including central tendency (e.g. median, mean) and variation (e.g. standard deviation, interquartile range)
Clearly defined error bars
See the web collection on statistics for biologists for further resources and guidance.
Nature Biotechnology: doi:10.1038/nbt.4140

2
nature research | life sciences reporting summ
aryJune 2017
SoftwarePolicy information about availability of computer code
7. Software
Describe the software used to analyze the data in this study.
Student’s unpaired t-tests (Microsoft Excel 2016 MSO Version 16.0.9029.2167 64bit), Confocal image (Carl zeiss ZEN 2.3 SP1 black 64bit 14.0.0.201), 3D reconstruction of confocal images, (Image.J 1.51n), Curvature calculation (MATLAB 9.1.0.441655 R2016b), Curve fitting (OriginPro 8 SR0 v8.0724 B724)
For manuscripts utilizing custom algorithms or software that are central to the paper but not yet described in the published literature, software must be made available to editors and reviewers upon request. We strongly encourage code deposition in a community repository (e.g. GitHub). Nature Methods guidance for providing algorithms and software for publication provides further information on this topic.
Materials and reagentsPolicy information about availability of materials
8. Materials availability
Indicate whether there are restrictions on availability of unique materials or if these materials are only available for distribution by a for-profit company.
No restrictions.
9. Antibodies
Describe the antibodies used and how they were validated for use in the system under study (i.e. assay and species).
No Antibodies were used.
10. Eukaryotic cell linesa. State the source of each eukaryotic cell line used. No Eukaryotic cell lines were used in this study.
b. Describe the method of cell line authentication used. No Eukaryotic cell lines were used in this study.
c. Report whether the cell lines were tested for mycoplasma contamination.
No Eukaryotic cell lines were used in this study.
d. If any of the cell lines used are listed in the database of commonly misidentified cell lines maintained by ICLAC, provide a scientific rationale for their use.
No Eukaryotic cell lines were used in this study.
Animals and human research participantsPolicy information about studies involving animals; when reporting animal research, follow the ARRIVE guidelines
11. Description of research animalsProvide details on animals and/or animal-derived materials used in the study.
No animals were used in this study
Policy information about studies involving human research participants
12. Description of human research participantsDescribe the covariate-relevant population characteristics of the human research participants.
No human research participants were used in this study
Nature Biotechnology: doi:10.1038/nbt.4140