phylogenetic ctdna analysis depicts early stage lung
TRANSCRIPT

Phylogenetic ctDNA analysis depictsearly stage lung cancer evolution
The Harvard community has made thisarticle openly available. Please share howthis access benefits you. Your story matters
Citation Abbosh, C., N. J. Birkbak, G. A. Wilson, M. Jamal-Hanjani, T.Constantin, R. Salari, J. Le Quesne, et al. 2017. “Phylogenetic ctDNAanalysis depicts early stage lung cancer evolution.” Nature 545(7655): 446-451. doi:10.1038/nature22364. http://dx.doi.org/10.1038/nature22364.
Published Version doi:10.1038/nature22364
Citable link http://nrs.harvard.edu/urn-3:HUL.InstRepos:35014816
Terms of Use This article was downloaded from Harvard University’s DASHrepository, and is made available under the terms and conditionsapplicable to Other Posted Material, as set forth at http://nrs.harvard.edu/urn-3:HUL.InstRepos:dash.current.terms-of-use#LAA

Phylogenetic ctDNA analysis depicts early stage lung cancer evolution
A full list of authors and affiliations appears at the end of the article.
Summary
The early detection of relapse following primary surgery for non-small cell lung cancer and the
characterization of emerging subclones seeding metastatic sites might offer new therapeutic
approaches to limit tumor recurrence. The potential to non-invasively track tumor evolutionary
dynamics in ctDNA of early-stage lung cancer is not established. Here we conduct a tumour-
specific phylogenetic approach to ctDNA profiling in the first 100 TRACERx (TRAcking non-
small cell lung Cancer Evolution through therapy (Rx)) study participants, including one patient
co-recruited to the PEACE (Posthumous Evaluation of Advanced Cancer Environment) post-
mortem study. We identify independent predictors of ctDNA release and perform tumor volume
limit of detection analyses. Through blinded profiling of post-operative plasma, we observe
evidence of adjuvant chemotherapy resistance and identify patients destined to experience
recurrence of their lung cancer. Finally, we show that phylogenetic ctDNA profiling tracks the
subclonal nature of lung cancer relapse and metastases, providing a new approach for ctDNA
driven therapeutic studies
Users may view, print, copy, and download text and data-mine the content in such documents, for the purposes of academic research, subject always to the full Conditions of use:http://www.nature.com/authors/editorial_policies/license.html#terms
Correspondence should be addressed to C.S. Translational Cancer Therapeutics Laboratory, The Francis Crick Institute, 3rd Floor South West, 1 Midland Road, London, NW1 1A, [email protected], Office +44 203 796 2047.*These authors contributed equally to this work+These authors contributed equally to this work
Authorship contribution statementC.A., N.J.B., G.A.W., M.J-H., T.C., R.S., and J.L-Q. contributed equally to this work. C.A. and C.S. co-wrote the manuscript. C.A., M.J.H., and C.S. conceived study design. C.A., N.J.B., G.A.W. and R.R. integrated clinicopathological data, exome data and ctDNA data. M.R. B.G.Z, J.L., T.C., R.S., E.K., N.S., D.H., A.N. and A.P., conducted and analysed multiplex-PCR NGS experimental work. N.J.B, G.A.W, T.B.K.W, M.A.B, R.R., and N.M. conducted M-Seq analyses of exome data. J.L-Q, T.M. and D.A.M. conducted pathological review. F.F., R.E. and F.Z. conducted radiological review of PET scans. H.J.W.L.A., W.L.B., F.M.F. and N.J.B. conducted radiomic analyses. S.V., D.J., J.L., S.S., J.C-K., A.R., T.C., D.O. and A.U.A. conducted TRACERx sample processing. G.E., S.W., N.M. and G.A.W. conducted exome sequencing. L.M., J.R. and J.S. conducted ctDNA cross-platform validation. M.J.H., C.D., J.S. and C.S. designed study protocols. C.H., S.L.M., M.D.F., T.A., M.Fa., E.B., D.L., M.H., S.K., N.P., S.M.J., R.T., A.A., F.B., Y.S., R.S., L.J., A.M.Q, P.C., B.N., G.M., G.L., S.T., M.N., H.R., K.K., M.C., L.G., D.F., A.N., S.R., G.A., S.K., P.R., V.E., B.I., M.I-S., V.P., J.L., M.K., R.A., H.A., H.D., S.L. are clinical members of TRACERx study sites. J.H. and H.L. run the UCL GCLP facility. A.H., H.B., N.I. and Y.N. were involved in study oversight. J.A.S., J.L-Q., Z.S., E.G., S.K., S.T., M.A.B, R.F.S., J.H., A.S., S.Q., P.V.L., C.D. and J.L. gave advice and reviewed the manuscript. A.H. gave statistical advice. C.S. provided overall study oversight.
Author informationThe authors declare competing financial interests: details are available in the online version of the paper.
Reprints and permissions information is available at www.nature.com/reprints.
Data availability StatementSequence data has been deposited at the European Genome-Phenoma Archive (EGA), which is hosted by the The European Bioinformatics Institute (EBI) and the Centre for Genomic Regulation (CRG), under accession numbers EGAS00001002247 (primary tumor data) and EGAS00001002415 (metastatic tumor data). Further information about EGA can be found on https://ega-archive.org, “The European Genome-phenome Archive of human data consented for biomedical research”27.
Europe PMC Funders GroupAuthor ManuscriptNature. Author manuscript; available in PMC 2018 February 14.
Published in final edited form as:Nature. 2017 April 26; 545(7655): 446–451. doi:10.1038/nature22364.
Europe PM
C Funders A
uthor Manuscripts
Europe PM
C Funders A
uthor Manuscripts

Lung cancer is the leading cause of cancer death1–2. Metastatic non-small cell lung cancer
(NSCLC) cannot be cured with systemic chemotherapy, yet clinical studies have shown a
5% benefit of post-operative (adjuvant) chemotherapy on overall survival3. This modest
survival benefit may reflect a vulnerability of low volume disease within the context of
reduced intratumor heterogeneity4. Circulating tumor DNA (ctDNA) detection in plasma
following resection of breast5,6 and colorectal7 tumors has been shown to identify patients
destined to relapse post-operatively in advance of established clinical parameters.
Identifying, monitoring and genomically characterizing residual disease following primary
lung cancer surgery may improve outcomes in the adjuvant setting. This would create a
therapeutic setting where only patients destined to recur would receive treatment and where
intervention could be directed to the evolving tumor subclone that is seeding metastatic
recurrence.
Here, we report a bespoke multiplex-PCR NGS approach to ctDNA profiling within the
context of the prospective tumor evolutionary NSCLC TRACERx study. We address
determinants of ctDNA detection in early-stage NSCLC and investigate the ability of ctDNA
to identify and genomically characterize post-operative NSCLC relapse within a tumor
phylogenetic framework.
Phylogenetic ctDNA profiling
The TRACERx study monitors the clonal evolution of NSCLC from diagnosis through to
death8,9. Using multi-region exome sequencing (M-Seq) derived tumor phylogenetic trees
developed through prospective analysis of a 100 patient TRACERx cohort, we conducted a
phylogenetic approach to ctDNA profiling in early-stage NSCLC (Fig. 1). Bespoke
multiplex-PCR assay-panels were synthesised for each patient, targeting clonal and
subclonal single nucleotide variants (SNVs) selected to track phylogenetic tumor branches
in plasma (Fig. 1). SNV detection in plasma was established through a calling algorithm
employing negative control samples (see Methods). Analytical validation of the multiplex-
PCR NGS platform demonstrated a sensitivity of above 99% for the detection of SNVs at
frequencies above 0.1% and the specificity of detecting a single SNV was 99.6% (Extended
Data Fig. 1a). At least two SNVs were detected in ctDNA from early-stage NSCLCs
analyzed in our published discovery cohort data10, demonstrating biological sensitivity of a
two SNV threshold for ctDNA detection. Therefore, we prospectively selected a threshold of
two detected SNVs for calling a sample ctDNA positive for validation within this study; to
minimize type I error when testing up to 30 tumour-specific SNVs per time-point in a single
patient (see Extended Data Fig. 1b for justification).
Determinants of ctDNA detection in NSCLC
We sought to identify clinicopathological determinants of ctDNA detection in early-stage
NSCLC by profiling pre-operative plasma samples in 100 TRACERx patients. Samples from
four patients could not be analyzed (see cohort design Extended Data Fig. 2a, patient
characteristics Extended Table 1a-c, Supplementary Table 1). Individual assay-panels were
designed to target a median of 18 SNVs (range 10 to 22) comprising a median of 11 clonal
Abbosh et al. Page 2
Nature. Author manuscript; available in PMC 2018 February 14.
Europe PM
C Funders A
uthor Manuscripts
Europe PM
C Funders A
uthor Manuscripts

SNVs (range 2 to 20) and a median of 6 subclonal SNVs (range 0 to 16) per patient
(Extended Data Fig. 2b,e).
At least two SNVs were detected in ctDNA pre-operatively in 46 of 96 (48%) early-stage
NSCLCs and a single SNV was detected in 12 additional cases (Fig. 2a). Centrally reviewed
pathological data revealed that ctDNA detection was associated with histological subtype:
97% (30/31) of lung squamous cell carcinomas (LUSCs) and 71% (5 of 7) of other NSCLC
subtypes were ctDNA positive, compared with 19% (11/58) of lung adenocarcinomas
(LUADs) (Fig. 2a). 94% (16 of 17) of stage I LUSCs were detected compared with 13% (5
of 39) of stage I LUADs (Extended Data Fig. 3a). Passive release of ctDNA into the
circulation may be associated with necrosis11. As expected LUSCs were significantly more
necrotic than LUADs12 and ctDNA positive LUADs formed a sub-group of more necrotic
tumors compared with ctDNA negative LUADs (Extended Data Fig. 3b). Necrosis, lymph
node involvement, lymphovascular invasion, pathological tumor size, Ki67 labelling indices,
non-adenocarcinoma histology and total cell-free DNA input predicted ctDNA detection in
univariable analyses (Extended Data Fig. 3c). Multivariable analysis revealed non-
adenocarcinoma histology, the presence of lympho-vascular invasion and high Ki67
proliferation index as independent predictors of ctDNA detection (Extended Data Fig. 3c).
Since FDG-avidity on positron emission tomography (PET) scans correlates with
proliferative indices in early-stage NSCLC13,14, we investigated tumor PET FDG-avidity
and ctDNA detection. PET FDG-avidity predicted ctDNA detection (area under curve =
0.84, P<0.001, n=92) (Extended Data Fig. 3d). Within LUADs, driver events in KRAS,
EGFR or TP53 were not associated with ctDNA detection (Extended Data Fig. 3e).
We analyzed the distribution of clonal and subclonal SNVs in ctDNA positive patients.
Clonal SNVs were detected in all 46 ctDNA positive patients and a median of 94% (range
11% to 100%) of clonal SNVs targeted by assay-panels were detected in the ctDNA of these
patients. 40 of 46 ctDNA positive patients had subclonal SNVs targeted by assay-panels and
subclonal SNVs were detected in 27 (68%) of these patients. A median of 27% (range 0% to
91%) of subclonal SNVs within individual assay-panels were detected in ctDNA positive
patients (Fig. 2b). The mean plasma variant allele frequency (VAF) of clonal SNVs was
higher than that of subclonal SNVs (Extended Data Fig. 4a, within patient comparison,
Wilcoxon signed-rank test, P<0.001, n=27, Supplementary Table 2) supporting the use of
clonal alterations as a more sensitive method of ctDNA detection than subclonal
alterations10,15.
In ctDNA positive patients, pathologic tumor size correlated with mean clonal plasma VAF
(Spearman’s Rho = 0.405, P=0.005, n=46, Extended Data Fig. 4b). CT scan volumetric
analyses were evaluated in 37 of 46 ctDNA positive patients (see Extended Data Fig. 4c).
Tumor volume correlated with mean clonal plasma VAF (Fig 3a, Spearman’s Rho = 0.63,
P<0.001, n=37). A linear relationship between log- transformed volume and log-
transformed mean clonal VAF values was observed (Fig. 3a). The line of best fit applied to
the data was consistent with the line fitted to NSCLC volumetric data and ctDNA plasma
VAFs reported in previously published work16 (Extended Data Fig. 4d). Linear modelling
based on the TRACERx data predicted that a primary tumor burden of 10cm3 would result
in a mean clonal plasma VAF of 0.1% (95% C.I. 0.06 to 0.18%) (Fig. 3b). Tumor purity was
Abbosh et al. Page 3
Nature. Author manuscript; available in PMC 2018 February 14.
Europe PM
C Funders A
uthor Manuscripts
Europe PM
C Funders A
uthor Manuscripts

multiplied by tumor volume to control for stromal contamination to determine cancer cell
volume corresponding to clonal plasma VAF (Extended Data Fig. 4e). On the assumption
that 1cm3 of pure tumor contains 9.4 x 10⁷ cells17, a plasma VAF of 0.1% would correspond
to a primary NSCLC malignant burden of 302 million cells (Fig 3b, Extended Data Fig. 4f).
To investigate predictors of subclone detection, detected subclonal SNVs were mapped back
to M-seq derived tumor phylogenetic trees. 35 of 57 (61%) shared subclones (identified in
more than one tumor region through M-Seq analysis) were identified in ctDNA, compared
with 26 of 80 (33%) private subclones (detected in a single tumor region only) (Extended
Data Fig 4g). This suggested subclone volume influences subclonal ctDNA detection.
Subclone volume was estimated based on mean regional subclone cancer cell fraction and
cancer cell volume. Detected subclonal SNVs mapped to subclones with higher estimated
volumes than subclones containing undetected SNVs (Fig. 3c) and subclone volume
correlated with subclonal SNV plasma VAF (Fig. 3d).
Detecting and characterizing NSCLC relapse
The longitudinal phase of the study aimed to determine if ctDNA profiling with patient-
specific assay panels could detect and characterize the branched subclone(s) seeding
NSCLC relapse. Pre- and post-surgical plasma ctDNA profiling was performed blinded to
relapse status in a sub-group of 24 patients (cohort characteristics, Extended Table 1d-e).
This included relapse free patients who had been followed-up for a median of 775 days
(range 688 to 945 days, n=10) and confirmed NSCLC relapse cases (n=14) (cohort design,
Extended Data Fig. 2c). Additional PCR assays were added to panels in this phase of the
study to attempt to improve ctDNA detection in LUADs, a median of 18.5 SNVs (range 12
to 20) were targeted by LUSC assay-panels and a median of 28 SNVs (range 25 to 30) were
targeted by LUAD assay-panels (Extended Data Fig. 2d-e).
Patients were followed up with three to six monthly clinical assessment and chest
radiographs. At least 2 SNVs were detected in 13 of 14 (93%) patients with confirmed
NSCLC relapse prior to, or at, clinical relapse (Fig 4a-g, Extended Data Fig. 5). At least two
SNVs were detected in 1 of 10 (10%) patients (CRUK0013) with no clinical evidence of
NSCLC relapse (Fig. 4h, Extended Data Fig. 6). Excluding a single case where no post-
operative plasma was taken prior to clinical relapse (CRUK0041), the median interval
between ctDNA detection and NSCLC relapse confirmed on clinically indicated CT imaging
(lead-time) was 70 days (range 10 to 346 days). Four of 13 relapse cases exhibited lead-
times of more than six months (Fig. 4a-d). In two cases ctDNA detection preceded CT
imaging inconclusive for NSCLC relapse by 157 days (CRUK0004, Fig 4b) and 163 days
(CRUK0045, Fig 4d). ctDNA profiling reflected adjuvant chemotherapy resistance -
CRUK0080, CRUK0004 and CRUK0062 had detectable ctDNA in plasma within 30 days of
surgery. The number of detectable SNVs increased in all three cases despite adjuvant
chemotherapy, with disease recurring within 1 year of surgery (Fig. 4a-c). In contrast,
CRUK0013 had 20 SNVs detectable in ctDNA 72 hours after surgery and 13 SNVs
detectable prior to adjuvant chemotherapy; 51 days following completion of adjuvant
treatment and at post-operative days 457 and 667 no SNVs were detectable and the patient
remains relapse free 688 days post-surgery (Fig. 4h). ctDNA profiling detected intracerebral
Abbosh et al. Page 4
Nature. Author manuscript; available in PMC 2018 February 14.
Europe PM
C Funders A
uthor Manuscripts
Europe PM
C Funders A
uthor Manuscripts

relapse; CRUK0029 had a PET scan performed 50 days prior to surgery demonstrating
normal cerebral appearances. ctDNA remained detectable following surgery, 54 days post-
operatively the patient was diagnosed with intracerebral metastasis, no extracranial disease
was evident on CT imaging (Fig. 4e).
We sought to resolve subclonal evolutionary-dynamics associated with NSCLC relapse.
Subclonal SNVs displaying plasma VAFs similar to clonal SNVs from clusters confined to a
single phylogenetic branch, were detected post-operatively in the ctDNA of four patients
who suffered NSCLC relapse (CRUK0004, CRUK0063, CRUK0065 and CRUK0044) (Fig.
4b,f-g, Extended Data Fig 5b). This suggested a relapse process dominated by one subclone
represented in our assay-panel. The subclone implicated by ctDNA as driving the relapse in
the case of CRUK0004 contained an ERRB2 (HER2) amplification event (>15 copies,
triploid background), that may be targetable in NSCLC18 (Fig. 4b). Relapses involving
subclones from more than one phylogenetic branch were evident in patients CRUK0080,
CRUK0062 (Fig. 4a,c) and CRUK0041 (Extended Data Fig 5c).
Validation of phylogenetic characterization
To validate subclonal ctDNA analyses, data acquired from sequencing metastatic tissue at
recurrence was integrated with M-seq primary tumor data (for biopsy details, Supplementary
Table 3). Patient CRUK0063 suffered para-vertebral relapse of their NSCLC. Post-operative
ctDNA analysis revealed the detection of the same subclonal SNV (OR5D18) on four
consecutive occasions over a 231-day period (Extended Data Fig. 7a). The OR5D18 SNV
traced back to a subclonal cluster private to primary tumor region three (Fig. 5a). CT-guided
biopsy tissue was acquired from the para-vertebral metastasis at post-operative day 467.
Exome sequencing of relapse tissue revealed the subclonal cluster containing the OR5D18 SNV gave rise to the metastatic subclone (Fig. 5a), this supported ctDNA phylogenetic
characterization of relapse. The para-vertebral biopsy contained 88 SNVs not called as
present in the primary tumor including an ARID1A stop-gain driver SNV. Re-examination
of primary tumor region M-Seq data with a lower SNV calling threshold revealed that 16 of
88 SNVs, including ARID1A, were detectable in primary tumor region three, compared to a
maximum of 2 of 88 in other tumor regions (Extended Data Fig. 7b). These data suggest that
ctDNA profiling can resolve the primary tumor region from which a low frequency
metastatic subclone derives. CRUK0035 developed two liver and one adrenal metastases
(Fig. 5b). Sequencing of the metastatic liver deposit revealed that only 109 of 149 SNVs
classed as clonal in the primary tumor were detectable in the metastasis. This was suggestive
of an ancestral branching event not resolved through primary M-seq analysis (Fig 5b). Post-
operative ctDNA profiling identified clonal SNVs present in the liver metastasis biopsy but
also revealed SNVs representing a subclone from the primary tumor (Extended Data Fig 7c).
This subclone was not present in the metastatic liver deposit (Fig 5b). These data may reflect
ctDNA identified from the non-biopsied metastases suggesting multiple metastatic events.
CRUK0044 suffered a vertebral and right hilar relapse. Post-operatively the same subclonal
SNV (OR10K1), was detected in ctDNA on two occasions 85 days apart (Extended Data
Fig. 7d). This SNV was represented in a single subclone detected through sequencing hilar
lymph-node metastatic tissue, supporting ctDNA findings (Fig. 5c). CRUK0041 suffered an
intracerebral, hilar and subcarinal lymph node relapse. Four subclonal SNVs representing
Abbosh et al. Page 5
Nature. Author manuscript; available in PMC 2018 February 14.
Europe PM
C Funders A
uthor Manuscripts
Europe PM
C Funders A
uthor Manuscripts

both branches of the tumor phylogenetic tree were detectable in ctDNA at relapse.
Consistent with these data, sequencing of subcarinal metastatic tissue revealed the presence
of subclonal SNVs mapping to both phylogenetic branches (Fig 5d, Extended Data Fig. 7e).
Patient CRUK0013 had detectable ctDNA 3 and 38 days post-operatively. Following
adjuvant chemoradiotherapy for lymph-node metastases identified in the pathological
specimen, ctDNA levels became undetectable (Fig 4h). Two involved lymph-nodes were
sampled for exome analysis together with M-seq of the primary tumor. Four subclonal SNVs
detected in ctDNA post-operatively mapped to an ancestral subclone (describing a subclone
that existed during the tumor’s evolution) (Extended Data Fig. 7f). This ancestral subclone
contained a KRAS amplification (>15 copies, triploid background) and was identified as
present in primary tumor and sampled lymph-nodes by M-Seq (Fig. 5e). These data provide
phylogenetic characterization of post-operative residual disease that responded to adjuvant
chemoradiotherapy (Fig. 4h).
ctDNA profiling in the metastatic setting
Patient CRUK0063 underwent examination through the PEACE post-mortem study 24 hours
following death. M-Seq data from the six post-mortem tumor regions (para-aortic, para-
vertebral and lung metastases, day 857), the para-vertebral relapse biopsy (day 467) and five
primary tumor regions (day 0) were combined to infer the phylogenetic structure of this
patient’s NSCLC (Fig. 6a). All seven metastatic tumor regions arose from a single ancestral
subclone represented by phylogenetic cluster 8. Six metastatic regions shared a later
phylogenetic origin, cluster 12 (Fig. 6b). The single tumor region not containing
phylogenetic cluster 12 was sampled from the para-aortic metastasis at autopsy and
contained a private subclone represented by phylogenetic cluster 9 (Fig. 6b).
We designed a bespoke ctDNA assay-panel to retrospectively track metastatic subclonal
burden. 20 clonal SNVs and a median of 8 subclonal SNVs (range 4 to 15) in each of 9
metastatic subclonal clusters were targeted by the assay-panel (Extended Data Fig. 8). Since
103 variants per time-point were profiled, SNV detection thresholds were increased to
maintain platform specificity (see Methods). This resulted in a predicted false positive rate
(FPR) of 0.0011 translating to a 10.7% risk of a single false-positive SNV at each time point
and a 0.5% risk of 2 false-positive SNVs at each time point when testing 103 SNVs.
Two clonal SNVs were detected by the 103 SNV assay-panel at day 151 post-surgery (Fig
6c, Extended Data Fig. 8), 189 days prior to the time point ctDNA was detected using the 19
SNV assay-panel in Figure 4f. At day 242 a single subclonal SNV was detected from
phylogenetic cluster 8 (Fig 6c, Extended Data Fig. 8), within the context of a 10.7% false-
positive risk a single SNV call could represent type I error. At day 466, following clinical-
relapse at the thoracic para-vertebral site, 18 of 20 SNVs mapping to phylogenetic clusters
(8,11 and 12) were detected in ctDNA, these subclonal clusters were shared between six of
seven metastatic sites (Fig 6b-c, Extended Data Fig. 8). Single SNVs from two private
subclones (phylogenetic cluster 5 and 9) were also detectable in ctDNA at day 466 (Fig 6c,
Extended Data Fig. 8). These subclones were not identified in the CT guided para-vertebral
biopsy taken at day 467 (Fig. 6b). The mean plasma VAF of the SNVs detected in
phylogenetic clusters 11, 8, 12, 9 and 5 mirrored their proximity to the clonal cluster (light
Abbosh et al. Page 6
Nature. Author manuscript; available in PMC 2018 February 14.
Europe PM
C Funders A
uthor Manuscripts
Europe PM
C Funders A
uthor Manuscripts

blue) in the M-Seq derived phylogenetic tree (Fig. 6a,c). This suggested a tiered burden of
subclonal disease concordant with M-seq phylogenetic inferences. Mean clonal VAF fell in
response to palliative radiotherapy and chemotherapy, but at day 767 increased (Fig. 6c).
Single SNVs mapping to phylogenetic clusters 5 and 9 and two SNVs mapping to
phylogenetic cluster 2 were now detectable in ctDNA 90 days before death (Fig. 6a-c,
Extended Data Fig 8). These three phylogenetic clusters represented subclones private to the
para-aortic metastases (Fig 6. a-b). Consistent with these data significant para-aortic
progression was observed at post-mortem compared with most recent CT imaging
performed 112 days before death - which showed no evidence of para-aortic disease.
Discussion
In summary, we find predictors of ctDNA detection in early-stage NSCLC characterized by
non-adenocarcinoma histology, necrosis, increased proliferative indices and lymphovascular
invasion. Triple negative breast cancers display necrosis19, high proliferative indices20,21
and are associated with increased ctDNA levels compared with other breast cancer
subtypes6 suggesting extension of these observations beyond NSCLC.
Tumour volume correlated with the mean plasma VAF of clonal SNVs in ctDNA-positive
NSCLCs (Fig 3a.). A primary NSCLC tumour volume of 10 cm3 predicted a ctDNA plasma
VAF of 0.1%. The sensitivity of the multiplex-PCR NGS platform was in excess of 99% at
VAFs of 0.1% and above, suggesting optimum platform sensitivity with tumour burdens in
excess of 10 cm3. Low-dose CT lung screening can identify lung nodules with diameters
from 4mm22. Assuming a spherical nodule this would translate to a tumor volume of
0.034cm3. Based on the relationship between tumor volume and ctDNA plasma VAF
observed in this study a tumor volume of 0.034cm3 would equate to a plasma VAF of 1.8 x
10-4 % (95% CI, 9.8 x 10⁻⁶ to 0.0033%), at the extreme of detection limits of current ctDNA
platforms23. Sensitivity of clonal SNV ctDNA directed early NSCLC screening may
therefore be constrained by tumor size using current technologies.
A limitation to targeted ctDNA profiling is cost, estimated at $1750 per patient for
sequencing a single tumor region, synthesis of a patient-specific assay-panel and profiling of
five plasma samples. Adjuvant platinum-based chemotherapy in NSCLC improves cure rates
following surgery in only 5% of patients and 20% patients receiving chemotherapy
experience acute toxicities3. There is a need to increase adjuvant therapy efficacy and better
target its use. Bespoke ctDNA profiling can characterize the subclonal dynamics of relapsing
NSCLC and identify adjuvant chemotherapy resistance. These findings indicate that drug
development guided by ctDNA platforms to identify residual disease, define adjuvant
treatment response and target emerging subclones prior to clinical recurrence in NSCLC,
with appropriate CLIA validation, are now feasible.
Methods
Patients and samples
The cohort of 100 patients evaluated within this study comprises the first 100 patients
prospectively analyzed by the lung TRACERx study (Clinicaltrials.gov no: NCT01888601,
Abbosh et al. Page 7
Nature. Author manuscript; available in PMC 2018 February 14.
Europe PM
C Funders A
uthor Manuscripts
Europe PM
C Funders A
uthor Manuscripts

approved by an independent Research Ethics Committee, 13/LO/1546) and mirrors the
prospective 100 patient cohort by Jamal-Hanjani M et al9. All surgically resected primary
tumor samples were macroscopically reviewed by a pathologist. Spatially separated tumor
regions, documented by photography, were collected and snap frozen in liquid nitrogen for
subsequent DNA extraction. Relapse tissue samples, excess to diagnostic requirements, were
acquired via clinical procedures including CT guided biopsy and endoscopic bronchial
ultrasound guided biopsy. Fresh tissue for research was snap frozen immediately following
acquisition for subsequent DNA extraction. Post mortem examination was performed
through the PEACE study within 24 hours of death (Clinicaltrials.gov no: NCT03004755,
approved by an independent Research Ethics Committee, 13/LO/0972). Details on relapse
tissue sampling available in Supplementary Table 3. Informed consent was obtained from all
subjects in this study.
Tissue microarray creation and Ki67 immunohistochemistry
Tissue microarrays (TMAs) were created of 100 NSCLC cases for Ki67+
immunohistochemistry. Representative tumor areas were defined by examination of H&E
stained sections from all 100 tissues blocks. From each NSCLC case two 2mm cores were
selected from different regions within each specimen and re-embedded in recipient blocks,
resulting in a TMA of 200 cores with four normal lung cores as negative control. 2-5μm
sections from tissue-microarrays containing tumor were cut. Immunohistochemistry with
anti-Ki67 monoclonal antibody (Dilution 1:100; clone MIB-1; DAKO Agilent Technologies
LDA, UK Limited, Stockport, Cheshire SK8 3GR, UK) was performed using BenchMark
Ultra (Ventana/Roche). The percentage of Ki67 positive cells were averaged across two
tumor sections for each case. Detection was performed using the peroxidase-based detection
reagent conjugate (OptiView DAB IHC Detection Kit; Ventana Medical Systems, Inc).
Central histopathological review
Digital images of tumor sections from all cases were reviewed in detail centrally by at least
one pathologist, and in cases of uncertainty, by two. Percentage of necrosis and the presence
of lymphovascular invasion were all evaluated on digital images from scanned diagnostic
slides blinded to the ctDNA detection status of the patient in question.
Central radiology review & volume estimation
92 of 96 anonymized diagnostic PET-CT were retrospectively reviewed by a Nuclear
Medicine Physician, blinded to the initial PET-CT reports. Scan images were not available in
three cases (CRUK0025, CRUK0039 and CRUK0023) and in one case a pre-operative PET-
CT was not performed (CRUK0082). CT and PET images were matched and fused into
transaxial, coronal and sagittal images and reviewed on a dedicated PET/CT software
visualizer (AW 4.1/4.2 GE medical systems). The semi-quantitative parameter Standardized
Uptake Value (SUV) max for the primary tumor mass was calculated and recorded along
with SUVmax of mediastinal background uptake. Tumor-to-background ratio (TBR) was
calculated based on SUVmax of the tumor divided by mediastinal background uptake24,25.
Tumor volume was determined based on tumor CT scans. CT slices of the primary tumor
were measured with 3D Slicer applying the “lung algorithm window” settings, tumor
contours were segmented on each axial CT slice. These steps were performed by an
Abbosh et al. Page 8
Nature. Author manuscript; available in PMC 2018 February 14.
Europe PM
C Funders A
uthor Manuscripts
Europe PM
C Funders A
uthor Manuscripts

experienced resident (W.L.B.), and all contours were confirmed and edited where necessary,
by a radiologist with 14 years of experience in cancer imaging (F.M.F.). Effective tumor
volume was defined as tumor volume multiplied with the mean purity of the tumor based on
M-seq, purity estimates derived from ASCAT analysis as described9. Effective subclone size
was defined as mean cancer cell fraction (CCF) across the regions of the mutation cluster
multiplied by tumor volume and mean tumor purity.
DNA extraction & quantification
For cell-free DNA (cfDNA) extraction, blood samples were collected in K2 EDTA tubes.
Samples were processed within 2 hours of collection by double spinning of blood first at 10
minutes at 1000g then plasma 10 minutes at 2000g. Plasma was stored in 1ml aliquots at –
80°C. Up to 5ml of plasma per case was available for this study (range 1-5ml, median 5 ml).
The entire volume of plasma was used for cfDNA extraction. cfDNA was extracted using the
QIAamp Circulating Nucleic Acid kit (Qiagen) and eluted into 50 µl DNA Suspension
Buffer (Sigma). The purified cfDNA was stored at -20°C until use. Genomic DNA was
extracted from each tumor region as described9. Every cfDNA sample was QCed and
quantified on the Bioanalyzer High Sensitivity (Agilent) using a standard curve generated
from pre-quantified mono-nucleosomal DNA samples. Plasma cfDNA consists of a main
mono-nucleosomal peak (~160 bp); for some samples, di-nucleosomal and tri-nucleosomal
peaks are visible (at ~320 bp and ~500 bp, respectively). The library prep method used
selectively amplifies the mono-nucleosomal fraction of cfDNA.
Exome sequencing and processing
Whole exome sequencing was performed on DNA purified from tumor tissue and normal
blood as described9, with the exception of CRUK0063_BR_T1-R1. This capture was
performed according to the manufacturer’s 200 ng DNA protocol (Agilent). Annotated SNV
calls are available in Supplementary Table 3 in Jamal-Hanjani et al. 20179. For this study,
one relapse sample was acquired through metastatic tissue biopsies from each of four
patients (CRUK0035, CRUK0041, CRUK0044, CRUK0063). Additionally, six metastatic
samples were acquired at post mortem examination of CRUK0063. Genomic DNA was
purified from all tissue samples, and processed through the TRACERx bioinformatics
pipeline as described9. Annotated SNV calls are available in Supplementary Table 4.
SNV assay design
The Natera assay design pipeline was used to generate forward and reverse PCR primers for
all somatic SNVs detected in tumor samples. The assays were combined into pools such that
any primer pair in a pool is not predicted to form primer dimers. In this way 10 balanced
pools were created, each containing the assays for 10 patients’ SNVs. For each patient,
assays were prioritized such that, 1) assays covering driver SNVs had highest priority, and 2)
there was uniform sampling of phylogenetic tree. For the longitudinal cohort, up to 10 extra
assays were generated for adenocarcinoma samples. SNV assays were ordered from IDT
(Coralville, IA) as individual oligos in 96-well plates, desalted and normalized to 100 µM
each. The oligos were pooled according to the pooling strategy previously described10 and
each pool was QC-ed by running the multiplex PCR and sequencing protocol using one
plasma cfDNA library from a healthy subject. For each pool, the sequencing data was
Abbosh et al. Page 9
Nature. Author manuscript; available in PMC 2018 February 14.
Europe PM
C Funders A
uthor Manuscripts
Europe PM
C Funders A
uthor Manuscripts

analyzed to determine the amount of primer-dimer reads and to identify drop-out assays.
Primers contributing to dimer formation were removed from each final pool.
Analytical validation
Synthetic spikes representing twenty SNVs randomly selected from Pool 1 were designed
and synthesized (IDT, Coralville, IA) as 160 bp oligos with the respective SNV placed in the
middle (position 80). These synthetic spikes were mixed at equimolar ratios and used to
prepare a library. This library was titrated into a library prepared from mono-nucleosomal
DNA (10,000 copies) from a normal cell line (AG16778 from Coriell, Camden, NJ). The
library of 20 synthetic spikes was titrated into the mononucleosomal DNA library at 2.5%,
0.5%, 0.25%, 0.1%, 0.05% and 0% (each in triplicate), and 0.01%, 0.005% and 0.001%
(each in quadruplicate. Because preparing spiked samples at such low levels is either subject
to sampling noise (0.01% spikes into 10,000 genomic copies background is equivalent to
one mutant copy), or is not possible (at levels less than 0.01%), samples were mixed as
libraries. Following library mixing and sequencing, data was analyzed to detect all the
targets in Pool 1 using the same parameters as used for the patient samples. Targets that had
a depth of read less than the threshold were not analyzed. The measured VAF of each spike
for the samples with 2.5% nominal input was used to calculate an input correction factor
(measured VAF/2.5%); that was applied to the other inputs of the corresponding spike
titration series. The measured VAF differed from the nominal input most likely because the
mononucleosomal fragmentation pattern is not entirely random. Because of this, the actual
input levels differ from the nominal input levels, and the sensitivity is measured based on
corrected input intervals (chosen such that there are a meaningful number of samples in each
interval). Sensitivity of >99% at SNV input frequencies down to 0.1% was achieved (199
SNVs detected out of 201 eligible positive positions), with a specificity of 99.6% for all
negative SNV positions (19 false positive SNVs called out of 5099 eligible positions).
Plasma SNV mPCR-NGS workflow
Forty microliters of the extracted cfDNA from each case was used as input into library
preparation using the Natera Library Prep Kit. All purified libraries were QC-ed on the
LabChip GX 5k DNA chip. Successful libraries had a single peak at ~250 bp. The amplified
libraries were then analyzed by mPCR-NGS. Optimal mPCR conditions were as described.
Each PCR assay pool was used to amplify the SNV targets from the 10 corresponding
samples and 20 negative control samples (plasma libraries prepared from healthy subjects).
Each amplicon pool was sequenced on one Illumina HiSeq 2500 Rapid Run with 50 cycles
paired-end reads using the Illumina Paired End v1 kit with an average target DOR of
~40,000 per assay.
Plasma SNV calling algorithm
The set of SNVs covered by the assays in a pool were considered as target SNVs for the
corresponding sequencing run. Target assays with <1000 reads in the plasma samples were
considered failed and were not analyzed further. At each SNV position, an error model was
built using all of the 20 negative control samples plus the cancer samples that were not
expected to contain that particular SNV (based on tumor-tissue sequencing). Samples with
high plasma VAF (>20%) among the putative negatives were considered to have possible
Abbosh et al. Page 10
Nature. Author manuscript; available in PMC 2018 February 14.
Europe PM
C Funders A
uthor Manuscripts
Europe PM
C Funders A
uthor Manuscripts

germline mutation and were excluded from the error model. A confidence score was
calculated for each target SNV based on the error model. A positive plasma SNV call was
made if the confidence score for that mutation in the corresponding plasma sample passed
our confidence threshold. The SNVs called positive in plasma samples that were not
expected to contain the given SNVs were considered ‘false positive’, the false positive rate
under these conditions was 0.24%. Notably, there was no difference in depth of read
between called and not called SNVs (Extended Data Fig 1c). New assays were designed for
CRUK0063 based on M-seq of metastatic biopsy retrieved at day 467 and of metastatic
lesions harvested post mortem. A total of 103 assays were designed compared to 19 based
on the primary tumor alone. An updated error threshold was designed to control for false
positives by using the original threshold to make SNV calls on the negative samples in the
run; the rate of calls were measured and defined as false-positives. This false positive rate
was then applied to the number of eligible positions in the positive samples. This was
repeated with more stringent thresholds until the expected number of false positives in the
eligible positions becomes ~1. All multiplex PCR-NGS ctDNA SNV assays are available in
Supplementary Table 5 (Baseline, pre-operative cohort assays), Supplementary Table 6
(Longitudinal Assays), and Supplementary Table 7 (Extended Longitudinal Assays for
CRUK0063).
Cross-platform validation using generic PCR-NGS panel section
Cross-platform validation was performed in 28 patients with M-Seq confirmed SNV(s)
within one or more hotspots targeted by a generic multiplex PCR-NGS panel (Extended
Table 2a-b, Supplementary Table 8). 20ng of isolated cfDNA was used for library
preparation using the Oncomine™ Lung cfDNA Assay (ThermoFisher Scientific), according
to the manufacturer’s instructions. Automated template preparation and chip loading was
conducted on the Ion Chef™ instrument using the Ion 520™ & Ion 530™ Kit-Chef
(ThermoFisher Scientific). Ultimately, samples were sequenced on Ion 530™ chips using
the Ion S5™ System (ThermoFisher Scientific). Sequencing data was accessed on the
Torrent suite v5.2.2. Reads were aligned against the human genome (hg19) using Alignment
v4.0-r77189, and variants were called using the coverage Analysis v4.0-r77897 plugin. All
18 bespoke-panel ctDNA negative patients had no tumor SNVs detectable in plasma pre-
operatively by the generic panel supporting biological specificity of the bespoke targeted
approach, 7 of 10 bespoke-panel ctDNA positive patients had tumor SNVs detected in
plasma by the generic panel (Extended Table 2a-b). SNVs detected by hotspot panel not
identified by M-Seq are displayed in Extended Table 2c.
Processing and phylogenetic analysis of relapse and primary tumor multiregion whole exome data
Biopsies from multiple regions from the primary tumor (n=327), metastatic biopsies (n=4)
and matching blood germline samples (n=100) were subjected to multi-region whole exome
sequencing and analysis including estimation of copy number, purity and ploidy, and
phylogenetic tree construction as described9. Briefly, phylogenetic analysis was performed
based on CCF determined for SNVs and clustered across tumor regions using a modified
version of Pyclone9 into clusters with similar CCF values, filtered and processed as
described9. Mutation clusters are assumed to represent tumor subclones, either current or
Abbosh et al. Page 11
Nature. Author manuscript; available in PMC 2018 February 14.
Europe PM
C Funders A
uthor Manuscripts
Europe PM
C Funders A
uthor Manuscripts

ancestral, and are used as input for construction of phylogenetic relationship. Phylogenetic
trees were primarily constructed using the published tool CITUP (0.1.0)26. However, in a
small number of cases, including all relapse/autopsy cases, manual tree construction was
required and performed as described9. Complete detail of primary tumor tree construction
can be found in Jamal-Hanjani et al. 20179. Relapse tree construction was performed as
follow: CRUK0063: clustering was performed twice, once across 5 primary tumor regions
and once across 5 primary, 1 relapse, and 6 autopsy regions. To ensure consistency, when
deriving a phylogenetic tree based on all tumor regions, CCF clusters based on clustering
only the primary tumor regions were maintained for mutations not involved in metastatic
relapse. A phylogenetic tree was constructed based on 17 mutation clusters. CRUK0035:
Clustering primary tumor regions with the relapse region revealed one cluster private to the
relapse, and one cluster shared with the relapse and all other regions. CRUK0044: Clustering
primary tumor regions with the relapse region revealed a cluster private to the relapse,
descended from a cluster private to region 1 in the primary tumor. CRUK0041: Clustering
primary tumor regions with the relapse region revealed cluster 4 as private to the relapse.
This cluster must have evolved from cluster 3 only found in the relapse and in region 4. A
private cluster 6 in region 4 must have evolved from cluster 4. However, this conflicts with
clusters 2 and 5, found in the relapse and regions 1-3, but not region 4. This can be
reconciled by assuming a polyclonal relapse, seeded primarily from regions 1-3, but with
some contribution from cluster 3, private to region 4. Cluster data is available in
Supplementary Table 4 under “PyClonePhyloCluster”.
Statistical data analysis
Analysis was performed in the R statistical environment version 3.2.3 and SPSS version 24.
All statistical tests were two-sided unless expressly stated. Multivariate logistic regression
used detection of ctDNA (the dependent variable) classified as detection of 2 or more
patient-specific variants in ctDNA and the covariates listed in Supplementary Table 1. All
predictors were entered simultaneously into the regression. All continuous independent
variables were found to be linearly related to the logit of the dependent variable (assessed
via the Box-Tidwell procedure). The logistic regression model was statistically significant,
X2(10) = 81.35, P<0.001 and the Hosmer-Lemeshow P value was 0.9858 indicating that the
model was not a poor fit. To determine the ability of PET TBR to predict whether or not
tumor ctDNA was identified in plasma, PET TBR estimates were analyzed by ROC curve
analysis against binary detection of ctDNA in plasma at baseline based on at least two
variants detected, significance test based on Wilcoxon rank sum test. For analysis involving
longitudinally detected variants (Figure 4, Extended Figure 5), only subclonal variants from
pyclone clusters present in phylogenetic trees were displayed, this did not affect ctDNA
detection status of any time-points. In non-relapse cases presented in Extended Data Fig 6
all detected subclonal SNVs were plotted. To determine the relationship between tumor
volume and ctDNA VAF, ctDNA assays against clonal SNVs were selected. For each
patient, the mean ctDNA VAF of the clonal SNVs was determined as baseline for 38/46
patients with at least 2 SNVs detected in plasma. As detailed in Extended Fig. 4c, 9/46
patients were not included in the analysis: CRUK0036 had no pre-op CT scan available,
CRUK0087 and CRUK0096 had a large cavity inside the primary cancer, CRUK0099 had a
collapsed lung making volume assessment inaccurate, CRUK0100, CRUK0077, CRUK0052
Abbosh et al. Page 12
Nature. Author manuscript; available in PMC 2018 February 14.
Europe PM
C Funders A
uthor Manuscripts
Europe PM
C Funders A
uthor Manuscripts

had a CT slice spacing of > 5 mm, and finally CRUK0088 and CRUK0091 had a total tumor
volume < 3.5 cm3. Linear regression was performed on log-transformed mean VAF and
tumor volume. The log transformation was justified as it symmetrized the residuals in the
model. An independent analysis was performed where tumor volume was multiplied with
tumor purity to estimate the cancer cell volume. The same log transformation and analysis
was applied to data acquired from Newman et al.16, where ctDNA VAF was determined
based on CAPP-seq analysis with matched tumor volume data available. To analyze clone
size versus ctDNA VAF for subclonal SNVs, the mean CCF of the mutations within a
subclonal mutation cluster was multiplied with tumor volume, and as a second independent
analysis, with tumor purity.
Abbosh et al. Page 13
Nature. Author manuscript; available in PMC 2018 February 14.
Europe PM
C Funders A
uthor Manuscripts
Europe PM
C Funders A
uthor Manuscripts

Extended Data
Extended Data Figure 1. Multiplex-PCR next-generation sequencing platform analytical validationa) Analytical validation of the multiplex-PCR NGS platform was performed by spiking
synthetic single nucleotide variants into control cell-free DNA. Sensitivity and specificity of
the platform at different spike concentrations was ascertained, 95% binomial confidence
interval displayed as error bars. b) Specificity of ctDNA detection based on a 1 SNV and 2
SNV call threshold taking into account parallel testing of multiple SNVs. c) The median
Abbosh et al. Page 14
Nature. Author manuscript; available in PMC 2018 February 14.
Europe PM
C Funders A
uthor Manuscripts
Europe PM
C Funders A
uthor Manuscripts

depth of read across a position did not vary depending on whether an SNV position was
called or not called using the platform error-model. Wilcoxon Test, P=0.786, median depth
of read at uncalled positions = 45,777 (n=3,745), range: 0 to 146774, median depth of read
at called positions = 45,478, range= 1,354 to 152,974 (n=1,124). Whiskers represent 1.5
times the interquartile range, 2-sided test.
Extended Data Figure 2. Study construction and assay-panel design
Abbosh et al. Page 15
Nature. Author manuscript; available in PMC 2018 February 14.
Europe PM
C Funders A
uthor Manuscripts
Europe PM
C Funders A
uthor Manuscripts

a) The pre-operative study phase cohort consisted of 100 TRACERx patients present in the
first 100 patient TRACERx cohort in April 2016. Pre-operative plasma samples were
profiled in 96 patients for reasons listed. bi and ii) Contents of patient-specific assay-panels
designed in the pre-operative study phase. c) The longitudinal study phase cohort consisted
of patients with confirmed NSCLC relapse and patients without relapse. d) Contents of
patient-specific assay-panels designed in the longitudinal phases of this study. e) Single
nucleotide variant type targeted.
Abbosh et al. Page 16
Nature. Author manuscript; available in PMC 2018 February 14.
Europe PM
C Funders A
uthor Manuscripts
Europe PM
C Funders A
uthor Manuscripts

Extended Data Figure 3. Clinicopathological predictors of ctDNA detectiona) 96 patients in pre-operative cohort stratified by pathological TNM stage. b) LUSCs and
ctDNA positive LUADs are significantly more necrotic that ctDNA negative LUADs.
Significant differences in necrosis between groups: LUSCs (median necrosis 40%) (n=31),
ctDNA positive LUADs (median necrosis 15%) (n=11) and ctDNA negative LUADs
(median necrosis 2%) (n=47), Kruskal-Wallis test, P<0.001, 2-sided pairwise comparisons
were performed using Dunn’s procedure with Bonferroni correction. c) Univariate (left) and
multivariate analyses (right) were performed, by logistic regression to determine significant
predictors of ctDNA detection in early-stage NSCLC. ctDNA detection was defined as
detection of two or more SNVs in pre-operative plasma samples. Details regarding
multivariable analysis methodology are in methods. d) Receiver operating characteristic
curve (ROC) analysis of pre-operative PET scan FDG-avidity (normalized as tumor
background ratio (TBR), see methods), as a predictor of ctDNA detection (92/96 PET scans
were available for central review). Median PET TBR of detected tumors = 9.01, n=45.
Median PET TBR of undetected tumors= 3.64, n=47. P-value based on Wilcoxon Rank Sum
Test. e) LUAD subtype analyses based on ctDNA detection and the presence of an EGFR,
KRAS or TP53 driver mutation.
Abbosh et al. Page 17
Nature. Author manuscript; available in PMC 2018 February 14.
Europe PM
C Funders A
uthor Manuscripts
Europe PM
C Funders A
uthor Manuscripts

Extended Data Figure 4. Predictors of plasma variant allele frequencya) Plasma variant allele frequencies of SNVs detected in plasma in 46 patients who were
ctDNA positive (two or more SNVs detected). Clonal (blue) and subclonal (red) variant
allele frequencies indicated, mean shown as horizontal line. Driver variants shown as
triangles. b) Mean clonal VAF correlated with maximum tumor size measured in post-
surgical specimen (pathological size, n=46) grey vertical bars represent range of clonal
variant allele frequency. Shaded red background indicates 95% confidence interval. c)
Filtering steps taken to define a group of ctDNA positive patients with volumetric data
Abbosh et al. Page 18
Nature. Author manuscript; available in PMC 2018 February 14.
Europe PM
C Funders A
uthor Manuscripts
Europe PM
C Funders A
uthor Manuscripts

considered adequate to model tumor volume and plasma variant allele frequency. d) Scatter
plot showing mean clonal VAF relative to tumor volume for TRACERx (blue dots and fitted
blue line, n=37) and VAF relative to volume for previously published data based on CAPP-
seq analysis of ctDNA (orange dots and orange fitted line, n=9). Orange shaded background
indicates 95% confidence interval based on CAPP-seq data. e) Mean clonal VAF correlated
with tumor volume × tumor purity (cancer cell volume), n=37. Shaded red background
indicates 95% confidence interval. f) Association between number of cancer cells and VAF
of clonal SNVs in plasma based on linear modelling of Extended Data Fig 4f. g) Detected
subclonal SNVs were mapped back to M-Seq derived tumor phylogenetic trees (process
illustrated in graphic). Detected private subclones (subclones identified within only a single
tumor region) are coloured red. Shared subclones (subclones detected in more than one
tumor regions) are light blue. Subclonal nodes were sized based on the maximum recorded
cancer cell fraction (CCF). The top row of phylogenetic trees represent subclonal nodes
targeted by primers within that patient’s assay panel, the bottom row represent subclonal
nodes detected in ctDNA, within this row grey subclonal nodes represent subclones not
detected in ctDNA.
Abbosh et al. Page 19
Nature. Author manuscript; available in PMC 2018 February 14.
Europe PM
C Funders A
uthor Manuscripts
Europe PM
C Funders A
uthor Manuscripts

Extended Data Figure 5. Longitudinal ctDNA profiling, remaining relapse cases.a) Kaplan-Meier curve demonstrate relapse free survival for patients in whom ctDNA was
detected versus patients in whom ctDNA was not detected. b-h) Longitudinal cell-free DNA
profiling. Circulating tumor DNA (ctDNA) detection in plasma was defined as the detection
of two tumor-specific SNVs. Relapse was based on imaging-confirmed NSCLC relapse,
imaging performed as clinically indicated. Detected clonal (circles, light blue) and subclonal
(triangles, colors indicates different subclones) SNVs from each patient-specific assay-panel
are plotted on graphs colored by M-Seq derived tumor phylogenetic nodes. Mean clonal
(blue) and mean subclonal (red) VAF are indicated on graphs. Pre-operative and relapse M-
Seq derived phylogenetic trees represented by ctDNA are illustrated above each graph in
cases where subclonal SNVs were detected.
Abbosh et al. Page 20
Nature. Author manuscript; available in PMC 2018 February 14.
Europe PM
C Funders A
uthor Manuscripts
Europe PM
C Funders A
uthor Manuscripts

Extended Data Figure 6. Longitudinal ctDNA profiling, non-relapse casesa-j) Detected clonal (circles, light blue) and subclonal (red triangles) SNVs from each
patient-specific assay-panel are plotted on graphs. Mean clonal (blue) and mean subclonal
(red) VAF are indicated on graphs.
Abbosh et al. Page 21
Nature. Author manuscript; available in PMC 2018 February 14.
Europe PM
C Funders A
uthor Manuscripts
Europe PM
C Funders A
uthor Manuscripts

Extended Data Figure 7. Heatmaps illustrating detection of SNVs in bespoke panel at each sampled time pointa, c-f) Bespoke assay panels for CRUK0063, CRUK0035, CRUK0044, CRUK0041 and
CRUK0013. Colors indicate originating subclonal cluster based on the phylogenetic trees
above the heatmap. Light blue indicates clonal mutation cluster. Full panel with cluster color
shown below each heatmap. Filled squares indicates detection of a given variant in plasma
ctDNA. Y-axis shows day of sampling, y-axis labels appended with [R] indicates day of
clinical relapse. b) Re-examination of primary tumor regions from CRUK0063 with lowered
threshold to potentially identify SNVs private to the sequenced relapse biopsy. 16/88
Abbosh et al. Page 22
Nature. Author manuscript; available in PMC 2018 February 14.
Europe PM
C Funders A
uthor Manuscripts
Europe PM
C Funders A
uthor Manuscripts

variants were found at very low VAF in region 3, indicating this region from the primary
likely gave rise to the metastasis.
Extended Data Figure 8. Heatmap illustrating detection of SNVs in bespoke panel based on M-seq of metastatic tumor regions for patient CRUK0063 for all sampled time points.Colors indicate originating subclonal cluster based on the phylogenetic trees above the
heatmap. Light blue indicates clonal mutation cluster. Full panel with cluster color shown
below each heatmap. Filled squares indicates detection of a given variant in plasma ctDNA.
Y-axis shows day of sampling.
Abbosh et al. Page 23
Nature. Author manuscript; available in PMC 2018 February 14.
Europe PM
C Funders A
uthor Manuscripts
Europe PM
C Funders A
uthor Manuscripts

Extended Table 1aPatient characteristics
Clinical characteristics 96 patient pre-operative cohort
table of clinical characteristics describing the 96 patient pre-operative cohort
Characteristic Total
Age <60 19
≥60 77
Sex Male 60
Female 36
ECOG PS 0 49
1 47
Histology Adenocarcinoma 58
Squamous cell carcinoma 31
Carcinosarcoma 2
Large cell carcinoma 1
Adenosquamous carcinoma 3
Large cell neuroendocrine carcinoma 1
TNM stage Ia 24
Ib 35
IIa 12
IIb 11
IIIa 13
IIIb 1
Lymph node metastasis Yes 24
No 72
Pleural involvement Yes 27
No 69
Vascular invasion Yes 41
No 55
Resection margin R0 91
R1 5
Smoking status Never smoked 11
Recent ex-smoker 30
Ex-smoker 48
Current smoker 7
Ethnicity White British 85
White-other 4
Abbosh et al. Page 24
Nature. Author manuscript; available in PMC 2018 February 14.
Europe PM
C Funders A
uthor Manuscripts
Europe PM
C Funders A
uthor Manuscripts

Characteristic Total
White-Irish 4
Caribbean 3
Extended Table 1b
demonstrating distribution of stage and whether the patient received adjuvant chemotherapy
No adjuvant therapy Adjuvant therapy
TNM Stage Ia 24 0
Ib 31 4
IIa 3 9
IIb 4 7
IIIa 6 7
IIIb 0 1
Extended Table 1c
Details regarding timing of pre-operative blood sample
Demonstrating the time-points at which pre-operative plasma was acquired for patients
within the cohort
Days pre-surgery Number Details
Within 24 hours 91
24-72 hours 2 CRUK0051, 0003
8 days 2 CRUK0073, 0096
31 days 1 CRUK0089
Extended Table 1d
Clinical characteristics 24 patient longitudinal sub-cohort
table of clinical characteristics describing 24 patient longitudinal cohort
Characteristic Total
Age <60 5
≥60 19
Sex Male 16
Female 8
ECOG PS 0 12
1 12
Histology Adenocarcinoma 16
Squamous cell carcinoma 8
Abbosh et al. Page 25
Nature. Author manuscript; available in PMC 2018 February 14.
Europe PM
C Funders A
uthor Manuscripts
Europe PM
C Funders A
uthor Manuscripts

Characteristic Total
TNM stage Ia 3
Ib 7
IIa 3
IIb 7
IIIa 3
IIIb 1
Lymph node metastasis Yes 9
No 15
Pleural involvement Yes 7
No 17
Vascular invasion Yes 12
No 12
Resection margin R0 23
R1 1
Smoking status Never smoked 1
Recent ex-smoker 5
Ex-smoker 16
Current smoker 2
Ethnicity White British 21
White-other 2
Caribbean 1
Extended Table 1e
demonstrating distribution of stage in the longitudinal cohort and whether the patient
received adjuvant chemotherapy.
No adjuvant therapy Adjuvant therapy
TNM Stage Ia 3 0
Ib 6 1
IIa 0 3
IIb 2 5
IIIa 1 2
IIIb 0 1
Abbosh et al. Page 26
Nature. Author manuscript; available in PMC 2018 February 14.
Europe PM
C Funders A
uthor Manuscripts
Europe PM
C Funders A
uthor Manuscripts

Table 2aCross platform validation using a generic approach to ctDNA profiling
Bespoke panel detected NSCLCs - cross platform validation
a) 7/10 (70%) of bespoke-panel ctDNA positive patients had tumor SNVs detectable in
plasma preoperatively by a generic hotspot PCR-NGS lung panel (Lung Oncomine,
Thermofisher). The three bespoke-panel ctDNA positive patients undetected by the generic
panel had mean clonal plasma variant allele frequencies lower than the 0.1% plasma variant
allele frequency (VAF) limit of detection reported for the generic panel (shaded yellow). b)
Based on CT volumetric assessment of each patient’s primary tumor we predicted plasma
VAF corresponding to a tumor of that size (see Figure 3 and Methods for details of
approach). This allowed us to infer platform sensitivities for each patient within the
bespoke-panel non-detected cohort. Six LUADs (shaded green; CRUK0037, CRUK0051,
CRUK0004, CRUK0039, CRUK0025 and CRUK0048) had tumor volumes approximating
to a plasma VAF of more than 0.1%. This suggested that these tumors resided within the top
platform sensitivity bracket of both the generic and bespoke-panel ctDNA platforms. No
ctDNA was detected by either platform in these cases, suggesting biological specificity of
the bespoke-panel.
Bespoke-panel Generic-panel
Case Volume cm3 Plasma VAF
(mean clonal)
ctDNA positive Histology Hotspot SNVs tumor Hotspot SNVs detected
CRUK0029 38.51 2.10 Yes LUAD 1 1
CRUK0009 69.01 1.71 Yes LUAD 1 1
CRUK0062 58.48 1.41 Yes LUSC 1 1
CRUK0081 16.41 0.21 Yes LUSC 1 1
CRUK0089 17.39 0.16 Yes LUSC 1 1
CRUK0022 17.20 0.08 Yes LUAD 1 0
CRUK0067 6.64 0.07 Yes LUSC 1 0
CRUK0052 43.69 0.06 Yes LUAD 2 1
CRUK0064 9.24 0.05 Yes LUSC 1 0
CRUK0034 10.59 0.01 Yes LUAD 1 1
2 b - Bespoke panel non-detected NSCLCs - cross platform validation
Bespoke-panel Generic-panel
Case Volume cm3 Predicted plasma VAF ctDNA positive Histology Hotspot SNVs tumor Hotspot SNVs detected
CRUK0037 197.42 2.96 (1.01 to 8.67) No LUAD 1 0
CRUK0051 27.28 0.32 (0.21 to 0.49) No LUAD 1 0
CRUK0004 23.30 0.27 (0.18 to 0.41) No LUAD 1 0
CRUK0039 21.68 0.25 (0.16 to 0.38) No LUAD 2 0
CRUK0025 19.06 0.22 (0.14 to 0.33) No LUAD 2 0
CRUK0048 17.00 0.19 (0.12 to 0.29) No LUAD 2 0
Abbosh et al. Page 27
Nature. Author manuscript; available in PMC 2018 February 14.
Europe PM
C Funders A
uthor Manuscripts
Europe PM
C Funders A
uthor Manuscripts
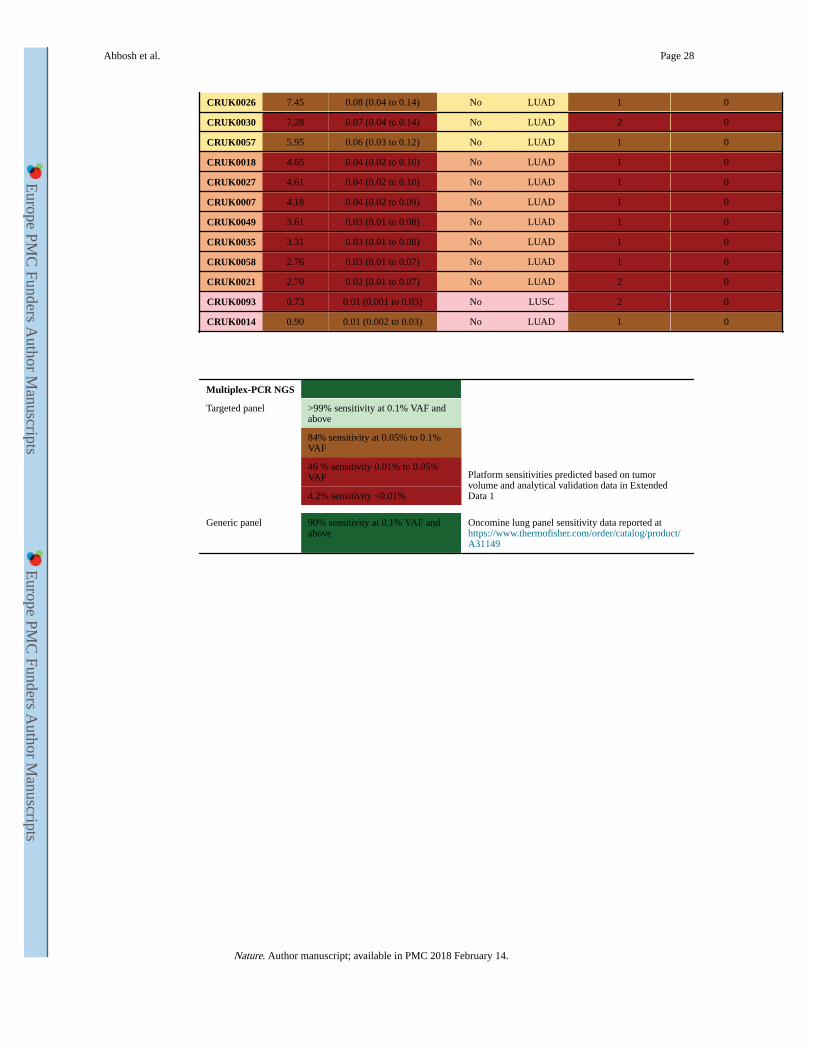
CRUK0026 7.45 0.08 (0.04 to 0.14) No LUAD 1 0
CRUK0030 7.28 0.07 (0.04 to 0.14) No LUAD 2 0
CRUK0057 5.95 0.06 (0.03 to 0.12) No LUAD 1 0
CRUK0018 4.65 0.04 (0.02 to 0.10) No LUAD 1 0
CRUK0027 4.61 0.04 (0.02 to 0.10) No LUAD 1 0
CRUK0007 4.18 0.04 (0.02 to 0.09) No LUAD 1 0
CRUK0049 3.61 0.03 (0.01 to 0.08) No LUAD 1 0
CRUK0035 3.31 0.03 (0.01 to 0.08) No LUAD 1 0
CRUK0058 2.76 0.03 (0.01 to 0.07) No LUAD 1 0
CRUK0021 2.70 0.02 (0.01 to 0.07) No LUAD 2 0
CRUK0093 0.73 0.01 (0.001 to 0.03) No LUSC 2 0
CRUK0014 0.90 0.01 (0.002 to 0.03) No LUAD 1 0
Multiplex-PCR NGS
Targeted panel >99% sensitivity at 0.1% VAF and above
Platform sensitivities predicted based on tumor volume and analytical validation data in Extended Data 1
84% sensitivity at 0.05% to 0.1% VAF
46 % sensitivity 0.01% to 0.05% VAF
4.2% sensitivity <0.01%
Generic panel 90% sensitivity at 0.1% VAF and above
Oncomine lung panel sensitivity data reported at https://www.thermofisher.com/order/catalog/product/A31149
Abbosh et al. Page 28
Nature. Author manuscript; available in PMC 2018 February 14.
Europe PM
C Funders A
uthor Manuscripts
Europe PM
C Funders A
uthor Manuscripts

Tab
le 2
c
c) H
otsp
ot S
NV
s no
t ide
ntif
ied
in tu
mor
tiss
ue th
roug
h ex
ome
sequ
enci
ng w
ere
iden
tifie
d in
pla
sma
of 9
of
28 p
atie
nts
by th
e ge
neri
c pa
nel.
Thi
s
sugg
este
d no
n-tu
mor
ori
gin
of c
ell-
free
DN
A, p
latf
orm
non
-spe
cifi
city
or
an e
volv
ing
min
or s
ubcl
one
or s
econ
d pr
imar
y.
Var
iant
s de
tect
ed b
y ge
neri
c PC
R-N
GS
hots
pot p
anel
not
det
ecte
d in
M-S
eq a
naly
sis
of tu
mor
(unf
ilter
ed)
(unf
ilter
ed)
Cas
eG
ene
Loc
atio
nP
osit
ion
Ref
Var
iant
AA
cha
nge
Pla
sma
VA
FD
OR
ctD
NA
pos
itiv
eC
ombi
ned
exom
e V
AF
Ger
mlin
e V
AF
CR
UK
0052
PIK
3CA
chr3
1789
3609
1G
Ap.
E54
5K0.
8160
360
Yes
ND
ND
CR
UK
0052
PIK
3CA
chr3
1789
5208
5A
Gp.
H10
47R
0.12
5232
5Y
es0.
075
ND
CR
UK
0062
PIK
3CA
chr3
1789
3609
1G
Ap.
E54
5K0.
9789
616
Yes
0.01
6N
D
CR
UK
0062
PIK
3CA
chr3
1789
5208
5A
Gp.
H10
47R
0.05
7920
5Y
es0.
005
ND
CR
UK
0062
TP
53ch
r17
7577
556
CA
p.C
242F
0.05
9338
3Y
esN
DN
D
CR
UK
0089
TP
53ch
r17
7577
121
GA
p.R
273C
0.06
5984
9Y
es0.
168
ND
CR
UK
0004
PIK
3CA
chr3
1789
3609
1G
Ap.
E54
5K0.
5973
941
No
0.08
1N
D
CR
UK
0018
PIK
3CA
chr3
1789
3609
1G
Ap.
E54
5K4.
4499
159
No
ND
ND
CR
UK
0018
PIK
3CA
chr3
1789
5208
5A
Gp.
H10
47R
0.81
7780
6N
o0.
044
ND
CR
UK
0021
PIK
3CA
chr3
1789
5208
5A
Gp.
H10
47R
0.11
5010
7N
oN
DN
D
CR
UK
0027
PIK
3CA
chr3
1789
5208
5A
Gp.
H10
47R
0.11
6544
9N
oN
DN
D
CR
UK
0037
PIK
3CA
chr3
1789
5208
5A
Gp.
H10
47R
0.09
5107
1N
oN
DN
D
CR
UK
0058
KR
AS
chr1
225
3982
84C
Ap.
G12
V3.
4463
090
No
0.12
4N
D
ND
- n
on d
etec
ted
DO
R -
dep
th o
f re
adC
ombi
ned
exom
e V
AF
(un
filt
ered
) -
Var
iant
alle
le f
requ
ency
acr
oss
all t
umor
reg
ions
ana
lyse
d (w
ithou
t cal
l filt
ers)
.
Abbosh et al. Page 29
Nature. Author manuscript; available in PMC 2018 February 14.
Europe PM
C Funders A
uthor Manuscripts
Europe PM
C Funders A
uthor Manuscripts

Supplementary Material
Refer to Web version on PubMed Central for supplementary material.
Authors
Christopher Abbosh1,*, Nicolai J. Birkbak1,2,*, Gareth A. Wilson1,2,*, Mariam Jamal-Hanjani1,*, Tudor Constantin3,*, Raheleh Salari3,*, John Le Quesne4,*, David A Moore4,+, Selvaraju Veeriah1,+, Rachel Rosenthal1, Teresa Marafioti1,5, Eser Kirkizlar3, Thomas B K Watkins1,2, Nicholas McGranahan1,2, Sophia Ward1,2,6, Luke Martinson4, Joan Riley4, Francesco Fraioli7, Maise Al Bakir2, Eva Grönroos2, Francisco Zambrana1, Raymondo Endozo7, Wenya Linda Bi8,9, Fiona M. Fennessy8,9, Nicole Sponer3, Diana Johnson1, Joanne Laycock1, Seema Shafi1, Justyna Czyzewska-Khan1, Andrew Rowan2, Tim Chambers2,6, Nik Matthews6,10, Samra Turajlic2,11, Crispin Hiley1,2, Siow Ming Lee12,1, Martin D. Forster1,12, Tanya Ahmad12, Mary Falzon5, Elaine Borg5, David Lawrence13, Martin Hayward13, Shyam Kolvekar13, Nikolaos Panagiotopoulos13, Sam M Janes1,14,15, Ricky Thakrar14, Asia Ahmed16, Fiona Blackhall17,18, Yvonne Summers18, Dina Hafez3, Ashwini Naik3, Apratim Ganguly3, Stephanie Kareht3, Rajesh Shah19, Leena Joseph20, Anne Marie Quinn20, Phil Crosbie21, Babu Naidu22, Gary Middleton23, Gerald Langman24, Simon Trotter24, Marianne Nicolson25, Hardy Remmen26, Keith Kerr27, Mahendran Chetty28, Lesley Gomersall29, Dean Fennell4, Apostolos Nakas30, Sridhar Rathinam30, Girija Anand31, Sajid Khan32,33, Peter Russell34, Veni Ezhil35, Babikir Ismail36, Melanie Irvin-sellers37, Vineet Prakash38, Jason Lester39, Malgorzata Kornaszewska40, Richard Attanoos41, Haydn Adams42, Helen Davies43, Dahmane Oukrif1, Ayse U Akarca1, John A Hartley44, Helen L Lowe44, Sara Lock45, Natasha Iles46, Harriet Bell46, Yenting Ngai46, Greg Elgar2,6, Zoltan Szallasi47,48,49, Roland F Schwarz50, Javier Herrero51, Aengus Stewart52, Sergio A Quezada53, Karl S. Peggs53, Peter Van Loo54,55, Caroline Dive56, Jimmy Lin3, Matthew Rabinowitz3, Hugo JWL Aerts8,9,57, Allan Hackshaw46, Jacqui A Shaw4, Bernhard G. Zimmermann3, and Charles Swanton1,2 on behalf of the TRACERx and PEACE consortia
Affiliations1Cancer Research UK Lung Cancer Centre of Excellence, University College London Cancer Institute, Paul O'Gorman Building, 72 Huntley Street, London, WC1E 6BT
2Translational Cancer Therapeutics Laboratory, The Francis Crick Institute, 1 Midland Rd, London NW1 1AT
3Natera Inc., 201 Industrial Rd., San Carlos, United States, CA 94070
4Cancer Studies, University of Leicester, Leicester, United Kingdom, LE2 7LX
5Department of Pathology, University College London Hospitals, 235 Euston Rd, Fitzrovia, London, United Kingdom, NW1 2BU
Abbosh et al. Page 30
Nature. Author manuscript; available in PMC 2018 February 14.
Europe PM
C Funders A
uthor Manuscripts
Europe PM
C Funders A
uthor Manuscripts

6Advanced Sequencing Facility, The Francis Crick Institute, 1 Midland Rd, London NW1 1AT
7Department of Nuclear Medicine, University College London Hospitals, 235 Euston Rd, Fitzrovia, London, United Kingdom, NW1 2BU
8Brigham and Women’s Hospital, Boston, MA 02115, USA
9Harvard Medical School, Boston, MA 02115, USA
10Tumour Profiling Unit Genomics Facility, The Institute of Cancer Research, 237 Fulham Road, London, SW3 6JB
11Renal and Skin Units, The Royal Marsden Hospital, London, SW3 6JJ
12Department of Oncology, University College London Hospitals, 235 Euston Rd, Fitzrovia, London, United Kingdom, NW1 2BU
13Department of Cardiothoracic Surgery, University College London Hospitals, 235 Euston Rd, Fitzrovia, London, United Kingdom, NW1 2BU
14Department of Respiratory Medicine, University College London Hospitals, 235 Euston Rd, Fitzrovia, London, United Kingdom, NW1 2BU
15Lungs for Living Research Centre, UCL Respiratory, Division of Medicine, Rayne Building. University College London, 5 University Street. London. WC1E 6JF
16Department of Radiology, University College London Hospitals, 235 Euston Rd, Fitzrovia, London, United Kingdom, NW1 2BU
17Institute of Cancer Studies, University of Manchester, Oxford Road, Manchester, M13 9PL
18The Christie Hospital, Manchester, United Kingdom, M20 4BX
19Department of Cardiothoracic Surgery, University Hospital South Manchester, Manchester, M23 9LT
20Department of Pathology, University Hospital South Manchester, Manchester, M23 9LT
21North West Lung Centre, University Hospital South Manchester, Manchester, United Kingdom, M23 9LT
22Department of Thoracic Surgery, Birmingham Heartlands Hospital, Birmingham, United Kingdom, B9 5SS
23Department of Medical Oncology, Birmingham Heartlands Hospital, Birmingham, United Kingdom, B9 5SS
24Department of Cellular Pathology, Birmingham Heartlands Hospital, Birmingham, United Kingdom, B9 5SS
25Department of Medical Oncology, Aberdeen University Medical School & Aberdeen Royal Infirmary, Aberdeen, Scotland, United Kingdom, AB25 2ZN
Abbosh et al. Page 31
Nature. Author manuscript; available in PMC 2018 February 14.
Europe PM
C Funders A
uthor Manuscripts
Europe PM
C Funders A
uthor Manuscripts

26Department of Cardiothoracic Surgery, Aberdeen University Medical School & Aberdeen Royal Infirmary, Aberdeen, United Kingdom, AB25 2ZD
27Department of Pathology, Aberdeen University Medical School & Aberdeen Royal Infirmary, Aberdeen, Scotland, United Kingdom, AB25 2ZD
28Department of Respiratory Medicine, Aberdeen University Medical School & Aberdeen Royal Infirmary, Aberdeen, United Kingdom, AB25 2ZN
29Department of Radiology, Aberdeen University Medical School & Aberdeen Royal Infirmary, Aberdeen, Scotland, United Kingdom, AB25 2ZN
30Department of Thoracic Surgery, Glenfield Hospital, Leicester, LE3 9QP
31Department of Radiotherapy, North Middlesex University Hospital, London N18 1QX
32Department of Respiratory Medicine, Royal Free Hospital, Pond Street, London, NW3 2QG
33Department of Respiratory Medicine, Barnet and Chase Farm Hospitals, Wellhouse Lane, Barnet, United Kingdom, EN5 3DJ
34Department of Respiratory Medicine, The Princess Alexandra Hospital, Hamstel Rd, Harlow CM20 1QX
35Department of Clinical Oncology, St.Luke's Cancer Centre, Royal Surrey County Hospital, Guildford, GU2 7XX
36Department of Pathology, Ashford and St. Peters' Hospital, Guildford Road, Chertsey, Surrey, KT16 0PZ
37Department of Respiratory Medicine, Ashford and St. Peters' Hospital, Guildford Road, Chertsey, Surrey, KT16 0PZ
38Department of Radiology, Ashford and St. Peters' Hospital, Guildford Road, Chertsey, Surrey, KT16 0PZ
39Department of Clinical Oncology, Velindre Hospital, Cardiff, Wales, United Kingdom, CF14 2TL
40Department of Cardiothoracic Surgery, University Hospital Llandough, Cardiff, Wales, United Kingdom, CF64 2XX
41Department of Cellular Pathology, University Hospital of Wales and Cardiff University, Heath Park Cardiff, Wales U.K
42Department of Radiology, University Hospital Llandough, Cardiff, Wales, United Kingdom, CF64 2XX
43Department of Respiratory Medicine, University Hospital Llandough, Cardiff, Wales, United Kingdom, CF64 2XX
44UCL ECMC GCLP Facility, University College London Cancer Institute, Paul O'Gorman Building, 72 Huntley Street, London, WC1E 6BT
Abbosh et al. Page 32
Nature. Author manuscript; available in PMC 2018 February 14.
Europe PM
C Funders A
uthor Manuscripts
Europe PM
C Funders A
uthor Manuscripts

45Department of Respiratory Medicine, The Whittington Hospital NHS Trust, United Kingdom, N19 5NF
46University College London, Cancer Research UK & UCL Cancer Trials Centre, London, United Kingdom, W1T 4TJ
47Centre for Biological Sequence Analysis, Department of Systems Biology, Technical University of Denmark, 2800 Lyngby, Denmark
48Computational Health Informatics Program (CHIP), Boston Children’s Hospital, Harvard Medical School, Boston, MA, USA
49MTA-SE-NAP, Brain Metastasis Research Group, 2nd Department of Pathology, Semmelweis University, 1091 Budapest, Hungary
50Berlin Institute for Medical Systems Biology, Max Delbrueck Center for Molecular Medicine, Berlin, Germany
51Bill Lyons Informatics Centre, University College London Cancer Institute, Paul O'Gorman Building, 72 Huntley Street, London, WC1E 6BT
52Department of Bioinformatics and Biostatistics, The Francis Crick Institute, 1 Midland Rd, London NW1 1AT
53Cancer Immunology Unit, University College London Cancer Institute, Paul O'Gorman Building, 72 Huntley Street, London, WC1E 6BT
54Cancer Genomics Laboratory, The Francis Crick Institute, 1 Midland Rd, London NW1 1AT
55Department of Human Genetics, University of Leuven, B-3000 Leuven, Belgium
56Cancer Research UK Manchester Institute, Manchester, United Kingdom, M20 4BX
57Dana-Farber Cancer Institute, 450 Brookline Ave. Boston, United States, MA 02215-5450
Acknowledgements
We dedicate this manuscript to the memory of Roberto Macina. We thank Samantha Navarro and Antony Tin for facilitating the PEACE ctDNA analysis. We thank the members of the TRACERx and PEACE consortia for participating in this study. C.S. is Royal Society Napier Research Professor. This work is supported by the Francis Crick Institute which receives its core funding from Cancer Research UK (FC001169,FC001202), the UK Medical Research Council (FC001169,FC001202), and the Wellcome Trust (FC001169,FC001202). CS is funded by Cancer Research UK (TRACERx and CRUK Cancer Immunotherapy Catalyst Network), the CRUK Lung Cancer Centre of Excellence, Stand Up 2 Cancer (SU2C), the Rosetrees Trust, NovoNordisk Foundation (ID 16584), the Prostate Cancer Foundation, the Breast Cancer Research Foundation, the European Research Council (THESEUS) and Support was provided to CS by the National Institute for Health Research, the University College London Hospitals Biomedical Research Centre and the Cancer Research UK University College London Experimental Cancer Medicine Centre. P.V.L. is a Winton Group Leader in recognition of the Winton Charitable Foundation’s support towards the establishment of the Francis Crick Institute.
Abbosh et al. Page 33
Nature. Author manuscript; available in PMC 2018 February 14.
Europe PM
C Funders A
uthor Manuscripts
Europe PM
C Funders A
uthor Manuscripts

The TRACERx consortium members and affiliations
The TRACERx (Tracking Non-small Cell Lung Cancer Evolution) study (Clinicaltrials.gov
no: NCT01888601) is sponsored by University College London (UCL/12/0279) and has
been approved by an independent Research Ethics Committee (13/LO/1546). TRACER is
funded by Cancer Research UK (grant number C11496/A17786) and coordinated through
the Cancer Research UK & UCL Cancer Trials Centre.
Charles Swanton1,2,5, Mariam Jamal-Hanjani1, Christopher Abbosh1, Selvaraju Veeriah1,
Seema Shafi1, Justyna Czyzewska-Khan1, Diana Johnson1, Joanne Laycock1, Leticia
Bosshard-Carter1, Gerald Goh1, Rachel Rosenthal1, Pat Gorman1, Nirupa Murugaesu1,
Robert E Hynds1,3, Gareth Wilson1,2, Nicolai J Birkbak1,2, Thomas B K Watkins2, Nicholas
McGranahan1,2, Stuart Horswell2, Maise Al Bakir2, Eva Grönroos2, Richard Mitter2,
Mickael Escudero2, Aengus Stewart2, Peter Van Loo2, Andrew Rowan2, Hang Xu2, Samra
Turajlic2,4, Crispin Hiley2, Jacki Goldman2, Richard Kevin Stone2, Tamara Denner2, Nik
Matthews2, Greg Elgar2, Sophia Ward2, Jennifer Biggs2, Marta Costa2, Sharmin Begum2,
Ben Phillimore2, Tim Chambers2, Emma Nye2, Sofia Graca2, Maise Al Bakir2, Kroopa
Joshi1, Andrew Furness1, Assma Ben Aissa1, Yien Ning Sophia Wong1, Andy Georgiou1,
Sergio Quezada1, John A Hartley1, Helen L Lowe1, Javier Herrero1, David Lawrence5,
Martin Hayward5, Nikolaos Panagiotopoulos5, Shyam Kolvekar5, Mary Falzon5, Elaine
Borg5, Teresa Marafioti5, Celia Simeon5, Gemma Hector5, Amy Smith5, Marie Aranda5,
Marco Novelli5, Dahmane Oukrif1, Ayse U Akarca1, Sam M Janes5, Ricky Thakrar5, Martin
Forster5, Tanya Ahmad5, Siow Ming Lee5, Dionysis Papadatos-Pastos5, Dawn Carnell5,
Ruheena Mendes5, Jeremy George5, Neal Navani5, Asia Ahmed5, Magali Taylor5, Junaid
Choudhary5, Yvonne Summers6, Raffaele Califano6, Paul Taylor6, Rajesh Shah6, Piotr
Krysiak6, Kendadai Rammohan6, Eustace Fontaine6, Richard Booton6, Matthew Evison6,
Phil Crosbie6, Stuart Moss6, Faiza Idries6, Leena Joseph6, Paul Bishop6, Anshuman
Chaturved6, Anne Marie Quinn6, Helen Doran6, Angela leek7, Phil Harrison7, Katrina
Moore7, Rachael Waddington7, Juliette Novasio7, Fiona Blackhall8, Jane Rogan7, Elaine
Smith6, Caroline Dive9, Jonathan Tugwood9, Ged Brady9, Dominic G Rothwell9, Francesca
Chemi9, Jackie Pierce9, Sakshi Gulati9, Babu Naidu10, Gerald Langman10, Simon Trotter10,
Mary Bellamy10, Hollie Bancroft10, Amy Kerr10, Salma Kadiri,10 Joanne Webb10, Gary
Middleton10, Madava Djearaman10, Dean Fennell11, Jacqui A Shaw11, John Le Quesne11,
David Moore11, Anne Thomas11, Harriet Walter11, Joan Riley11, Luke Martinson11,
Apostolos Nakas12, Sridhar Rathinam12, William Monteiro13, Hilary Marshall13, Louise
Nelson12, Jonathan Bennett12, Joan Riley12, Lindsay Primrose12, Luke Martinson12, Girija
Anand14, Sajid Khan15, Anita Amadi16, Marianne Nicolson17, Keith Kerr17, Shirley
Palmer17, Hardy Remmen17, Joy Miller17, Keith Buchan17, Mahendran Chetty17, Lesley
Gomersall17, Jason Lester18, Alison Edwards18, Fiona Morgan19, Haydn Adams19, Helen
Davies19, Malgorzata Kornaszewska20, Richard Attanoos21, Sara Lock22, Azmina Verjee22,
Mairead MacKenzie23, Maggie Wilcox23, Harriet Bell24, Natasha Iles24, Allan Hackshaw24,
Yenting Ngai24, Sean Smith24, Nicole Gower24, Christian Ottensmeier25, Serena Chee25,
Benjamin Johnson25, Aiman Alzetani25, Emily Shaw25, Eric Lim26, Paulo De Sousa26,
Monica Tavares Barbosa26, Alex Bowman26, Simon Jordan26, Alexandra Rice26, Hilgardt
Raubenheimer26, Chiara Proli26, Maria Elena Cufari26, John Carlo Ronquillo26, Angela
Abbosh et al. Page 34
Nature. Author manuscript; available in PMC 2018 February 14.
Europe PM
C Funders A
uthor Manuscripts
Europe PM
C Funders A
uthor Manuscripts

Kwayie26, Harshil Bhayani26, Morag Hamilton26, Yusura Bakar26, Natalie Mensah26, Lyn
Ambrose26, Anand Devaraj26, Silviu Buderi26, Jonathan Finch26, Leire Azcarate26, Hema
Chavan26, Sophie Green26, Hillaria Mashinga26, Andrew G Nicholson26, 27, Kelvin Lau28,
Michael Sheaff28, Peter Schmid28, John Conibear28, Veni Ezhil29, Babikir Ismail29, Melanie
Irvin-sellers29, Vineet Prakash29, Peter Russell30, Teresa Light30, Tracey Horey30, Sarah
Danson31, Jonathan Bury31, John Edwards31, Jennifer Hill31, Sue Matthews31, Yota
Kitsanta31, Kim Suvarna31, Patricia Fisher31, Allah Dino Keerio31, Michael Shackcloth32,
John Gosney32, Pieter Postmus32, Sarah Feeney32, Julius Asante-Siaw32, Tudor Constatin33,
Raheleh Salari33, Nicole Sponer33, Ashwini Naik33, Bernhard Zimmermann33, Matthew
Rabinowitz33, Hugo J.W.L. Aerts34, Stefan Dentro35, Christophe Dessimoz36,37,38.
Affiliations
1. Cancer Research UK Lung Cancer Centre of Excellence, University College London
Cancer Institute, United Kingdom
2. The Francis Crick Institute, United Kingdom
3. Lungs for Living, UCL Respiratory, University College London, United Kingdom
4. The Royal Marsden Hospital, United Kingdom
5. University College London Hospitals NHS Foundation Trust, United Kingdom
6. University Hospital of South Manchester, United Kingdom
7. Manchester Cancer Research Centre Biobank, United Kingdom
8. Christie NHS Foundation Trust, Manchester, United Kingdom
9. Cancer Research UK Manchester Institute, United Kingdom
10. Heart of England NHS Foundation Trust, Birmingham, United Kingdom
11. Cancer Studies and Molecular Medicine, University of Leicester, United kingdom
12. Leicester University Hospitals, United Kingdom
13. National Institute for Health Research Leicester Respiratory Biomedical, Research Unit,
United Kingdom
14. North Middlesex Hospital, United Kingdom
15. Royal Free Hospital, United Kingdom
16. Barnet Hospital, United Kingdom
17. Aberdeen Royal Infirmary, United Kingdom
18. Velindre Cancer Centre, Cardiff, Wales, United Kingdom
Abbosh et al. Page 35
Nature. Author manuscript; available in PMC 2018 February 14.
Europe PM
C Funders A
uthor Manuscripts
Europe PM
C Funders A
uthor Manuscripts

19. Cardiff & Vale University Health Board, Cardiff, Wales, United Kingdom
20. University Hospital Of Wales Heath Park, Cardiff, Wales, United Kingdom
21. Department of Pathology, University Hospital of Wales and Cardiff University, Heath
Park, Cardiff, Wales, United Kingdom
22. The Whittington Hospital NHS Trust, United Kingdom
23. Independent Cancer Patients Voice, United Kingdom
24. Cancer Research UK & UCL Cancer Trials Centre, United Kingdom
25. University Hospital Southampton NHS Foundation Trust, United Kingdom
26. Royal Brompton and Harefield NHS Foundation Trust, United Kingdom
27. National Heart and Lung Institute, Imperial College, United Kingdom
28. Barts Health NHS Trust, United Kingdom
29. Ashford and St. Peter's Hospitals NHS Foundation Trust, United Kingdom
30. The Princess Alexandra Hospital NHS Trust, United Kingdom
31. Sheffield Teaching Hospitals NHS Foundation Trust, United Kingdom
32. Liverpool Heart and Chest Hospital NHS Foundation Trust, United Kingdom
33. Natera Inc., 201 Industrial Road, Suite 410, San Carlos, CA 94070
34. Dana-Farber Cancer Institute, Brigham & Women’s Hospital, Harvard Medical School,
450 Brookline Ave, JF518, Boston, MA 02115-5450, USA
35. Wellcome Trust Sanger Institute, Hinxton, CB10 1SA, United Kingdom
36. Bioinformatics Group, Department of Computer Science, University College London
37. University of Lausanne
38. Swiss Institute of Bioinformatics
The PEACE consortium members and affiliations
The PEACE (Posthumous Evaluation of Advanced Cancer Environment) Study
(Clinicaltrials.gov no: NCT03004755), is sponsored by University College London (UCL/
13/0165) has been approved by an independent Research Ethics Committee (13/LO/0972).
PEACE is funded by Cancer Research UK (C416/A21999) and coordinated through the
Cancer Research UK & UCL Cancer Trials Centre.
Abbosh et al. Page 36
Nature. Author manuscript; available in PMC 2018 February 14.
Europe PM
C Funders A
uthor Manuscripts
Europe PM
C Funders A
uthor Manuscripts

Charles Swanton1,2,3, Mariam Jamal-Hanjani1,2,3, Christopher Abbosh1,2,3, Kai-Keen Shiu3,
John Bridgewater3, Daniel Hochauser1,3, Peter Van Loo2, Sergio Quezada1, Stephan Beck1,
Peter Parker2, Henning Walczak1, Tariq Enver1, Mary Falzon3, Ian Proctor3, Ron Sinclair3,
Chi-wah Lok3, Marco Novelli3, Teresa Marafioti3, Elaine Borg3, Miriam Mitchison3,
Giorgia Trevisan3, Mark Lynch3, Sebastian Brandner3, Faye Gishen23, Adrian
Tookman23,24, Paddy Stone3, Caroline Sterling3, James Larkin4,5, Samra Turajlic2,4,5, Gert
Attard4,5, Ros Eeles4,5, Chris Foster4,5, Steve Bova25, Andrea Sottoriva4,5, Simon
Chowdhury6, Chandra Ashish6, James Spicer6, Mark Stares1,2,3, Joanna Lynch4,6, Carlos
Caldas18,19, James Brenton18, Rebecca Fitzgerald20, Merche Jimenez-Linan7, Elena
Provenzano7, Alison Cluroe7, Grant Stewart26, Colin Watts7, Richard Gilbertson19, Ultan
McDermott7,8, Simon Tavare27, Tim Maughan28, Ian Tomlinson21, Peter Campbell8, Iain
McNeish17, Andrew Biankin17, Antony Chambers17, Sioban Fraser17, Karin Oien17,Matt
Krebs9, Fiona Blackhall10, Yvonne Summers10, Caroline Dive9, Richard Marais9, Louise
Carter10, Daisuke Nonaka10, Anne Marie Quinn10, Nathalie Dhomen9, Dean Fennell11, John
Le Quesne11, David Moore11, Jacqui Shaw11, Babu Naidu12, Shobhit Baijal12, Bruce
Tanchel12, Gerald Langman12, Martin Collard12, Peter Cockcroft12, Joanne Taylor12, Hollie
Bancroft12, Amy Kerr12, Gary Middleton12, Joanne Webb12, Salma Kadiri12, Dr Peter
Colloby12, Bernard Olisemeke12, Rodelaine Wilson12, Christian Ottensmeier22, David
Harrison29, Massimo Loda13, Adreinne Flanagan14, Maggie Wilcox15, Mairead
McKenzie15, Allan Hackshaw16, Jonathan Lederman16, Abby Sharp16, Laura Farrelly16
Affiliations
1. Cancer Research UK Lung Cancer Centre of Excellence, University College London
Cancer Institute, United Kingdom
2. The Francis Crick Institute, United Kingdom
3. University College London Hospitals NHS Foundation Trust, United Kingdom
4. The Royal Marsden Hospital, United Kingdom
5. The Institute of Cancer Research, London, United Kingdom
6. Guy’s and St Thomas’, NHS Foundation Trust, London, United Kingdom
7. Addenbrooke’s Hospital, NHS Foundation Trust, Cambridge, United Kingdom
8. Wellcome Trust Sanger Institute, Hinxton, United Kingdom
9. Cancer Research UK Manchester Institute, United Kingdom
10. Christie NHS Foundation Trust, Manchester, United Kingdom
11. Leicester University Hospitals, United Kingdom
12. Heart of England NHS Foundation Trust, Birmingham, United Kingdom
13. Division of Cancer Studies, King’s College London, United Kingdom
Abbosh et al. Page 37
Nature. Author manuscript; available in PMC 2018 February 14.
Europe PM
C Funders A
uthor Manuscripts
Europe PM
C Funders A
uthor Manuscripts

14. Royal National Orthopaedic Hospital, NHS Foundation Trust, London, United Kingdom
15. Independent Cancer Patients’ Voice, London, United Kingdom
16. Cancer Research UK & UCL Cancer Trials Centre, United Kingdom
17. Wolfson Wohl Cancer Research Centre, University of Glasgow
18. Cancer Research UK Cambridge Centre, Cambridge, United Kingdom
19. Department of Oncology, University of Cambridge, Cambridge, United Kingdom
20. Medical Research Council (MRC) Cancer Unit, Hutchison-MRC Research Centre and
University of Cambridge, Cambridge, United Kingdom
21. Wellcome Trust Centre for Human Genetics, University of Oxford, Oxford, United
Kingdom
22. University of Southampton and Southampton University Hospitals, Southampton
23. Royal Free Hospital, London, United Kingdom
24. Marie Curie Hospice, Hampstead, United Kingdom
25. Prostate Cancer Research Centre, University of Tampere, Finland
26. Department of Surgery, University of Cambridge, Cambridge, United Kingdom
27. Cancer Research UK Cambridge Institute, University of Cambridge, Cambridge, United
Kingdom
28. Cancer Research UK/ Medical Research Council Oxford Institute for Radiation
Oncology, Department of Oncology, University of Oxford, Oxford, United Kingdom
29. University of St Andrews, Fife, United Kingdom
References
1. Jemal A, Bray F, Center MM, Ferlay J, Ward E, Forman D. Global cancer statistics. CA: A Cancer Journal for Clinicians. 2011; 61(2):69–90. [PubMed: 21296855]
2. Siegel RL, Miller KD, Jemal A. Cancer statistics, 2017. CA: A Cancer Journal for Clinicians. 2017; 67(1):7–30. [PubMed: 28055103]
3. Pignon J-P, Tribodet H, Scagliotti GV, Douillard J-Y, Shepherd FA, Stephens RJ, et al. Lung Adjuvant Cisplatin Evaluation: A Pooled Analysis by the LACE Collaborative Group. Journal of Clinical Oncology. 2008; 26(21):3552–9. [PubMed: 18506026]
4. Landau Dan A, Carter Scott L, Stojanov P, McKenna A, Stevenson K, Lawrence Michael S, et al. Evolution and Impact of Subclonal Mutations in Chronic Lymphocytic Leukemia. Cell. 152(4):714–26.
5. Beaver JA, Jelovac D, Balukrishna S, Cochran RL, Croessmann S, Zabransky DJ, et al. Detection of Cancer DNA in Plasma of Patients with Early-Stage Breast Cancer. Clinical Cancer Research. 2014; 20(10):2643–50. [PubMed: 24504125]
Abbosh et al. Page 38
Nature. Author manuscript; available in PMC 2018 February 14.
Europe PM
C Funders A
uthor Manuscripts
Europe PM
C Funders A
uthor Manuscripts

6. Garcia-Murillas I, Schiavon G, Weigelt B, Ng C, Hrebien S, Cutts RJ, et al. Mutation tracking in circulating tumor DNA predicts relapse in early breast cancer. Science Translational Medicine. 2015; 7(302):302ra133–302ra133.
7. Tie J, Wang Y, Tomasetti C, Li L, Springer S, Kinde I, et al. Circulating tumor DNA analysis detects minimal residual disease and predicts recurrence in patients with stage II colon cancer. Science Translational Medicine. 2016; 8(346):346ra92–ra92.
8. Jamal-Hanjani M, Hackshaw A, Ngai Y, Shaw J, Dive C, Quezada S, et al. Tracking genomic cancer evolution for precision medicine: the lung TRACERx study. PLoS Biol. 2014; 12(7):e1001906. [PubMed: 25003521]
9. Jamal-Hanjani M. TRACERx – Tracking Non-Small Cell Lung Cancer Evolution. New England Journal of Medicine. 2017 (accepted, in press).
10. Jamal-Hanjani M, Wilson GA, Horswell S, Mitter R, Sakarya O, Constantin T, et al. Detection of ubiquitous and heterogeneous mutations in cell-free DNA from patients with early-stage non-small-cell lung cancer. Annals of Oncology. 2016; 27(5):862–7. [PubMed: 26823523]
11. D LA Jr, Bardelli A. Liquid Biopsies: Genotyping Circulating Tumor DNA. Journal of Clinical Oncology. 2014; 32(6):579–86. [PubMed: 24449238]
12. Caruso R, Parisi A, Bonanno A, Paparo D, Quattrocchi E, Branca G, et al. Histologic coagulative tumour necrosis as a prognostic indicator of aggressiveness in renal, lung, thyroid and colorectal carcinomas: A brief review. Oncology Letters. 2012; 3(1):16–8. [PubMed: 22740848]
13. Vesselle H, Schmidt RA, Pugsley JM, Li M, Kohlmyer SG, Vallières E, et al. Lung Cancer Proliferation Correlates with [F-18]Fluorodeoxyglucose Uptake by Positron Emission Tomography. Clinical Cancer Research. 2000; 6(10):3837–44. [PubMed: 11051227]
14. Higashi K, Ueda Y, Yagishita M, Arisaka Y. FDG PET measurement of the proliferative potential of non-small cell lung cancer. The Journal of Nuclear Medicine. 2000; 41(1):85. [PubMed: 10647609]
15. Murtaza M, Dawson S-J, Pogrebniak K, Rueda OM, Provenzano E, Grant J, et al. Multifocal clonal evolution characterized using circulating tumour DNA in a case of metastatic breast cancer. Nature Communications. 2015; 6:8760.
16. Newman AM, Bratman SV, To J, Wynne JF, Eclov NCW, Modlin LA, et al. An ultrasensitive method for quantitating circulating tumor DNA with broad patient coverage. Nat Med. 2014; 20(5):548–54. [PubMed: 24705333]
17. Del Monte U. Does the cell number 109 still really fit one gram of tumor tissue? Cell Cycle. 2009; 8(3):505–6. [PubMed: 19176997]
18. Peters S, Zimmermann S. Targeted therapy in NSCLC driven by HER2 insertions. Translational Lung Cancer Research. 2014; 3(2):84–8. [PubMed: 25806285]
19. Livasy CA, Karaca G, Nanda R, Tretiakova MS, Olopade OI, Moore DT, et al. Phenotypic evaluation of the basal-like subtype of invasive breast carcinoma. Mod Pathol. 2005; 19(2):264–71.
20. Keam B, Im S-A, Kim H-J, Oh D-Y, Kim JH, Lee S-H, et al. Prognostic impact of clinicopathologic parameters in stage II/III breast cancer treated with neoadjuvant docetaxel and doxorubicin chemotherapy: paradoxical features of the triple negative breast cancer. BMC Cancer. 2007; 7:203. [PubMed: 17976237]
21. Rhee J, Han SW, Oh DY, Kim JH, Im SA, Han W, et al. The clinicopathologic characteristics and prognostic significance of triple-negativity in node-negative breast cancer. BMC Cancer. 2008; 8:307. [PubMed: 18947390]
22. Team TNLSTR. Reduced Lung-Cancer Mortality with Low-Dose Computed Tomographic Screening. New England Journal of Medicine. 2011; 365(5):395–409. [PubMed: 21714641]
23. Newman AM, Lovejoy AF, Klass DM, Kurtz DM, Chabon JJ, Scherer F, et al. Integrated digital error suppression for improved detection of circulating tumor DNA. Nat Biotech. 2016; 34(5):547–55.
24. Hofheinz F, Butof R, Apostolova I, Zophel K, Steffen IG, Amthauer H, et al. An investigation of the relation between tumor-to-liver ratio (TLR) and tumor-to-blood standard uptake ratio (SUR) in oncological FDG PET. EJNMMI Res. 2016; 6(1):19. [PubMed: 26936768]
Abbosh et al. Page 39
Nature. Author manuscript; available in PMC 2018 February 14.
Europe PM
C Funders A
uthor Manuscripts
Europe PM
C Funders A
uthor Manuscripts
25. Butof R, Hofheinz F, Zophel K, Stadelmann T, Schmollack J, Jentsch C, et al. Prognostic Value of Pretherapeutic Tumor-to-Blood Standardized Uptake Ratio in Patients with Esophageal Carcinoma. J Nucl Med. 2015; 56(8):1150–6. [PubMed: 26089549]
26. Malikic S, McPherson AW, Donmez N, Sahinalp CS. Clonality inference in multiple tumor samples using phylogeny. Bioinformatics. 2015; 31(9):1349–56. [PubMed: 25568283]
27. Lappalainen I, Almeida-King J, Kumanduri V, Senf A, Spalding JD, Ur-Rehman S, et al. The European Genome-phenome Archive of human data consented for biomedical research. Nat Genet. 2015; 47(7):692–5. [PubMed: 26111507]
Abbosh et al. Page 40
Nature. Author manuscript; available in PMC 2018 February 14.
Europe PM
C Funders A
uthor Manuscripts
Europe PM
C Funders A
uthor Manuscripts

Figure 1. Phylogenetic ctDNA trackingOverview of the study methodology. Multi-region sequencing of NSCLC was performed as
part of the TRACERx study. PCR assay-panels were designed based on phylogenetic
analysis, targeting clonal and subclonal single nucleotide variants to facilitate non-invasive
tracking of the patient-specific tumor phylogeny. Assay-panels were combined into
multiplex assay-pools containing primers from up to 10 patients. Cell-free DNA was
extracted from pre- and post-operative plasma samples and multiplex-PCR performed,
followed by sequencing of amplicons. Findings were integrated with M-Seq exome data to
track tumor evolution.
Abbosh et al. Page 41
Nature. Author manuscript; available in PMC 2018 February 14.
Europe PM
C Funders A
uthor Manuscripts
Europe PM
C Funders A
uthor Manuscripts

Figure 2. Clinicopathological predictors of ctDNA detectiona) Heatmap showing clinicopathological and ctDNA detection data, continuous variables
quartiled. Raw data and patient IDs in attached worksheet. b) Detection of clonal and
subclonal single nucleotide variants within 46 patients with two or more single nucleotide
variants detected in plasma. Histology indicated in panels as LUSC, LUAD and Other.
Abbosh et al. Page 42
Nature. Author manuscript; available in PMC 2018 February 14.
Europe PM
C Funders A
uthor Manuscripts
Europe PM
C Funders A
uthor Manuscripts

Figure 3. Tumor volume predicts plasma variant allele frequencya) Tumor volume (cm3) measured by CT volumetric analysis correlates with mean clonal
plasma VAF, n=37, grey vertical lines represent range of clonal VAF, red shading indicates
95% confidence intervals. b) Predicted mean clonal VAF at hypothetical volumes ranging
from 1 to 100cm3 based on model in panel a, predicted cancer cell number based on model
in extended data 4e. c) Estimated effective subclone size, defined as mean CCF of subclone
multiplied by tumor volume and purity, influences subclonal SNV detection. For negative
calls, median effective subclone size was 1.70 cm3, range= 0.21-24.11, n=163, for positive
calls, median effective subclone size = 4.06 cm3, range = 0.31 – 49.20, n=109. Wilcoxon
rank sum test, P<0.001, data from 34 patients (passed volumetric filters with subclonal
SNVs represented in assay-panel). d) Estimated effective subclone size correlates with
subclonal plasma VAF, n=109 subclonal SNVs, data from 34 patients (passed volumetric
filters with detected subclonal SNVs in plasma).
Abbosh et al. Page 43
Nature. Author manuscript; available in PMC 2018 February 14.
Europe PM
C Funders A
uthor Manuscripts
Europe PM
C Funders A
uthor Manuscripts

Figure 4. Post-operative ctDNA detection predicts and characterizes NSCLC relapsea-h) Longitudinal cell-free DNA profiling. Circulating tumor DNA (ctDNA) detection in
plasma was defined as the detection of two tumor-specific SNVs. Detected clonal (circles,
light blue) and subclonal (triangles, colors indicates different subclones) SNVs from each
patient-specific assay-panel are plotted on graphs colored by M-Seq derived tumor
phylogenetic nodes. Mean clonal (blue) and mean subclonal (red) plasma VAF are indicated
on graphs as connected lines. Pre-operative and relapse M-Seq derived phylogenetic trees
represented by ctDNA are illustrated above each graph.
Abbosh et al. Page 44
Nature. Author manuscript; available in PMC 2018 February 14.
Europe PM
C Funders A
uthor Manuscripts
Europe PM
C Funders A
uthor Manuscripts
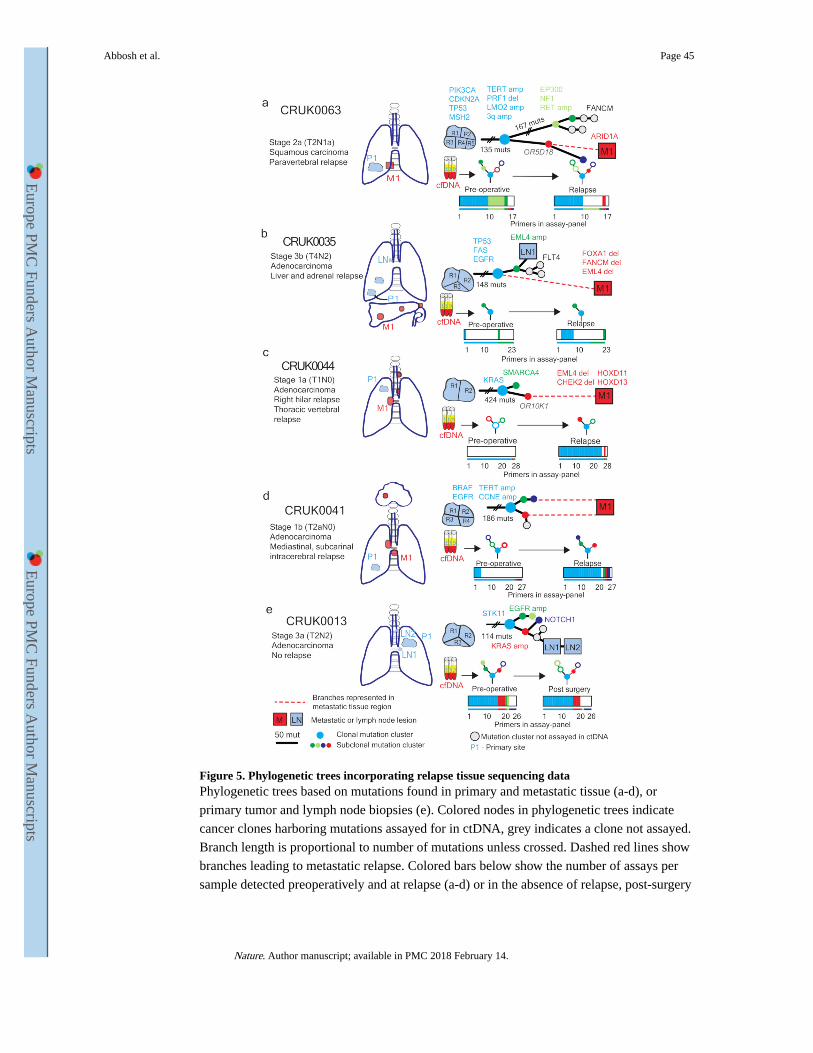
Figure 5. Phylogenetic trees incorporating relapse tissue sequencing dataPhylogenetic trees based on mutations found in primary and metastatic tissue (a-d), or
primary tumor and lymph node biopsies (e). Colored nodes in phylogenetic trees indicate
cancer clones harboring mutations assayed for in ctDNA, grey indicates a clone not assayed.
Branch length is proportional to number of mutations unless crossed. Dashed red lines show
branches leading to metastatic relapse. Colored bars below show the number of assays per
sample detected preoperatively and at relapse (a-d) or in the absence of relapse, post-surgery
Abbosh et al. Page 45
Nature. Author manuscript; available in PMC 2018 February 14.
Europe PM
C Funders A
uthor Manuscripts
Europe PM
C Funders A
uthor Manuscripts

(e). Thin colored bar shows number of assays in total. Colors match clones on the
phylogenetic trees.
Abbosh et al. Page 46
Nature. Author manuscript; available in PMC 2018 February 14.
Europe PM
C Funders A
uthor Manuscripts
Europe PM
C Funders A
uthor Manuscripts

Figure 6. ctDNA tracking of lethal cancer subclones in CRUK0063Phylogenetic analysis of one relapse biopsy (day 467) and five metastatic biopsies (post
mortem) a) To-scale phylogenetic tree of CRUK0063 including M-seq based on metastatic
and primary tumor regions. Branch length is proportional to number of mutations in each
subclone. b) Phylogenetic trees matching metastatic lesions, colored nodes represent
mutation clusters found at each site and assayed for in ctDNA. Open circles represent
mutation clusters not detected in ctDNA. c) Tracking plot showing mean VAF of identified
mutation clusters in ctDNA. Size of dots indicates number of assays detected. Colors
correspond to mutation clusters and match panels a) and b).
Abbosh et al. Page 47
Nature. Author manuscript; available in PMC 2018 February 14.
Europe PM
C Funders A
uthor Manuscripts
Europe PM
C Funders A
uthor Manuscripts