physical activity and fitness - centers for disease ... · improve health, fitness, ... the...
TRANSCRIPT

Physical Activity and Fitness
CHAPTER 22
Co-Lead AgenciesCenters for Disease Control and PreventionPresident’s Council on Physical Fitness and Sports
ContentsGoal ................................................................................................22-3Highlights ......................................................................................22-3Summary of Progress .....................................................................22-3Transition to Healthy People 2020 ................................................22-4Data Considerations .......................................................................22-5References and Notes .....................................................................22-5Comprehensive Summary of Objectives ........................................22-7Progress Chart ................................................................................22-8Health Disparities Table ...............................................................22-10No Leisure-Time Physical Activity Among Adults, 2008—Map ....22-12


GOAL: Improve health, fitness, and quality of life through daily physical activity.
This chapter includes objectives that track participation in physical activities, access to physical activity and fitness programs, and the availability of physical activity facilities at schools and worksites.
All Healthy People tracking data quoted in this chapter, along with technical information and Operational Definitions can be found in the Healthy People 2010 database, DATA2010, available from http://wonder.cdc.gov/data2010/.
More information about this Focus Area can be found in the following publications:
⟩ Healthy People 2010: Understanding and Improving Health, available from http://www.healthypeople.gov/2010/Document/tableofcontents.htm#under.
⟩ Healthy People 2010 Midcourse Review, available from http://www.healthypeople.gov/2010/data/midcourse/html/default.htm#FocusAreas.
Highlights ⟩ Substantial progress was achieved in objectives for
this Focus Area during the past decade. About 70% of the Physical Activity and Fitness objectives with data to measure progress moved toward their Healthy People 2010 targets (Figure 22-1) [1]. However, almost all objectives in this Focus Area exhibited statistically significant health disparities among select populations [2]. These disparities ranged from 10% to 49% in magnitude, with the exception of two objectives (discussed below) which displayed statistically significant disparities of 50% or more (Figure 22-2).
⟩ Television viewing by students in grades 9–12 (objective 22-11) declined. The percentage of students who watched television for 2 or fewer hours a day increased 17.5% between 1999 and 2009, from 57% to
22 • PHYSICAL ACTIVITY AND FITNESS
67%, moving toward the Healthy People 2010 target of 75%. Disparities were observed for a number of population groups, for example:
�� Among racial and ethnic groups, non-Hispanic white students had the highest (best) rate of television viewing for 2 or fewer hours a day, 75% in 2009, whereas Hispanic or Latino students and non-Hispanic black students had rates of 58% and 44%, respectively. When expressed as viewing television for more than 2 hours a day, the rate for Hispanic or Latino students was more than one and a half times the rate for non-Hispanic white students. The rate for non-Hispanic black students was more than twice the non-Hispanic white rate.
⟩ The proportion of adults who did not participate in any form of leisure-time physical activity (objective 22-1) decreased 9% between 1997 and 2008, from 40% to 36%, moving toward the 2010 target of 20%.
�� Among education groups, persons with at least some college education had the lowest (best) rate of no leisure-time physical activity, 27% in 2008. Persons with less than a high school education had a rate of 59%, more than twice the best group rate.
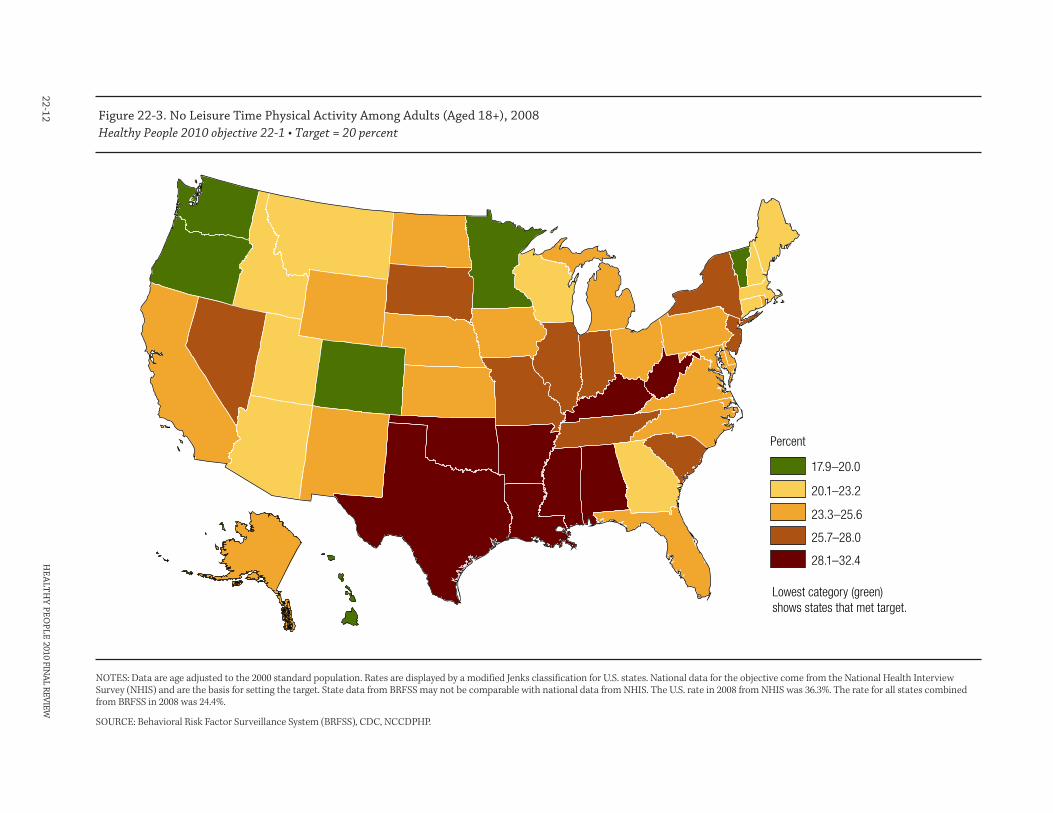
⟩ Participation in leisure-time physical activity varied by geographic region. Colorado, Minnesota, Oregon, Vermont, and Washington had the lowest rates of non participation in 2008. These states achieved the Healthy People 2010 target. Kentucky, West Virginia, and a contiguous group of southern states (Alabama, Arkansas, Louisiana, Mississippi, Oklahoma, and Texas) had the highest rates (Figure 22-3).
Summary of Progress ⟩ Figure 22-1 presents a quantitative assessment
of progress in achieving the Healthy People 2010 objectives for Physical Activity and Fitness [1]. Data
22-3

to measure progress toward target attainment were available for 17 objectives.
�� None of the objectives in this Focus Area achieved the Healthy People 2010 targets.
�� Twelve objectives moved toward their targets. A statistically significant difference between the baseline and the final data points was observed for five of these objectives (22-1, 22-4, 22-11, and 22-14a and b). No significant differences were observed for seven objectives (22-3, 22-5 through 22-7, 22-8a, 22-9, and 22-10).
�� One objective showed no change (objective 22-2).
�� Four objectives moved away from their targets. A statistically significant difference between the baseline and final data point was observed for two objectives (22-8b and 22-15a). No significant differences were observed for the other two objectives (22-12 and 22-15b).
⟩ Data were unavailable to measure progress for one objective (22-13); this objective had baseline data only.
⟩ Figure 22-2 displays health disparities in Physical Activity and Fitness from the best group rate for each characteristic at the most recent data point [2]. It also displays changes in disparities from baseline to the most recent data point [3].
�� Of the 10 objectives with statistically significant health disparities of 10% or more among racial and ethnic populations, the non-Hispanic white population had the best rate for 7 objectives (22-1 through 22-4, 22-6, 22-7, and 22-11); the Hispanic or Latino population had the best rate for 2 objectives (22-9 and 22-10); and persons of 2 or more races had the best rate for 1 objective (22-5).
�� Health disparities of 100% or more were observed for one objective (22-11, student television viewing); see Highlights, above.
�� Males had better rates than females for the four objectives with statistically significant health disparities of 10% or more by sex (objectives 22-1, 22-4, 22-7, and 22-10).
�� Persons with at least some college education had the best rates for five of the six objectives with statistically significant health disparities of 10% or more by education level (objectives 22-1 through 22-4, and 22-5). Persons with less than a high school education had the best rate for one objective (22-14a).
�� Residents of urban or metropolitan areas had better rates than residents of rural areas for the three objectives with statistically significant health disparities of 10% or more by geographic location (objectives 22-1, and 22-14a and b).
�� Persons without disabilities had better rates than
22-4
persons with disabilities for the four objectives with statistically significant health disparities of 10% or more by disability status (objectives 22-1 through 22-4).
Transition to Healthy People 2020For Healthy People 2020, the focus of the Physical Activity objectives has been expanded to include a broader range of activities than those included in Healthy People 2010. The Healthy People 2010 Focus Area name was changed from “Physical Activity and Fitness” to “Physical Activity” to be consistent with 2008 Physical Activity Guidelines for Americans [4]. With the exception of muscle strengthening, the objectives primarily assess aerobic physical activity behaviors and the environments and policies that support being physically active. See HealthyPeople.gov for a complete list of Healthy People 2020 topics and objectives.
The Healthy People 2020 Physical Activity Topic Area objectives can be grouped into several sections:
⟩ Aerobic physical activity and muscular-strengthening activity in adults
⟩ Aerobic physical activity and muscular-strengthening activity in children and adolescents
⟩ Physical education and school recess
⟩ Access to school physical activity facilities
⟩ Environmental policies enhancing physical activity opportunities
⟩ Physical activity policies in child care setting
⟩ Physical counseling related to physical activity.
The differences between the Healthy People 2010 and Healthy People 2020 objectives are summarized below:
⟩ The Healthy People 2020 Physical Activity Topic Area has a total of 36 objectives, 10 of which are developmental, whereas the Healthy People 2010 Physical Activity and Fitness Focus Area had 18 objectives [5].
⟩ Five Healthy People 2010 objectives, including no leisure-time physical activity (objective 22-1), physical education requirement (objectives 22-8a and b), participation in daily physical education in schools (objective 22-9), and access to physical activities in school facilities (objective 22-12), were retained “as is” [6].
HEALTHY PEOPLE 2010 FINAL REVIEW

⟩ Six Healthy People 2010 objectives were modified (objectives 22-2 through 22-4, 22-6, 22-7, and 22-11) [7]. These physical activity and muscle strengthening activity in adults and adolescents objectives were changed to reflect 2008 Federal Physical Activity Guidelines recommendations.
⟩ Five objectives addressing worksite physical activity programs (objective 22-13), and walking and bicycling for transportation (objectives 22-14a and b, and 22-15a and b), were returned to developmental status due to a lack of baseline data [5].
⟩ Two objectives were archived [8]. The flexibility objective (22-5) was archived due to a change in the physical activity guideline recommendations. The physical activity in physical education class measure (objective 22-10) was archived because it lacked a national data source.
⟩ The objective that tracks physician counseling about physical activity (objective 1-3a) was moved from Healthy People 2010 Focus Area “Access to Quality Health Services” into the Healthy People 2020 Physical Activity Topic Area and modified to include two objectives on physician counseling or education related to exercise.
⟩ Seventeen new objectives were added to the Healthy People 2020 Physical Activity Topic Area:
�� Seven new objectives address physical activity programs for children and adolescents: time for recess, regularly scheduled school recess, daily physical education in elementary schools, and physical activity policies in child care settings.
�� The television viewing objective (22-11) was expanded to include seven new objectives of other types of screen time such as computer use, video and computer games among children and adolescents aged under 17 years.
�� Three new Healthy People 2020 environment objectives include measures to track legislative policies that enhance access and availability of physical activity opportunities.
Appendix D, “A Crosswalk Between Objectives From Healthy People 2010 to Healthy People 2020,” summa-rizes the changes between the two decades of objectives, reflecting new knowledge and direction for this area.
Data ConsiderationsFigure 22-3 (no leisure-time physical activity among adults) presents State-level data from the Behavioral Risk Factor Surveillance System (BRFSS). National data for this objective comes from the National Health
22 • PHYSICAL ACTIVITY AND FITNESS
Interview Survey (NHIS) and is the basis for setting the target. BRFSS data may not be comparable with the national data from NHIS.
In general, data on educational attainment are presented for persons 25 and over, consistent with guidance given by the Census Bureau. However, because of the requirements of the different data systems, the age groups used to calculate educational attainment for any specific objective may differ from the age groups used to report the data for other Healthy People 2010 objectives, as well as from select populations within the same objective. Therefore, the reader is urged to exercise caution in interpreting the data by educational attainment shown in the Health Disparities Table. See Healthy People 2010: General Data Issues, referenced below.
Additional information on data issues is available from the following sources:
⟩ All Healthy People 2010 tracking data can be found in the Healthy People 2010 database, DATA2010, available from http://wonder.cdc.gov/data2010/.
⟩ Detailed information about the data and data sources used to support these objectives can be found in the Operational Definitions on the DATA 2010 website, available from http://wonder.cdc.gov/data2010/focusod.htm.
⟩ More information on statistical issues related to Healthy People tracking and measurement can be found in the Technical Appendix and in Healthy People 2010: General Data Issues, which is available in the General Data Issues section of the NCHS Healthy People website under Healthy People 2010; see http://www.cdc.gov/nchs/healthy_people/hp2010/hp2010_data_issues.htm.
References and Notes
1. Displayed in the Progress Chart (Figure 22-1), the percent of targeted change achieved expresses the difference between the baseline and the final value relative to the initial difference between the baseline and the Healthy People 2010 target. As such, it is a relative measure of progress toward attaining the Healthy People 2010 target. See the Reader’s Guide for more information. When standard errors were available, the difference between the baseline and the final value was tested at the 0.05 level of significance. See the Figure 22-1 footnotes, as well as the Technical Appendix, for more detail.
2. Information about disparities among select populations is shown in the Health Disparities Table
22-5
(Figure 22-2). Disparity from the best group rate is defined as the percent difference between the best group rate and each of the other group rates for a characteristic. For example, racial and ethnic health disparities are measured as the percent difference between the best racial and ethnic group rate and each of the other racial and ethnic group rates. Similarly, disparities by sex are measured as the percent difference between the better group rate (e.g., female) and the rate for the other group (e.g., male). Some objectives are expressed in terms of favorable events or conditions that are to be increased, while others are expressed in terms of adverse events or conditions that are to be reduced. To facilitate comparison of health disparities across different objectives, disparity is measured only in terms of adverse events or conditions. For comparability across objectives, objectives that are expressed in terms of favorable events or conditions are re-expressed using the adverse event or condition for the purpose of computing disparity, but they are not otherwise restated or changed. For example, objective 1-1, to increase the proportion of persons with health insurance (e.g., 72% of the American Indian or Alaska Native population under age 65 had some form of health insurance in 2008), is expressed in terms of the percentage of persons without health insurance (e.g., 100% – 72% = 28% of the American Indian or Alaska Native population under age 65 did not have any form of health insurance in 2008) when the disparity from the best group rate is calculated. See the Reader’s Guide for more information. When standard errors were available, the difference between the best group rate and each of the other group rates was tested at the 0.05 level of significance. See the Figure 22-2 footnotes, as well as the Technical Appendix, for more detail.
3. The change in disparity is estimated by subtracting the disparity at baseline from the disparity at the most recent data point and, therefore, is expressed in percentage points. See the Reader’s Guide for more information. When standard errors were available, the change in disparity was tested at the 0.05 level of significance. See the Figure 22-2 footnotes, as well as the Technical Appendix, for more detail.
4. 2008 Physical Activity Guidelines for Americans. Washington, D.C.: Department of Health and Human Services (DHHS); 2008. Available from http://www.health.gov/PAGuidelines/.
5. To be included in Healthy People 2010, an objective must have a national data source that provides a baseline and at least one additional data point for tracking progress. Some objectives lacked baseline data at the time of their development but had a potential data source and were considered of sufficient national importance to be included in
22-6
Healthy People. These are called “developmental” objectives. When data become available, a developmental objective is moved to measurable status and a Healthy People target can be set.
6. As of the Healthy People 2020 launch, Healthy People 2020 objectives that were retained “as is” from Healthy People 2010 had no change in the numerator or denominator definitions, the data source(s), or the data collection methodology. These include objectives that were developmental in Healthy People 2010 and are developmental in Healthy People 2020, and for which no numerator information is available.
7. As of the Healthy People 2020 launch, objectives that were modified from Healthy People 2010 had some change in the numerator or denominator definitions, the data source(s), or the data collection methodology. These include objectives that went from developmental in Healthy People 2010 to measurable in Healthy People 2020, or vice versa.
8. Archived objectives had at least one data point in Healthy People 2010 but were not carried forward into Healthy People 2020.
HEALTHY PEOPLE 2010 FINAL REVIEW

22 • PHYSICAL ACTIVITY AND FITNESS 22-7
Comprehensive Summary of Objectives: Physical Activity and Fitness
Objective Description Data Source
22-1 No leisure-time physical activity (age adjusted, 18+ years) National Health Interview Survey (NHIS), CDC, NCHS.
22-2 Regular physical activity—Moderate or vigorous (age adjusted, 18+ years)
National Health Interview Survey (NHIS), CDC, NCHS.
22-3 Regular physical activity—Vigorous (age adjusted, 18+ years) National Health Interview Survey (NHIS), CDC, NCHS.
22-4 Regular muscle-strengthening activity (age adjusted, 18+ years)
National Health Interview Survey (NHIS), CDC, NCHS.
22-5 Flexibility training (age adjusted, 18+ years) National Health Interview Survey (NHIS), CDC, NCHS.
22-6 Moderate physical activity in students (grades 9–12) Youth Risk Behavior Surveillance System (YRBSS), CDC, NCCDPHP.
22-7 Vigorous physical activity in students (grades 9–12) Youth Risk Behavior Surveillance System (YRBSS), CDC, NCCDPHP.
22-8a Physical education requirement in middle and junior high schools
School Health Policies and Programs Study (SHPPS), CDC, NCCDPHP.
22-8b Physical education requirement in senior high schools School Health Policies and Programs Study (SHPPS), CDC, NCCDPHP.
22-9 Student participation in daily physical education in schools (grades 9–12)
Youth Risk Behavior Surveillance System (YRBSS), CDC, NCCDPHP.
22-10 Student physical activity in physical education class (grades 9–12)
Youth Risk Behavior Surveillance System (YRBSS), CDC, NCCDPHP.
22-11 Student television viewing—At most 2 hours per school day (grades 9–12)
Youth Risk Behavior Surveillance System (YRBSS), CDC, NCCDPHP.
22-12 Access to school physical activity facilities during non-school time
School Health Policies and Programs Study (SHPPS), CDC, NCCDPHP.
22-13 Worksite physical activity and fitness programs National Worksite Health Promotion Survey (NWHPS), Association for Worksite Health Promotion (AWHP), and OPHS, ODPHP.
22-14a Walking for transportation—Adults—Trips ≤1 mile (age adjusted, 18+ years)
National Household Travel Survey (NHTS), formerly Nationwide Personal Transportation Survey (NPTS), Department of Transportation (DOT).
22-14b Walking for transportation—Children and adolescents—Trips to school ≤1 mile (5–15 years)
National Household Travel Survey (NHTS), formerly Nationwide Personal Transportation Survey (NPTS), Department of Transportation (DOT).
22-15a Bicycling for transportation—Adults—Trips ≤5 miles (age adjusted, 18+ years)
National Household Travel Survey (NHTS), formerly Nationwide Personal Transportation Survey (NPTS), Department of Transportation (DOT).
22-15b Walking for transportation—Children and adolescents—Trips to school ≤2 miles (5–15 years)
National Household Travel Survey (NHTS), formerly Nationwide Personal Transportation Survey (NPTS), Department of Transportation (DOT).

HEALTHY PEOPLE 2010 FINAL REVIEW22-8
Figure 22-1. Progress Toward Target Attainment for Focus Area 22: Physical Activity and Fitness
Percent of targeted change achieved2
Baseline vs. Final
Objective2010 Target
Baseline (Year)
Final(Year)
Differ-ence3
Statistically Signifi cant4
Percent Change5 0 25 50 75 100
22-1. No leisure-time physical activity (age adjusted, 18+ years)
20.0% 20% 40%(1997)
36%(2008)
-4 Yes -10.0%
22-2. Regular physical activity—Moderate or vigorous (age adjusted, 18+ years)
0.0% 50% 32%(1997)
32%(2008)
0 No 0.0%
22-3. Regular physical activity—Vigorous (age adjusted, 18+ years)
14.3% 30% 23%(1997)
24%(2008)
1 No 4.3%
22-4. Regular muscle-strengthening activity (age adjusted, 18+ years)
33.3% 30% 18%(1998)
22%(2008)
4 Yes 22.2%
22-5. Flexibility training (age adjusted, 18+ years)
7.7% 43% 30%(1998)
31%(2001)
1 No 3.3%
22-6. Moderate physical activity in students (grades 9–12)
25.0% 35% 27%(1999)
29%(2009)
2 No 7.4%
22-7. Vigorous physical activity in students (grades 9–12)
15.0% 85% 65%(1999)
68%(2009)
3 No 4.6%
22-8a. Physical education requirement in middle and junior high schools
50.0% 9.4% 6.4%(2000)
7.9%(2006)
1.5 No 23.4%
22-8b. Physical education requirement in senior high schools
14.5% 5.8%(2000)
2.1%(2006)
-3.7 Yes -63.8%
22-9. Student participation in daily physical education in schools (grades 9–12)
19.0% 50% 29%(1999)
33%(2009)
4 No 13.8%
22-10. Student physical activity in physical education class (grades 9–12)
25.0% 50% 38%(1999)
41%(2009)
3 No 7.9%
22-11. Student television viewing—At most 2 hours per school day (grades 9–12)
55.6% 75% 57%(1999)
67%(2009)
10 Yes 17.5%
22-12. Access to school physical activity facilities during nonschool time
50% 35%(2000)
29%(2006)
-6 No -17.1%
22-14. Walking for transportation
a. Adults—Trips ≤1 mile (age adjusted, 18+ years)
50.0% 25% 17%(1995)
21%(2001)
4 Yes 23.5%
b. Children and adolescents—Trips to school ≤1 mile (5–15 years)
26.3% 50% 31%(1995)
36%(2001)
5 Yes 16.1%
22-15. Bicycling for transportation
a. Adults—Trips ≤5 miles (age adjusted, 18+ years)
2.0% 0.6%(1995)
0.4%(2001)
-0.2 Yes -33.3%
b. Children and adolescents—Trips to school ≤2 miles (5–15 years)
5.0% 2.4%(1995)
1.5%(2001)
-0.9 No -37.5%
LEGEND Moved away from target1 Moved toward target Met or exceeded target

22 • PHYSICAL ACTIVITY AND FITNESS 22-9
Figure 22-1. Progress Toward Target Attainment for Focus Area 22: Physical Activity and Fitness (continued)
NOTESSee the Reader’s Guide for more information on how to read this fi gure. See DATA2010 at http://wonder.cdc.gov/data2010 for all HealthyPeople 2010 tracking data. Tracking data are not available for objective 22-13.
FOOTNOTES1 Movement away from target is not quantifi ed using the percent of targeted change achieved. See Technical Appendix for more information.
2 Final value – Baseline value Percent of targeted change achieved = × 100.Healthy People 2010 target – Baseline value
3 Diff erence = Final value – Baseline value. Diff erences between percents (%) are measured in percentage points.
4 When estimates of variability are available, the statistical signifi cance of the diff erence between the fi nal value and the baseline value is assessed at the 0.05 level. See Technical Appendix for more information.
DATA SOURCES
22-1–22-5. National Health Interview Survey (NHIS), CDC, NCHS. 22-6–22-7. Youth Risk Behavior Surveillance System (YRBSS), CDC, NCCDPHP. 22-8a–b. School Health Policies and Programs Study (SHPPS), CDC, NCCDPHP. 22-9–22-11. Youth Risk Behavior Surveillance System (YRBSS), CDC, NCCDPHP. 22-12. School Health Policies and Programs Study (SHPPS), CDC, NCCDPHP. 22-14a–b. National Household Travel Survey (NHTS), formerly Nationwide Personal Transportation Survey (NPTS), Department of
Transportation (DOT). 22-15a–b. National Household Travel Survey (NHTS), formerly Nationwide Personal Transportation Survey (NPTS), Department of
Transportation (DOT).
5 Final value – Baseline value Percent change = × 100.Baseline value

HEALTHY PEOPLE 2010 FINAL REVIEW22-10
Figure 22-2. Health Disparities Table for Focus Area 22: Physical Activity and FitnessDisparities from the best group rate for each characteristic at the most recent data point and changes in disparity from the baseline to the most recent data point.
Race and Ethnicity Sex Education Location Disability
Population-based objective Amer
ican
Indi
an o
r Al
aska
Nat
ive
Asian
Nativ
e Ha
waiia
n or
Ot
her P
acific
Islan
der
Two
or m
ore
race
s
Hisp
anic
or L
atin
o
Blac
k, n
ot H
ispan
ic
Whi
te, n
ot H
ispan
ic
Sum
mar
y ind
ex
Fem
ale
Male
Less
than
hig
h sc
hool
High
sch
ool g
radu
ate
At le
ast s
ome
colle
ge
Sum
mar
y ind
ex
Urba
n or
m
etro
polita
nRu
ral o
r no
nmet
ropo
litan
Pers
ons
with
di
sabi
lities
Pers
ons
with
out
disa
biliti
es
22-1. No leisure-time physical activity (age adjusted, 18+ years) (1997, 2008)1
b B B B B B
22-2. Regular physical activity—Moderate or vigorous (age adjusted, 18+ years) (1997, 2008)1
Bi B B B B
22-3. Regular physical activity—Vigorous (age adjusted, 18+ years) (1997, 2008)1 Bi B B B B
22-4. Regular muscle-strengthening activity (age adjusted, 18+ years) (1998, 2008)1
Bi B B B B
22-5. Flexibility training (age adjusted, 18+ years) (1998, 2001)2 B B B B Bi
22-6. Moderate physical activity in students (grades 9–12) (1999, 2009) B B
22-7. Vigorous physical activity in students (grades 9–12) (1999, 2009) B B
22-9. Student participation in daily physical education in schools (grades 9–12) (1999, 2009)
B B
22-10. Student physical activity in physical education class (grades 9–12) (1999, 2009)
B B
22-11. Student television viewing—At most 2 hours per school day (grades 9–12) (1999, 2009)
B B
22-14a. Walking for transportation—Adults—Trips ≤1 mile (age adjusted, 18+ years) (1995, 2001)
B Bi B B
b. Walking for transportation—Children and adolescents—Trips to school ≤1 mile (5–15 years) (1995, 2001)
Bi B
22-15a. Bicycling for transportation— Adults—Trips ≤5 miles (age adjusted, 18+ years) (1995, 2001)
B B B
b. Bicycling for transportation—Children and adolescents—Trips to school ≤2 miles (5–15 years) (1995, 2001)3

22 • PHYSICAL ACTIVITY AND FITNESS 22-11
Figure 22-2. Health Disparities Table for Focus Area 22: Physical Activity and Fitness (continued)
NOTES
See DATA2010 at http://wonder.cdc.gov/data2010 for all Healthy People 2010 tracking data. Disparity data are either unavailable or not applicable for objectives 22-8a and b, 22-12, and 22-13.
Years in parentheses represent the baseline and most recent data years (if available).
Disparity from the best group rate is defined as the percent difference between the best group rate and each of the other group rates for a characteristic (e.g., race and ethnicity). The summary index is the average of these percent differences for a characteristic. Change in disparity is estimated by subtracting the disparity at baseline from the disparity at the most recent data point. Change in the summary index is estimated by subtracting the summary index at baseline from the summary index at the most recent data point. See Technical Appendix for more information.
Measures of variability were available for all objectives in this table. Thus, the variability of best group rates was assessed, and statistical significance was tested. Disparities of 10% or more are displayed when the differences from the best group rate are statistically significant at the 0.05 level. Changes in disparities over time are indicated by arrows when the changes are greater than or equal to 10 percentage points and are statistically significant at the 0.05 level. See Technical Appendix.
LEGENDThe best group rate at the most recent data point. B
The group with the best rate for specified characteristic. b
Most favorable group rate for specified char-acteristic, but reliability criterion not met.
Reliability criterion for best group rate not met, or data available for only one group.
Percent difference from the best group rate
Disparity from the best group rate at the most recent data point.
Less than 10%, or difference not statistically significant (when estimates of variability are available).
10%–49% 50%–99%100% or more
Changes in disparity over time are shown when: (a) disparities data are available at both baseline and most recent time points; (b) data are not for the group(s) indicated by B or b at either time point; and (c) the change is greater than or equal to 10 percentage points and statistically significant, or when the change is greater than or equal to 10 percentage points and estimates of variability were not available. See Technical Appendix.
Increase in disparity (percentage points)
10–49 points 50–99 points
100 points or more
Decrease in disparity (percentage points)
10–49 points 50–99 points
100 points or more
Availability of DataData not available.
Characteristic not selected for this objective.
FOOTNOTES1 Baseline data by race and ethnicity are for 1999. 2 Baseline data by race and ethnicity are for 2001. 3 Most current data by location are for 1995. i The group with the best rate at the most recent data point is different from the group with the best rate at baseline. Both rates met the reliability criterion.
See Technical Appendix.
DATA SOURCES
22-1–22-5. National Health Interview Survey (NHIS), CDC, NCHS.22-6–22-7. Youth Risk Behavior Surveillance System (YRBSS), CDC, NCCDPHP.22-9–22-11. Youth Risk Behavior Surveillance System (YRBSS), CDC, NCCDPHP.22-14a–b. National Household Travel Survey (NHTS), formerly Nationwide Personal Transportation Survey (NPTS), Department of Transportation (DOT).22-15a–b. National Household Travel Survey (NHTS), formerly Nationwide Personal Transportation Survey (NPTS), Department of Transportation (DOT).
HEA
LTHY PEO
PLE 2010 FINAL REVIEW
22-12 Figure 22-3. No Leisure Time Physical Activity Among Adults (Aged 18+), 2008Healthy People 2010 objective 22-1 • Target = 20 percent
NOTES: Data are age adjusted to the 2000 standard population. Rates are displayed by a modified Jenks classification for U.S. states. National data for the objective come from the National Health Interview Survey (NHIS) and are the basis for setting the target. State data from BRFSS may not be comparable with national data from NHIS. The U.S. rate in 2008 from NHIS was 36.3%. The rate for all states combined from BRFSS in 2008 was 24.4%.
SOURCE: Behavioral Risk Factor Surveillance System (BRFSS), CDC, NCCDPHP.
17.9–20.0
20.1–23.2
23.3–25.6
25.7–28.0
28.1–32.4
Percent
Lowest category (green)shows states that met target.