physical activity change through comprehensive school
TRANSCRIPT
Wayne State University
Kinesiology, Health and Sport Studies College of Education
10-1-2014
Physical Activity Change Through ComprehensiveSchool Physical Activity Programs in UrbanElementary SchoolsErin E. CenteioWayne State University, [email protected]
Nate McCaughtryWayne State University, [email protected]
Lila GutuskeyWayne State University, [email protected]
Alex C. GarnLouisiana State University
Cheryl SomersWayne State University, [email protected]
See next page for additional authors
This Article is brought to you for free and open access by the College of Education at DigitalCommons@WayneState. It has been accepted for inclusionin Kinesiology, Health and Sport Studies by an authorized administrator of DigitalCommons@WayneState.
Recommended CitationCenteio, E. E., McCaughtry, N., Gutuskey, L., Garn, A. C., Somers, C., Shen, B.,... Kulik, N. L. (2014). Physical activity change throughcomprehensive school physical activity programs in urban elementary schools. Journal of Teaching in Physical Education, 33(4),573-591. doi: 10.1123/jtpe.2014-0067Available at: http://digitalcommons.wayne.edu/coe_khs/70
AuthorsErin E. Centeio; Nate McCaughtry; Lila Gutuskey; Alex C. Garn; Cheryl Somers; Bo Shen; Jeffry J. Martin;and Noel L, Kulik
This article is available at DigitalCommons@WayneState: http://digitalcommons.wayne.edu/coe_khs/70

RUNNING HEAD: PA Change Through CSPAP
Physical Activity Change through Comprehensive School Physical
Activity Programs in Urban Elementary Schools
Erin E. Centeioa, Nate McCaughtrya, Lila Gutuskeya, Alex C. Garnb, Cheryl Somersa, Bo
Shena, Jeffrey J. Martina, and Noel L. Kulika
aWayne State University; bLouisiana State University
Keywords: Coordinated School Health, Physical Education, Whole-of-School Approach,
Quantitative

PA Change Through CSPAP
1
Abstract
The impact of CSPAPs on urban children’s, educators’, and parents’ physical
activity (PA) is relatively unknown. The purpose of this study was to explore overall
changes in student, educator, and parent PA after an 8-month CSPAP-based program. This
longitudinal, exploratory study implemented a CSPAP model in 20 urban elementary
schools, with six randomized for research. In-school PA was measured pre-post for all
fourth grade students using accelerometers. Parent and educator PA was self-reported using
the IPAQ. RM-ANOVAs revealed significant pre-post increases in minutes of student
MVPA (p<.001). Parents significantly increased PA (p<.01) and although educators’
reported change in PA, it was not statistically significant (p=.50). This exploratory study
provides unique information about the potential influence of one CSPAP model on
students’ overall PA, PA by individual context within the school, the differential PA
patterns by race, and PA changes for educators and parents.
PA Change Through CSPAP
2
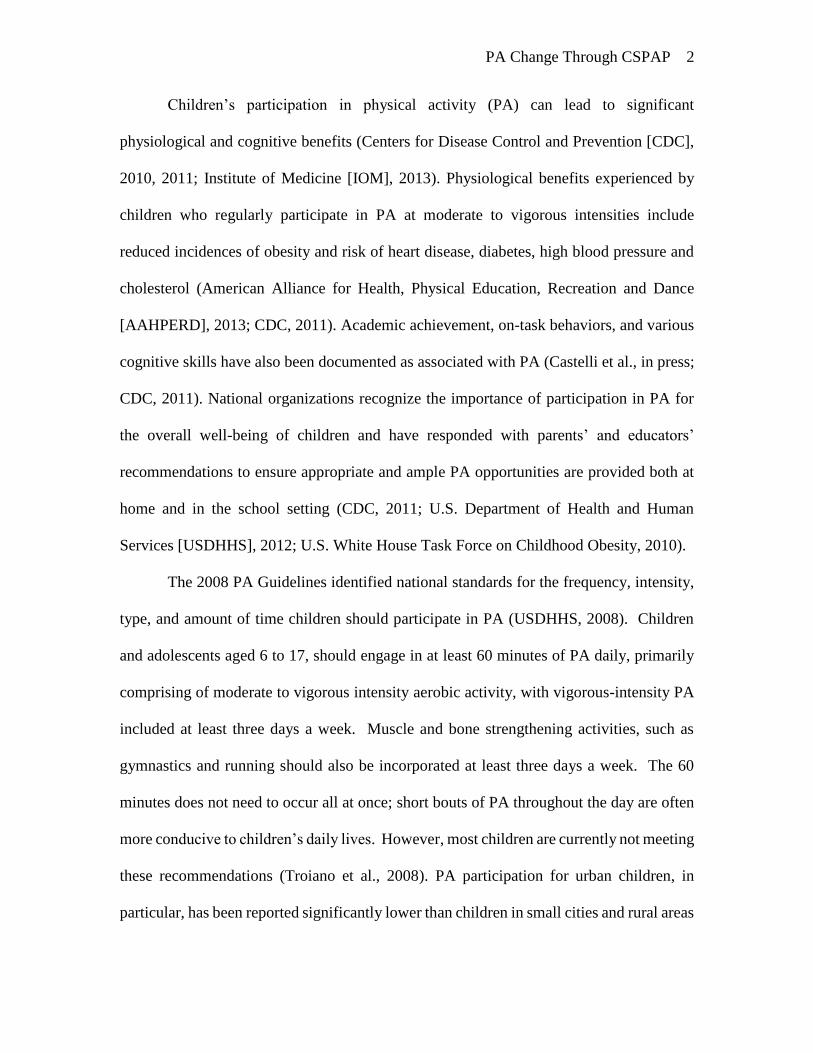
Children’s participation in physical activity (PA) can lead to significant
physiological and cognitive benefits (Centers for Disease Control and Prevention [CDC],
2010, 2011; Institute of Medicine [IOM], 2013). Physiological benefits experienced by
children who regularly participate in PA at moderate to vigorous intensities include
reduced incidences of obesity and risk of heart disease, diabetes, high blood pressure and
cholesterol (American Alliance for Health, Physical Education, Recreation and Dance
[AAHPERD], 2013; CDC, 2011). Academic achievement, on-task behaviors, and various
cognitive skills have also been documented as associated with PA (Castelli et al., in press;
CDC, 2011). National organizations recognize the importance of participation in PA for
the overall well-being of children and have responded with parents’ and educators’
recommendations to ensure appropriate and ample PA opportunities are provided both at
home and in the school setting (CDC, 2011; U.S. Department of Health and Human
Services [USDHHS], 2012; U.S. White House Task Force on Childhood Obesity, 2010).
The 2008 PA Guidelines identified national standards for the frequency, intensity,
type, and amount of time children should participate in PA (USDHHS, 2008). Children
and adolescents aged 6 to 17, should engage in at least 60 minutes of PA daily, primarily
comprising of moderate to vigorous intensity aerobic activity, with vigorous-intensity PA
included at least three days a week. Muscle and bone strengthening activities, such as
gymnastics and running should also be incorporated at least three days a week. The 60
minutes does not need to occur all at once; short bouts of PA throughout the day are often
more conducive to children’s daily lives. However, most children are currently not meeting
these recommendations (Troiano et al., 2008). PA participation for urban children, in
particular, has been reported significantly lower than children in small cities and rural areas

PA Change Through CSPAP
3
(Joens‐Matre et al, 2008). Providing additional opportunities for all children, especially
those in low-income, urban areas to participate in PA could increase the proportion of
children who meet recommended guidelines (USDHHS, 2008).
Schools are a convenient place to reach most children and should play an important
role in providing children with the knowledge, skills, and opportunities to be physically
active (IOM 2013; Pate et al., 2006). Through schools, children can gain the knowledge
and opportunities to be physically active throughout the school environment and school
day, and families can learn how to reinforce active lifestyles (AAHPERD, 2013).
However, since the enactment of No Child Left Behind in 2001, schools have cut time from
traditional school PA opportunities like physical education (PE) classes and recess to
accommodate the additional focus on English Language Arts and Math (McMurrer, 2007).
These cuts are particularly noticeable in urban areas where schools are often low
performing, potentially generating greater potential for health disparities among students.
Consequently, to bolster the role of schools in helping children achieve 60 minutes of
activity time daily, many studies have suggested that schools should offer additional PA
opportunities beyond traditional venues (Carson, 2012; Erwin, Beighle, Carson, & Castelli,
2013; Metzler, McKenzie, van der Mars, Barrett-Williams, & Ellis, 2013a, 2013b).
A comprehensive school physical activity program (CSPAP) that provides children
with multiple times to be physically active throughout the day (before, during and after
school) in multiple locations (PE, recess, classrooms) has been promoted as an evidence-
based model to increase children’s PA levels (AAHPERD, 2013; CDC, 2013; National
Association for Sport and Physical Education [NASPE], 2008). The Health Optimizing
Physical Education (HOPE) curriculum is one model that encourages PA throughout the
PA Change Through CSPAP
4
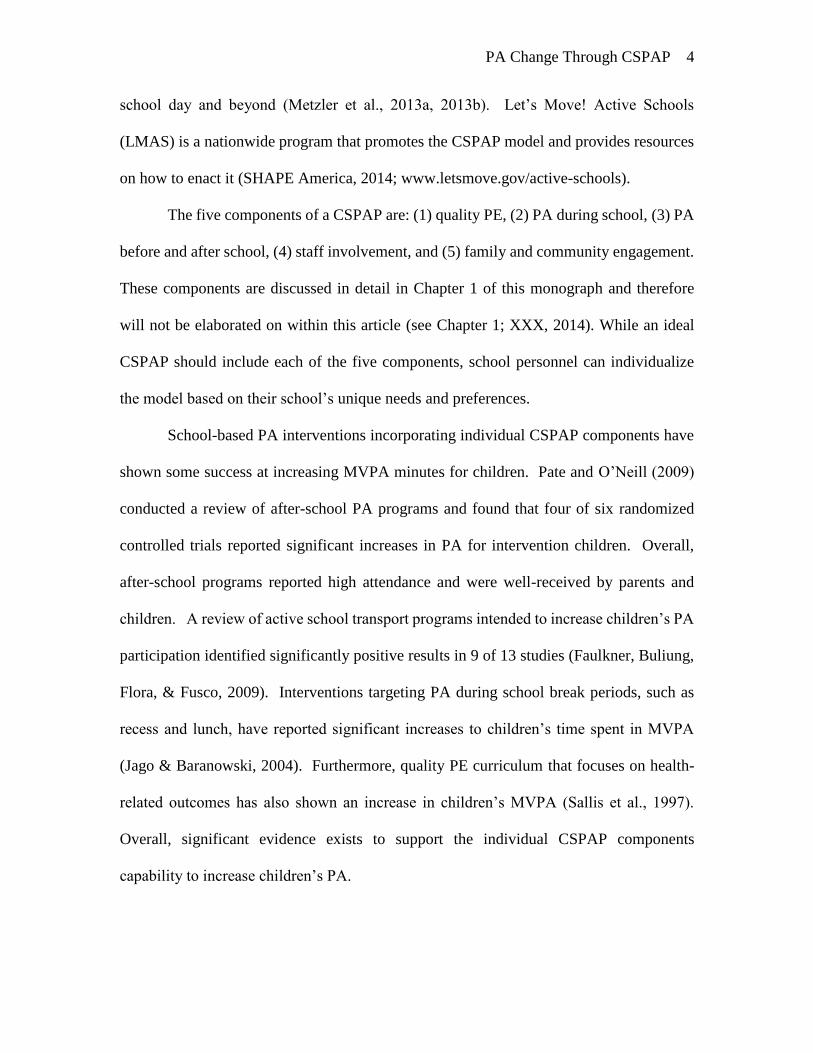
school day and beyond (Metzler et al., 2013a, 2013b). Let’s Move! Active Schools
(LMAS) is a nationwide program that promotes the CSPAP model and provides resources
on how to enact it (SHAPE America, 2014; www.letsmove.gov/active-schools).
The five components of a CSPAP are: (1) quality PE, (2) PA during school, (3) PA
before and after school, (4) staff involvement, and (5) family and community engagement.
These components are discussed in detail in Chapter 1 of this monograph and therefore
will not be elaborated on within this article (see Chapter 1; XXX, 2014). While an ideal
CSPAP should include each of the five components, school personnel can individualize
the model based on their school’s unique needs and preferences.
School-based PA interventions incorporating individual CSPAP components have
shown some success at increasing MVPA minutes for children. Pate and O’Neill (2009)
conducted a review of after-school PA programs and found that four of six randomized
controlled trials reported significant increases in PA for intervention children. Overall,
after-school programs reported high attendance and were well-received by parents and
children. A review of active school transport programs intended to increase children’s PA
participation identified significantly positive results in 9 of 13 studies (Faulkner, Buliung,
Flora, & Fusco, 2009). Interventions targeting PA during school break periods, such as
recess and lunch, have reported significant increases to children’s time spent in MVPA
(Jago & Baranowski, 2004). Furthermore, quality PE curriculum that focuses on health-
related outcomes has also shown an increase in children’s MVPA (Sallis et al., 1997).
Overall, significant evidence exists to support the individual CSPAP components
capability to increase children’s PA.
PA Change Through CSPAP
5
Family and community engagement as well as staff involvement should not be
forgotten as a means to increase children’s daily PA. Staff healthy habit adoption and
positive role-modeling might also play an important role in youth PA engagement at
school. Engaging parents in CSPAP related school efforts might also lead to enhanced
school PA for youth through parental encouragement and role modeling at home. After all,
parental and educator role models of PA have been associated with youth participation in
PA (Brustad, 1996). In addition, youth with physically active parents are significantly more
active than children with inactive parents (Anderssen & Wold, 1992; Bois, Sarrazin,
Brustad, Trouilloud, & Cury, 2005; Moore et al., 1991), and parental support for youth to
be physically active has also been linked (Sallis et al., 1992).
Moreover, influences in PA participation can be bi-directional as children’s
participation and support has shown to impact parental perceptions and levels of PA. A
study conducted by Dorsch, Smith, and McDonough (2009) found that parents whose
children participated in youth sport gained many psychological and emotional benefits
including a strong connection to sport and PA similar to their children. Other studies such
as that conducted by Seefeldt, Malina, & Clark (2002) discussed how family support leads
to increased participation in PA.
While comprehensive models for school-based PA should lead to positive PA
outcomes for youth and potentially educators and parents, there is currently a gap in
research examining the impact of delivering multiple CSPAP components simultaneously
(Erwin, Beighle, Carson, & Castelli, 2013). To date, most research has not examined the
incorporation of all five components of the CSPAP model. Hence, the impact of multi-
component CSPAP programs on cumulative youth PA is relatively unknown, much less a
PA Change Through CSPAP
6
more fine-grained analysis of how each segment of the school environment may or may
not contribute uniquely. In addition, the role that CSPAP programs might play in bi-
directionally influencing educators’ and parents’ own PA behaviors and perceptions
remain fully unexplored. Therefore, the purpose of this study was to identify overall
changes in student, educator, and parent PA during an 8-month CSPAP program, as well
as student PA changes by locations within schools, and the influences of gender and race.
Theoretical Framework
The Social Ecological Framework (SEF) suggests that multiple levels of factors are
working in harmony to influence health behaviors; including both the physical and social
environment (Sallis, Owen, & Fisher, 2008; Stokols, 1992). Sallis et al. (2008) identified
these levels as intrapersonal, interpersonal, organizational, community and public policy
(Figure 1, see appendix). Examples of influences to children’s participation in PA include;
self-efficacy and PA enjoyment (intrapersonal), parent modeling and social support
(interpersonal), school equipment and opportunities for PA (organizational), access to
facilities, and programs (community), National and State policies on PE and feasibility of
active transport (public policy; Sallis et al., 2008). Historically, the individual level has
been the primary focus for health programs, but there is growing evidence supporting
interventions impacting multiple levels of influence (Metzler et al., 2013a; Stokols, 1992).
Consequently, health interventions guided by SEF should include program
components affecting at least two levels of influence (Sallis et al., 2008). CSPAPs are well
aligned with SEF since the five components of CSPAP impact youth PA behavior across
multiple influential levels described in SEF, described in table 1 (Metzler et al., 2013a).
For example, PE experiences can provide youth with self-efficacy to participate in PA and

PA Change Through CSPAP
7
increase their perceptions of confidence, impacting the intrapersonal level of SEF. PA
during school can provide students opportunities to increase the amount of PA they engage
in and practice the skills and continue to build the confidence gained in PE, impacting the
intrapersonal and organizational levels of the framework. PA before and after school
through programming such as active transport, PA clubs and organized sports could impact
all levels of SEF. Staff involvement through role modeling and advocacy can impact the
intrapersonal and organizational levels. Engaging the family and community through
education, role modeling, events and awareness can also impact all levels of the model.
Similar to Social Cognitive Theory, reciprocal determinism is equally applicable in
ecological frameworks (McAlister, Perry, & Parcel, 2008). Reciprocal determinism
suggests that as factors embedded in one level of intervention change, they can
simultaneously and relationally lead to changes in other levels. For instance, as school
staff becomes more involved in the enactment of CSPAP, they can influence the
organizational level by changing time allotted to PA for recess and classroom activity
breaks, which in turn can lead to changes within children’s feelings and experiences about
PA. Additionally, as children’s self-efficacy and enjoyment of PA increase through PE or
before/after school opportunities, children may seek out and ask parents to enroll them in
an after-school sport or PA clubs. A little differently, as educators enact CSPAP and see
positive influences on children, they themselves might engage in behavior change, which
could lead to educator PA increases and positive perceptions as health role models, which
might even further cement the importance of PA for students. Similarly, as parent see their
children’s energy around CSPAP activities at school and receive educational resources at
home and at school events, they could impact parental PA; thereby, similar to teachers,

PA Change Through CSPAP
8
have a reifying effect for their children and parents’ own activity levels. In this way, the
levels of influence on children’s PA are inter-connected and might work together
synergistically to either encourage or discourage PA behavior among the multiple groups
directly or indirectly embedded in the CSPAP system.
Methods
Research Setting
During 2012-2013, 20 urban elementary schools in the Midwestern United States
participated in this research study. Schools applied to participate in a program called
Building Healthy Communities (BHC). BHC implements a whole-school approach to PA
and nutrition programming designed to reach students, educators, and parents. Schools who
participated in the BHC program attended a one-day workshop to initiate them to the
program and its components as well as introduce key support staff for the program. Each
school was assigned a trained coordinator that provided technical assistant, support, and
education to the school throughout the entire year. BHC coordinators were full time
employees of the grant. There were a total of three coordinators for the 20 schools.
For this paper, the four components that specifically targeted additional PA
opportunities at school will be addressed: (1) quality PE, (2) classroom PA (split into
classroom time and specials), (3) lunch and recess, and (4) after school PA club. Of the
sixteen schools that participated in BHC, six were randomly selected to participate in the
research and all fourth grade students in each school who provided informed consent
participated.
Quality PE. PE teachers were trained to implement the Exemplary Physical
Education Curriculum (EPEC) into their PE classes. EPEC was chosen because of its

PA Change Through CSPAP
9
strong emphasis on promoting health through PA in PE. It is a state-drive curriculum that
is used widely and developed by the Michigan Fitness Foundation (MFF) as a public health
initiative by the Michigan Governors Council on Physical Fitness, Health and Sports
(Michigan Department of Education [MDE], 2001). Additionally, each teacher received a
day-long professional development workshop, regular at-school mentoring, the packaged
curriculum, and a full set of PA equipment designed to teach EPEC with classes of 30
students (i.e. basketballs, soccer balls, jump ropes, hula hoops, and cones). The
implementation of EPEC was tracked over the entire school year. First, PE teachers kept
monthly logs showing the specific EPEC lessons that were taught each day to their fourth
grade classrooms. The EPEC logs were collected on a monthly basis and reviewed by the
research team. In addition to the EPEC logs that were kept, fidelity checks in the form of
school visits occurred at least twice a month by members of the research team for informal
observation and oversight that EPEC was being taught in the PE classroom.
Classroom PA. Classroom teachers were mentored to provide regular PA breaks
during academic learning time. BHC project staff modeled five Fit Bits (classroom PA
breaks; http://www.michiganfitness.org/fitbits) in each fourth grade classroom, and
provided the Fit Bits and encouragement to continue the activity breaks throughout the
year. The teachers were also encouraged to adopt a culture of PA in their classroom, such
as encouraging PA as homework, reading PA “tips of the day”, and not using recess as
punishment (e.g., taking away recess for not completing homework, talking out of turn, or
misbehaving during classroom time). Classroom teachers maintained a daily log of their
activity break implementation and the research team conducted regular fidelity checks. In

PA Change Through CSPAP
10
this study, general classroom time was separated from specials (e.g. art, music, and media
center time) because this time was spent with a teacher other than the homeroom teacher.
Lunch and Recess. Active recess was a core component of the BHC program. Each
school received a mobile recess cart with a wide variety of PA equipment (i.e. jump ropes,
playground balls, soccer and basketballs, hula hoops, etc.). In addition to equipment, recess
activity cards were provided to help encourage students to play games and be active during
their recess time. PE teachers taught the games on the cards in PE classes so that students
would be familiar with them during recess. In addition to the recess cart, schools were
encouraged to have an “active” recess monitor to model PA for the students. All schools
provided a recess monitor to oversee the implementation of active recess, however this
person varied by school (i.e. classroom teacher, principal, lunchroom monitor, etc.) and
was not required to attend any formal training. The recess carts were moved to the recess
area at the beginning of each day and returned to storage at the end of the day. The research
team conducted regular fidelity checks to verify that the equipment carts were regularly
available of student use during recess. Specifically, members from the research team
randomly showed up weekly at each school to ensure the recess cart was present during
recess time and was being monitored appropriately. Schools were also asked to log monthly
about the overall use of their recess carts and implementation of active recess.
After School PA. Each school hosted an after school PA program titled Healthy
Kids Club (HKC). The HKC’s consisted of three segments that averaged 62 minutes. First,
students ate a healthy snack while listening to nutrition education (15 min). Second, after
eating, students participated in a 20-minute walking club followed by 20 minutes of fun

PA Change Through CSPAP
11
and highly active games. Third, the HKCs ended with a 5-minute recap on the activities
and the nutrition messages.
The BHC program also targeted staff by promoting and encouraging them to be
active role models for their students. A BHC coordinator was in the schools on a weekly
basis promoting a culture of healthy living. Furthermore, newsletters and other materials
were sent home to parents promoting PA and schools also hosted PA events for the whole
family offered both during and beyond school hours.
Participants
Students. At time one (T1) 344 fourth grade students (Mage= 9.39; SD = .44; female
= 57%) participated in the study. Each school contributed a similar amount of students to
the total number in the study (i.e., range 43-66). Students reported their ethnicities as
African American (53%), Caucasian (23%), Other (20%), Hispanic (2%), Asian/Pacific
Islander (1%), and American Indian (1%). A majority of the students in the other category
identified themselves as Arab American. Approximately 88% percent of the students (n=
301) completed the post measure of PA eight-months later at time two (T2).
Parents. All fourth grade parents were asked to complete the International Physical
Activity Questionnaire (IPAQ; IPAQ, 2014). Of the 344 students, 260 parents (212
mothers, 45 fathers, 2 female guardians, and 1 male guardian; 58% African American, 24%
Caucasian, 15% Other, 2% Hispanic, <1% Asian) consented and completed the IPAQ
questionnaire at T1 (Mage = 36.49; SD = 6.37). At T2, 109 or 42% of the T1 parents (Mage
= 36.38; SD = 6.04; 91 mothers, 17 fathers, and 1 male guardian; 53% African American,
29% Caucasian, 1% Hispanic, and 17% Other) completed the IPAQ questionnaire.

PA Change Through CSPAP
12
Educators. Fourth grade teachers and school administrators in the research schools
consented to be a part of the research. All but two teachers and administrators completed
the IPAQ at T1 & T2. There were a total of 22 fourth grade teachers (Mexperience = 10.8
years, SD = 8.64) and 12 administrators (Mexperience =1.76 years, SD = 2.89) who completed
the IPAQ at T1 & T2 (Mage = 38.93, SD = 10.30 Female = 31; 67% Caucasian, 30% African
American, and 3% Other).
Measures
Student PA measurement. Student PA was collected using accelerometers
(ActiGraph GT3X+) recording accelerations on three axis as well as step data. The
monitors were initialized to save data in 15-second intervals (epochs) to detect the
spontaneous activities of school-aged children. Children wore the accelerometers on the
right hip, secured with an elastic belt. The ActiGraph GT3X+ has demonstrated
outstanding criterion validity and reliability in previous research (Melanson & Freedson,
1995). Accelerometer data were collected over a three-day period of time from the
beginning to the end of the school day, which created a total of six school-days measured.
Using the manufacturer’s software (ActiLife version 6), data were downloaded and washed
through the program using the Freedson (1998) cut-points. Once the raw data were
exported from ActiLife into Excel, student PA was aggregated separately in five contexts
(PE, lunch and recess, classrooms, specials, and HKCs).1 Table 2 (see appendix) provides
a summary of the average amount of total minutes that students spent in each part of the
school (PE, lunch and recess, classrooms, specials, and HKCs). Then, a total number of
1 Researchers were able to aggregate data into five contexts given they were present in
each classroom during data collection and were assigned the task to conduct fidelity
checks and recordings during every minute of the school day.
PA Change Through CSPAP
13
average minutes of moderate-to-vigorous PA (MVPA; MET > 3) and sedentary and light
PA (SLPA; MET < 2.99) per day were calculated for each. It is important to note that
HKC accelerometer data was only collected at T2 on those fourth grade students who were
consented, and attended the HKC on the day of data collection (N = 24; 8% of total
consented students).
Adult PA measurement. Self-reported PA data was collected among parents and
educators using the short version of the IPAQ (Craig et al., 2003; Lee, Macfarlane, Lam,
& Stewart, 2011). The IPAQ asked participants to report activities performed for at least
10 minutes during the previous seven days. Respondents were asked to report the amount
of days and time spent performing PA at various levels of intensity (i.e. vigorous, moderate,
and light), while giving specific examples within each level (e.g., moderate examples
include: carrying light loads, bicycling at a regular pace, or doubles tennis). Each
participant was given a total score, using the IPAQ scoring system (IPAQ, 2005) of total
number of MET-minutes/week expended.
Data Collection
In September 2012 and May 2013, PA data were collected from students, parents,
and educators. First, children whose parents provided informed consent wore
accelerometers for three full school days starting when they arrived at school and ending
when they left the school (whether at the end of the official school day or after the HKC).
Second, IPAQ PA self-report instruments and directions were sent home and completed by
parents. Last, all educators (classroom teachers and administrators) also completed the
IPAQ.

PA Change Through CSPAP
14
Data Analysis
Descriptive statistics were analyzed and all variables were screened for outliers,
missing data, and normality issues. A series of repeated measures analyses of variance
(RM-ANOVAs) were run to determine pre-post differences in student and parent PA
levels, while a paired sample t-test was used to determine differences among the educators,
due to a small sample size. A series of multivariate measures analyses of covariance
(MANCOVA) were run to examine student differences in MVPA and SLPA by race and
gender, controlling for socioeconomic status (SES), as well as parental differences in MET-
min expended by race and gender. Partial η2 (eta squared) was presented as an index of
effect size (i.e., small effect size, η2 = .01; moderate effect size, η2=.06, and large effect
size, η2 = .14; Cohen, 1988; Portney & Watkins, 2009). All statistical analyses were
conducted using SPSS (v.21), and p values of .05 or less were considered statistically
significant.
Results
Descriptive Statistics
Correlation tables were run to determine the relationship between gender, ethnicity,
and SES with student MVPA and SLPA, as well as with parent MET-min reported2.
Outliers were tested using z-scores causing four student outliers to be removed from the
data set along with two parents. Missing values were list-wise deleted and there were no
issues with normality.
2 Lack of space would not allow correlation tables included within the article. Please
contact first author for correlation matrix.

PA Change Through CSPAP
15
Student PA
A series of RM-ANOVA’s were used to determine how student PA levels (MVPA
and SLPA) changed over an eight-month period. The dependent variable was minutes,
while the independent variables were the pre and post PA categories by instructional
locations during the school day (e.g. total MVPA and SLPA throughout the school day in
total, in PE, at lunch and recess, in classrooms, at specials). Additionally, a MANCOVA
was run to determine if ethnicity and gender influenced changes in SLPA and MVPA after
controlling for SES. The dependent variables for the MANCOVA included changes in PA
from pre to post during PE, lunch and recess, classrooms, and specials. The independent
variables were gender and ethnicity, while the covariate was SES.
An overall RM-ANOVA revealed a significant difference in total MVPA across the
entire school day from pre to post data collection [Pillai’s Trace, F(1,308) = 100.09, p <
.001, η2 = .25]. Students increased their MVPA during school (excluding HKCs) an average
of almost 4.5 minutes per day (Mpre = 7.37 min, SDpre = 7.48, Mpost = 11.67 min, SDpost =
9.22). Similarly, when accounting for a decrease in the total time during the school day
(397 minpre; 389 minpost), there was a 58% increase in the percent of time that students spent
in MVPA. Although there were significant changes in overall MVPA, there were no overall
significant differences in the amount of total school day SLPA from pre to post [Pillai’s
Trace, F(1,308) = 3.02, p =.08, η2 = .01]. Separate RM-ANOVA’s were run to determine
specifically where changes occurred during the school day.
Overall significant differences were found from pre to post time spent in MVPA in
PE, lunch & recess, and classroom time (p <.01; see Table 3). Total minutes of SLPA
significantly increased within lunch and recess, and specials (p < .01), while decreasing

PA Change Through CSPAP
16
during classroom minutes (p < .01; see Table 4). Tables 3 and 4 also report the change in
MVPA and SLPA as a percent of total minutes spent within each category (PE, lunch and
recess, classroom time, and specials; Table 2). For example, total lunch and recess time
increased from pre (51 minutes) to post (60 minutes), so one might expect to see an increase
in the minutes of MVPA. However, when taking into account the percent of minutes in
MVPA, lunch and recess increased from 6.8% of total time in MVPA to 7.6%, representing
an 11.7% increase. Effect sizes were small-to-moderate indicating meaningful increases in
PA.
The HKCs did not have a pre-measurement as none of the six schools offered free
after-school PA opportunities prior to the BHC program. Since there was only a post
measurement of the HKCs the amount of PA time offered during programming went from
zero in all schools to an average of 8.69 minutes of MVPA, and 53.63 minutes of SLPA.
MVPA accounted for 14% of the total time spent in the HKCs (n = 24).
MANCOVA results revealed that MVPA varied by ethnicity Pillai’s Trace = .15,
F(24, 1148) = 1.88, p < .01, 2 = .04, but not by gender Pillai’s Trace = .01, F(4, 284) =
.06, p = .99, 2 = .01, or the intersection of gender and ethnicity Pillai’s Trace = .04, F(24,
1148) = .52, p = .97, 2 = .01.
Follow up post hoc tests revealed that changes in lunch & recess MVPA [F(6, 294)
= 2.77, p < .01, 2 = .06, Adj. R2 = .08], classroom MVPA [F(6, 294) = 2.42, p < .05, 2 =
.05, Adj. R2 = .04], and specials MVPA [F(6, 294) = 4.40, p < .001, 2 = .09, Adj. R2 = .09]
were significantly different by ethnicity. However, MVPA in PE did not differ by ethnicity
(p = .11). Further investigation revealed that African American students significantly

PA Change Through CSPAP
17
increased MVPA minutes more than their Caucasian (p < .01) and other (p < .001)
counterparts in lunch and recess, classroom time, and specials.
MANCOVA results revealed that SLPA significantly varied by ethnicity Pillai’s
Trace = .25, F(24, 1144) = 3.20, p < .001, 2 = .06 and the intersection of gender and
ethnicity Pillai’s Trace = .13, F(24, 1144) = 1.64, p < .05, 2 = .03, but not by gender alone
Pillai’s Trace = .01, F(4, 283) = .06, p = .92, 2 = .01.
Follow up post hoc tests revealed that change in PE SLPA [F(6, 286) = 16.74, p <
.001, 2 = .06, Adj. R2 = .08], and classroom SLPA [F(6, 286) = 4.93, p < .001, 2 = .09,
Adj. R2 = .08] were significantly different by ethnicity. However, SLPA at lunch and recess
(p = .77) and specials did not differ by ethnicity (p = .23). The interaction of gender and
ethnicity also revealed significant changes in SLPA among students when participating in
PE [F(6,286) = 3.54, p < .01, 2 = .07], but not during lunch and recess (p = .49), classroom
time (p = .43), or specials (p = .36). Further investigation revealed that African American
students significantly decreased SLPA minutes in PE more than their Caucasian (p < .001)
and Hispanic (p < .05) counterparts, while Caucasian students significantly increased their
SLPA minutes during PE over those students who identified as other. During classroom
time, post hoc tests revealed that Caucasian students significantly decreased their amount
of SLPA minutes significantly more than their African American (p < .001) and other (p
< .001) counterparts, while African American students significant decreased their SLPA
during classroom time over their Hispanic counterparts (p <.001).
Parental and Educator PA
A RM-ANOVA was used to determine change over time in parental PA. The
independent measure was time, while the dependent measures were pre and post MET-min
PA Change Through CSPAP
18
reported. In addition, a two-way ANOVA was run to determine the effects of gender and
ethnicity on the change in parents’ total MET-min. The dependent variable for this analysis
was change in MET-min from T1 to T2 and the independent variables were gender and
ethnicity.
The RM-ANOVA showed a significant overall change in MET-min of PA reported
from pre to post [Pillai’s Trace, F(1,115) = 13.39, p <. 001, 2=.10; Mpre = 10,402 MET-
min, Mpost = 18,181 MET-min]. Using a two-way ANOVA there were no significant effects
of gender and ethnicity on the change in MET-min reported F(6,102) = .783, p = .59,
2=.04.
Given the low number of educators who were included in the study a paired sample
t-test was used to determine significant changes from pre to post. While educators reported
change in MET-min of PA, it was not statistically significant (p = .50; Mpre=4015 MET-
min, Mpost=4849 MET-min). This could be due to a small sample size.
Discussion
The purpose of this study was to identify overall changes in student, parent, and
educator PA during an 8-month CSPAP program, as well as student PA changes by
locations within schools, and the influences of gender and race. BHC exemplified a
complete CSPAP program by integrating all five components into a comprehensive PA
reform initiative. While previous research has examined the effectiveness of individual
components of CSPAPs (e.g., Pate & O’Neil, 2009), this study provides informative
evidence about multiple components of a CSPAP. PE was the centerpiece supplemented
with after school programming, during school activity opportunities in classrooms and at
recess, staff engagement as facilitators and role models, and multiple points of engagement

PA Change Through CSPAP
19
with parents. From an ecological perspective, the initiative sought to influence
interpersonal, intrapersonal, organizational, and community change.
The main goal of the initiative was to increase the amount of time that students
spent in MVPA during the school day. This, in fact, occurred as students significantly
increased their MVPA by 4.5 minutes from 7.37 to 11.67 minutes per day, representing a
58% increase. This improvement, while significant, can be viewed from different
perspectives. On the one hand, adding an additional 4.5 minutes of MVPA to each students’
time at school is important and its value from a public health perspective should not be
overlooked. Although it does not seem considerable compared to the national
recommendation of 60 minutes each day, it is a start. For example, an average of 4.5
minutes a day is equivalent to 22.5 additional minutes of MVPA per week. Given students
in these schools often participate in one 30 minute PE class per week, this is equivalent to
almost 1.5 additional PE classes (if you use the gold standard of 50% of PE time spent in
MVPA). Over one school year this totals 810 minutes of MVPA, 27 separate bouts of 30
minutes of MVPA or an extra 54 PE classes. From a public health perspective, a 4.5-minute
increase in MVPA per day also has beneficial effects. This increase totals 22.5 minutes a
week, 90 minutes of MVPA a month, and over a 1000 minutes a year.
Of course, an extra 4.5 minutes of MVPA per day also has to be viewed in light of
the links between PA and academic achievement, attention, behavior, and cognition.
Although this study did not use a comparison group, or measure variables related to
academic or cognitive performance, the links between PA and learning seem strong
(Castelli, Hillman, Hirsch, Hirsch, & Drollette, 2011; Castelli, Centeio, Hwang, & Nicksic,
in press; Donnelly et al., 2009; Hillman et al., 2009; Kamijo et al., 2011; Sallis et al., 1999;

PA Change Through CSPAP
20
Strong et al., 2005); hence, we might guess that a daily MVPA increase of nearly five
minutes might reap benefits in an academic sense, in addition to health enhancement. In an
era where urban children are often in low performing schools, increasing the amount of PA
could potentially affect academic achievement as well as address looming health
disparities. A randomized control trial seems highly warranted to determine whether these
gains in MVPA are attributable to BHC and, if so, whether they concomitantly impact
academic achievement.
This study also offers the unique ability to examine PA changes across the various
places in the school environment where students spend time. Similar to other findings in
this monograph multiple opportunities for PA matter (see Chen et al., 2014). In this present
study students significantly increased their MVPA in PE, lunch/recess, and classrooms,
with the most significant increases occurring in PE and classrooms, especially when
calculated in comparison to the total time spent in school per day. In addition, SLPA in PE
and classrooms stayed static, while significantly decreasing in lunch/recess. From a cost-
benefit perspective, these data might suggest that all three locations represent viable
school-based MVPA intervention sites.
Analyses of MVPA changes across ethnicities yielded some noteworthy results,
especially in relation to African American students. African American students, for
example, increased their MVPA significantly more than students from the other ethnic
groups in classrooms, lunch/recess, and specials. Although they did not increase their
MVPA in PE, they did decrease their SLPA in PE more than Caucasian or Hispanic
counterparts. These results might suggest that the activities inside BHC may have been
particularly attractive to African American students and encouraged them to participate in
PA Change Through CSPAP
21
more school-based PA. In light of the vast urban and ethnic health disparities reported in
health literature, interventions that have potential to be effective with populations that are
disproportionately affected by health disparities ought to be investigated further.
Interestingly, there were virtually no significant differences by gender in total
MVPA/SLPA or by MVPA/SLPA by location in the school. By and large, girls’
MVPA/SLPA seemed to be consistent with the male students. This is noteworthy in
contrast to the PA and school PE literature documenting girls’ decreased participation in
school PE and PA generally compared to boys. PA disparities between boys and girls seem
to be especially wide in communities with high numbers of low socio-economic and
minority populations. The results in this study seem to contradict wider research trends and
again illustrate the need for additional inquiries, both quantitative and qualitative. It would
be interesting to identify whether this contradiction would persist using a randomized
control trial design. It would likely be equally illuminating to conduct ethnographic
fieldwork to understand whether there were differences in the ways that boys and girls
perceived and appreciated different aspects of the program.
The MVPA results for the HKCs should also be viewed in context. Overall, students
on average spent 8.69 minutes (14%) in MVPA and 53.63 minutes (86%) in SLPA activity
during each session. However, the HKCs were designed with four parts: 15 minutes – snack
and nutrition education, 20 minutes – mileage club, 20 minutes – active games, and 5
minutes – review and messaging. Hence, in the typical session only 40 minutes were ideally
devoted to activity, meaning that on average students spent 21.7% of the available activity
time in MVPA and 78.3% in SLPA. While this is positive in the sense that these students
had no opportunities for before or after school PA prior to BHC, it is also concerning that

PA Change Through CSPAP
22
MVPA rates are so low, not even coming close to the 50% MVPA benchmark for PE
classes. Moreover, only 25 fourth grade students across the six schools attended HKCs
pre/post. Therefore, while HKCs in this context provided a marginal amount of MVPA,
they were also plagued by sedentary activities and poor attendance. Future research ought
to examine successful strategies to increase MVPA and attendance.
One of the most unique aspects of this study was the connections between the BHC
school based initiative and the PA patterns of parents/guardians and school educators. The
program intersected with parents in many ways from presentations at parent/teacher
conferences and school board meetings, hosting family fitness nights, sending regular
correspondence to parents about the program and healthy living education, and
implementing healthy living homework for students to complete with their
parents/guardians. Results suggest that parents increased their PA levels significantly,
increasing their daily MET-min count from an average of 10,402 to 18,181. In many
respects, parents reported higher activity gains than their children. Of course, parent PA
was measured through self-report techniques so the results need to be considered with
caution. However, there does seem to be some bidirectional impact between the school
initiatives and adult PA levels. Additional inquiries may be able to better understand the
causal links between the two and explain the mechanisms that may have resulted in adults
increasing their PA. Maybe they wanted to support their children’s school reform, maybe
they felt pressured when their children came home emphasizing activity, or maybe the
educational outreach had a substantial impact? More inquiries are needed to unravel those
details.
PA Change Through CSPAP
23
Although not to the same degree, similar results occurred for the school educators.
Their self-reported MET-mins increased 17% from 4,015 to 4,849. These results were not
significant, but that was likely attributed to the fact that there were only 22 administrators
and fourth grade teachers at the six research schools. While not significant, the raw data
suggests that in a larger trial educators’ PA may have increased commensurate with both
students and parents, which, again, would leave open the debate as to why educators’ health
behaviors may have changed as a result of simply offering students more at-school PA
opportunities and encouragement.
To our knowledge, this research provides several unique insights into the CSPAP
literature. It examines total school day PA using objective methods (accelerometers for
students) and differentiates results by school location, gender and race, allowing readers a
more nuanced understanding of impact across the school and student subgroups. It also
connects student PA changes with those self-reported by both parents and educators.
Understanding the impact of multiple components of CSPAP on school PA levels is in its
infancy and this study begins sheds light on this issue. As an initial investigation, it ties
together a number of important issues including: how much additional total PA will result
from a CSPAP intervention? Which segment of the school environment will interventions
be most successful? Will boys/girls and different ethnic groups benefit equally? How might
parents and educators PA be impacted during a CSPAP intervention. Although some
preliminary answers to these questions are offered in this study, it also opens the door to
the need for more inquiries that embrace more stringent quantitative designs and embed
qualitative approaches to help answer the “why” behind much of the quantitative data.

PA Change Through CSPAP
24
Acknowledgments
We would like to thank Blue Cross Blue Shield of Michigan and the Blue Cross
Blue Shield of Michigan Foundation for their generous financial support of this research.
PA Change Through CSPAP
25
References
American Alliance for Health, Physical Education, Recreation and Dance [AAHPERD].
(2013). Comprehensive school physical activity programs: helping students
achieve 60 minutes of physical activity each day [Position statement]. Reston,
VA: Author.
Anderssen, N., & Wold, B. (1992). Parental and peer influences on leisure-time physical
activity in young adolescents. Research Quarterly for Exercise and Sport, 63,
341-348.
Bois, J.E., Sarrazin, P.G., Brustad, R.J., Trouilloud, D.O., & Cury, F. (2005). Elementary
schoolchildren’s perceived competence and physical activity involvement: The
influence of parents’ role modeling behaviours and perceptions of their child’s
competence. Psychology of Sport and Exercise, 6(4), 381-397.
Brustad, R.J. (1996). Attraction to physical activity in urban schoolchildren: Parental
socialization and gender influence. Research Quarterly for Exercise and Sport,
67(3), 316-323.
Carson, R. (2012). Certification and duties of a director of physical activity. Journal of
Physical Education, Recreation & Dance, 83(6), 16-29.
Castelli, D.M., Centeio, E.E., Hwang, J., Barcelona, J., Glowacki, E., Calvert, H., &
Nicksic, H. (in press). The History of physical activity and academic performance
research: Informing the future. Monographs of the Society for Research in Child
Development.

PA Change Through CSPAP
26
Castelli, D., Hillman, C., Hirsch, J., Hirsch, A., & Drolette, E. (2011). FIT Kids: Time in
target heart zone and cognitive performance. Preventive Medicine, 52(11), S55-
S59.
Centers for Disease Control and Prevention [CDC]. (2010). The association between
school based physical activity, including physical education, and academic
performance. Atlanta, GA: U.S. Department of Health and Human Services.
CDC. (2011). Physical activity and health. Retrieved from
http://www.cdc.gov/physicalactivity/everyone/health/index.html. Last access on:
October 6th, 2014.
CDC. (2013). Comprehensive School Physical Activity Programs: A Guide for Schools.
Atlanta, GA: U.S. Department of Health and Human Services
Cohen, J. (1988). Statistical power analysis for the behavioral sciences (2nd ed.).
Hillsdale, NJ: Lawrence Erlbaum.
Craig, C.L., Marshall, A.L., Sjostrom, M., Bauman, A.E., Booth, M.L., Ainsworth, B.E., .
. . & Oja, P. (2003). International physical activity questionnaire: 12-country
reliability and validity. Medicine & Science in Sports & Exercise, 35(8), 1381–
1395.
Donnelly, J. E., Greene, J. L., Gibson, C. A., Smith, B. K., Washburn, R. A., Sullivan, D.
K., . . . Williams, S. L. (2009). Physical activity across the curriculum (PAAC): A
randomized controlled trial to promote physical activity and diminish overweight
and obesity in elementary school children. Preventive Medicine, 49, 336-341.

PA Change Through CSPAP
27
Dorsch, T.E., Smith, A.L., & McDonough, M.H. (2009). Parents’ perceptions of child-to-
parent socialization in organized youth sport. Journal of Sport and Exercise
Psychology, 31, 444-468.
Erwin, H., Beighle, A., Carson, R. L., & Castelli, D. M. (2013). Comprehensive school-
based physical activity promotion: A review. Quest, 65(4), 412-428.
Faulkner, G. E., Buliung, R. N., Flora, P. K., & Fusco, C. (2009). Active school transport,
physical activity levels and body weight of children and youth: a systematic
review. Preventive medicine, 48(1), 3-8.
Freedson, P.S., Melason Jr, E.L., & Sirard, J. (1998) ‘Calibration of the computer science
and applications, Inc. accelerometer’. Medicine and Science in Sports and
Exercise 30(5), 777–81.
Hillman, C. H., Pontifex, M. B., Raine, L. B., Castelli, D. M., Hall, E. E., & Kramer, A.
F. (2009). The effect of acute treadmill walking on cognitive control and
academic achievement in preadolescent children. Neuroscience, 159, 1044-1054.
Institute of Medicine (2013). Educating the Student Body: Taking Physical Activity and
Physical Education to School. Washington, DC: National Academy
IPAQ (2014). Guidelines for data processing and analysis of the International Physical
Activity Questionnaire (IPAQ)—Short and Long Forms. IPAQ Web site.
http://www.ipaq.ki.se/downloads.htm. Last access on: October 6th, 2014.
Jago, R., & Baranowski, T. (2004). Non-curricular approaches for increasing physical
activity in youth: a review. Preventive medicine, 39(1), 157-163.

PA Change Through CSPAP
28
Joens Matre, R. R., Welk, G. J., Calabro, M. A., Russell, D. W., Nicklay, E., & Hensley,
L. D. (2008). Rural–urban differences in physical activity, physical fitness, and
overweight prevalence of children. The Journal of Rural Health, 24(1), 49-54.
Kamijo, K., Pontifex, M.B., O’Leary, K.C., Scudder, M.R., Wu, C.T., Castelli, D.M.,
Hillman, C.H. (2011). The effects of an afterschool physical activity program on
working memory in preadolescent children. Developmental Science, 14, 1046-
1058.
Lee, P.H., Macfarlane, D.J., Lam, T.H., & Stewart, S.M. (2011). Validity of the
international physical activity questionnaire short form (IPAQ-SF): A systematic
review. International Journal of Behavioral Nutrition and Physical Activity, 8,
115 doi:10.1186/1479-5868-8-115
McAlister, A.L., Perry, C.L., Parcel, G.S. (2008). How Individuals, Environments, and
Health Behaviors Interact. In Glanz, K., Rimer, B.K., & Viswanath, K. (Eds.).
Health Behavior and Health Education: Theory, Research, and Practice (4th ed.,
pp.169-188). San Francisco: Jossey-Bass.
McMurrer, J. (2007). NCLB year 5: Choices, changes, and challenges: Curriculum and
instruction in the NCLB era. Retrieved from Center on Education Policy website
http://www.cep-dc.org/publications/index.cfm?selectedYear=2007
Melanson, E.L., Jr. & Freedson, P.S. (1995). Validity of the computer science and
applications, Inc. (CSA) activity monitor. Medicine and Science in Sports and
Exercise, 27, 934-940.
Metzler, M. W., McKenzie, T. L., van der Mars, H., Barrett-Williams, S. L., & Ellis, R.
(2013a). Health Optimizing Physical Education (HOPE): A new curriculum for

PA Change Through CSPAP
29
school programs—Part 1: Establishing the need and describing the model.
Journal of Physical Education, Recreation & Dance, 84(4), 41-47.
Metzler, M. W., McKenzie, T. L., van der Mars, H., Barrett-Williams, S. L., & Ellis, R.
(2013b). Health Optimizing Physical Education (HOPE): A new curriculum for
school programs—Part 2: Teacher Knowledge and Collaboration. Journal of
Physical Education, Recreation & Dance, 84(5), 25-34.
Michigan Department of Education [MDE], Michigan Department of Community Health,
Governors Council on Physical Fitness, Health and Sports (2001). The role of
Michigan schools in promoting healthy weight, a consensus paper (Lansing, MI,
Michigan Department of Education).
Moore, L.L., Lombardi, D.A., White, M.J., Campbell, J.L., Oliveria, S.A., & Ellison,
R.C. (1991). Influence of parents physical activity levels on activity levels of
young children. Journal of Pediatrics, 118, 215-219.
National Association for Sport and Physical Education. (2008). Comprehensive school
physical activity programs [Position statement]. Reston, VA: Author.
Pate, R. R., Davis, M. G., Robinson, T. N., Stone, E. J., McKenzie, T. L., & Young, J. C.
(2006). Promoting physical activity in children and youth a leadership role for
schools: A scientific statement from the American Heart Association Council on
Nutrition, Physical Activity, and Metabolism (Physical Activity Committee) in
collaboration with the councils on Cardiovascular Disease in the Young and
Cardiovascular Nursing. Circulation, 114, 1214-1224.
Pate, R. R., & O’Neill, J. R. (2009). After-school interventions to increase physical
activity among youth. British Journal of Sports Medicine, 43(1), 14-18.
PA Change Through CSPAP
30
Portney, L.G., & Watkins, M.P. (2009). Foundations of clinical research: Applications to
practice (3rd ed.). Upper Saddle River, NJ: Pearson Prentice Hall.
Sallis, J.F., Alcaraz, J.E., McKenzie, T.L., Hovell, M.F., Kolody, B., & Nader, P.R.
(1992). Parental behavior in relation to physical activity and fitness in 9-year-old
children. American Journal of Diseases of Children, 146, 1383-1388.
Sallis, J. F., McKenzie, T. L., Alcaraz, J. E., Kolody, B., Faucette, N., & Hovell, M. F.
(1997). The effects of a 2-year physical education program (SPARK) on physical
activity and fitness in elementary school students. Sports, Play and Active
Recreation for Kids. American Journal of Public Health, 87, 1328-1334.
Sallis, J.F., McKenzie, T.L., Kolody, B., Lewis, M., Marshall, S., & Rosengard, P.
(1999). Effects of health-related physical education on academic achievement:
Project SPARK. Research Quarterly for Exercise Sport, 70(2), 127-134.
Sallis, J.F., Owen, N., & Fisher. E.B. (2008). Ecological Models of Health Behavior. In
Glanz, K., Rimer, B.K., & Viswanath, K. (Eds.). Health Behavior and Health
Education: Theory, Research, and Practice (4th ed., pp.465-485). San
Francisco: Jossey-Bass.
Seefeldt, V., Malina, R.M., & Clark, M.A. (2002). Factors affecting levels of physical
activity in adults. Sports Medicine, 32(3), 143-168.
Shape America. (2014). Let’s Move Active Schools. Retrieved from
http://www.shapeamerica.org/prodev/workshops/lmas/. Last access on October
6th, 2014.
Stokols, D. (1992). Establishing and maintaining healthy environments: toward a social
ecology of health promotion. American Psychologist, 47(1), 6.

PA Change Through CSPAP
31
Strong, W.B., Malina, R.M., Blimkie, C.J.R., Daniels, S.R., Dishman, R.K., Gutin, B., . .
. & Trudeau, F., (2005). Evidence based physical activity for school-age youth.
The Journal of Pediatrics, 146(6), 732-737.
Troiano, R. P., Berrigan, D., Dodd, K. W., Mâsse, L. C., Tilert, T., & McDowell, M.
(2008). Physical activity in the United States measured by accelerometer.
Medicine and Science in Sports and Exercise, 40(1), 181-188.
United States Department of Health and Human Services [USDHHS]. (2008). 2008
physical activity guidelines for Americans. Washington, DC: Author. Retrieved
from http://www.health .gov/PAguidelines/pdf/paguide.pdf. Last access on:
October 6th, 2014.
USDHHS. (2012). Physical activity guidelines for Americans mid-course report:
Strategies to increase physical activity among youth. Washington, DC: Author.
Retrieved from http://www.health.gov/paguidelines/midcourse/PAG_Mid-
course_Report.pdf. Last access on October 6th, 2014.
U.S. White House Task Force on Childhood Obesity (2010). Solving the problem of
childhood obesity within a generation. White House Task Force on Childhood
Obesity Report to the President. Washington, DC: Executive Office of the
President of the United States.

PA Change Through CSPAP
32
Figure 1. Social ecological framework as described by Sallis et al. (2008).
Public Policy
Community
Organizational
Interpersonal
Intrapersonal

PA Change Through CSPAP
33
Table 1.
CSPAP and SEF alignment
CSPAP Component SEF level of influence
Physical Education Intrapersonal
PA during school Intrapersonal, Organizational
PA before and after school All levels
Staff involvement Interpersonal, Organizational
Family & community engagement All levels
Table 2. Average Number of Minutes During the School Day (Each School is Weighted
Evenly)
Pre Average Post Average
Minutes Percent Minutes Percent
Physical Education 15 4% 14 3%
Lunch and Recess 51 13% 60 13%
Classroom 302 76% 280 62%
Specials 28 7% 35 8%
Healthy Kids Club 0 0% 63 14%
Total 396 100% 452 100%
Table 3. RM-ANOVA results for students’ MVPA within physical education, recess,
classroom time, and specials.
F -Value P level 2 Mpre (SD) Mpost (SD)
Percent of
Minute
Increase
Percent
Change in
Category
Physical Education (1,300) = 17.61 < .001 .06 1.10 (1.11) 1.70 (1.68) 54.5% 65.7%
Lunch & Recess (1,300) = 21.68 < .001 .07 3.46 (4.51) 4.55 (4.38) 31.5% 11.7%
Classroom Time (1,300) = 45.86 < .001 .13 2.70 (3.71) 4.27 (4.51) 58.1% 68.5%
Specials (1,300) = 1.31 = .25 .01 .39 (.72) .32 (.79) -- --
Note. Percent of minute increase represents the increase in total MVPA minutes from pre
to post. The Percent change in category represents the amount of time spent in MVPA as
a percent of total category time from pre to post.

PA Change Through CSPAP
34
Table 4. RM-ANOVA results for students’ SLPA within physical education, recess,
classroom time, and specials.
F -Value P level 2 Mpre (SD) Mpost (SD)
Percent
of
Minute
Change
Percent
Change in
Category
Physical Education (1,300) = 2.58 = .11 .01 13.98 (9.11) 12.88 (7.19) -- --
Lunch & Recess (1,300) = 55.78 < .001 .16 49.72 (11.64) 54.33 (10.97) + 9% - 7%
Classroom Time (1,300) = 87.50 < .001 .23 299.28 (37.59) 278.42 (22.99) - 7% + .3%
Specials (1,300) = 69.67 < .001 .19 27.96 (13.40) 34.81 (10.13) + 25% + .4%
Note. Percent of minute increase represents the increase in total SLPA minutes from pre
to post. The Percent change in category represents the amount of time spent in SLPA as a
percent of total category time from pre to post.