physical fitness changes in male and female college
TRANSCRIPT

University of Nebraska at Omaha University of Nebraska at Omaha
DigitalCommons@UNO DigitalCommons@UNO
Student Work
5-1-1985
Physical fitness changes in male and female college basketball Physical fitness changes in male and female college basketball
players players
Denise M. Fandel University of Nebraska at Omaha
Follow this and additional works at: https://digitalcommons.unomaha.edu/studentwork
Recommended Citation Recommended Citation Fandel, Denise M., "Physical fitness changes in male and female college basketball players" (1985). Student Work. 656. https://digitalcommons.unomaha.edu/studentwork/656
This Thesis is brought to you for free and open access by DigitalCommons@UNO. It has been accepted for inclusion in Student Work by an authorized administrator of DigitalCommons@UNO. For more information, please contact [email protected].
PHYSICAL FITNESS CHANGES IN MALE AND FEMALE
COLLEGE BASKETBALL PLAYERS
A Thesis
Presented to the
School of Health, Physical
Education, and Recreation
and the
Faculty of the Graduate College
University of Nebraska
In Partial Fullfillment
of the Requirement for the Degree
Master of Science
University of Nebraska at Omaha
by
Denise M. Fandel

UMI Number: EP73296
All rights reserved
INFORMATION TO ALL USERS The quality of this reproduction is dependent upon the quality of the copy submitted.
In the unlikely event that the author did not send a complete manuscript and there are missing pages, these will be noted. Also, if material had to be removed,
a note will indicate the deletion.
UMI EP73296
Published by ProQuest LLC (2015). Copyright in the Dissertation held by the Author.
Microform Edition © ProQuest LLC.All rights reserved. This work is protected against
unauthorized copying under Title 17, United States Code
ProQuest LLC.789 East Eisenhower Parkway
P.O. Box 1346 Ann Arbor, Ml 48106 - 1346

THESIS ACCEPTANCE
Accepted for the faculty of the Graduate College, University of
Nebraska, in partial fulfillment of the requirements for the degree
Master of Science, University of Nebraska at Omaha.
Committee
Name Department
HPER
HPER
l c , £ 1/ PSYCHOLOGY
_____ Q
/lvr.-l H <<&S-

ACKNOWLEDGEMENTS
I would sincerely like to thank the members of my committee, Dr. Rick
Latin, Dr. Joseph LaVoie and especially Dr. Kris Berg, the chairperson of
my committee for their comments, time and guidance throughout this study.
Secondly l would like to thank Fran Martin and Robbl Burk for their time and patience in preparing this manuscript.

DEDICATION
To Emogene Nelson - her wisdom, guidance, friendship and courage were
an inspiration to many of us. Her spirit will live in all she helped and
cared for.
To my family, especially my parents. Without their support and motivation
to be the best I could be I would not be what I am today. Their love for all of
us has always been visible and with us wherever we go.

iii
TABLE OF CONTENTS
ACKNOWLEDGEMENTS.................................... i
DEDICATION....................................................... ii
TABLE OF CONTENTS................................................ iii
LIST OF TABLES................................................... . v
ABSTRACT . vi
Chapter
I INTRODUCTION..... ..... 1
II THE PROBLEM........... 3
Statement of the Problem. ...... 3Hypothese.................................. 3Delimitations ......... 3Limitations.......... 4
III "REVIEW OF RELATED LITERATURE ................ 5
•cEnergyT Systems Predominant-in-Basketball'i V... 5.Response €o";Tfaining . r..................... 7
Cardiorespiratory-Endurance............. 7Muscular"Fi:tne¥s . 8iBody' Composition Z.-. ............. 9
Comparison—of ~tHe -Male" and F emale Response<_ to-TrairingSi......... 10
.rjPhysiological—Changes- During the Competitive^^.easonv^-;.......... 11
IV..........METHODS..................... 14
Description of _Subjects................ .... 14Description' of " Treatments.......... 14
£'-Testihg“PfboeduufeFiS-.::. /.................... 15VO2 Max Test . -........... 15
^Lower-ExtremiCy"Strength7^Pdwer:ahd::"'-Muscuiar-Endurance:;-.' ............ 16
Hydrostatic Weighing.............. .... 16Statistical Treatment................“...... 17
V..........RESULTS................... 18
Within Group Changes....................... 18Between Group Changes................ 19
iv
VI ^DISCUSSION.. . . ................................... 26Cardiorespiratory Changes ............ 26Muscular Strength....... 27Muscular Power and Endurance ............ 27Body Composition...... 28Between Group Changes ..... 29, Cardiorespiratory Changes.............. 29
Muscular Strength....................... 29Muscular Power and Endurance. ..... 30Body Composition. ........... 30
VII SUMMARY AND CONCLUSIONS........ .... 32<Summary. \.................................. 32Cone lus ions..................... 32Rec commendations............ 33
REFERENCES .................................... 34
APPENDIX 38
12
3
4
5
67
89
1011
v
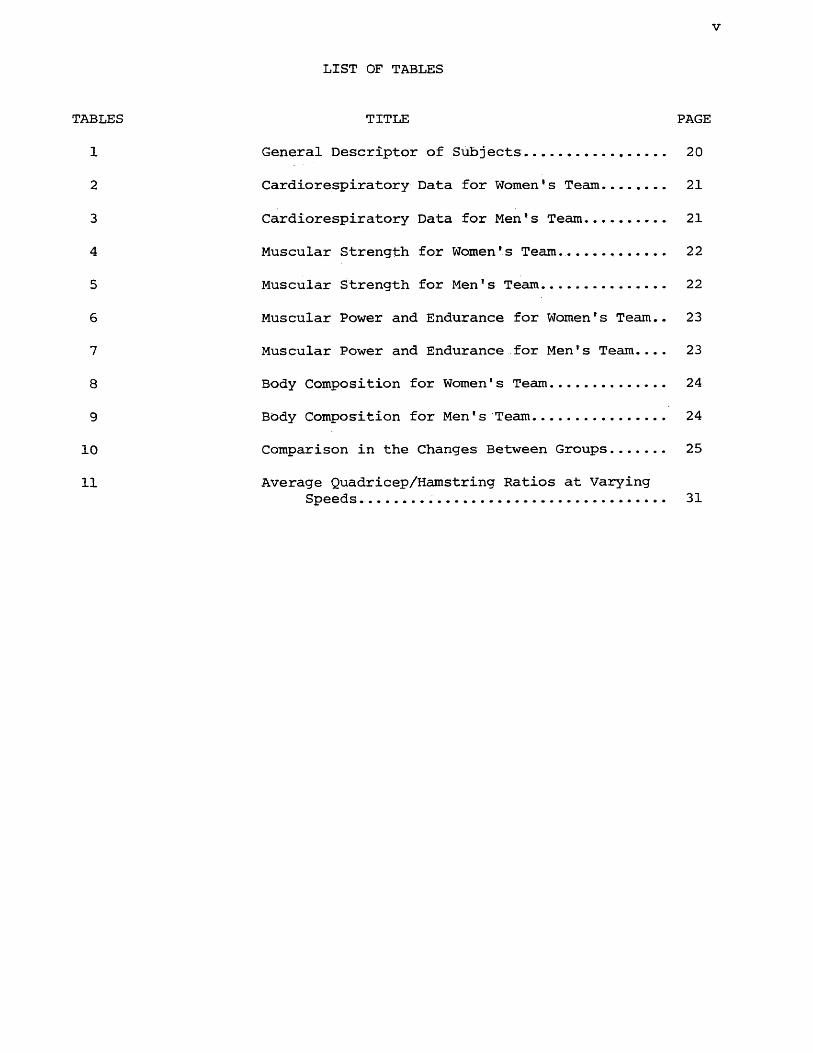
LIST OF TABLES
TITLE PAGE
General Descriptor of Subjects................. 20
Cardiorespiratory Data for Women's Team . .. 21
Cardiorespiratory Data for Men's Team.......... 21
Muscular Strength for Women's Team. ,..... 22
Muscular Strength for Men's Team............... 22
Muscular Power and Endurance for Women's Team.. 23
Muscular Power and Endurance for Men's Team.... 23
Body Composition for Women's Team.............. 24
Body Composition for Men's Team................ 24
Comparison in the Changes Between Groups....... 25
Average Quadricep/Hamstring Ratios at VaryingSpeeds...................... 31

Abstract
Nine female and four male basketball players at the University of Nebraska
at Omaha completed pre- and post-season testing to measure and compare the
physiological changes which occurred over the course of a competitive season
of intercollegiate basketball. Cardiorespiratory fitness (VO2 max), muscular
strength, muscular endurance and body composition were the variables measured.
The results showed a significant (p=.05) increase in VO2 max (l’min- ) for
both the males and females. The women showed a significant (p=.05) increase
in VC>2 max (ml*kg”^.min” ) . No other significant changes occurred within
either group. Between group comparisons found a significant (p=.01) decrease
in lower extremity strength in the females.
The results of this study show that for this group of U.N.O. Basketball
players, similar physical fitness changes occurred in each group with the
females having a significant decrease in lower extremity strength over the
course of a competitive season of college basketball.
CHAPTER I
INTRODUCTION
Research of the past 20 years has produced numerous descriptive profiles
of a variety of male athletic populations. Athletic populations studied have
included major league baseball (Coleman, 1981), men's volleyball (Conlee,
McGown, Fisher, Dalsky & Robinson, 1982; Gladden & Colacino, 1978), and foot
ball (Wilmore, 1972). The increased female participation in sports of the past
ten years has stimulated research on female athletes. Female athletic populations
studied include volleyball (Hassler, Morrow & Jackson, 1978; Kovaleski, Parr,
Nornak & Roitman, 1980; Spence, Disch, Fred & Coleman, 1980), basketball (McArdle,
Magel & Kyvallos, 1971; Sinning & Adrian, 1968; Sinning, 1973), distance runners,
(Vaccaro, Morris & Clarke, 1975), and pentathletes (Kraehnbuhl, Wells, Brown &
Ward, 1979). The majority of theses studies provide descriptive data on the
physiological parameters of maximal oxygen consumption (VC>2 max), muscular
strength, muscular endurance and body composition. These data are useful in
that they provide physiological profiles of athletes which may serve as guide
lines for recruiting athletes with similar capacities or training levels.
However, these profiles represent measurements taken at random times during
the competitive season, they do not provide data on the changes that occur
during the season (Grenn & Huston, 1975; Hanson, 1975; Kelly, Gorney & Kalm, 1978;
McArdle, Magel & Kyvallos, 1971; Shaver, 1974; Sinning, 1973; Sinning & Adrian,
1968).
Considerable research has dealt with the physiological response of male
athletes to training (Ekblom & Hermanson, 1968; Ekblom, Astrand, Saltin, Stenberg
& Wallstrom, 1968 Faria, 1970; Fox, Bartels, Billings, O'Brien, Bason & Mathews,
1975; Karlsson, Nordesjo, Jorfeldt & Saltin, 1972; Pollock, Cureton & Greninger,
1

1969; Saltin & Astrand, 1967). A lesser amount of data are available with
female athletes (Eisenman & Goldberg, 1975; Michael, Evert & Jeffers, 1972;
Wallace, 1975). These studies demonstrated that the female response to train
ing is similar to that of men. Decreases in resting heart rate, total body
weight and percent body fat were found as well as increases in V02 max.
Several studies have investigated the physiological changes occuring
over the course of a season of competition. Sports studied include ice
hockey (Green & Huston, 1975). college wrestlers (Kelly, Gorney & Kalm, 1978),
Nordic ski racers (Hanson, 1975), and female college basketball players
(McArdle, Magel & Kyvallos, 1971; Sinning, 1973; Sinning & Adrian, 1968).
Hanson (1975) found no significant changes in percent body fat, V02 max,
or respiratory exchange ratio (R) in Nordic ski racers. Hanson concluded that
this was possibly due to the strenuousness of in-season travel, initial level
of conditioning, the increasingly large amount of time spent in mental and
technical preparation and reduced time for practice in the latter part of the
season.
It was the purpose of this study to examine and compare changes in
cardiorespiratory fitness, muscular strength, muscular endurance and body
composition of male and female college basketball players over the course
of a competitive season. Current season lengths, competitive schedules and
training programs are becoming increasingly similar among many men1s and
women's athletic teams. Little if any research has recently been completed
comparing male and female athletes in similar athletic activities. This study
was designed to make such comparisons.
CHAPTER II
THE PROBLEM
Statement of the Problem
The purpose of this study was to examine and compare cardiorespiratory
fitness, muscular strength, muscular endurance and body composition of male
and female college basketball players over the course of a competitive season.
Hypotheses
It was hypothesized that significant changes could occur in both male
and female athletes in the following variables:
1. increase in maximal oxygen consumption (VO2 max l^min” ", ml-kg“- --min“l)
2. increase in muscular strength
3. increase in muscular endurance
4. increase in lean body weight
5. decrease in fat weight
6. decrease in percent body fat
Delimitations
Subjects were four male and nine female collegiate basketball players at
the University of Nebraska at Omaha. The mean age for each group was 20.5
and 20.3 for the men and women respectively. The practice sessions lasted
two and one-half hours. Each group competed an average of two days per week
over a 22 and 24 week period for the women and men respectively. The length
of this study coincided with the pre-competitive and competitive seasons of
each team.
3

4Limitations
Injuries, playing time, practice effort, selection of subjects and the
number of players competing and practicing with each team could not be controlled
and may have affected the results of this study. The small number of athletes
participating in this study may have affected the power of the statistical
tests and limited the generalizations about the results.

CHAPTER III
REVIEW OF RELATED LITERATURE
The review has been divided into sections dealing with 1) the energy
systems predominant in basketball# 2) the physiological response to training,
and 3) past research dealing with the physiological changes that occur over
the course of a season. Studies pertaining to these topics will be discussed
in this chapter.
Energy Systems Predominant in Basketball
The human body produces energy through aerobic and anaerobic metabolic
pathways. Exercise physiologists have classified these pathways into three
systems which facilitate understanding the dynamics of muscle substrate utili
zation. Fox & Mathews (1981) classify these as 1) the aerobic system# 2) the
lactic acid system and 3) the phosphagen system (ATP-CP). All three energy
systems resynthesize ATP# the chemical which provides energy for muscle con
traction. Each mole of ATP yields seven to 12 kilocalories of energy when the
phosphate bond is broken and ADP is formed (Fox & Mathews# 1981). Each of these
systems produces a varying quantity of ATP from each mole of substrate used.
Aerobic metabolism relies primarily upon the oxidation of carbohydrate and
fat with protein playing a minor role. It is the most productive of the three
energy systems in terms of the quantity of ATP produced. From one molecule of
glycogen, aerobic metabolism can produce 39 moles of ATP. This is accomplished
through the reactions of Kreb's Citric Acid Cycle and the respiratory chain
transport system. This is the primary energy system used in work sustained
for more than several minutes.
A variety of researchers have provided data on the VC>2 max capabilities of
both trained and untrained subjects. Drinkwater (1973) has reported VO2 max
ranges for females from 30-40 ml*kg“ . min- in untrained subjects. Saltin &
Astrand (1967) have reported values for female 800-1500 meter runners at— 1 — 1 — n — l *52 ml* kg * m m A and a value of 20 ml* kg *min for housewives. VC>2 max values
for men vary in much the same way. Drinkwater (1973) reported ranges for un--1 -1trained men at 45-53 ml*kg .min while Saltin & Astrand (1967) reported male
3000 meter runners with values averaging 58 ml*kg ^*min“ in bicycle ergometer
tests. Costill/ Daniels, Evans, Fink, Kraehnbuhl and Saltin (1976) have reported
values averaging 70 ml*kg ^-min in Nordic ski racers.
Activities of short duration such as the 100 and 400 meter dashes, volley
ball, badminton and basketball require anaerobic metabolism as their major
source of energy (Fox & Mathews, 1981; deVries, 1980). Muscle phosphagen is
the most rapidly available source of ATP for use by the muscles. When phosphate
is removed from the ATP molecule, a large amount of energy is liberated and
immediately available for use. This makes it the energy system which is used
for short duration, explosive work. The half-life of ATP-CP is 20 seconds which
allows it to be replenished rapidly during the activities mentioned above (deVries
1980).
Lactic acid metabolism results from anaerobic glycolysis and the terms are
often used interchangeably. It is a second system in which ATP is resynthesized,
within the muscle. In this system carbohydrate is broken down through 12
separate chemical reactions. These reactions produce one to three moles of ATP
per molecule of glucose split. When lactic acid accumulates to high levels
in the muscles it inhibits a number of chemical reactions and interferes with
the contractile mechanism of muscle. Untrained subjects are able to tolerate
60 to 70 mg% in short term maximal work while elite athletes can tolerate
120 to 140 mg% (Ekblom, Astrand, Saltin, Stenberg & Wallstrom, 1968; Fox & Mathews

Grimby, Huggendal & Saltin, 1967). Although the ATP yield per unit of time
from anaerobic glycolysis is less than that of phosphagen, energy is still
produced at a rapid rate (1.6 moles of ATP per minute for phosphagen as
compared to 3.6 moles for ATP-CP) (Fox & Mathews, 1981).
Basketball is an explosive yet relatively prolonged sport. There are enough
breaks in play and changes in activity to allow ATP-CP resynthesis and to keep
lactic acid levels relatively low during much of the game. de Vries (1980),
Fox & Mathews (1981) and Wilmore (1982) all classify basketball as a sport
85 percent dependant upon the ATP-CP system and 15 percent dependant upon the
lactic acid system for energy. These data suggest the importance of measuring
the changes in the anaerobic energy system as well as the aerobic system as the
conditioning responses may be quite specific.
Response to Training
Cardiorespiratory Endurance
The most frequently used measure of cardiorespiratory fitness is presently
V02 max. Untrained young adults have been reported as having V02 max scores
ranging from 30-40 ml* kg” -* min“ in females and 45-53 ml-kg“ *. min“ in males
Drinkwater (1973). In a study using teenage girls, Michael, Evert & Jeffers
(1972) found significan increases in VC>2 max, after 12 weeks of interval training.*Eisenman & Golding (1975) found significant increases in VO^ max and a sig
nificant decrease in HR max. The subjects in this study were girls and young
women who trained 14 weeks, three days per week for 30 minutes. They also
found that age did not significantly affect the increases. Ekblom et al (1968)
found a 16.2 percent increase in V02 max and a 52 percent increase in total
work output in men over a four month training period consisting of cross
country running.
Muscular Fitness
A discussion of muscular fitness and the changes which occur as a result
of training need to cover both the general changes as they relate to strength,
endurance and hypertrophy as well as the biochemical changes within the muscle
cell. Retention of strength and endurance as well as the mode of exercise needs
to also be considered in discussing the response to training.
Wilmore (1974) found significant strength gains in both men and women
consequent to a 10 week weight training program. Similar results were obtained
by Brown & Wilmore (1974) using a group of women as subjects on a program of
three days per week and 80-90 percent of a one repetition maximum lift (1RM).
Mayhew & Gross (1975) found similar significant increases in strength and
decreases in fat weight in women on a high intensity, high resistance training
program. Gordon (1967) and Goldberg (1975) found varying degrees of muscular
hypertrophy with a variety of different exercise modes (i.e. 3 sets of 10 rep
etitions versus 3 sets of 5 repetitions). Gordon stated that the increase was
due to an increase in sarcoplasmic proteins. Goldber (1975) defined the
reason for individual muscle hypertrophy as follows. 1) increased number and
size of the myofibrils per muscle fiber, 2) increased total amount of con
tractile proteins in the myosin filaments, and 3) increased capillary density.
Gonyea (1980) studied cats and found a 20.5 percent increase in muscle fiber
number in the group lifting a heavy weight ( 1 kg) due to longitudinal fiber
splitting. The grouplifting the lighter weights ( 1 kg) showed no significant
increase. Dons, Bollerup, Bonde-Peterson & Hancke (1979) found that a high,
percentage of fast twitch fibers is a prerequisite for achievement of large gains
in strength. Fast twitch muscle fiber stimulation increases progressively with
greater levels of tension. Elite sprinters characteristically show fast twitch
fibers distributions of 75-80 percent as compared to endurance athletes with
25-30 percent distribution of fast twitch fibers (Costill et al, 1976? de Vries,
91982; Fox & Mathews# 1981). Fast twitch fibers show the greatest amount of
hypertrophy in response to a weight training program (Fox & Mathews, 1981).
Muscular strength can be increased by a variety of training methods.
Walderman & Stull (1969) used a training program of high repetitions and low
intensity resistance training over eight weeks and found a significant (p<.05)
increase in strength. This type of training program produced a greater improvement
in muscular endurance than strength although both were significantly increased.
Berger (1962) and Berger (1963) studied the effects of three different weight
training programs with a frequency of three days per week for eight to 12
weeks. Three groups combined different numbers of sets and repetitions to deter
mine optimal training loads for maximal strength gains. Clarke & Stull (1970)
and Stull & Clarke (1970) found that both the strength and muscular endurance
were developed equally using either a low repetition, high load or high
repetition, low load program.
Biochemically the muscle cell responds to strength training with the
transition of fast oxidative flycolytic (FOG) cells to fast glycolytic (FG).
Goldberg (1968) found an increase in muscle weight proportional to the increase
in amino acids in the muscle cell. In training using a bicycle ergometer
Gollnick et al (1973) found increases in the percentage are of slow twitch
fibers when subjects trained for endurance purposes. The oxidative capacity
for both fiber types increased significantly (p-^.Ol) from pretraining measurements.
Gollnick (1972) found that fiber type differed in men according to the type
of training or sport in which, they engaged. Fast twitch fibers were dominant
in the group which trained anaerobically. They also found an increase in
succinate dehydrogenase (SDH) levels of those subjects who were endurance trained.
Body Composition
Discussion of body composition is simplified when total bodu weight is divided
into fat weight and lean weight. Training can affect each component concurrently.
10
Wilmore (1974) found decreases in fat weight and significan increases in lean
body weight (LBW) in men and women after a 10 week training program of weight
lifting. The increase in LBW was due to an increase in muscle mass. Wallace
(1975) found a decrease in fat weight in college age women participating in
moderate aerobic and weight training exercises after four months of training
Pollock, Cureton & Grenniger (1974) found similar changes occur with endurance
exercises. Pollock found decreases of six to eight pounds of fat and increases
of two to three pounds of LBW during a jogging program. Pollock (1974) also
found decreases in fat weight with varying modes of exercise including aerobic
work, interval training and a combination of the two. Similar changes were
observed by Boileau (1971) in adult men. Greater fat loss was noted in
obese men when compared to lean men. This was probably due to the increased
potential for loss by the former.
Comparison of the Male and Female Response to Training
Regarding strength, the difference between males and females lies in the
females lower strength to body weight ratio. When expressed in terms of total
body weight the female is generally 30 percent weaker mostly in upper body
strength than their male counterparts (Wilmore, 1974; Hettinger, 1961). The
difference is less pronounced when body weight is expressed in terras of LBW.
Wilmore (1974) found that leg strength in females was equivalent or slightly
better than male's when expressed in terms of LBW. The female response to
weight training (i.e., percent gain) does not differ from that of the male except
in terms of absolute strength gains as demonstrated by Wilmore (1974).
The female response to endurance training foes not differ from that of the
male. The American College of Sports Medicine C1980) makes no distinction
11
between sexes in their guidelines for endurance training methods (i.e., frequency,
intensity or duration). Drinkwater (1973) has reported the female response to
training to be very similar to that of men is regards to their physiological• •changes in HR max and VO2 max. When VO2 max values are expressed in terms of LBW
the difference is minimal, as little as five percent (Davies et al, 1972). How
ever, the female is at a disadvantage in most sports in terms of the extra
adipose tissue that is carried. In swimming events this extra adipose tissue
may be an advantage. This contentions is supported by the smaller differences
in performances between male and female swimmers as compared to running.
The difference in body composition between males and females is substantial
especially when discussing athletic performances and mechanical advantages. If
the average female and male adult are compared, the female is typically three
to four inches shorter, 25-30 pounds lighter in total body weight, 10-15 pounds
heavier in adipose tissue and 40-45 pounds lighter in terms of Free Fat Weight
(FFW) (Fox & MAthews, 1981). When comparing the athletic female on a similar
scale, she is still only at the level of the average non-athletic male (Fox &
Mathews, 1981). Although the response to the varied training regimens is
similar, the initial differences in body composition must be considered when
comparing performances.
Physiological Changes During the Competitive Season
Research, studying physiological changes in athletes through their
competitive season is relatively scarece. Research that has been completed
examined predominantly physiological variables such as VO2 max, HR max, percent
body fat, muscular strength and muscular endurance and their changes over the
course of a season. A variety of sports has been examined with both male and
femal subjects at the collegiate and national level. Throughout the research,
12the high level of conditioning year round of each of these populations and
the relatively small changes in these:- physiological variables seems related.
This is particularly true in the research of Hanson (1970)* He measured the
U.S. Nordic Ski Team pre- peak- and post-season. Body composition remained
stable and there were small increases in VO^ max (l*min"l) scores although not
significant. Significant physiological changes occured in VC>2 max (ml*kg“^-min”l)
at the time these athletes changed from dry land training to snow training
and the competitive season. Hanson mentioned the increase in travel and competition
which decreased the amount of time available to train as a possible factor affecting
the variables.
Kelly, Gorney & Kalm (1978) investigated cardiovascular fitness and body
composition changes using collegiate wrestlers. They found that body composition,
VC>2 mak anthropometric measurements, percent body fat and lean body weight re
mained relatively stable throughout the season. Strength measurements of knee O Oextension at 180/second, shoulder extension at 30/second, and shoulder extension,
knee flexion, knee extension and hip flexion at 18C# second all increased sig
nificantly during the season. These measurement were done pre- peak- and
post-season over six months.
Green & Huston (1975) studied seasonal changes in ice hockey players. They
evaluated VC>2 max, HR max and skinfold thickness1 as well as anaerobic alactacid
power. They found all variables changes very little except the anaerobic power
measurements. This is logical in light of the anaerobic nature of the sport and
the specificity of training.
McArdle, Magel & Kyvallos (1971) investigated the physiological changes
of women basketball players through a three month season. They found no
significant changes in VO2 max or HR max. Sinning & Adrian (1968) examined
17 female basketball players through a two month season of six person basketball.
They found a significant increase in VO^ nax. In a similar study by Sinning (1973),
14 female basketball players using a fiver person game were evaluated. Signifi
cant increases in VC^ max (ml-kg*“ *min”* ) , (ml*kgLBW“ -min“ ) LBW and body
weight were found. Mean VO2 max values for the studies previously mentioned are
as follows: 35.5 (ml-kg min , 44.8 (ml«kg ^-min“^), 34.3 (ml*kg“^-min“l) for
McArdle# Magel & Kyvallos (1971) , Sinning (.1973) , and Sinning & Adrian (1968)
respectively.
Extensive comparisons of men and women in similar sports have not been made.
Recent information points to the importance of anaerobic power in sports such
as basketball, volleyball and football (Conlee, McGowan# Fisher, Dalsky &
Robinson, 1982; Green & Huston, 1975). Specificity of training is an
important concept by which athletic teams are trained. The measurement of these
training programs needs to be as specific as possible to the different energy
systems being used in that activity.

CHAPTER IV
METHODS
Description of Subjects
Subjects were nine female and four male members of the University of
Nebraska at Omaha basketball teams. Subjects and legal guardians read and
signed an informed consent form which was approved by the Institutional
Review Board of the University of Nebraska.
Description, of Treatment
Subjects trained and competed as members of the University of Nebraska
at Omaha (UNO) men's and women's basketball teams. All subjects followed
similar training programs. Supervised practices began the first week of
October. Practices included seven to 10 minutes of static stretching by the
men's team and 15 minutes of Proprioceptive Neuromuscular Facilitation techniques
by the women. Each was designed to maintain and/or enhance flexibility. The
next 70 to 90 minutes were devoted to skill and strategy work to develop the
aerobic and. anaerobic conditioning of each group. This skill/strategy work
comprised the majority of most practice sessions. It was followed by a 15
minute period of specific conditioning work for the anaerobic system, usually
consisting of half and full court sprints with timed rest intervals. Following
the women's practice, a light period of cooldown stretches were done. The men
had no structured cooldown. Resistance training occured three times per week
in October. This was a three sets of 10 repetition program at 65-75 percent of
a one repetition maximum. The program was designed for upper and lower extremity
14

15strengthening. During the competitive season the same resistance training
program was decreased to one day per week and was often missed due to facility
scheduling difficulties.
Each team was limited to 28 games by the National Collegiate Athletic
Association. The men's team did advance to regional tournament play and had
two additional games. The length of the season was 22 and 24 weeks for the
women's and men's teams respectively. The training program is typical of most
college basketball teams as it is designed to build cardiorespiratory fitness,
muscular endurance and to refine skills and tactics via a supervised weight
training and aerobic training program as well as scrimmages and drills.
Testing Procedures
VO Max Test 2Subjects underwent a treadmill. test to determine maximal oxygen consumption
(VO max) using open circuit spirometry. The test began at zero percent grade
at three mph for three minutes. For stage two of the test the speed was in
creased to six mph for two minutes. The speed was then increased one mph every
two minutes until and eight mph pace was reached for the females and nine mph
for the males. At this point the pace was kept constant and the percent grade
was increased two percent every two minutes. This procedure was continued
until the subject reached exhaustion. Exhaustion was determined by the following
criteria: 1) subject was within 10 beats per minute of estimated maximal heart
rate (220 - age), 2) a respiratory exchanges ratio of 1.00 of greater was reached,
3) reduced coordination and dyspnea wereobserved. Inspired air was collected
and measured using a Parkinson-Cowen LD-4 dry gas meter. A Beckman LB-2
carbon dioxide analyzer and Applied Electrochemistry S-3A oxygen analyzer were
used to measure gas fractions. The analyzers were calibrated prior to each test
using a known reference gas.

16
Lower Extremity Strength,Power and Muscular Endurance Tests
Subjects were measured for quadriceps and hamstring strength, power and
muscular endurance using anCybex II Isokinetic Dynamometer. A Cybex II
Dual Channel Recorder and Cybex Data Reduction Computer were used to collect data.
The subjects were directed to warm-up with five minutes of light exercise followed
by five minutes of lower extremity stretching concentrating on the quadricep,
hamstring and gastocnemius muscles. They were then seated on a Cybex II Lower
Extremity Testing Chair. Restraining belts were placed across the limb being
tested and across the chest with the arms placed across the chest. One warm
up repetition at the testing speed was allowed before each test to familiarize
the subject with the test speed. Three repetitions at 30, 90, 180, 240 and 300
degrees per second constituted the measures of strength and power. Peaque torque
at 30°/second was used for data on strength. All data were expressed in foot
pounds of work done. 15 seconds of rest were allowed between each trial.
Muscular endurance was measured using a 25 repetition work test at 180°/
second. Subjects flexed and extended their knee joint for 25 repetitions. The
subjects score consisted of foot-pounds of work for the first five repetitions
which constituted the power measurement and the total work done was the measure
of muscular endurance. The subjects began each testing session with the .tests
for strength and ended with the 25 repetition work test.
Hydrostatic Weighing
Total body volume and density were determined using hydrostatic weighing
Body density was converted to percent body fat using the Siri equation (Wilmore,
1982). Subjects were seated in a chair suspended from a Chatillon Autopsy
Scale in a hydrostatic weighing tank. Underwater weight of the subjects were
measured after the subject had performed maximal expiration and were totally
submerged. Seven to 10 trials were performed by each subject to account for
the learning effect associated with this procedure. The mean of the three
most similar and heaviest values were averaged to determine underwater body weight.
Residual volume was estimated based upon the age, height and sex of the subject
Statistical Treatment
1. A correlated t-test was used to determine within group changes.
2. An independant t-test was used to determine between group changes
3. An alpha level of .05 was used to describe statistical significance.
CHAPTER V
RESULTS
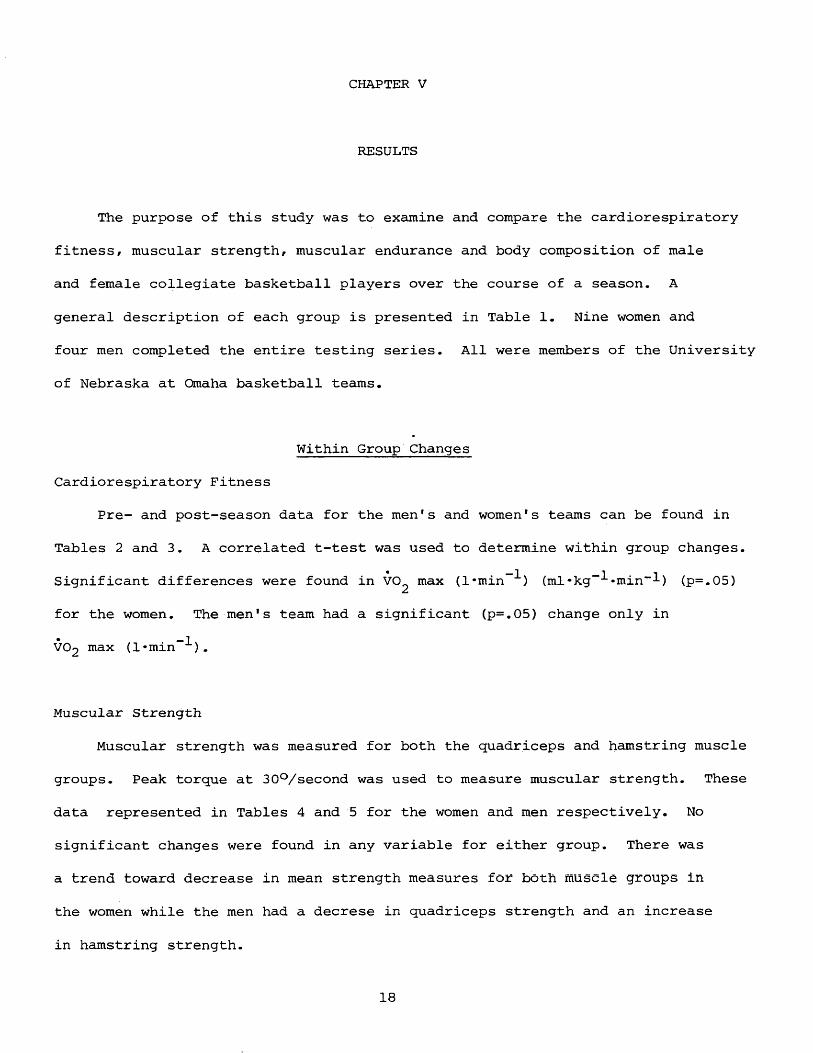
The purpose of this study was to examine and compare the cardiorespiratory
fitness, muscular strength, muscular endurance and body composition of male
and female collegiate basketball players over the course of a season. A
general description of each group is presented in Table 1. Nine women and
four men completed the entire testing series. All were members of the University
of Nebraska at Omaha basketball teams.
Within Group Changes
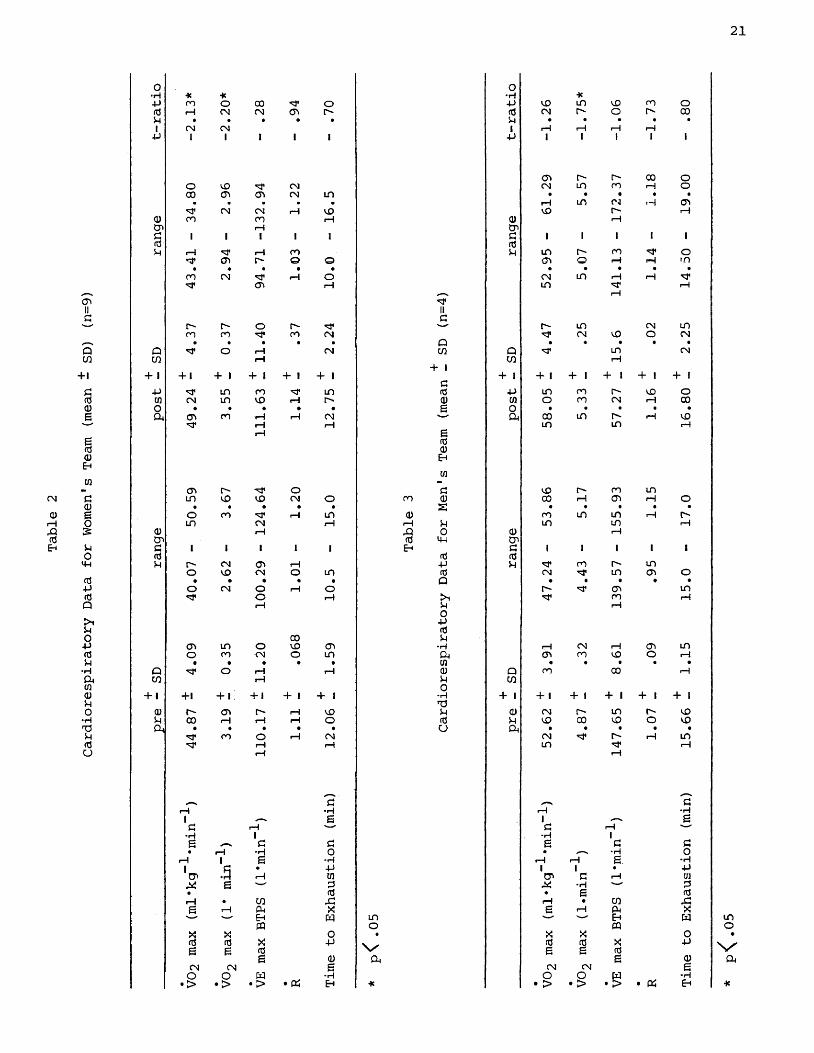
Cardiorespiratory FitnessPre- and post-season data for the men's and women's teams can be found in
Tables 2 and 3. A correlated t-test was used to determine within group changes.
Significant differences were found in VO^ max (1-min ) (ml*kg ■‘■•min-1) (p=.05)
for the women. The men's team had a significant (p=.05) change only in
VO2 max (l«min ) .
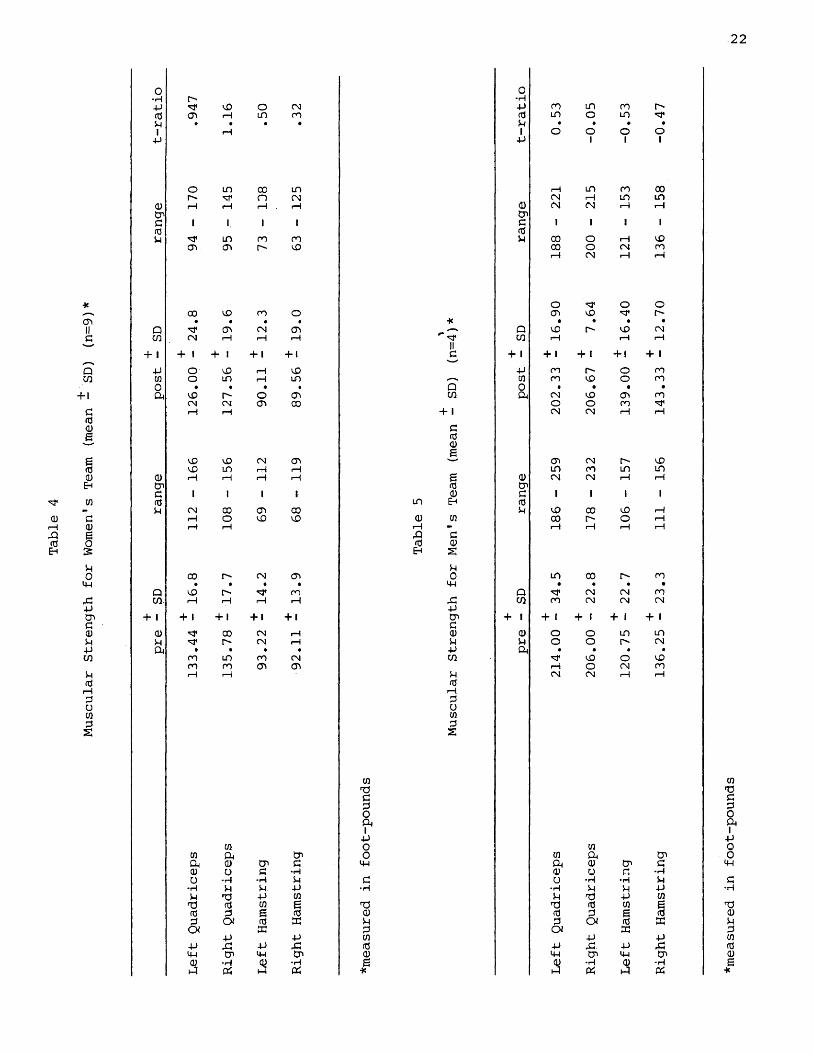
Muscular StrengthMuscular strength was measured for both the quadriceps and hamstring muscle
groups. Peak torque at 30°/second was used to measure muscular strength. These
data represented in Tables 4 and 5 for the women and men respectively. No
significant changes were found in any variable for either group. There was
a trend toward decrease in mean strength measures for both muscle groups in
the women while the men had a decrese in quadriceps strength and an increase
in hamstring strength.
18
19
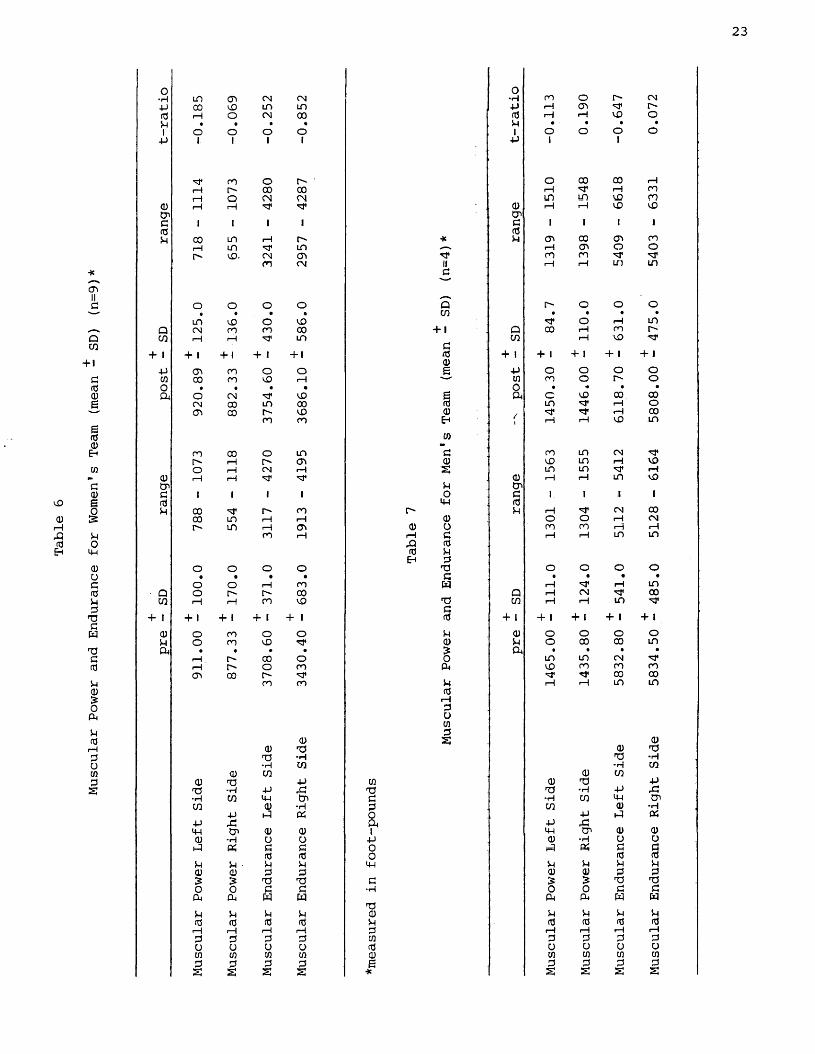
Muscular Power and Muscular EnduranceMuscular Power was assessed using the Cybex II Isokinetic Dynamometer
integrated with a Cybex Data Reduction Computer. A 25 repetition work test of
the lower extremity at 180°/ second was used. Mean torque for the first five
repetitions and total work of the quadricep and hamstring muscles over 25
repetitions constituted measures of muscular power and endurance respectively.
Tables 6 and 7 present this data. All data are expressed in foot-pounds of work.
No significant changes were found in any variable for either group. The women
did show a trend toward increases in both measures while the data on the men
revealed no consistant movement either up or down. Their data seemed more tied
to the extremity tested and did not follow a pattern.
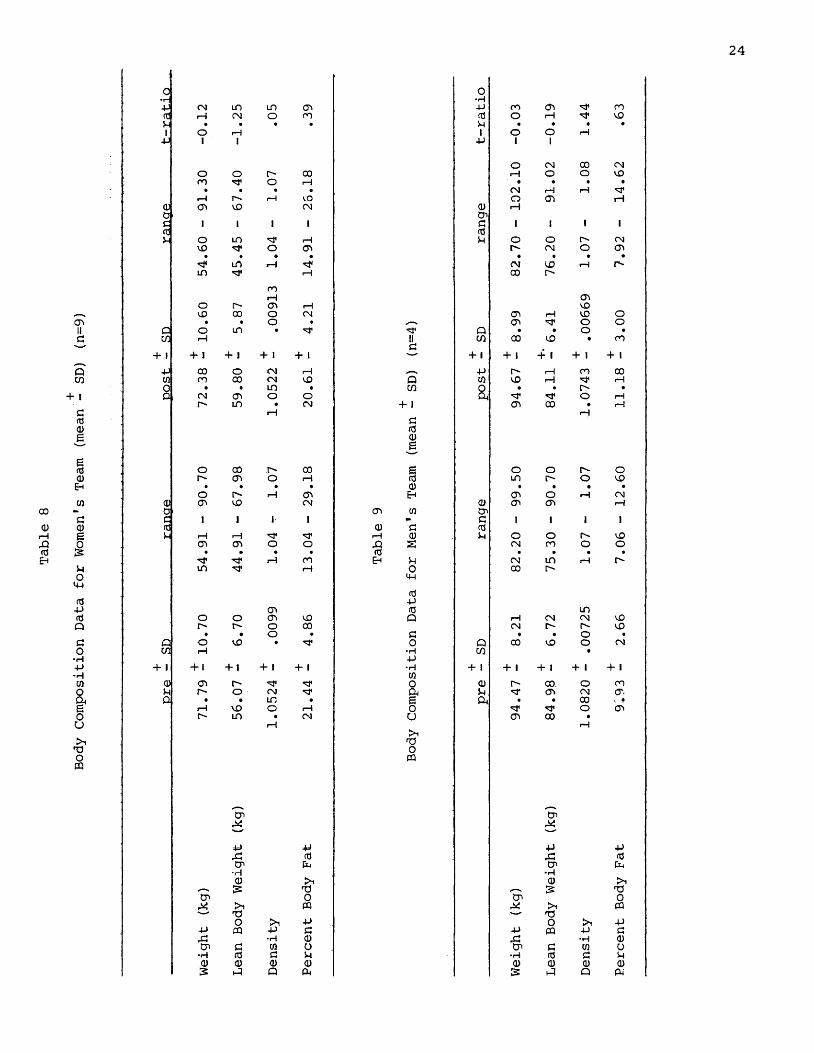
Body CompositionTables 8 and 9 contain the data describing the body composition changes
of the subjects. No significant changes were found for either the men or women
in any of the variables.
Between Group Changes
Table 10 contains data describing the changes between the groups. In
the measures of muscular strength there was a significan (p=.05) decrease in
left quadricep strength and a significant (p=.01) decrease in right quadricep,
left and right hamstring strength in the women's team. There were no other
significant changes found in this comparison of the groups but there was an
upward direction in the measures of cardiorespiratory fitness as would be ex
pected with the significant increases found in within group comparisons
described previously.
20
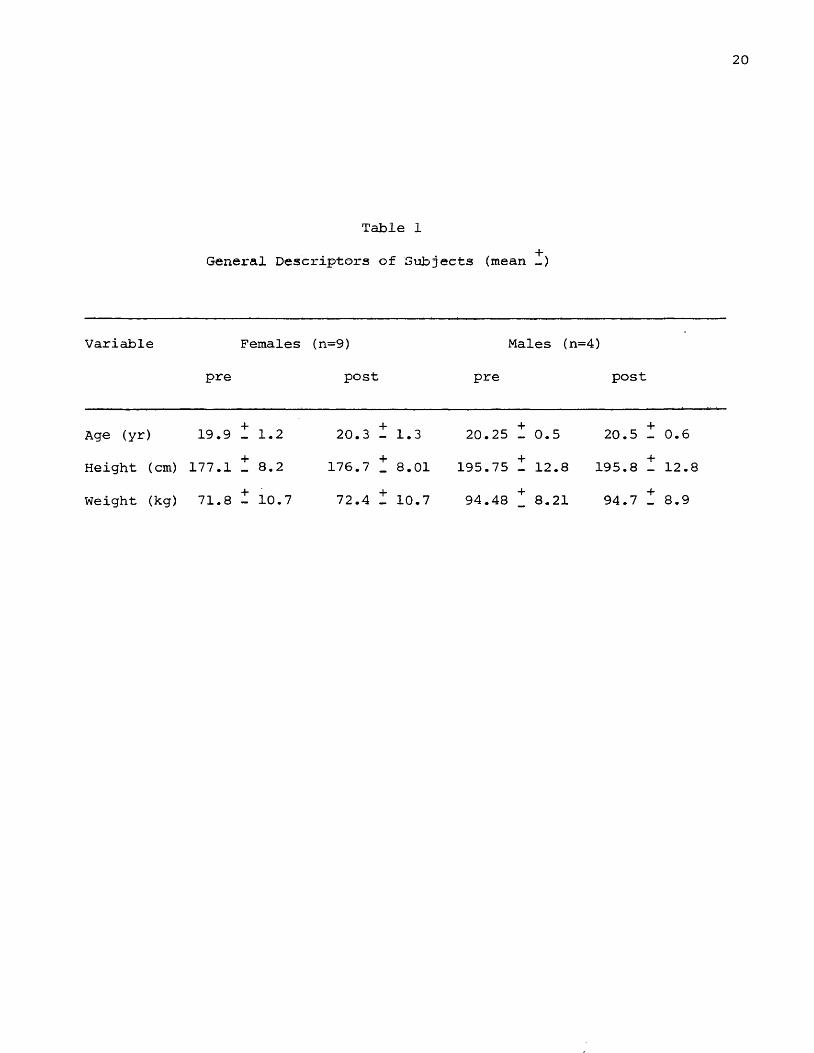
Table 1
General Descriptors of Subjects (mean *)
Variable Females (n=9) Males (n=4)
pre post pre post
Age (yr) 19.9 + 1.2 20.3 + 1.3 20.25 + 0.5 20.5 + 0.6
Height (cm) 177.1 + 8.2 176.7 + 8.01 195.75 + 12.8 195.8 + 12.8
Weight (kg) 71.8 + 10.7 72.4 + 10.7 94.48 + 8.21 94.7 + 8.9
Cardiorespiratory
Data
for Women's
Team
(mean
- SD)
(n=9)
21
o o■H * * •H *-P co o 00 *3* o •p ID in ID CO Ocd t—l CN CN cn r - cd CN f" O 005-1 • • • • • u • • • • •1 CN CN 1 rH i—1 rH rH
•P 1 1 1 i i •p i i i 1 1
cn 00 OO ID CN CN in co rH O00 cn cn CN in • • • • •
w < • • • rH in Pi r—1 cnCN CN rH ID ID i—i
<D m CO rH CD rHCn i—1 cnc: I 1 1 1 1 c 1 I 1 1 i<d cdu ■—i i—I co 5h in r-~ CO o
cn © © cn © rH rH in• • • • • • • • • •
co CN i—l O CN in rH ■Hcn i—1 in rH
rH
IIC
r" [■" o r - —• [■"- m CN inco CO CO CN CN ID O CN
• • • • • Q • • • • •Q o rH CN CD Q in CNcd iH CD i—1
+ 1+ 1 + 1 + 1 + 1 + I + 1 + 1 + i + I + 1 + 1 + 1fi
-p in CO in id -p in co r* VO Ocn CN in ID rH r- CD cn o CO CN rH ooo • • • • • o • • • • •ft CO rH i—1 CN ft CO in r - rH ID
*3* i—I i—1 in m rHrH g
tdCDEh
cn
cn r - o c ID t-~ co inm iD ID CN o CO CD CO rH cn rH O
• • • • • s • • • • •o CO rH m CD CO in in rH r -in CN i—i (H 5h in in rH
CD i—i Xi 0 CD rHcn cd 14H cnC i 1 i 1 i EH p i i 1 1 1<d cd cdu r - CN cn i—1 -p 5H CO r" in
o ID CN O in cd CN in cn o• • • • • Q • • t • •
o CN o i—1 o r-~ cn ino i— i >1 CO rH<—1 u rHo
■pcd00 u
cn in o ID cn •H rH CN i— 1 cn mo co CN O in f t cn CO ID o rH• t • • • cn • • • • •
Q • r o rH rH CD a co 00 i—1cd rH U CD
0+ 1 + i + 1; + 1 + 1 + 1 ■rl + 1 + I + 1 + 1 + t + 1"0(U t-" <n r- rH ID u CD CN r- in r^ IDsh CO rH 1—i rH O cd 5h ID CO ID o IDft • • • • • o ft m • • • •
CO o rH CN CN rH inrH i—1 in i—irH rH
'arH •H rH -rH1 ,—. £ 1 ,—, gc rH P i—1 '—•rl 1 •rl 1g c a g c a• i— H •H o • .—^ •H 0
i—1 1 g •rl rH ■—i g. •rlI q • -P i i « -Pm •3 i—1 in cn p rH U1
,X g — ■ P •rl P• <d • g rdt—1 • CD •C rH • CD Xi^g 1-1 ft X J5 rH ft X'-' Eh w in -—' Eh wft o CQX X! o • X X ocd id X -p cd cd X -pg g cd g g cd
g CD ft g CDCN CN g CN CN g
O O W •H O O •H• > • > • > • ft EH * • > • > • > • ft Eh
LDO•V 'ft
Muscular Strength for Women's
Team
(mean
- SD)
(n=9)
22
0 0•H t-"-p d* vO O CM -P CO m CO r~-0 cr» i—1 m CO 0 in o in d*U * • • • u ♦ • • •1 rH i o o o o-P •p i i 1
o ID 00 m rH m CO 00d* n CM CM i—i in in0 rH rH rH i—i 0 CM CM i—i rHin ?ng 1 1 1 l G 1 1 i 10 0sh d* LD CO CO SH CO O i—i VOOV CTv vO CO o CM co1—1 CM i—1 i—1
o d* O o00 vO CO o cn vO d*• • • • * • • • •Q d* CTO CM cn ,—. Q vO vO CMcn CM rH rH ■—i ^ d< cn c—1 i—1 rHII+ i + 1 + 1 + 1 + i G + i + 1 + 1 + 1 + 1'w'•P o VO rH VO -p co r-~ O COcn o m i—1 uo *—s 0 CO vO o co0 • • « • Q 0 • • • •a VO r- o cn cn ft CM vO cn CO
CM CM cn 00 O O CO d*i—1 rH + 1 CM CM rH i—1G00SCD VO CM cn cn CM C" vOvO in rH c-1 in CO in in0 r—1 i—i rH 1—1 £ 0 CM CM rH rH(n 0 (nG 1 I 1 1 0 G I 1 1 1cd in EH 0
sh CM 00 (n 00 Sh vO 00 vO i—1r—1 o vO VO 0 0 00 ["> O rHi—1 c—1 rH • 1—1 rH rH rHX G0 0EH s
ShCO r- CM cn 0 in CO r- CO• • • • MH • • • •Q vO r- d* CO Q d1 CM CM COcn 1—1 i—i rH i—I XI cn CO CM CM CM
p+ i +1 + 1 + 1 + i cn + 1 + 1 + 1 + 1 + 1G0 d* 00 CM i—i 0 0 o O m insh d1 p~ CM rH Sh sh o o CMft * % • • -P ft • • • •co m co CM cn d< vO o vO
CO CO cr» cn rH O CM COrH rH p CM CM i— 1 i— 10
rH30032
cnG£Oft4Jcn O 0cn ft in O 0 ft in
ft 0 m a vp ft 0 in G0 o G ■rH 0 o G *r|o ■r| ■rl u G O •rl •rl SH■rl SH SH p •H •r| SH Sh Pu 05 -P cn Sh 'd P 0
T) 0 0 e T3 0 0 £0 0 £ 0 0 0 3 £ 03 Oi 0 as >H 3 O i 0 XO i s £ Oi ac
p p 0 p Pp X -p x 0 P X -p Xvp tn IN in 0 VM m VP in0 •H 0 •rl £ 0 •rl 0 -HPI Oh P3 * PI PS pi *m
easured
in foot-pounds
Muscular Power
and Endurance
for Women's
Team
(mean
- SD)
(n=9)*
23
o 0•H lO cn CN CN •H CO o CN+J CO co in in 4-> 1—1 cn 3< r "3 rH o CN CO cd rH rH LO o54 « • • » u • • • •1 o o o o i o o o o
4-1 i i 1 1 4-> 1 i
CO o t ' ' o 00 00 1—1i—i CO 00 1—1 3< 1—1 COi—i o CN CN in in LO CO
<U i—i rH 3< 3« CD i—i rH LO LOCn tnG i 1 1 1 3 i 1 1 13 cd54 CO LO rH r ' 4e p cn 00 cn co
rH LO 3< in i—i cn o o[■" LO- CN cn 3 * CO CO 3 * NT
CO CN li r—4 >—i in in3
'
___o O O o Q r - o o o
• • • • CO • • • •LO LO o LO 3 * o i—i in
Q CN no CO 00 + 1 Q CO I—1 co r -cn 1—1 rH 3 in CO rH LO 3 *
3+ i + 1 + 1 + 1 + i cd + 1 + i + 1 + 1 + 1
CD4-1 <n CO o o & 4J o o o ocn CO co LO i—i cn CO o o0 • • • • 0 • -• • •f t o CN 3 * LO g ft C LO 00 00
CN CO m CO cd in 3 * 1—I o<n CO r- LO CD y 3 * i—i 00
CO CO EH { rH 1—1 LO in
cn
co 00 o in 3 CO n CN 3 *rH r " cn CD LO in rH LOo rH CN i—i £ n n 3 * i—i
03 i-1 1—1 3< 3 * CD rH i—i n LOCn U tn3 I 1 i i O 3 1 i i 1rtf 144 cdU CO 3 O ' CO u 1—1 3 * CN 00
CO LO rH 1—1 CD o o i—1 CNI-" LO i—1 cn 03 O CO CO t-4 i—1
CO ■—i rH 3 t—1 r—l n inf t cdcd 5jE-i 3
O o O o ■3 o o o o• • • • 3 • • « •o o rH CO ft rH rH in
Q o O' t> 00 Q i—1 CN 3 * 00CO 1—1 rH CO LO 33 CO rH i—i in "3*
3+ I + 1 + 1 + 1 + 1 cd + 1 + 1 + l + i + 1
id o CO o o 54 CD o o o O54 o CO LO 3 * CD 5-1 O CO CO inf t • • • • > f t • • •
1— CO o o n n CN 3 *rH r * o CO f t LO co CO CO<T\ CO C" 3 * 3< 3 * 00 COco CO 54 i—i rH n in
cdrH3Ocn3
CD £ CDa) 33 CD 3333 ■H 33 ■H•H CO -H CO
03 CO CD CO03 rd 4-» cn CD 33 4-»33 •H 4-J X 33 33 •H 4-» X•H CO 144 tn 3 •H CO 144 tnco 0) •H 3 CO CD •H
40 1-3 ft 0 4-1 31 ft-p 03 f t 4-» X44 Cn 03 a> I LH tn CD CDa> •H O o 4-1 CD •H □ Of t ft 3 3 0 i=3 f t 3 3
3 <d 0 3 3u 54 54 u 44 5-1 54 54 5403 03 3 3 CD 03 3 35 5 3 ( 33 3 £ 33 35o 0 3 3 ■H 0 0 3 3f t f t f t f t 1 p y f t f t f t f t
54 u 54 U CD 54 54 54 543 cd cd cd 54 cd 3 3 3rH 1—1 i—i i—i 3 i—i rH i—1 i—13 3 3 3 cn 3 3 3 3O O O O cd U a O Ocn cn cn cn CD cn cn cn cn3 3 3 3 g 3 3 3 32 2 2 2 * 2 2 2 2
Body
Composition
Data
for Women's
Team
(mean
- SD)
(n=9)
0 O•H -H-P CM in LO 03 -P co 03 cocfl rH CM o CO cd o i—1 'd* V0Sh • • • • Sh • • • •1 o rH 1 o o i—i
-P i i -P 1 1
O CM 00 CMo o r~ CO rH O o VOco o rH • • • •
• • • • CM 1--] rH1—H r^ rH VO O 03 i—1
0 cn VO CM CD rH0 tnC i 1 1 1 C 1 1 i 1cd cdSh o LD rH Sh O O CMvo "sf o 03 [■"- CM O cn• • • • • • • •
U"> 1—1 CM to «H O'in i—1 CO
corH 03
o t" cn rH VOvO CO o CM 03 rH VO o• • o ♦ 03 O o
D o in • Q • • o •tn rH II 02 CO VO • CO
G+ 1 4- J + i + i + i — + 1 + 1 + 1 + 1 + 1
■P 03 o CM rH ,_„ -P O' rH co COin <n 00 CM vO a cn vO rH 1—10 • • in • tn O • » r> •0 CM cn o O 0* o 1—1r- LO • CM + 1 03 CO • 1—1i—I rH
GcdCD&w
o CO r~ 00 S o o r- ocn o rH cd LO r" o vO• • • • CD • • • •o r - jH 03 Eh cn o rH CM0 cn vo CM CD 03 03 i—10 cn cn tnG i ] i I — G i 1 1 103 CD G cdSh i—i i—i rH CD u o o r - V0
03 03 o O 42 S CM CO o o• • • • cd • • • •"Vf iH CO &H Sh CM in rH r-lT) 1—1 0 CO r -
MHcd4-3cn cd in
O O 03 vO Q rH CM CM vOr' r - o CO CM r - VO• • o • G • • o •Q o vO • 0 Q CO vO o CMtn rH •H tn •
-P+ 1 + 1 + 1 + 1 + 1 •H + i + 1 + 1 + 1 + 1cn0 cn r" 0 CD r-' CO o CO
Sh r-~ o CM & P 03 CM 030 • • in • e CM • • CO v •
j—i vO o rH o -xT o 03r- LO • CM u cn 00 •
rH 1—1>1TS0CQ
"n'—'
+J +4 -l~i -P43 cd 43 cdtn Em tn Em■HCD > i CDT3 ,—, £ TDtn 0 tn 0
* >i PQ >i CQTJ -—- TSO >i -P O >1 ■P
-P CQ -p g -p CQ -p G43 •H 0 43 ■r| 0tn G Cfl o tn G cn O-H cd c Sh -H cd G u0 CD <D <D 0) CD 0 0£ J Q PM £ PI Q PM

25
Table 10Comparison in
(men,the Changes Between n=4, women, n=9)
Groups
Variable
Pre-Post Changes in Females
Pre-Post Changes in Males
Independentt-ratio
VO2 max (ml *kg“ -.min“l) 4.0 6.7 1.023•VO2 max (l*min) . 6 .4 1.945
^EBTPS .7 6.9 .993
R .05 .02 1.023
Time to Exhaustion (min) .68 2.17 1.062
Left Quadricep* -9.4 3.3 1.8511
Right Quadricep* -8.2 5.7 2.6412
Left Hamstring* -3.1 17.0 2.4892
Right Hamstring* -2.6 13.7 3.4872
Muscular Power - Left* 18.6 -37.0 .270
Muscular Power - Right* 17.2 -6.0 .112
Muscular Endurance - Left* 46.0 117.7 .479
Muscular Endurance - Right* 255.7 -1.7 -.746
Weight (kg) -.65 .59 -.718
Lean Body Weight (kg) -.87 1.16 -.76
Density -.0008 .0188 -1.317
Percent Body Fat -.9444 1.268 1.230
1 P .<.052 p <.01 * ft-lbs
CHAPTER VI
DISCUSSION
Within Group Changes
Cardiorespiratory Changes
Significant (p=.02) pre-post season changes were found in VO2 max (1 min”-*-)
(ml kg"1 min"1) in the femalws. Nearly significant changes (p=.07) pre-post
season changes were found in the males* VO2 max (ml kg-1 min 1). A significant
(p=.04) change was found in V02 max (1 min”1). Changes in VO2 max (ml kg-1 min-1)
although not significant, did follow a pattern similar to the females. The
lack of significance could possibly be due to the smaller sample size (N=4)
a higher initial fitness level, and a 40 percent increase increase in percent
body fat.
Previous research using competitive athletes over a season as well as
training studies using male and female subjects found similar significant changes
in VC> 2 max scores (Drinkwater, 1973; Ekblom et al, 1968? McArdle, Magel &
Kyvallos, 1971; Michael, Evert & Jeffers, 1972? Sinning, 1972, Sinning & Adrian,
1968) .
Mean V02 max (ml kg”1 rain”1) dcores for athletes in this study (x=44.87)
compared favorably with those of other studies for female basketball players:
44.8, 34.4, 35.5 for Sinning, 1972; Sinning & Adrian, 1968; and McArdle, Magel &
Kyvallos, 1971 respectively.
26

27Muscular Strength
No significant changes were found with either the male or female samples in
any strength measurements. There was however, a seven and six percent decrease
in left quadriceps strength, respectively, in the female players. In the male
athletes there was a six percent decrease in left quadriceps strength while all
other variables remained stable or slightly increased. The women showed no
increase in any strength measurement.
Wilmore (1974) and Mayhew & Gross (1975) showed subjects improved strength
with training designed to improve strength- Each basketball team's training
was designed not to increase strength, but rather to maintain it. The bilateral
strength decrease in the females and a similar pattern in the smaller male
sample are interesting trends.
Previous research of Burkett (1970), Laird (1981) and Wilkerson, Martin &
Sparks (1980), have shown that a quadriceps ratio of 60 percent is an important
level in preventing muscle pulls. There is increase risk that the stronger
quadriceps muscles can overpower the hamstring muscles during explosive activities
and result in muscle pulls if this ratio is less than 60 percent. In addition to
this fact is the trend toward higher ratios as the speed of the limb motion is
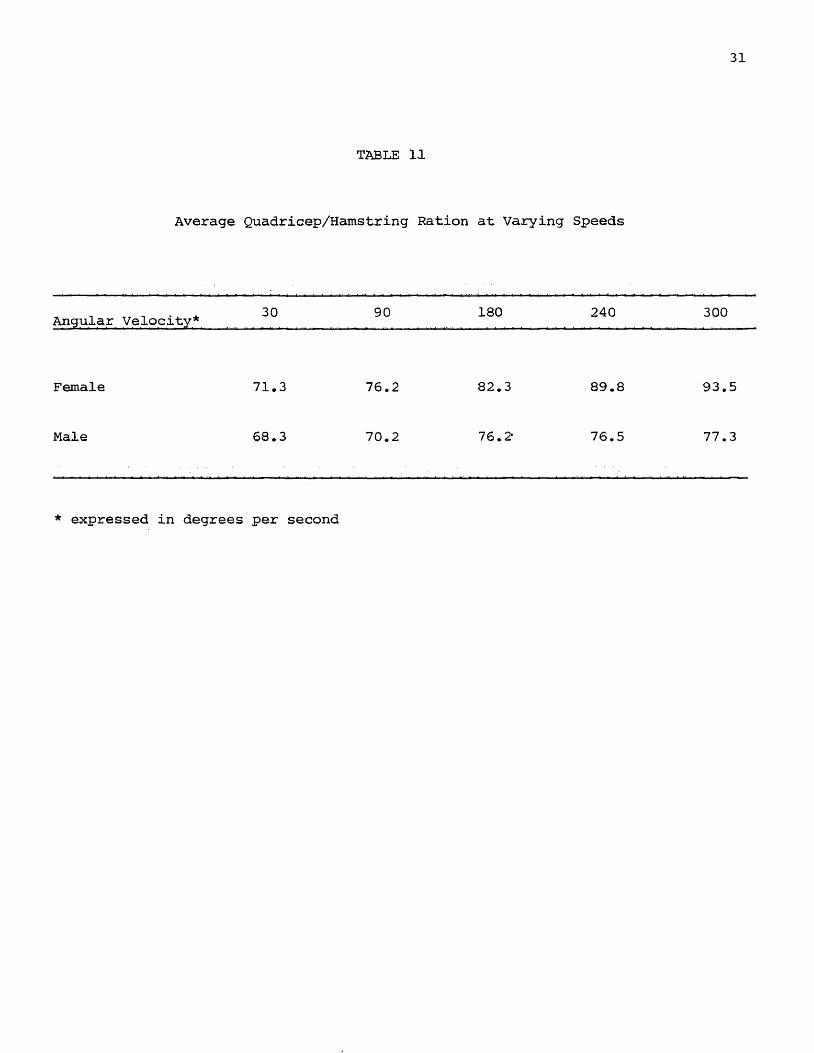
increased. Table 11 shows that both samples substantiated previous research. The
females higher ratio is not necessarily due to higher levels of hamstring strength
as much as low levels of quadriceps strength. This could be due to the less
powerful nature of women's basketball as compared to men's. A more explosive
game would require greater quadricep development (i.e. for the jumping).
Muscular Power and Endurance
Previous research over the course of a season of competitive basketball
28
season has not included measures of muscular power and endurance as descriptive
statistics. One would assume that the anaerobic nature of basketball
as described by some authors (de Vries, 1980; Fox & Mathews, 1981)
would produce changes in these measures over the course of a season.
However, the data fail to show any changes in muscular power as females
and males showed only a one percent change in muscular power. Muscular
endurance increased an average of four and one-half percent in females
and three percent in males. None of these changes were statistically
significant. The weight training program of both groups were not
designed to increase either strength or muscular endurance but rather to
maintain the levels at the beginning of the season.
The lack of significance could be due to the nature of the test.
A 25 repetition work test was used to determine muscular endurance. The
phosphagen system is not taxed with this test. The small sample size could
also have been a contributing factor to the lack or significance as well
as the initial fitness levels of the subjects.
Body CompositionAlthough no significant changes were found in measures of body
composition, an increase (p=.ll) in female.lean body weight and male
density (p=.10) were found. In this study the small sample size as well
as the athletes competitive participation and injury status could have
contributed to the lack of significance. Two female athletes were
academicllly ineligible and one male athlete had an ankle injury during
the course of the season.
Previous research of Sinning (1973) found significant increases in
lean body weight and tital body weight of female basketball players.
29
No other research with female basketball players found significant changes
in these variables. This could be due to the year round nature of the
athletes conditioning and the already lean body composition of these
competitive athletes compared to the 1973 study.
Female athletes inthis study had a mean total body weight of 71 kg
as compared to 61 kg for the subjects in McArdle, Magel & Kyvallos (1971)
and Sinning & Adrian (1968). The length of the season for athletes in
this study was five weeks longer than previous studies and involved long
er and more frequent practice sessions.
Between Group Changes
Cardiorespiratory Changes
No significant changes were found between groups in any measures of
cardiorespiratory fitness. The small sample size and high initial fitness
levels could have contributed to the lack of significant change between
groups.
Muscular Strength
Between group differences were found in all strength variables.
In each case the females showed a significant decrease in strength as
compared to the males population, right quadricep (p=.01), left quadricep
(p=.05), right hamstring (p=.003), left hamstring (p=.004).
Previous research failed to measure lower extremity strength in
seasonal studies of women basketball players. Bo'th teams performed a
minimal amount of strength training during the season. Wilmore (1982) found both men and women to be equally trainable. With this in mind,
30
it may be the difference in the type of game played by the men and women, the
men's game being a more powerful, explosive game and the women's being more
prolonged with less explosive jumping.
Muscular Power and Endurance
No statistically significant differences were found between the groups.
These results could be due to an initially high fitness level which leaves
little room for improvement. The small sample size could also affect the
statistical significance. A third possible reason could be the length of
the test. A 25 repetition test for endurance lasts 25 seconds and may
not be adequate in terms of the time span for measuring the endurance of
basketball players. Fox & Mathews (1981) state that basketball is a sport
85 percent dependant upon ATP-CP and 15 percent dependant upon the lactic acid-
oxygen system. Perhaps a longer test of muscular endurance would yield
a greater change between pre- and post-season changes.
An observation of the training methods of both teams might have affeceted these variables in that the training is aimed at long-term progression of skills and not creating a "stale" athlete.
Body CompositionNo statistically significant differences were found between the groups.
This would be due to the small sample size and relatively high fitness
level of both samples as well as the male increase in percent fat combined
with, a decrease in lean body weight. The female sample had an increase in
lean body weight and decrease in fat weight.
31
TABLE 11
Average Quadricep/Hamstring Ration at Varying Speeds
Angular Velocity* 30 90 180 240 300
Female 71.3 76.2 82.3 89.8 93.5
Male 68.3 70.2 76.2 76.5 77.3
* expressed in degrees per second
CHAPTER VII
SUMMARY AND CONCLUSIONS
Summary
This study compared the physical fitness changes of male and female
college basketball players over a competitive season. Basketball players
at the University of Nebraska at Omaha practiced hours a day, 5 days
a week for 22 weeks. They were involved in flexibility, strength,
aerobic, anaerobic, and skill work designed to improve their playing
abilities. Cardiorespiratory fitness, muscular strength, muscular power,
muscular endurance, and body composition were assessed prior to and
immediately after the competitive season.
Significant pre-post season changes in the female population were
found in the following variables: VO^ max (ml*kg«""^min (p=.01)
VO max (1‘min (p=.05). The only significant change the males
experienced was VO^ max (l*min- ) (p=.05).
Significant between group changes were found in the females in the
following variables: significant decreases in left quadriceps (p=.05),
right quadriceps (p=.01), left hamstring (p=.004), right hamstring
(p=.003) in females.
Conclusions
Based on the results of this study, the following conclusions can be drawn regarding the physical fitness changes in male and female college basketball players over a competitive season at the University of Nebraska at Omaha:
32

1. Cardiorespiratory fitness
Basketball practices were able to produce a signigicant increase. -l. -1 “1in VO^ max (ml kg min and l’min ) in both male and female
basketball players.
2. Muscular strength
a. Muscular strength was not changed significantly over the
course of a competitive season in either group.
b. Significant differences were' found between groups in all
measures of quadricep and hamstring strength with the females
haveing decreased over the competitive season.
3. Muscular power and endurance
No significant changes within each group or differences between
the groups wre found.
4. Body composition
No significant changes within each group or differences between
each group were found.
Recommendations
There is a need for further study on seasonal changes in similar
sports performed by males and females. The following recommendations
for further study can be made based upon this study:
1. A larger sample size should be used.
2. An additional measure of anaerobic power other than the Cybex 25
repitition work test should be used which would be a more valid
indicator of the lactic acid and alactacid energy systems.
34
REFERENCES
American College of Sports Medicine. Opinion statement on the participation of the female athlete in long-distance running. 1980. Sports Med Bull. 15:4-5.
Apple DF, O'Toole J and Annis C. Professional basketball injuries. 1982. Phys Sport Med. 10:81-86.
Berger R. Effect of varied weight training programs on strength. 1962.Res Quart. 33:168-181.
Berger R. Optimum repititions for the development of strength. 1962.Res Quart. 33:334-338.
Boileau R, Bursik E, Horstman D, and Nichols W. Body compositionchanges in obese and lean men during physical conditioning. 1971.Med Sci Sports. 3:183-189.
Burkett LN. Causitive factors in hamstring strain. 1970. Med Sci Sports. 2:39-42.
Clarke D and Stull G. Endurance training as a determinant of strength and fatigability.. 1970. Res Quart. 41:19-26.
Coleman AE. Physiological characteristics of major league baseball players. 1982. Phys Sport Med. 10:51-57.
Conlee RK, McGown CM, Fisher AG, Dalsky GP and Robinson KC. Physiological effects of power volleyball. 1982. Phys Sport Med. 10:93-97.
Costillo DL, Daniels J, Evans W, Fink W, Kraehnbuhl G, and Salin B.Skeletal muscle enzyme and fiber composition in male and female track athletes. 1976. J. Appl Physiol. 40:(2):149-154.
Costill DL, Fink WJ and Pollock ML. Muscle fiber composition andenzymatic activity of elite distance runners. 1976. Med Sci Sports. 8:96-100.
De Vries HA. Physiology of Exercise for Physical Education and Athletics. 3rd Edition. 1980. Dubuque. William C. Brown Company.
Dons B, Bollerup K, Bonde-Peterson F and Hancke S. The effects ofweight lifting exercises related to muscle fiber composition and muscle cross sectional area in humans. 1979. Eur J Appl Physiol.40:95-106.
Drinkwater B. Physiological response of women to exercise. Exercise and Sports Science Review Volume 1. Edited by Jack Wilmore.New York. 1973. New York Academy Press.
35
Edwards SW and Vitti GJ. The use of performance profiles in athletic training. 1983. Ath Tr. 17:181-183.
Eisenman PA and Golding LA. Comparison of effects of training on VO- max in girls and young women. 1975. Med Sci Sports. 7:136-138.
Ekblom B, Astrand P, Saltin B, Stenberg J and Wallstrom B. Effect oftraining on ciculatory response to exercise. 1968. J Appl Physiol. 25(5):619-625.
Ekblom B and Hermanson L. Cardiac Output in Athletes. 1968. Eur J Appl Physiol. 25:619-625.
Faria IE. Cardiovascular response to exercise as influenced bytraining of various intensities. 1970. Res Quart. 41:44-50.
Fox EL and Mathews DK. The physiological basis of pliysical education and athletics. 3rd Ed. 1981. Philadelphia, Saunders College.
Fox EL, Bartels R, Billings C, O'Brien R, Bason R, and Mathews DK.Frequency and duration of interval training programs and changes in aerobic power. 1975. J Appl Physiol. 38:481-484.
Gladden LB and Colacino D. Characteristics of volleyball players and sucess in a national tournament. 1978. J Sports Med Phys Fit. 18:57-64.
Grana Wa and Moretz JA. Ligamentous laxity in secondary school athletes. 1978. JAMA. 240:1975-1976.
Green JH and Houston ME. Effect of a season of ice hockey on energy capacities and associated functions. 1975. Med Sci Sports. 7:299-303.
Grimby G, Huggendal E and Saltin B. Local Xenon 133 clearance from the quadriceps muscle during exercise in man. 1967. J Appl Physiol.22(2)305-310.
Godshall RW. The predictability of athletic injuries: an eight yearstudy. 1975. J Sports Med. 3:50-54.
Hanson JS. Maximal exercise performance in members of the U. S. Nordicski team. 1974. J Appl Physiol. 35:592-595.
Hanson JS. Decline of physiologic training effects during thecompetitive season in members of the U.S. Nordic ski team. 1975.Med Sci Sports. 7:213-216.
Henry J, Lasean B and Neiqirt D. The injury rate in professional basketball players. 1982. Am J Sp Med. 10:16-18.
36Hettinger T. Physiology of strength. Springfield, IL. 1961. CC Thomas.
Hosier WW, Morrow JK Jr, and Jackson AS. Strength, anthropometric and speed characteristics of college women volleyball players.1978. Res Quart. 49:385-388.
Kalanek A and Morehouse CA. Knee stability and knee ligament injuries. 1975. JAMA. 234:1143-1145.
Karbson J, Nordesjo L, Jorfeldt L and Saltin B. Muscle lactate, ATPand cp levels during exercise and after physical training in man. 1972. J Appl Physiol. 33:199-203.
Kelly JM, Gorney BA and Kalm KK. The effects of a collegiate seasonon body composition, cardiovascular fitness, and muscular strength and endurance. 1978. Med Sci Sports. 10:119-124.
Koraliski JE, Parr RB, Nornak JE and Roitman JE. Athletic profile of women volleyball players. 1980. Phys Sports Med. 8:112-118.
Krahenbuhl GS, Wells CL, Brown CA and Ward PE. Characteristics of national and world class female pentathletes. 1979. Med Sci Sports. 11:20-23.
Mayhew J and Gross P. Body composition changes in young women with high resistance weight training. 1974. Res Quart. 45:433-440.
McArdle WD, Magel JR and Kyrallos LC. Aerobic capacity, heart rate, and estimated energy cost during women's competitive basketball.1971. Res Quart. 42:178-186.
McNat RBJ, Conger PRand Taylor PS. Differences in maximal andsubmaximal work capacity in men and women. 1967. J Appl Physiol. 27:644-648.
Michael E, Evert J and Jeffers K. Physiological changes of teenage girls during five months of detraining. 1972. Med Sci Sports. 4:214-218.
Monetz JA, Walters Rand Smith L. Flexibilty as a predictor of knee injuries in college football players. 1982. Phys Sports Med. 10:93-97.
Nicholas JA. Injuries to knee ligaments. Relationship to loosenessand tightness in football players. 1970. JAMA. 212:2236-2239.
Pollock M, Cureton T and Greninger L. Effects of frequency of training on working capacity, cardiovascular function, and body composition of adult men. 1969. Med Sci Sports. 1:70-74.
Saltin B and Astrand P. Maximal oxygen uptake in athletes. 1967.J Appl Physiol. 23:353-358.
Shaver LG. Effects of a season of varsity wrestling on selectedphysiological parameters. 1974. Med Sci Sports. 14:139-145.
Sinning WE. Body composition, cardiorespiratory function, and rule changes in women's basketball. 1978. Res Quart. 44:313-321.
37Sinning AE and Adrian MJ. Cardiorespiratory changes in college women
due to a season of competitive basketball. 1968. J Appli Physiol. 25:720-724
Skinner JS and McLellan TH. The transition from aerobic to anaerobic metabolism. 1980. Res Quart. 51:234-248.
Spence DW, Disch JG, Fred HL and Coleman AE. Descriptive profiles of highly skilled women volleyball players. 1980. Med Sci Sports. 12:299-302.
Stull G and Clarke D. High resistance, low repetition training as a determiner of strength and fatigability. 1970. Res Quart. 41:189-193.
Syster B and Stull G. Muscle endurance retention as a function of length of setraining. 1970. Res Quart. 41:105-109.
Vaccaro P,, Morris AE and Clarke DH. Physiological characteristics of female distance runners. 1975. Phsy Sports Med.
Vinger PF and Hoerner EF, Editors. Sports Injuries. 1981. Littleton, PSG Publishing Co. Inc.
Walderman R and Stull G. Effects of various periods of inactivity on retention of newly aquired levels of muscular endurance. 1969.Res Quart. 40:393-401.
Wallace JP. Response of the composition of body fat to cardiovascular training in college women. 1975. Res Quart. 46:317-322.
Wasserman K, Whipp BJ, Kogal S and Beaver WL„ Anaerobic threshold and respiratory gas exchange during wxercise. 1973. J Appl Physiol. 35:236-243.
Wilmore JH. The use of actual, predicted and constant volumes inthe assessment of body composition by underwater weighing. 1969.Med Sci Sports. 1:87-90
Wilmore J, Royce J, Girandola H, Katch R, and Katch V. Body composition changes with a 10 week program of jogging. 1970. Med Sci Sports. 2:113-117
Wilmore JH and Haskell WL. Body composition and endurance capacity ofprofessional football players. 1972. J Appl Physiol. 33:564-567.
Wilmore JH. Alterations in strength, body composition and anthropometric measurements consequent to a 10 week weight weight training program. 1974. Med Sci Sports. 6:133-138.
Wilmore J and Brown C. Physiological profiles of women distance runners. 1974. Med Sci Sports. 6:178-181.
Wilmore JH. Training for Sport and Activity: The Physiological basis of the conditioning process. Second Edition. 1982. Boston.Allyn and Bacon

APPENDIX
38I)University of Nebraska at Omaha School of Health, Physical Education & Recreation
University of Nebraska at O m ahaD O m aha, NE 68182
Subject Informed Consent Form Comparison of Physical Fitness Changes in Male and Female College Basketball Players and the Relationship to Injury
You are invited to participate in a project in which we are studying the fitness changes of basketball players and the relationship to injury. You will be asked to participate in a pre and post test treadmill run, underwater weighing, muscular strength and endurance test, bicycle test and flexibility test.
You will allow Dr. Kris Berg, Denise Fandel and other lab assistants to administer the following tests:
Methods
Running Test On a Treadmill. A treadmill is a machine which lets a person run indoors. You will be asked to run on this machine until you are tired and wish to stop. This will feel like running up a large hill. At the end of the test you will feel tired, your heart will be beating fast and you will be breathing rapidly and deeply. We will cheer you on to run as long as you can; youcan stop at any time you wish by pushing the "stop" button or grabbingthe rails. We will not be upset with you for stopping anytime you wish. During the running you will breathe through a special mouthpiece and some plastic tubing and we will measure your heart rate.You will take this test on 2 separate occasions.
Body Fat. We -will find out how much fat is in your body by weighing you underwater. You will be dressed in a swim suit and then sit ina chair hanging from a scale in a small pool. The pool will containclean, warm water. You will put your head and face under the water, blow out air and hold your breath for a few seconds. Anytime you want you may take your head out of the water.
University of Nebraska at Omaha University of Nebraska— Lincoln University of Nebraska Medical Center
Subject Informed Consent FormPage 2
Breathing Test. You will force out as much air as you can into a device (spirometer) which has a tublar mouth piece. This data will be used in computing your body composition.
Bicycle Test. You will be asked to pedal as hard and fast as youcan for 30 seconds on a stationary bicycle. The resistance youpedal against will be adjusted to your body weight. At the end of the test you will feel tired your heart will be beating rapidly and you will be breathing deeply. Your legs will feel heavy and very tired. You will be asked to take this test on 2 separate occasions.
Muscle Strength and Endurance Test. You will be seated in a chair and your leg will be held down using a Velcro strap. You will be, asked to bend and straighten you leg as fast as possible. The machine will control how fast you move. You will be asked to do three repetitions at five different speeds. You will also be asked to bend and straighten your leg continually for thirty seconds. Your legs will feel tired and heavy.
Flexibility Tests. You will be asked to perform five tests thatwill be used to predict possible injury. You will be asked to1) touch the palms of hands to the floor; 2) stand with your knees completely straight; 3) stand with your heels together and rotate your ankles so your toes point to the side as far as possible;4) sit on the floor and try to put your heels on the opposite thigh; 5) stand with your arm in front of you completely extended and palms facing up.
Understand that you may drop out of this project any time you wish without hurting your relationship with us or the University of Nebraska.We will provide a written copy of all your test results and results of the total group and will also explain them to you. No one but you and the investigators and your coaches will have access to your test scores.
Risks and Discomforts
During the treadmill test, you will be breathing deeply and rapidly, sweating and your heart will be beating rapidly. Your leg muscles may ache during the last several minutes of the test but this pain will rapidly diminish within 5 to 10 minutes upon completing the test. There may be some muscle soreness a day or two following the treadmill test and the strength tests.
If injury occurs as a direct consequence of these procedures, the emergency medical care required to treat the injury will be provided at the University of Nebraska at no expense to you, providing that the cost of such medical care is not reimbursable through your own health insurance. However, no additional compensation for medical care, hospitalization, loss of income, pain, suffering, or any other form of compensation will be provided as a result of such injury.
Subject Informed Consent FormPage 3
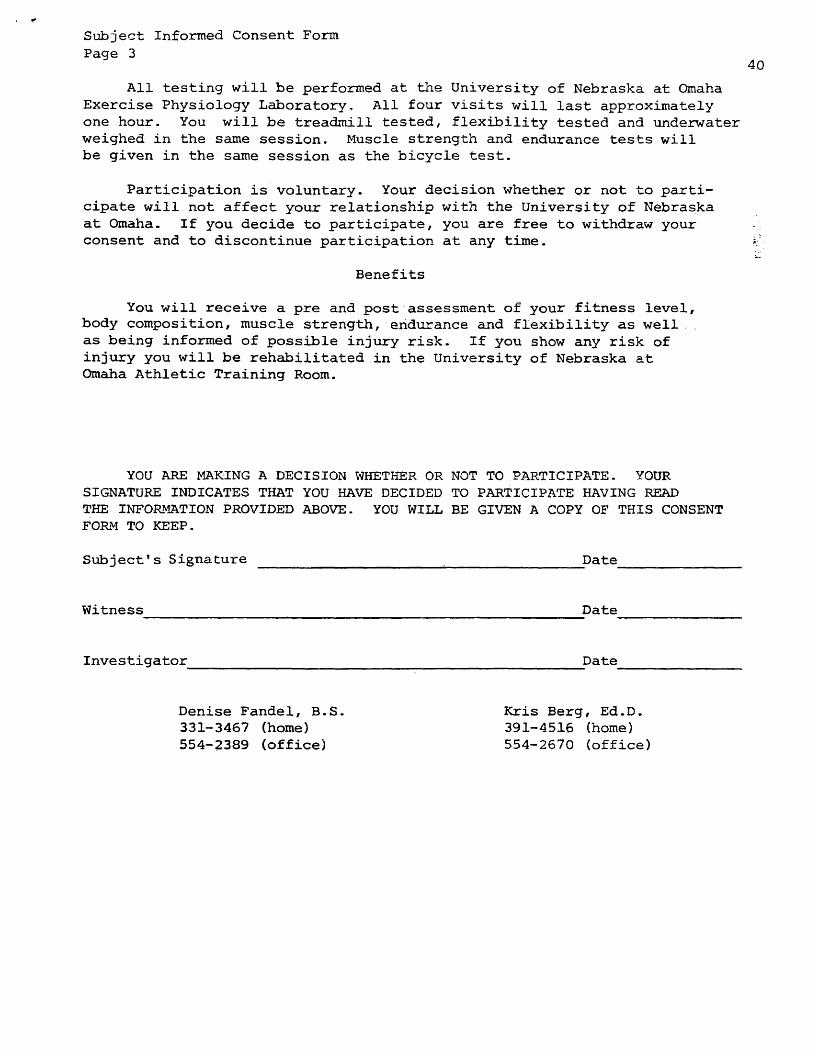
All testing will be performed at the University of Nebraska at Omaha Exercise Physiology Laboratory. All four visits will last approximately one hour. You will be treadmill tested, flexibility tested and underwater weighed in the same session. Muscle strength and endurance tests will be given in the same session as the bicycle test.
Participation is voluntary. Your decision whether or not to participate will not affect your relationship with the University of Nebraska at Omaha. If you decide to participate, you are free to withdraw your consent and to discontinue participation at any time.
Benefits
You will receive a pre and post assessment of your fitness level, body composition, muscle strength, endurance and flexibility as well ; as being informed of possible injury risk. If you show any risk of injury you will be rehabilitated in the University of Nebraska at Omaha Athletic Training Room.
YOU ARE MAKING A DECISION WHETHER OR NOT TO PARTICIPATE. YOUR SIGNATURE INDICATES THAT YOU HAVE DECIDED TO PARTICIPATE HAVING READ THE INFORMATION PROVIDED ABOVE. YOU WILL BE GIVEN A COPY OF THIS CONSENT FORM TO KEEP.
Subject's Signature _____________________ Date____________
Witness Date
Investigator _____ _ _ __________________________________ Date
Denise Fandel, B.S. 331-3467 (home) 554-2389 (office)
Kris Berg, Ed.D. 391-4516 (home) 554-2670 (office)

41
University of Nebraska at Omaha School of Health, Physical Education & Recreation
University of Nebraska at O m ahaD O m aha, NE 68182
Parent Informed Consent FormComparison of Physical Fitness Changes in Male and Female College Basketball Players and the Relationship to Injury
Your son/daughter is invited to participate in a project in which we are studying the fitness changes of basketball players and the relationship to injury. He/she will be asked to participate in.: a pre and post test treadmill run, underwater weighing, muscular strength and endurance test, bicycle test and flexibility test.
You will allow Dr. Kris Berg, Denise Fandel and other lab assistants to administer the following tests:
Running Test On a Treadmill. A treadmill is a machine which lets a person run indoors. Your son/daughter will be asked to run on this machine until they are tired and wish to stop. This will feel like running up a large hill. At the end of the test they will feel tired, their heart will be beating fast and they will be breathing rapidly and deeply. We will cheer them on to run as long as they can? they can stop at any time they wish by pushing the "stop" button or grabbing the rails. We will not be upset with them for stopping anytime they wish. During the running they will breathe through a special mouthpiece and some plastic tubing and we will measure their heart rate. They will take this test on 2 separate occasions.
Body Fat. We will find out how much fat is in your son/daughter's body by weighing them underwater. They will be dressed in a swim suit and then sit in a chair hanging from a scale in a small pool.The pool will contain clean, warm water. They will put their head and face under the water, blow out air and hold their breath for a few seconds. Anytime they want they may take their head out of the water.
Methods
University of Nebraska at Omaha University of Nebraska— Lincoln University of Nebraska Medicai Center
Parent Informed Consent FormPage 2
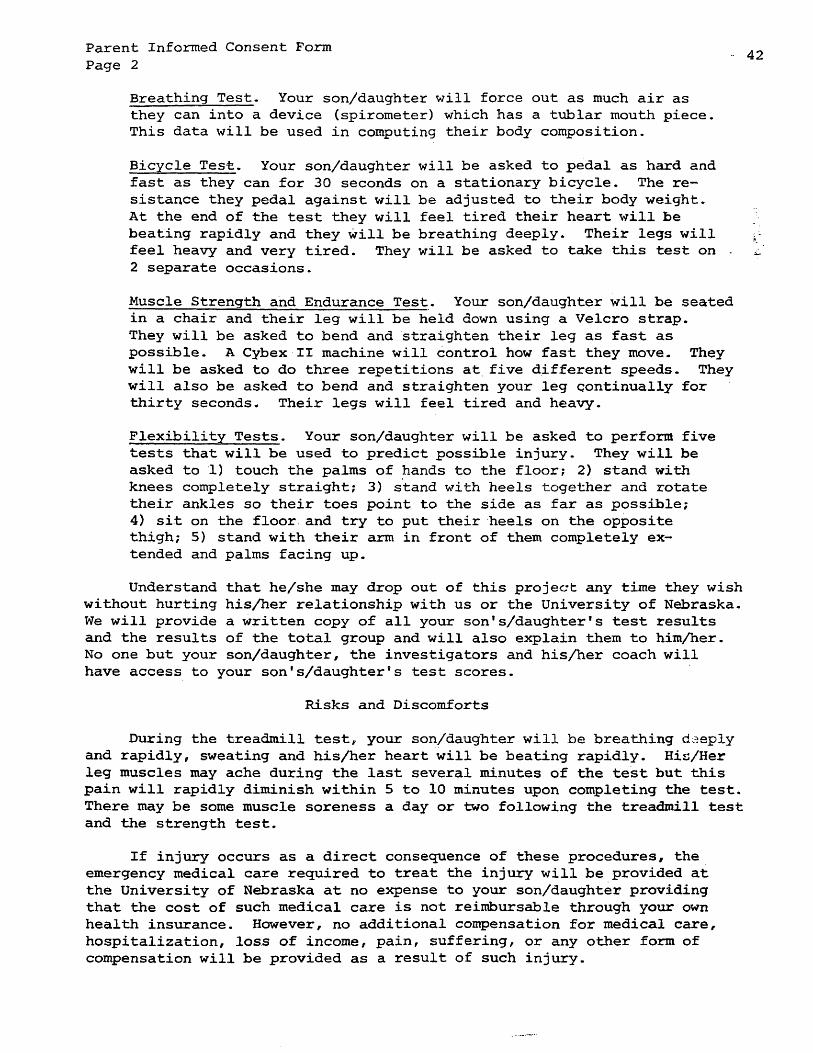
Breathing Test. Your son/daughter will force out as much air as they can into a device (spirometer) which has a tublar mouth piece. This data will be used in computing their body composition.
Bicycle Test. Your son/daughter will be asked to pedal as hard and fast as they can for 30 seconds on a stationary bicycle. The resistance they pedal against will be adjusted to their body weight.At the end of the test they will feel tired their heart will be beating rapidly and they will be breathing deeply. Their legs will feel heavy and very tired. They will be asked to take this test on .2 separate occasions.
Muscle Strength and Endurance Test. Your son/daughter will be seated in a chair and their leg will be held down using a Velcro strap.They will be asked to bend and straighten their leg as fast as possible. A Cybex II machine will control how fast they move. They will be asked to do three repetitions at five different speeds. They will also be asked to bend and straighten your leg continually for thirty seconds. Their legs will feel tired and heavy.
Flexibility Tests. Your son/daughter will be asked to perform five tests that will be used to predict possible injury. They will be asked to 1) touch the palms of hands to the floor; 2) stand with knees completely straight; 3) stand with heels together and rotate their ankles so their toes point to the side as far as possible;4) sit on the floor and try to put their heels on the opposite thigh; 5) stand with their arm in front of them completely extended and palms facing up.
Understand that he/she may drop out of this project any time they wish without hurting his/her relationship with us or the University of Nebraska. We will provide a written copy of all your son's/daughter's test results and the results of the total group and will also explain them to him/her.No one but your son/daughter, the investigators and his/her coach will have access to your son's/daughter's test scores.
Risks and Discomforts
During the treadmill test, your son/daughter will be breathing deeply and rapidly, sweating and his/her heart will be beating rapidly. His/Her leg muscles may ache during the last several minutes of the test but this pain will rapidly diminish within 5 to 10 minutes upon completing the test. There may be some muscle soreness a day or two following the treadmill test and the strength test.
If injury occurs as a direct consequence of these procedures, the emergency medical care required to treat the injury will be provided at the University of Nebraska at no expense to your son/daughter providing that the cost of such medical care is not reimbursable through your own health insurance. However, no additional compensation for medical care, hospitalization, loss of income, pain, suffering, or any other form of compensation will be provided as a result of such injury.

Parent Informed Consent FormPage 3
43
Participation is voluntary. Your son’s/daughter's decision whether or not to participate will not affect his/her relationship with the University of Nebraska at Omaha. If he/she decides to participate, he/she is free to withdraw his/her consent and to discontinue participation at any time.
Benefits
Your son/daughter will receive a pre and post assessment of his/ her fitness level, body composition, muscle strength, endurance and flexibility as well as being informed of possible injury risk. If he/she ' shows any risk of injury he/she will be rehabilitated in the University of Nebraska at Omaha Athletic Training Room.
YOU ARE MAKING A DECISION WHETHER OR NOT TO ALLOW____________________________________ (NAME OF MINOR) TO PARTICIPATE. YOUR SIGNATURE INDICATESTHAT, HAVING READ THE INFORMATION PROVIDED ABOVE, YOU HAVE DECIDED TOPERMIT_______________________________ (NAME OF MINOR) TO PARTICIPATE. THESECOND COPY OF THIS FORM IS FOR YOU TO KEEP.
Signature Date
Relationship to Subject
Witness (if required) Signature of Investigator
Denise Fandel, B.S. 331-3467 (home) 554-2389 (office)
Kris Berg, Ed.D. 391-4516 (home) 554-2670 (office)