physiologic model for the pharmacokinetics of 2′deoxycoformycin in normal and leukemic mice
TRANSCRIPT

Journal of Pharmacokinetics and Biopharmaceutics, Vol. 9, No. 5, 1981
Physiologic Model for the Pharmacokinetics of 2'Deoxycoformycin in Normal and Leukemic Mice
Franklin G. King 1'2 and R o b e r t L. D e d r i c k 1"3
Received January 5, 1981--Final June 9, 1981
A flow-limited physiologic mathematical model has been developed to describe the time course of 2'deoxycoformycin (2'dCF) concentrations in the plasma and tissues of mice following iv and ip doses. Urinary excretion is modeled as a linear process involving filtration and secretion, since kidney clearance exceeded estimated glomerular filtration rate. Intracetlular binding is described as the sum of linear nonspecific binding plus strong saturable binding to adenosine deaminase. Pharmacokinetic parameters are determined by a sequential optimization scheme in which each tissue is studied by means of a hybrid model. The model has been used to predict pharmacokinetic behaviour of 2'dCF in both normal and leukemic mice, and model simulations are compared with published data.
KEY WORDS: pharmacokinetics; physiologic model; 2'deoxycoformycin.
I N T R O D U C T I O N
2 ' d e o x y c o f o r m y c i n (2 'dCF) is a bac te r i a l f e r m e n t a t i o n p r o d u c t of streptomyces antibioticus (1). 2 ' d C F is a p o t e n t t i gh t -b ind ing inh ib i to r of a d e n o s i n e d e a m i n a s e ( A D A ) with a K1 in the r ange of 1.5 • 10 -11 to
2.5 • 10-1aM for h u m a n A D A (2). L e P a g e et al. (3) have shown tha t a single dose of 0.25 m g / k g in mice resul ts in g r e a t e r t han 80% inh ib i t ion of in t race l lu la r A D A for m o r e t h a n 24 h in the l iver , k idney , and L 1 2 1 0 tumor . T h e enzyme A D A is wide ly d i s t r i bu t ed in va ry ing concen t r a t i ons in m a m m a l i a n t issues (4). I t is i m p o r t a n t in l y m p h o c y t e m e t a b o l i s m and also ca ta lyzes the d e a m i n a t i o n of a d e n o s i n e analogs , whose a n t i t u m o r and
1Biomedical Engineering and Instrumentation Branch, Division of Research Services, Building 13, Room 3W13, National Institutes of Health, Bethesda, Maryland 20205.
~Permanent Address: Department of Chemical Engineering, Howard University, Washington, D.C. 20059.
3Address correspondence to Robert L. Dedrick
519 0900-466x/81 / 1000-0519 $03.06/ 0 �9 1981 Plenum Publishing Corporation
520 King and Dedrick
antiviral activity is reduced by deamination to inactive metabolites. It has been demonstrated that combination chemotherapy with 2'dCF and 9-beta- D-arabinofuranosyladenine (ara-A) significantly increases the antitumor activity of ara-A (3,5,6) in mice. 2'dCF has also been shown to have immunosuppressive activity (7). The drug is quite nontoxic to mice, dogs, and monkeys except for its effect on the lymphoid system (8). The LDs0 for mice is 100 mg/kg iv, which is much greater than the 0.25 mg/kg dose required for ADA inhibition. Its potential for lymphocytotoxicity may be important in the treatment of lymphoid malignancies (7).
In this study, we develop a physiologic pharmacokinetic model to simulate the distribution and excretion of 2'dCF. We use a flow limited model with a linear urinary elimination process and an equilibrium relation- ship consisting of a linear term to account for the tissue distribution at high concentration of 2'dCF and a nonlinear term to account for the tight specific binding to ADA. The simulations of the time course of excretion and distribution in normal and leukemic mice are compared to the experimental data of McConnell et al. (9) for an iv dose and for an ip dose (10). McConnell et al. (9,10) used an enzymatic assay for all data except that a microbiologic assay was used for the ip low dose data. They reported that each data point represented pooled data from three mice and that three sets of mice were used at each time point.
GLOBAL MODEL DEVELOPMENT
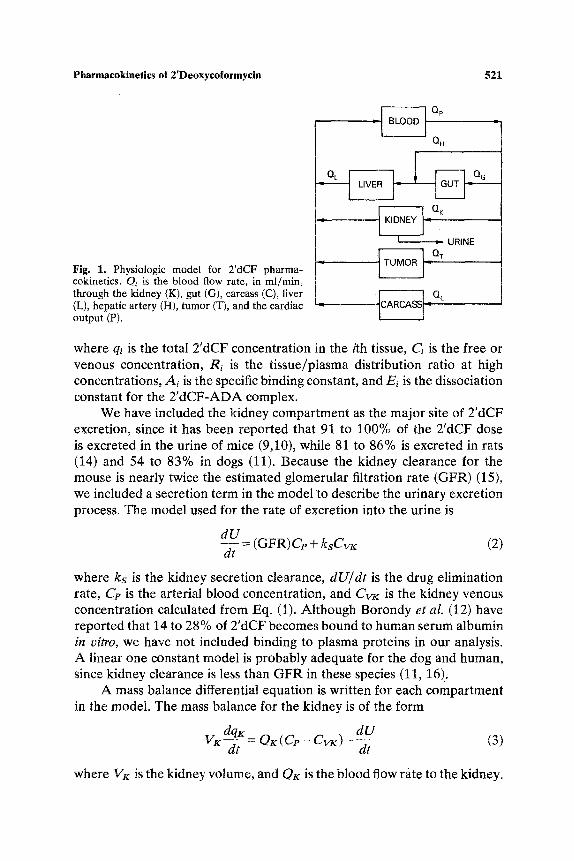
Previously published information (9-11) indicates that 2'dCF is not uniformly distributed or bound in all tissues. The review of the development and applications of physiologic models by Himmelstein et al. (12) indicates that a physiologically based model could describe the nonuniform binding that occurs with 2'dCF in various tissues. A flow-limited model has been used as a first approximation, and we have determined, for simulation purposes, that the assumption of flow-limited mass transfer is valid for all tissues included except the tumor. For simplicity and completeness, the model was applied to the compartments shown in Fig. 1.
Since 2'dCF binds tightly to the enzyme ADA, we have included a nonlinear, saturable term in the equilibrium binding equation. A linear term was also included since the tissue/plasma distribution data (9,10) indicate that binding is linear at high concentration. A similar approach was used by Bischoff et al. (13) to model the binding of methotrexate to dihydrofolate reductase. The binding in all tissues was modeled using the equation
A~C~ qi = R i C l + - (1)
Ei + ci
Pharmacokinetics of 2'Deoxycoformycin 521
Fig. 1, Physiologic model for 2'dCF pharma- cokinetics. C)i is the blood flow rate, in ml/min, through the kidney (K), gut (G), carcass (C), liver (L), hepatic artery (H), tumor (T), and the cardiac output (P).
~ Op
OH
---~,,,w OK
L , oT ~ oc
where qi is the total 2'dCF concentration in the ith tissue, Ci is the free or venous concentration, Ri is the tissue/plasma distribution ratio at high concentrations, Ai is the specific binding constant, and Ei is the dissociation constant for the 2'dCF-ADA complex.
We have included the kidney compartment as the major site of 2'dCF excretion, since it has been reported that 91 to 100% of the 2'dCF dose is excreted in the urine of mice (9,10), while 81 to 86% is excreted in rats (14) and 54 to 83% in dogs (11). Because the kidney clearance for the mouse is nearly twice the estimated glomerular filtration rate (GFR) (15), we included a secretion term in the model to describe the urinary excretion process. The model used for the rate of excretion into the urine is
dU dt (GFR)C~ + ksCv~: (2)
where ks is the kidney secretion clearance, dU/dt is the drug elimination rate, Cp is the arterial blood concentration, and C w is the kidney venous concentration calculated from Eq. (1). Although Borondy et al. (12) have reported that 14 to 28% of 2'dCF becomes bound to human serum albumin in vitro, we have not included binding to plasma proteins in our analysis. A linear one constant model is probably adequate for the dog and human, since kidney clearance is less than GFR in these species (11, 16)..
A mass balance differential equation is written for each compartment in the model. The mass balance for the kidney is of the form
dqK dU VK---~-= OK(Cp- CvK)- d---i- (3)
where VK is the kidney volume, and OK is the blood flow rate to the kidney.

522 King and Dedrick
The liver and gut compartments have been included in the model because their size, anatomic location, and relatively high ADA content (4) could affect the overall system dynamics. Borondy et aI. (14) reported that 6% of the dose was excreted into the feces of rats, but there are no reports that 2'dCF was found in the feces of other animals. Since the model being developed is for mice, which excrete 91 to 100% of the 2'dCF through the kidneys, we have not included biliary clearance of fecal excretion.
No metabolism of 2'dCF was included in the model because it has been reported that no metabolites were found in the urine of mice and rats (9, 14). Recently, however, Venner and Glazer (17) reported that 3 to 16% of the intracellular concentration of 2'dCF is metabolized to a monophosphate in L1210 cells in vitro.
The mass balance equations describing the liver and gut compartments are
for the liver, and
~/ d q L T = Q~G, + OcCvG - QLCvL + D (4)
d q ~ _ v ~ - - ~ - Oc( C~ - cvG) (5)
for the gut, where D is the dose injection function (an exponential for ip dose and 0 for iv dose).
A tumor compartment was included to model the dynamics of a tumor bearing mouse. The tumor is modeled anatomically in parallel with the other organs since data (9) indicate that L1210 cells were injected sub- cutaneously. A one-compartment model with a single transport parameter for drug influx and efflux was used to describe the accumulation of 2'dCF in a tumor. The model equation is
~, r d q T _ --d-i- O~( Cp - C ~ ) (6)
where the subscripts T and F T refer to the total tumor concentration and concentration of free 2'dCF in the tumor.
The remainder of the animal was lumped into a single carcass compart- ment because experimental data were not available for fat and muscle tissues, which held significant amounts of the drug. The carcass compart- ment received all of the cardiac output except the flow rates to the liver, gut, and kidney. Carcass weight was also corrected for tumor. The equation describing the carcass compartment is of the same form as Eq. (5). The

Pharmacokinetics of 2'Deoxycoformycin 523
balance on the blood compartment is
dCp VP T = QLCvL "Jr- QKCvK q- O c C v c - OeCp -b O r ( C F r -- Cp) + D (7)
where D is the dose injection function of 2'dCF (pulse for iv, 0 for ip). The global physiologic model thus requires the simultaneous solution of Eqs. (2) to (7).
P A R A M E T E R ESTIMATION
A large number of parameters are needed in any global, physiologic pharmacokinetic model, but many of them can be determined a priori. Tissue volumes and perfusion rates were obtained from previous work (18). The cardiac output for a mouse was estimated by preparing a logarith- mic plot of cardiac output versus body weight and extrapolating a fit of available data for larger animals. Table I summarizes these model param- eters for 2'dCF for the mouse. A number of other parameters, namely, clearances, transport rates, and binding parameters, cannot be determined a priori and must be estimated by comparing computer simulations with experimental data.
Initial Estimates
The parameter estimation procedure was started by using the experi- mental data to estimate initial values for the kidney clearance and each binding parameter. The initial value for the kidney clearance, kK, of 2'dCF in the mouse was estimated from the data of McConnell et al. (9, 10) by dividing the amount of drug excreted during the experimental period, U(t) , by the graphically evaluated integral of the plasma concentration
Io k,: = U ( t ) / Cp dt (8)
Table I. Physiologic Parameters for 2'dCF Modeling of a 25-g Mouse
Tissue Volume (ml) Blood Flow Rate (ml/min)
Blood 1.9 7.7 Gut 1.7 1.7 Liver L48 0.35 Kidney 0.39 1.58 Carcass 19.53 a 4.03 Tumor 0.65 b
a 18.88 for tumor bearing mice. bPersonal communication with D. L. Hill and M. Trader.
524 King and Dedrick
Both kidney clearances estimated in this way exceed the estimated GFR of 0.30 ml/min for a 25-g mouse.
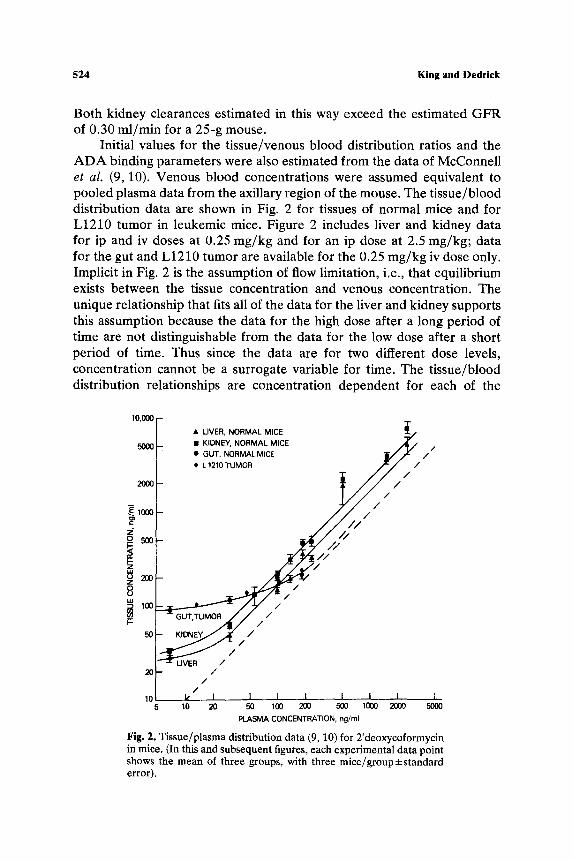
Initial values for the tissue/venous blood distribution ratios and the ADA binding parameters were also estimated from the data of McConnell et al. (9, 10). Venous blood concentrations were assumed equivalent to pooled plasma data from the axillary region of the mouse. The tissue/blood distribution data are shown in Fig. 2 for tissues of normal mice and for L1210 tumor in leukemic mice. Figure 2 includes liver and kidney data for ip and iv doses at 0.25 mg/kg and for an ip dose at 2.5 mg/kg; data for the gut and L1210 tumor are available for the 0.25 mg/kg iv dose only. Implicit in Fig. 2 is the assumption of flow limitation, i.e., that equilibrium exists between the tissue concentration and venous concentration. The unique relationship that fits all of the data for the liver and kidney supports this assumption because the data for the high dose after a long period of time are not distinguishable from the data for the low dose after a short period of time. Thus since the data are for two different dose levels, concentration cannot be a surrogate variable for time. The tissue/blood distribution relationships are concentration dependent for each of the
10,000 " T
�9 LIVER, NORMAL MICE 5000 �9 KIDNEY, NORMAL MICE . ~ / 4 / /
�9 GUT, NORMALMICE ~.///,r /
2000 t L 1210 TUMOR ~ ~ / / /
Z g ~
V-- 50 ~ / /
/ /
10 k I 1 I I I I I I 5 10 20 50 100 200 500 1000 2000 5000
PLASMA CONCENTRATION, ng/ml
Fig. 2 . Tissue/plasma distribution data (9, 10) for 2'deoxycoformycin in mice. (In this and subsequent figures, each experimental data point shows the mean of three groups, with three mice/group:i:standard error).
Pharmacokinetics of 2'Deoxycoformycin 525
tissues shown. At high concentration, when the ADA is saturated, the lines appear linear, giving distribution ratios of 1.0, 1,0, 1.7, and.2.4 for the tumor, gut, liver, and kidney, respectively. At low concentration, these tissue concentrations appear to approach constant values, which were used to estimate the specific binding parameters for 2'dCF to ADA. The binding relationships, therefore, must consist of a linear term and a saturable term. The dissociation constant for the drug-enzyme complex was assumed equal to that reported for humans (2), 0.7 ng/ml. The strong binding parameters and distribution ratios were later adjusted by computer search so that the in vivo simulations fit the experimental data. Since the concentration data were far above 0.7 ng/ml, the dissociation constant was not altered.
Hybrid Models
Because of the large number of parameters to be estimated for the global model and the lack of experimental data fo r the carcass compartment, we decomposed the modeling problem into a series of hybrid models which could be solved individually. A hybrid model consists of a mass balance equation for a tissue [e.g., Eq. (3) for the kidney] and an empirically fitted forcing function for the arterial blood concentration versus time. We fitted the blood data (9) to a biexponential equation of the form
Cp = al e-b~t + a2 e -b2t (9)
where t is time, and al, bl, a2, and b2 are fitted constants. The constants were obtained with a nonlinear, least squares routine (19). Previous studies (20, 21) have used hybrid models to estimate the transport and binding in a few tissues without developing a global model. Lutz et al. (22) also distinguish between hybrid and global models. Hybrid models provide an advantage in that the unknown parameters can be estimated one or two at a time. The results might also be more accurate because blood data are usually the most plentiful and reliable and there is no interaction with other tissues if the drug recovery is not complete. The parameters obtained from a hybrid model are more likely to retain their physiologic significance since their estimation is less model dependent.
Hybrid models for the gut and kidney were then solved individually for an iv dose to normal mice, and the transport, clearance, and/or binding parameters were estimated by direct search using a pattern search routine. The hybrid model for the liver consisted of Eqs. (4), (5), and (9) and was fitted after the gut compartment since the liver receives venous blood from the gut. Since the variance of the measured concentration data was found to be proportional to the concentration level, we used a logarithmic transformation. The objective function, thus, was to minimize the square
526 King and Dedrick
of the error between the logarithm of the simulated concentration and the logarithm of the experimental tissue concentration.
Finally, all model equations for the global model were solved simul- taneously. Binding and clearance parameters determined from the hybrid- models for the gut, kidney, and liver were used in the global model simulations. The blood concentration was calculated from the mass balance equation (7). The binding parameters for the carcass compartment were selected by comparing the experimental blood data (9) to the global model simulations. Data were not available to allow the estimation of an average carcass concentration.
The parameters obtained for the iv dose in normal mice were used to predict the pharmacokinetics following two ip dose levels. The only addi- tional parameter required was the time constant for the absorption of the drug. This time constant was not dose dependent.
The experimental data (9, 10) indicate that the urinary clearance and binding characteristics of leukemic mice were somewhat different from those of normal mice. The specific binding parameters were assumed to be related to the ADA content of the tissue. We estimated the specific binding parameters for the gut, liver, and kidney by using the hybrid models with tissue data for tumor bearing mice. No adjustment was made for the linear distribution ratio. The binding parameters for the tumor were also estimated by a computer search using the hybrid model and a curve fit of the blood data for leukemic mice. The kidney clearances and specific binding parameter for the carcass were adjusted by computer search to determine the best fit to the data (9, 10). The estimated pharmacokinetic parameters for all tissues are summarized in Table II.
R E S U L T S A N D D I S C U S S I O N
A global physiologic model was used to simulate the time course of 2'dCF concentration in the plasma and several tissues in the mouse following iv and ip doses. Both normal and leukemic mice were modeled. The model was also used to simulate urinary excretion. In all cases, it was assumed that the plasma concentration was equal to blood concentration because the drug appears to distribute rapidly to the intracellular space of tissue. The model simulations are compared with the experimental data of McConnell et al. for the ip dose (10) and for the iv dose (9) for both normal and L1210 leukemic mice.
N o r m a l Mice
A hybrid model consisting of a curve fit of the blood data and differen- tial equations describing tissue dynamics was used to estimate the binding

Pharmaeokineties of 2'Deoxyeoformycin
Table II. Pharmacokinetic Parameters for 2'dCF in Mice
527
Kinetic parameters
Normal mice Leukemic mice
Kidney clearance GFR (ml/min) 0.30 0.26 Secretion clearance (ml/min) 0.35 0.30
Tumor Transport Rate, Q r (ml/min) 0.14
Binding parameters
Tissue
ADA-DCF complex Specific binding parameter
Tissue/plasma Dissociation (ng/ml) distribution constant
ratio (ng/ml) Normal mice Leukemic mice
Gut 1.0 0.7 82 101 Liver �9 1.24 0.7 18 61 Kidney 2.8 0.7 16 32 Tumor 0.72 0.7 92 Carcass 0,56 0.7 45 45
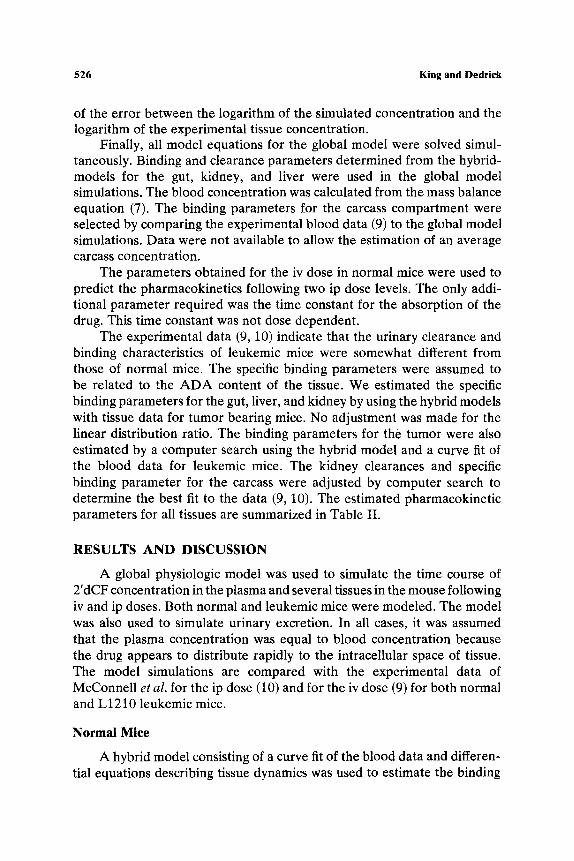
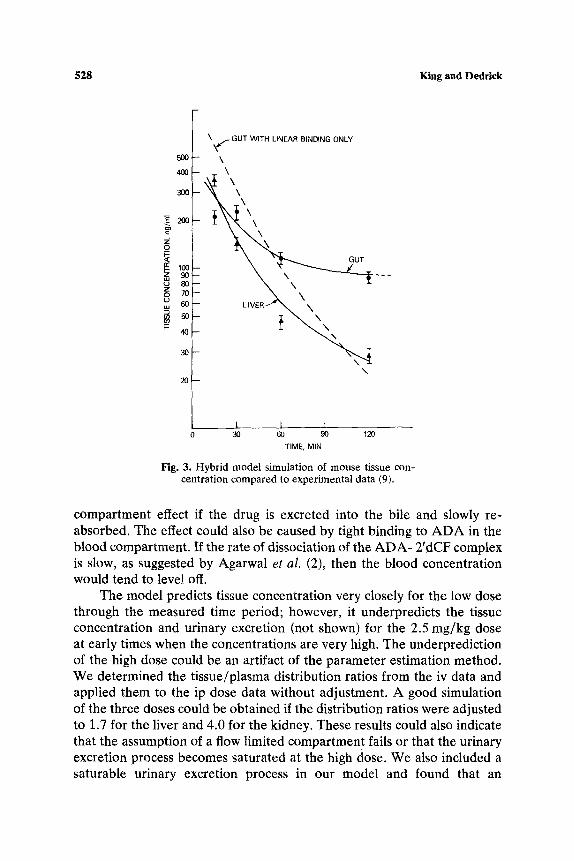
parameters for each of the tissues of normal mice.following an iv dose. Results for the gut and liver tissues are shown in Fig. 3 and compared to the data of McConnell et al. (9). The dashed line illustrates the results of a simulation for the gut with linear binding only. The rapid clearance of 2'dCF from the tissue in this simulation supports the need for a saturable term to account for the specific binding to ADA. A simulation was also performed to test the assumption of flow limitation. The computer was allowed to search for the best transport rate to each of the tissues. In all cases, the best fit was obtained when the transport rate was found to be equal to or greater than the perfusion rate, thus supporting the assumption. The model predictions for the time course of 2'dCF concentration in plasma and tissues are compared to experimental data in Fig. 4 for the 0.25 mg/kg iv dose in normal mice. The model provides a reasonable simulation throughout the experimental time period. The model prediction of urinary excretion is compared with data in Fig. 5.
The model predictions for the ip dose are compared to data in Fig. 6 for two dose levels. The kinetic and binding parameters determined for the iv dose were used in all simulations. The time constant for 2'dCF absorption following the ip dose was determined to be 2 min, indicating that 98% of the drug is absorbed in 8 min. The model predicts plasma concentrations following both dose levels closely for 180 min, but then seriously underpredicts the data. This effect could be caused by a reservoir
528 King and Dedrick
500
400
300
~. 200 ==
z o_
(z:
,,z, 8o
60
~- 40
\ ~ GUT WITH LINEAR BINDING ONLY
-- LIVER-"" ~ \
30
20!-- \
1__ K I I 0 30 60 90 120
TIME, MIN
Fig. 3. Hybrid model simulation of mouse tissue con- centration compared to experimental data (9).
compartment effect if the drug is excreted into the bile and slowly re- absorbed. The effect could also be caused by tight binding to ADA in the blood compartment. If the rate of dissociation of the ADA- 2'dCF complex is slow, as suggested by Agarwal et al. (2), then the blood concentration would tend to level off.
The model predicts tissue concentration very closely for the low dose through the measured time period; however, it underpredicts the tissue concentration and urinary excretion (not shown) for the 2.5 mg/kg dose at early times when the concentrations are very high. The underprediction of the high dose could be an artifact of the parameter estimation method. We determined the tissue/plasma distribution ratios from the iv data and applied them to the ip dose data without adjustment. A good simulation of the three doses could be obtained if the distribution ratios were adjusted to 1.7 for the liver and 4.0 for the kidney. These results could also indicate that the assumption of a flow limited compartmen t fails or that the urinary excretion process becomes saturated at the high dose. We also included a saturable urinary excretion process in our model and found that an
P h a r m a c o k i n e t i c s o f 2 ' D e o x y c o f o r m y c i n
1000
529
~ 101)
z o
F- ,z,
o
10
GUT
PLASMA
I o PLASMA ~ I LIVER �9 GUT '~. '.~
KIDN,EY ~
~.0 I I I I I I 0 30 60 90 120 150 180
TIME, MINUTES
Fig. 4. Global model simulation of 2'dCF concentra- tion compared to experimental data for normal mice (9) following iv dose of 0.25 mg/kg.
improved simulation could be obtained with a half-saturating concentration of 2000 ng/ml. We feel, however, that experimental data at a higher dose level would be required to confirm the saturability.
Leukemic Mice
The strong binding parameters for each of the tissues in tumor bearing mice were determined using a hybrid model consisting of a curve fit for the blood data for leukemic mice because experimental data (9) indicate that the level of strong binding is higher in leukemic mice. We modeled the tumor as a single compartment--as discussed earlier and described by Eq. (6). The binding parameters and tumor flow rate (transport rate) were selected by computer search to fit the model simulation to the experimental data (9) which were available for sc injected L1210 cells in BDF1 mice. The linear distribution ratios were assumed to be the same as for normal mice in all tissues. Finally, the urinary excretion and carcass strong binding parameters were selected by computer search to give the best fit of the

5 3 0 K i n g a n d D e d r i c k
100
8 "6
z" C~
X U~
uJ >
r 8O
70
6O
5O
4O
3O
2O
10
0 0
I I I I I I 3O 60 90 120 150 180
TIME, MINUTES
Fig. 5. Global model simulation of urinary excretion compared to experimental data (9) following 0.25 mg/kg iv dose to normal mice.
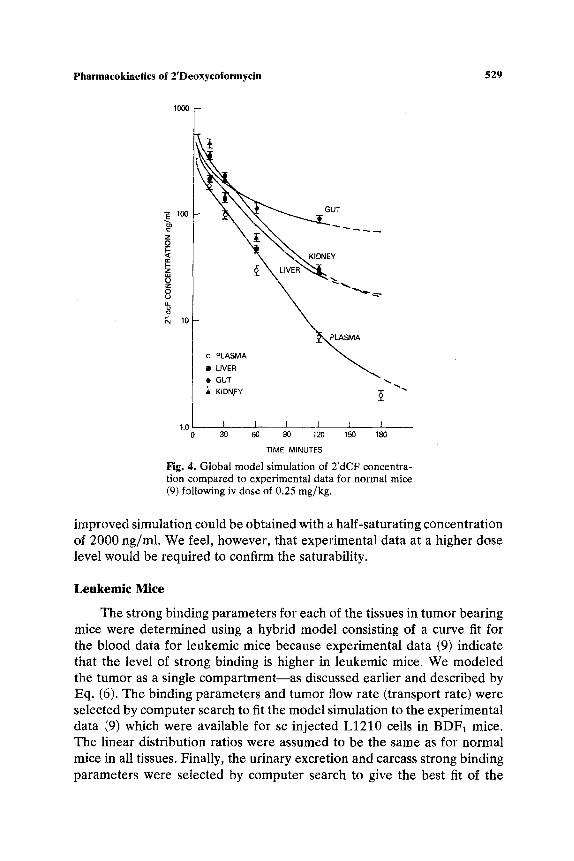
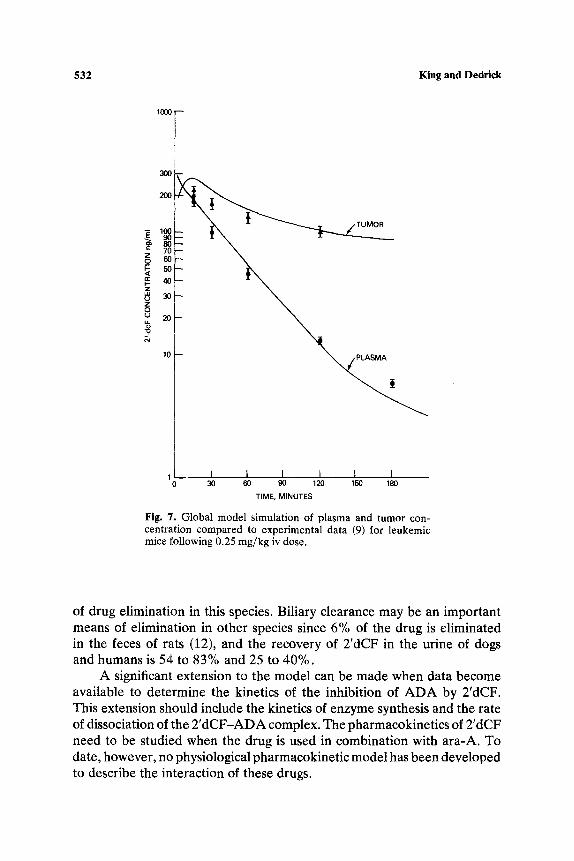
global physiological model to the data. The data for leukemic mice indicate that the urinary clearance was somewhat lower than for normal mice. We modeled this reduction in urinary clearance by assuming that the GFR and secretion rate were reduced by the same fraction. The results are not very sensitive to this assumption, however, since we obtained a similar result by assuming that GFR is unaffected by the tumor and the secretion clearance is reduced to 0.19 ml/min. The model parameters are summarized in Table II. The simulation of urinary excretion (not shown) compared favorably to experimental data. The model predictions of plasma and tumor concentra- tions are compared to data in Fig. 7. The model gives a reasonable simuI~tion for all tissues throughout the experimental time period.
Since no data were available for ADA activity in normal or leukemic mice, we determined the strong binding parameters by direct search. Tedde et al. (23) reported the tissue distribution of ADA in normal and colon- tumor bearing C57BL mice. Our estimated strong binding parameters, 32,

Pharmacokinetics of 2'Deoxycoformycin 531
==
z o I.,.- < nt- I,- z d, z O
1000
100
10
t
\'UVER - \ -,~.. \
~IVER ~ ~ PLAS/VIA PLA'SMA~ ~ ~ ~'~'~
- �9 PLASMA
,, L!V_ER o.2s mg/kg
o PLASMA [] LIVER 2.5 mg/kg �9 ", KIDNEY
1 I 1 I I 1 I 10 30 60 90 120 150 180 210
TIME, MINUTES
Fig. 6. Global model prediction of 2'dCF concentration com- pared to experimental data (10) for following ip doses in normal mice.
61, and 101 mg/ml for the kidney, liver, and gut, respectively, compare closely to those estimated from Tedde et al. if the colon tumor bearing/ normal C57BL mice A D A activity ratio were equal to the L1210 tumor bearing/normal BDF1 mice A D A activity ratio.
No experimental data appear to be available for blood flow to L1210 tumor. An sc grown L 1210 tumor is morphologically similar to a lymphosar- coma (P. M. Gullino, personal communication). Straw et al. (24) reported the blood flow rate in the center of the spontaneous canine lymphosarcoma to be 1.2 ml/(g)/(min). This is about fivefold higher than our model derived estimate of 0.22 ml/(g)/(min). We cannot determine at present if the model parameter actually represents blood flow to these sc L1210 tumors or if it is influenced by transport resistance at the capillary or cell membrane.
The model developed represents the first step in understanding 2'dCF pharmacokinetics and is limited to mice. The kidney is the primary means
532 King and Dedrick
1~o r
I
300
200
50
z o u 20
?
1 I I I I I I 30 60 90 120 150 180
TIME, MINUTES
Fig. 7. Global model simulation of plasma and tumor con- centration compared to experimental data (9) for leukemic mice following 0.25 mg/kg iv dose.
of drug elimination in this species. Biliary clearance may be an important means of elimination in other species since 6% of the drug is eliminated in the feces of rats (12), and the recovery of 2'dCF in the urine of dogs and humans is 54 to 83% and 25 to 40%.
A significant extension to the model can be made when data become available to determine the kinetics of the inhibition of ADA by 2'dCF. This extension should include the kinetics of enzyme synthesis and the rate of dissociation of the 2'dCF-ADA complex. The pharmacokinetics of 2'dCF need to be studied when the drug is used in combination with ara-A. To date, however, no physiological pharmacokinetic model has been developed to describe the interaction of these drugs.
Pharmacokinetics of 2'Deoxycoformycin 533
R E F E R E N C E S
1. P. w. K. Woo, H. W. Dion, S. M. Lange, L. F. Dahl, and L. J. Durham. A novel adenosine and ara-A deaminase inhibitor, (R)-3-(2-deoxy-beta-D-erythropen- tofuranosyl)-3,6,7,8-tetrahydroimidazo(4,5-d)(1,3) diazepin-8-ol. Z Heterocyclic. Chem. 11:641-643 (1974).
2. R. P. Agarwa!, T. Spector, and R. E. Parks, Jr. Tight binding inhibitors-IV. Inhibition of adenosine deaminases by various inhibitors. Biochem. Pharmacol. 26:359-367 (1977).
3. G. A. LePage, L. S. Worth, and A. P. Kimball. Enhancement of the antitumor activity of arabinofuranosyladenine by 2'-deoxycoformycin. Cancer Res. 36:1481-1485 (1976).
4. T. G. Brady and C. I. O'Donovan. A study of the tissue distribution of adenosine deaminase in six mammal species. Comp. Biochem. Physiol. 14:101-120 (1965).
5. S. H. Lee, N. Caron, and A. P. Kimball. Therapeutic effects of 9-B-D-arabinofuranosy- ladenine and 2'-deoxycoformycin combinations on intracerebral leukemia. Cancer Res. 37:1953-1955 (1977).
6. R. H. Adamson, D. W. Zaharevitz, and D. G. Johns. Enhancement of the biological activity of adenosine analogs by the adenosine deamil'._ase inhibitor 2'-deoxycoformycin. Pharmocology 15:84-89 (1977).
7. R. H. Adamson, M. M. Chassin, M. A. Chirigos, and D. G. Johns. Some aspects of the pharmacology of the adenosine deaminase inhibitors 2'deoxycoformycin and erythro-9- (2-hydroxy-3-nonyl)-adenine. In Current Chemotherapy II, W. Siezenthalis and R. Luthy (eds.). American Society for Microbiology, Washington, D.C., 1978, pp. 1116-1118.
8. J. F. Smith, R. C. Young, and D. M. Young. In vivo toxicity to lymphoid tissue by 2'deoxycoformycin. Cancer Chemother. Pharmacol. 1:49-51 (1978).
9. W. R. McConnell, R. L. Furner, and D. L. Hill. Pharmacokinetics of 2'deoxycoformycin in normal and L12'10 leukemic mice. Drug Metab. Dispos. 7:11-13 (1979).
10. W. R. McCor~ell, W. J. Suling, L. S. Rice, W. M. Shannon, and D. L. Hill. The use of microbiological and enzymatic assays in studies of the disposition of 2'-deoxycoformycin in the mouse. Cancer Treat. Rep. 62:1153-1159 (1978).
11. M. M. Chassin, R. H. Adamson, D. W. Zaharevitz, and D. G. Johns. Enzyme inhibition titration assay for 2'deoxycoformycin and its applications to the study of the relationship between drug concentration and tissue adenosine deaminase in dogs and rats, Biochem. Pharmacol. 28:1849-1855 (1979).
12. K. J. Hirnmelstein and R. J. Lutz. A review of the applications of physiologically based pharmacokinetic modeling. J. Pharmacokinet. Biopharm. 7:127-145 (1979).
13. K. B. Bischoff, R. L. Dedrick, D. S. Zaharko, and J. A. Longstreth. Methotrexate pharmacokinetics. J. ['harm. ScL 60:1128-1133 (1971).
14. P. E . Barondy, T. Chang, E. Maschewske, and A. J. Glazko. Inhibition of adenosine deaminase by co-vidarabine and its effects on the metabolic disposition of adenine arabinoside (Vidarabine). Ann. N. Y. Acad. Sci. 284:9-20 (1977).
15. F. G. King and R. L. Dedrick. Pharmacokinetic model for 2-aminothiadiazole in mouse, dog and monkey. Cancer TreaL Rep. 63:1939-1947 (1979).
16. J. F. Smyth, R. M. Paine, A. L, Jackman, K. R. Harrap, M. M. Chassin, R. H. Adamson, and D. G. Johns. The clinical pharmacology of adenosine deaminase inhibitor 2'-deoxy- coformycin. Cancer Chemother. Pharmacol. 5:93-101 (1980).
17. P. M. Venner and R. I. Glazer. The metabolism of 2'deoxycoformycin by L1210 cells in vitro. Biochem. Pharmacol. 28:3239-3242 (1979).
18. R. L. Dedrick, D. D. Forrester, J. N. Cannon, S. M. E1 Dareer, and L. B. Mellett. Pharmacokinetics of 1-beta-D-arabinofuranosylcytosine (Ara-C) deamination'in several species. Biochem. PharmacoL 22:2405-2417 (1973).
19. J. E. Fletcher and R. I. Shrager. Users Guide to Least Squares Model Fitting. Technical Report No. 1, Division of Computer Research and Technology, National Institute of Health, Washington D,C. 1968.
20. R. J. Lutz, R. L. Dedrick, J. A. Straw, M. M. Hart, P, Klubes, and D. S. Zaharko. The kinetics of methotrexate distribution in spontaneous canine lymphosarcoma. Z Phar- macokin. Biopharm. 3:77-97 (1975).
534 King and Dedrick
21. J. M. Weissbrod and R. K. Jain. Preliminary model for streptozocin metabolism in mice. Y. Pharrn. $ci. 69:691-694 (1980).
22. R. J. Lutz, R. L. Dedrick, and D. S. Zaharko. Physiological pharmacokinetics: an in vivo approach to membrane transport. Pharmacol. Ther. 11:559-592 (1980).
23. A. Tedde, M. E. Balls, R. Schonberg, and P. P. Trotta. Effects of 2'deoxycoformycin infusion on mouse adenosine deaminase. Cancer Res. 39:3044-3050 (1979).
24. J. A. Straw, M. M. Hart, P. Klubes, D. S. Zaharko, and R. L. Dedrick. Distribution of anticancer agents in spontaneous animal tumors. I. Regional blood flow and methotrexate distribution in canine lymphosarcoma. J.N.C.L 52:1327-1331 (1974).