physiological and biomechanical factors...
TRANSCRIPT

i
Thesis for the degree of Doctor of Philosophy
Östersund 2016
PHYSIOLOGICAL AND BIOMECHANICAL FACTORS DETERMINING CROSS-COUNTRY SKIING PERFORMANCE
Erik Andersson
Head supervisor:
Professor, Hans-Christer Holmberg, Mid Sweden University
Co-supervisors:
Senior Lecturer, Glenn Björklund, Mid Sweden University
Associate Professor, Thomas Stöggl, University of Salzburg
Department of Health Sciences
Mid Sweden University, SE-851 70 Sundsvall, Sweden
Swedish Winter Sports Research Centre, Mid Sweden University, Östersund,
Sweden
ISSN 1652-893X
Mid Sweden University Doctoral Thesis 248
ISBN 978-91-88025-69-2

ii
Akademisk avhandling som med tillstånd av Mittuniversitetet i Östersund
framläggs till offentlig granskning för avläggande av filosofie doktorsexamen
fredagen den 10 juni 2016, klockan 13.00 i sal Q221, Mittuniversitetet, Östersund.
Seminariet kommer att hållas på engelska.
PHYSIOLOGICAL AND BIOMECHANICAL FACTORS DETERMINING CROSS-COUNTRY SKIING PERFORMANCE
Erik Andersson
© Erik Andersson, 2016
Department of Health Sciences
Mid Sweden University, SE-831 25 Östersund
Sweden
Telephone: +46 (0)771-975 000
Printed by Mid Sweden University Press, Sundsvall, Sweden, 2016
Cover photo taken by Jocke Lagercrantz

iii
ABSTRACT
Cross-country (c.c.) skiing is a complex sport discipline from both physiological and
biomechanical perspectives, with varying course topographies that require different
proportions of the involved sub-techniques to be utilised. A relatively new event in
c.c. skiing is the sprint race, involving four separate heats, each lasting 2-4 min, with
diverse demands from distance races associated with longer durations. Therefore,
the overall aim of the current thesis has been to examine the biomechanical and
physiological factors associated with sprint c.c. skiing performance through novel
measurements conducted both in the field (Studies I-III) and the laboratory (Studies
IV and V).
In Study I sprint skiing velocities and sub-techniques were analysed with a
differential global navigation satellite system in combination with video recording.
In Studies II and III the effects of an increasing velocity (moderate, high and maximal)
on the biomechanics of uphill classical skiing with the diagonal stride (DS) (Study II)
and herringbone (HB) (Study III) sub-techniques were examined.
In Study I the skiers completed the 1,425 m (2 x 712 m) sprint time trial (STT) in 207
s, at an average velocity of 24.8 km/h, with multiple technique transitions (range: 21-
34) between skiing techniques (i.e., the different gears [G2-7]). A pacing strategy
involving a fast start followed by a gradual slowing down (i.e., positive pacing) was
employed as indicated by the 2.9% faster first than second lap. The slower second
lap was primarily related to a slower (12.9%) uphill velocity with a shift from G3
towards a greater use of G2. The maximal oxygen uptake (V̇O2max) was related to the
ability to maintain uphill skiing velocity and the fastest skiers used G3 to a greater
extent than G2. In addition, maximal speed over short distances (50 and 20 m) with
the G3 and double poling (DP) sub-techniques exerted an important impact on STT
performance.
Study II demonstrated that during uphill skiing (7.5°) with DS, skiers increased cycle
rate and cycle length from moderate to high velocity, while cycle rate increased and
cycle length decreased at maximal velocity. Absolute poling, gliding and kick times
became gradually shorter with an elevated velocity. The rate of pole and leg force
development increased with elevated velocity and the development of leg force in
the normal direction was substantially faster during skiing on snow than previous
findings for roller skiing, although the peak force was similar in both cases. The
fastest skiers applied greater peak leg forces over shorter durations.

iv
Study III revealed that when employing the HB technique on a steep uphill slope
(15°), the skiers positioned their skis laterally (“V” between 25 to 30°) and planted
their poles at a slight lateral angle (8 to 12°), with most of the propulsive force being
exerted on the inside forefoot. Of the total propulsive force, 77% was generated by
the legs. The cycle rate increased across all three velocities (from 1.20 to 1.60 Hz),
while cycle length only increased from moderate to high velocity (from 2.0 to 2.3 m).
Finally, the magnitude and rate of leg force generation are important determinants
of both DS and HB skiing performance, although the rate is more important in
connection with DS, since this sub-technique involves gliding.
In Studies IV and V skiers performed pre-tests for determination of gross efficiency
(GE), V̇O2max, and Vmax on a treadmill. The main performance test involved four self-
paced STTs on a treadmill over a 1,300-m simulated course including three flat (1°)
DP sections interspersed with two uphill (7°) DS sections.
The modified GE method for estimating anaerobic energy production during skiing
on varying terrain employed in Study IV revealed that the relative aerobic and
anaerobic energy contributions were 82% and 18%, respectively, during the 232 s of
skiing, with an accumulated oxygen (O2) deficit of 45 mL/kg. The STT performance
time was largely explained by the GE (53%), followed by V̇O2 (30%) and O2 deficit
(15%). Therefore, training strategies designed to reduce energetic cost and improve
GE should be examined in greater detail.
In Study V metabolic responses and pacing strategies during the four successive
STTs were investigated. The first and the last trials were the fastest (both 228 s) and
were associated with both a substantially larger and a more rapid anaerobic energy
supply, while the average V̇O2 during all four STTs was similar. The individual
variation in STT performance was explained primarily (69%) by the variation in O2
deficit. Furthermore, positive pacing was employed throughout all the STTs, but the
pacing strategy became more even after the first trial. In addition, considerably
higher (~ 30%) metabolic rates were generated on the uphill than on the flat sections
of the course, reflecting an irregular production of anaerobic energy. Altogether, a
fast start appears important for STT performance and high work rates during uphill
skiing may exert a more pronounced impact on skiing performance outdoors, due
to the reduction in velocity fluctuations and thereby overall air-drag.
Keywords: cycle characteristics, energy cost, energy yield, incline, joint angles,
kinematics, kinetics, mechanics, Nordic skiing, oxygen deficit, oxygen demand,
technique transitions, total metabolic rate.

v
POPULÄRVETENSKAPLIG SAMMANFATTNING
Längdskidåkning är en komplex idrott från både ett fysiologiskt och biomekaniskt
perspektiv på grund av den stora variationen mellan olika banprofiler där flertalet
deltekniker involveras i olika grad samt att arbetstiden varierar stort mellan olika
tävlingsdistanser. Syftet med denna avhandling var att undersöka hur
biomekaniska och fysiologiska faktorer är associerade till prestationsförmågan inom
sprintskidåkning genom tester vid skidåkning utomhus på snö (Studie I-III) och vid
rullskidåkning inomhus på rullband (Studie IV och V).
I Studie I undersöktes fartstrategier och teknikval/växelval (Vx2-7) vid
sprintskidåkning med ett avancerat positioneringssystem (d-GNSS) som
kombinerades med videoanalys. Ett individuellt sprintlopp på 1425 m (2 x 712 m)
genomfördes på 3:27 min:s (24.8 km/h) och under loppet genomförde skidåkarna i
genomsnitt 28 växlingar mellan de olika delteknikerna. En positiv
farthållningsstrategi användes av skidåkarna (d.v.s. en snabb start med en gradvis
sänkning av åkhastigheten) med ett något snabbare (3 %) första varv. Den
långsammare åkhastigheten under det andra varvet var huvudsakligen relaterat till
en långsammare (12.9 %) åkning uppför där skidåkarna använde Vx2 i större
utsträckning gentemot Vx3. Vidare var den maximala syreupptagningsförmågan
positivt relaterad till skidåkarens förmåga att bibehålla hastigheten i
uppförsbackarna där en större användning av Vx3 jämfört med Vx2 var positivt
kopplat till prestation. En hög maximal fartförmåga i Vx3 (50 m sprinttest) visade
sig också vara en betydelsefull faktor för ett snabbt sprintlopp.
I Studie II och III genomfördes den första biomekaniska analysen av diagonal- och
saxningsteknik vid skidåkning uppför (7,5° backlutning vid diagonal och 15° vid
saxning) med tre olika relativa åkhastigheter (medel, hög och maximal). Vid
diagonalskidåkning (Studie II) ökade skidåkarna hastigheten från medel till hög
arbetsintensitet med en parallell ökning av både rörelsefrekvens (åkcykler/sekund)
och åkcykellängd (m), men från hög upp till maximal åkhastighet ökades
rörelsefrekvensen markant medan åkcykellängden minskade något. De skidåkare
som uppnådde de högsta maximala åkhastigheterna utvecklade en större kraft med
benen som utvecklades över en kortare tid och uppnådde samtidigt en högre
rörelsefrekvens. Vid en jämförelse mot tidigare forskning på rullskidor, var den
vinkelräta kraften mot underlaget vid benfrånskjutet betydligt snabbare vid
skidåkning på snö, även om den maximala kraften var likartad.

vi
I Studie III utfördes saxningstekniken med en relativt smal vinkel mellan skidorna
(”V”; 25-30°) och större delen av benfrånskjutskraften applicerades på framfotens
insida. Av den totala framåtdrivande kraften genererades 77 % med benen och 23 %
med överkroppen. Skidåkarna ökade rörelsefrekvensen från medel till maximal
åkhastighet (från 1.20 till 1.60 åkcykler/sekund), medan åkcykellängden enbart
ökades från medel till hög åkhastighet (från 2.0 till 2.3 m). Slutligen så är kraften
genererad med benen en mycket viktig faktor vid både diagonalskidåkning och
saxning, även om diagonalskidåkning kräver en snabbare kraftutveckling.
I Studie IV och V genomfördes tester med rullskidåkning på band där mekanisk
verkningsgrad (d.v.s. energieffektivitet) och maximal syreupptagningsförmåga
analyserades tillsammans med ett prestationstest som innefattade fyra lopp på en
1300 m simulerad sprintbana. Banan bestod av tre platta åkpartier med stakning (1°)
åtskilda av två uppförsbackar (7°) med diagonalåkning. I Studie IV estimerades
anaerob energiproduktion (s.k. syreskuld) vid åkning på sprintbanan. Sprintloppet
genomfördes på 3:52 min:s där de aeroba och anaeroba bidragen till den totala
energiproduktionen utgjorde 82 respektive 18 %. Det anaeroba bidraget resulterade
i en ackumulerad syreskuld på 45 ml/kg kroppsvikt. Sprintprestationen var starkt
relaterad till mekanisk verkningsgrad (53 %), åtföljd av syreupptagning (30 %) och
syreskuld (15 %). Dessa resultat belyser starkt betydelsen av en hög
energieffektivitet/åkekonomi för en hög prestationsförmåga inom sprintskidåkning.
I Studie V studerades farthållningsstrategier tillsammans med fysiologisk respons
under fyra upprepade sprintlopp. Det första och sista loppet var snabbast (båda 3:48
min:s), relaterat till en större anaerob energiproduktion, där syreupptagningen var
likartad under de fyra loppen. Den individuella variationen i sprintprestation var
huvudsakligen (69 %) relaterad till olika grad av anaerob energiproduktion. En
positiv farthållningsstrategi användes under samtliga sprintlopp och det
individuellt snabbaste loppet genomfördes med en markant högre (5 %) utgångsfart
över den första hälften av banan gentemot det långsammaste loppet. I tillägg
reglerade skidåkarna arbetsintensiteten till olika banpartier, med en markant högre
intensitet (~ 30 %) vid diagonalåkning uppför jämfört med de platta åkpartierna med
stakning vilket resulterade i en mycket varierande anaerob energiproduktion.
Sammanfattningsvis är en hög utgångsfart av stor betydelse vid sprintskidåkning. I
tillägg är en hög arbetsintensitet i uppförsbackarna troligtvis än mer betydelsefullt
vid skidprestation utomhus då en sådan strategi minskar den totala variationen i
åkhastigheten och därmed även det totala luftmotståndet.

vii
LIST OF PAPERS
This doctoral thesis is based on the following five studies, herein referred to by their
Roman numerals:
Study I Andersson E., Supej M., Sandbakk Ø., Sperlich B., Stöggl T. &
Holmberg H-C. 2010. Analysis of sprint cross-country skiing using a
differential Global Navigation Satellite System. Eur J Appl Physiol,
110, 585-95.
Study II Andersson E., Pellegrini B., Sandbakk Ø., Stöggl T. & Holmberg H-C.
2014. The effects of skiing velocity on mechanical aspects of diagonal
cross-country skiing. Sports Biomech, 13, 267-84.
Study III Andersson E., Stöggl T., Pellegrini P., Sandbakk Ø., Ettema G. &
Holmberg H-C. 2014. Biomechanical analysis of the herringbone
technique as employed by elite cross-country skiers. Scand J Med Sci
Sports, 24, 542-52.
Study IV Andersson E., Björklund G., Holmberg H-C., Ørtenblad N. 2016.
Energy system contributions and determinants of performance in
sprint cross-country skiing. Scand J Med Sci Sports.
Study V Andersson E., Holmberg H-C., Ørtenblad N., Björklund G. 2016.
Metabolic responses and pacing strategies during successive sprint
skiing time trials. Submitted to Med Sci Sports Exerc.

viii

ix
ABBREVIATIONS
BW Body weight
c.c. Cross-country
CV Coefficient of variation
d-GNSS Differential Global Navigation Satellite System
DP Double poling
DPkick Kick double poling
DP-Vpeak Peak velocity in DP during the 20-m acceleration test
G3-Vmax Maximal skiing velocity in gear 3
GPS Global Positioning System
DS Diagonal stride
e.g., Exempli gratia, for example
FIS Fédération Internationale de Ski, International Ski Federation
G2-5 Gear 2-5 (the four main skating techniques)
GE Gross efficiency
HB Herringbone
i.e., Id est, that means, in other words
MAOD Maximal accumulated oxygen deficit
O2 Oxygen
RER Respiratory exchange ratio
STT Sprint time trial
Vmax Maximal skiing velocity
Vpeak Peak skiing velocity during an acceleration test
VO2 Accumulated oxygen uptake
V̇O2 Oxygen uptake
V̇O2max Maximal oxygen uptake
V̇O2peak Peak oxygen uptake
SD Standard deviation

x

xi
TABLE OF CONTENTS
ABSTRACT ...................................................................................... III
POPULÄRVETENSKAPLIG SAMMANFATTNING ..........................V
LIST OF PAPERS ........................................................................... VII
ABBREVIATIONS ............................................................................ IX
TABLE OF CONTENTS ................................................................... XI
1. INTRODUCTION ........................................................................... 1
1.1. THE HISTORY OF CROSS-COUNTRY SKI RACING ............................................ 1
1.2. THE SUB-TECHNIQUES EMPLOYED IN C.C. SKIING ........................................ 2
1.3. NEW RACING FORMATS AND TECHNICAL DEVELOPMENTS ....................... 3
1.4. CURRENT DEMANDS AND TRAINING REGIMES .............................................. 4
1.5. AEROBIC ENERGY SUPPLY .................................................................................. 5
1.6. ECONOMY OF MOVEMENT AND GROSS EFFICIENCY .................................... 6
1.7. ANAEROBIC ENERGY SUPPLY ............................................................................. 7
1.8. PACING STRATEGIES ............................................................................................. 8
1.9. THE BASIC MECHANICAL PRINCIPLES OF C.C. SKIING .................................. 9
1.10. SELECTION OF SUB-TECHNIQUES IN C.C. SKIING ......................................... 9
1.11. KINETIC ASPECTS OF C.C. SKIING................................................................... 10
1.12. KINEMATIC ASPECTS OF C.C. SKIING ............................................................ 11
1.13. THE COMPLEXITY OF C.C. SKIING PERFORMANCE .................................... 13
1.14. DIFFERENCES BETWEEN C.C. SKIING ON SNOW AND ROLLER SKIING . 14
2. AIMS ............................................................................................ 15
3. METHODS ................................................................................... 17
3.1. PARTICIPANTS ...................................................................................................... 17
3.2. STUDY OVERVIEW ............................................................................................... 17
3.2.1. In the field .......................................................................................................... 17
3.2.2. In the laboratory ................................................................................................ 18
3.3. EQUIPMENT ........................................................................................................... 18
3.3.1. In the field .......................................................................................................... 18
3.3.2. In the laboratory ................................................................................................ 19
3.4. MEASUREMENTS AND PROTOCOLS ................................................................. 20
3.4.1. In the field .......................................................................................................... 20
3.4.2. In the laboratory ................................................................................................ 21

xii
3.5. CALCULATIONS (FOR DETAILS, SEE STUDIES II-V) ....................................... 23
3.6. STATISTICS ............................................................................................................ 27
4. RESULTS .................................................................................... 29
4.1. STUDY I ................................................................................................................... 29
4.2. STUDY II .................................................................................................................. 31
4.3. STUDY III ................................................................................................................ 33
4.4. STUDY IV ................................................................................................................ 35
4.5. STUDY V ................................................................................................................. 38
5. DISCUSSION .............................................................................. 43
5.1. KINEMATICS .......................................................................................................... 43
5.2. KINETICS ................................................................................................................ 45
5.3. SPEED CAPACITY .................................................................................................. 46
5.4. AEROBIC ENERGY SUPPLY ................................................................................ 47
5.5. GROSS EFFICIENCY (GE) ..................................................................................... 48
5.6. ANAEROBIC ENERGY SUPPLY ........................................................................... 49
5.7. PACING STRATEGIES AND ASSOCIATED METABOLIC RESPONSES ......... 51
5.8. TRANSITIONS BETWEEN SUB-TECHNIQUES .................................................. 53
5.9. METHODOLOGICAL CONSIDERATIONS .......................................................... 54
6. CONCLUSIONS .......................................................................... 57
7. PRACTICAL APPLICATIONS .................................................... 59
8. ACKNOWLEDGEMENTS ........................................................... 61
9. REFERENCES ............................................................................ 63

1
1. INTRODUCTION
1.1. THE HISTORY OF CROSS-COUNTRY SKI RACING
The origin of cross-country (c.c.) skiing as a mode of transport dates back thousands
of years to 2000 B.C. and introduced to reduce the energetic cost for daily activities
such as travelling, hunting and fighting (Clifford, 1992). The historical overview by
Formenti et al. (2005) describes how advances in c.c. skiing equipment have
progressively decreased the energetic cost and increased the skiing velocity (Fig. 1),
resulting in a velocity twice as high today as at a similar metabolic rate ~ 1500 years
ago. The first known competition in c.c. skiing was held in Tromsø, Norway, in 1843
and the sport has been on the Olympic program since the first Winter Games (1924)
in Chamonix (Clifford, 1992).
Figure 1. This figure is based on the previous work by Formenti et al. (2005). (A) The estimated
relationships (three-colour curves) between skiing velocity and covered distance in relation to energetic
cost (J/m) for different ski-equipment. This was obtained by using the available fraction of the maximal
metabolic power (20.3 W/kg [~ 59 mL/kg/min]) used for different exercise durations (blue: 40 s to 10 min;
light orange: 10 min to 1 h; green: 1 to 24 h, respectively). The squares represent current records in c.c.
skiing, from sprint to long distance races. The black square represents the historical pursuit of Gustaf
Vasa (1520 AD) and the circle represents the Birkebeiner skiers bringing the Norwegian prince child to
safety. (B) The historical painting of the Birkebeiner skiers in 1206 AD.
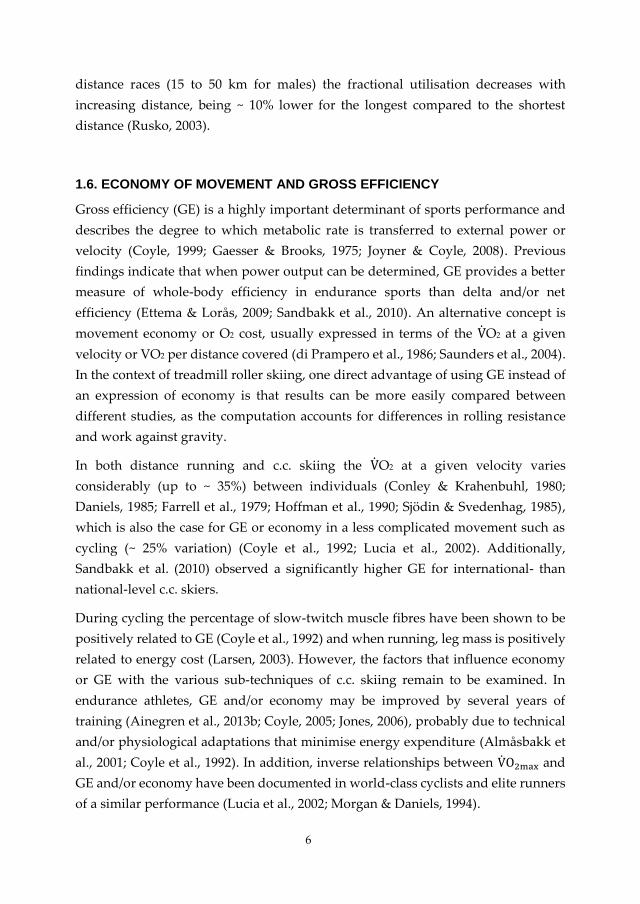
During the late 1970s when machine-grooming became a regular way of preparing
ski-tracks, the c.c. skating technique started to emerge and somewhat later during
the 1980s the American skier Bill Koch transformed the sport by introducing the
Marathon skating technique (i.e., skating with one ski in the classic track) (Fig. 2A).
In the Winter Olympic Games in Sarajevo in 1984 the fastest skiers used skating over
the flatter sections of the course, in combination with traditional classical skiing.
Moreover, in the World Championships in Seefeld in 1985 all the medallists used the

2
skating technique, with the best competitor using grip wax for classical skiing placed
24th (ISHA, 2016). To restrict the use of skating during competitions, it was banned
over certain sections of a track. However, some athletes ignored this ban with
dramatic consequences as described by the Swedish general of the International Ski
Federation (FIS) Bengt Erik Bengtsson: ”At Lahti, Finland, in another World Cup race,
skate-less zones were created. When an Italian racer skated through one, the Finnish coach
grabbed him and threw him off the track” (ISHA, 2016). Consequently, in May 1986, FIS
divided c.c. skiing competitions into two different styles, the traditional classic and
the new freestyle technique (i.e., skating). Since then skating (Fig. 2B) has been
shown to be ~ 10% faster than classical skiing (Losnegard, 2013).
Figure 2. (A) The World Cup champion, Bill Koch, in 1982 employing the marathon skating technique.
(B) The modern skating technique employed during a 50-km World Championship race in 2011.
1.2. THE SUB-TECHNIQUES EMPLOYED IN C.C. SKIING
C.c. skiing is a relatively complex endurance sport involving several different sub-
techniques that are intermittently used during a race, according to the terrain and
skiing velocity, in order to minimise energetic cost and improve finishing time
(Bilodeau et al., 1992; Nilsson et al., 2004a). The skating style encompasses four
different sub-techniques, or so-called gears (G2-5) (Nilsson et al., 2004a). The lower
gears are used on uphill sections at slower velocities, while the higher gears are used
on flatter and/or downhill sections at higher velocities (for a detailed description see
Figure 7 in Chapter 3).
In the classical style there are also four different sub-techniques: double poling (DP),
kick double poling (DPkick), diagonal stride (DS) and herringbone (HB) (Fig. 3). The

3
sub-technique that most closely resembles the basic locomotion patterns of walking
and running is DS, where both arms and legs are involved in generating propulsion.
Although not as frequently used as the other sub-techniques, HB is commonly
required on steeper uphill terrain or when there is insufficient grip for DS. With HB
the skis are angled outwards relative to the direction of skiing (as for skating) in
order to attain adequate grip for propulsion. In DP propulsive forces are applied
only through the poling action, making this technique well-suited for relatively flat
terrain at high velocities, while the DPkick is more effective on slight uphill gradients
as a single leg kick is performed in connection to the poling action (Smith, 2003). The
DP and DS sub-techniques are the two main classical sub-techniques used during
training and racing.
Figure 3. Schematisation of the different classical sub-techniques used in cross-country skiing. DP, double
poling; DPkick, kick double poling; DS, diagonal stride; HB, herringbone.
Skating is generally faster than classical skiing due to that the ski is always gliding
with no need for grip wax, while with the classical technique the ski is briefly
stationary for a period during the leg push-off. Moreover, the period during which
legs generate force is considerably longer during skating (Bilodeau et al., 1992;
Frederick, 1992; Smith, 2003).
1.3. NEW RACING FORMATS AND TECHNICAL DEVELOPMENTS
Since the mid-1900s c.c. skiing equipment has improved dramatically, from wooden
to expensive high-tech skis made of composite and carbon-fibre materials. As early
as 1992, Clifford described modern c.c. skiing as “a world of high tech: lightweight
composite skies, kewlar-wrapped poles, spandex tights, sophisticated boot/binding systems,
neon colors, expensive fluorocarbon waxes” and today this is even more true (Clifford,
1992). Furthermore, since the early 1990s competitions in c.c. skiing have changed
rapidly with the introduction of several head-to-head competitions, including
sprint, team sprint, skiathlon, and long-distance mass-start races. In fact, 10 of the 12

4
current Olympic c.c. ski races begin with a mass start (FIS, 2016). These rapid
changes have altered the associated physiological, biomechanical and tactical
demands on racing substantially. For instance, head-to-head competitions place
greater demands on anaerobic capacity, explosive power and high maximal speed
as the outcome of races is often decided in the final spurt (Rusko, 2003; Stöggl et al.,
2006; 2007). Between the early 1990s and 2010, the average racing velocity during
World Cup distance events has increased by ~ 5-8%, being ~ 20% faster in sprint than
distance races (i.e., 10- or 15-km races for females and males, respectively)
(Losnegard, 2013). These improvements most likely reflect advances in skiing
equipment, changes in training regimes and newly-developed technical strategies,
such as the “double-push” G3 skating (Stöggl et al., 2010; Stöggl et al., 2008),
“running” DS (Stöggl et al., 2011) and “kangaroo” DP (Holmberg et al., 2005).
1.4. CURRENT DEMANDS AND TRAINING REGIMES
At present the most successful male distance c.c. skiers from Norway and Sweden
demonstrate a maximal aerobic metabolic rate (V̇O2max) of ~ 80 to 90 mL/kg/min,
although values tend to be lower for specialised sprint skiers due to a slightly larger
muscle mass (Sandbakk & Holmberg, 2014). At the same time, upper-body strength,
power and endurance have developed rapidly over the past two centuries
(Losnegard & Hallén, 2014; Sandbakk & Holmberg, 2014; Stöggl et al., 2011) and to
be successful today a c.c. skier must exhibit more extensive anaerobic and upper-
body power, higher maximal speed and intelligent tactics in head-to-head races
(Sandbakk & Holmberg, 2014). Maximal skiing velocity (Vmax) over a short distance
has been found to be highly related to sprint-skiing performance over a longer
distance, which emphasises the need of strength and power in combination with
technical ability (Sandbakk et al., 2011; Stöggl et al., 2007). In addition, more and
more skiers have recently begun to use DP exclusively during the classical marathon
races (40 to 90 km), without using grip wax. To meet these new demands, training
has changed in a number of ways: 1) more specific training is carried out on roller-
skis on race-specific terrain (i.e., roller-ski tracks); 2) more upper body strength and
endurance training is completed; and 3) more systematic training is used to develop
maximal skiing velocity (Sandbakk & Holmberg, 2014).
Altogether, these rapid developments in track preparation, equipment and training
regimes have markedly enhanced racing performance. The associated demands
require further scientific evaluation in order to provide both coaches and skiers with

5
the basic “tools” necessary for the development of optimal training programs. The
variations in environmental conditions, the topography of ski tracks, and the sub-
techniques involved in c.c. skiing result in more complex demands than in most
other endurance sports. Therefore, a combination of sophisticated measurements
both in the field and in the laboratory are required to enhance the understanding of
fundamental performance determinants in c.c. skiing.
1.5. AEROBIC ENERGY SUPPLY
Elite c.c. skiing is physiologically demanding, requiring a high V̇O2max, an ability to
exercise for prolonged periods at a high fraction of V̇O2max (i.e., well-developed
endurance), considerable anaerobic capacity and power, as well as an effective
movement economy that minimises the overall energy cost of skiing. Racing
performance is closely related to the performance V̇O2 (i.e., the aerobic metabolic rate
during a race), where the maximal limit is set by V̇O2max (Joyner & Coyle, 2008). V̇O2max
is determined by a myriad of closely coordinated factors involved in the oxygen (O2)
transport chain (Wagner, 1996; 2000), including the capacity of the lungs to transfer
O2 from the air to blood, blood and erythrocyte volumes, the pumping capacity of
the heart (i.e., cardiac output), the microcirculation that distributes blood to the
muscles and O2 extraction by the muscles (Wagner, 1991).
During exercise at sea level with a large engaged muscle mass, e.g., cycling, running
or c.c. skiing, the predominant limitation of V̇O2max has been proposed to be the
maximal cardiac output (Bassett & Howley, 2000; Calbet et al., 2004). However,
during c.c. skiing different sub-techniques are employed that differ in regard to
propulsion and muscle recruitment. Consequently, V̇O2max in each specific sub-
technique may differ. For example, Holmberg et al. (2007) observed a 14% lower
V̇O2max during DP compared to DS.
Although V̇O2max sets the upper limit for aerobic metabolic rate, the endurance of
athletes can vary considerably (Joyner & Coyle, 2008). The aerobic capacity (i.e.,
endurance) of an athlete is reflected as the performance V̇O2 relative to V̇O2max,
termed as the fractional utilisation of V̇O2max. A fractional utilisation of ~ 83% has
been observed during 600-m simulated uphill (7°) sprint races on a treadmill with
an average completion time of ~ 3 min (Losnegard et al., 2012a; McGawley &
Holmberg, 2014) and a slightly higher value (88%) was reported for a 6-km
simulated ski-race with an average duration of ~ 23 min (Welde et al., 2003). During
6
distance races (15 to 50 km for males) the fractional utilisation decreases with
increasing distance, being ~ 10% lower for the longest compared to the shortest
distance (Rusko, 2003).
1.6. ECONOMY OF MOVEMENT AND GROSS EFFICIENCY
Gross efficiency (GE) is a highly important determinant of sports performance and
describes the degree to which metabolic rate is transferred to external power or
velocity (Coyle, 1999; Gaesser & Brooks, 1975; Joyner & Coyle, 2008). Previous
findings indicate that when power output can be determined, GE provides a better
measure of whole-body efficiency in endurance sports than delta and/or net
efficiency (Ettema & Lorås, 2009; Sandbakk et al., 2010). An alternative concept is
movement economy or O2 cost, usually expressed in terms of the V̇O2 at a given
velocity or VO2 per distance covered (di Prampero et al., 1986; Saunders et al., 2004).
In the context of treadmill roller skiing, one direct advantage of using GE instead of
an expression of economy is that results can be more easily compared between
different studies, as the computation accounts for differences in rolling resistance
and work against gravity.
In both distance running and c.c. skiing the V̇O2 at a given velocity varies
considerably (up to ~ 35%) between individuals (Conley & Krahenbuhl, 1980;
Daniels, 1985; Farrell et al., 1979; Hoffman et al., 1990; Sjödin & Svedenhag, 1985),
which is also the case for GE or economy in a less complicated movement such as
cycling (~ 25% variation) (Coyle et al., 1992; Lucia et al., 2002). Additionally,
Sandbakk et al. (2010) observed a significantly higher GE for international- than
national-level c.c. skiers.
During cycling the percentage of slow-twitch muscle fibres have been shown to be
positively related to GE (Coyle et al., 1992) and when running, leg mass is positively
related to energy cost (Larsen, 2003). However, the factors that influence economy
or GE with the various sub-techniques of c.c. skiing remain to be examined. In
endurance athletes, GE and/or economy may be improved by several years of
training (Ainegren et al., 2013b; Coyle, 2005; Jones, 2006), probably due to technical
and/or physiological adaptations that minimise energy expenditure (Almåsbakk et
al., 2001; Coyle et al., 1992). In addition, inverse relationships between V̇O2max and
GE and/or economy have been documented in world-class cyclists and elite runners
of a similar performance (Lucia et al., 2002; Morgan & Daniels, 1994).

7
In the case of c.c. skiing, evaluating the impact of GE on race performance is rather
complicated due to the different sub-techniques that are employed at various
gradients and velocities. In such an assessment, GE in the associated skiing sub-
techniques have to be analysed over several different submaximal velocities and/or
inclines. For example, Ainegren et al. (2013b) showed that an elevated slope gradient
may increase the GE of skiing with the DS or G3 sub-techniques. In addition, during
fast DP skiing, high muscle contraction velocities may reduce the mechanical
efficiency of the muscles involved (Hill, 1922), thereby lowering GE similarly as
observed for cycling at high cadences (Chavarren & Calbet, 1999; Ettema & Lorås,
2009).
1.7. ANAEROBIC ENERGY SUPPLY
Performance in endurance sports is closely associated with the rate of aerobic energy
supply (Joyner & Coyle, 2008), while the overall significance of anaerobic energy
supply is considered to be lower. During distance ski races the level of blood lactate,
which is used as a surrogate marker of anaerobic energy production, rises rapidly to
5-10 mmol/l during the first 10 min and increases more slowly thereafter up to 7-19
mmol/l immediately following a 15-km race (Mygind et al., 1994; Rusko, 2003).
Although the overall contribution of anaerobic energy during distance c.c. ski races
is low relative to the aerobic contribution, the work intensities of ~ 110-130% of
V̇O2max observed over short uphill sections indicate a considerable generation of
anaerobic energy (Norman et al., 1989; Rusko, 2003). These anaerobic bursts are
made possible by anaerobic recovery on downhill stretches (with regeneration of
phosphocreatine stores and clearance of blood lactate via subsequent oxidation)
(Rusko, 2003; Sahlin et al., 1979). Accordingly, the varying work intensities involved
in c.c. skiing are likely to enhance the importance of anaerobic energy production.
Indeed, Björklund et al. (2011) demonstrated superior blood lactate recovery in elite
compared to moderately-trained skiers roller skiing at variable intensity.
In contrast to aerobic energy, the supply of anaerobic energy is limited by the
availability of substrates and accumulation of their metabolic by-products, which
means that the relative anaerobic energy contribution declines with longer exercise
duration (Gastin, 2001). In running, for example, anaerobic metabolism accounts for
~ 40% and ~ 23% during 800-m and 1500-m events, respectively (Duffield et al.,
2005a; 2005b). The contribution from aerobic energy pathways during exercise can
easily be quantified on the basis of V̇O2, while the assessment of anaerobic energy is

8
more complicated. The most frequently used approaches for estimating maximal
anaerobic energy production during supramaximal whole-body exercise are the
maximal accumulated O2 deficit (MAOD) and GE methods (Medbø et al., 1988;
Serresse et al., 1988).
Anaerobic energy contributions during simulated uphill sprint c.c. skiing time trials
(600 m, 7°), lasting ~ 3 min, have been shown to be ~ 22% and ~ 26% with G2 and DS,
respectively (Losnegard et al., 2012a; McGawley & Holmberg, 2014). In addition,
anaerobic capacity has been identified as the key predictor of sprint-skiing
performance (Losnegard et al., 2012a). However, the overall importance and
distribution of anaerobic energy production during sprint c.c. skiing with different
sub-techniques on varying terrain requires further investigation.
1.8. PACING STRATEGIES
In connection with maximal performances over durations similar to sprint skiing
(i.e., ~ 2-4 min), a fast start with subsequently declining velocity (i.e., positive pacing)
is beneficial for performance (Abbiss & Laursen, 2008; Bishop et al., 2002; de Koning
et al., 1999; Tucker & Noakes, 2009). An analysis of the men’s 800-m world records
revealed that 26 out of 28 records involved positive pacing with a substantial
slowing down during the final 400 m (Tucker et al., 2006). In addition, as the event
duration approaches 4 min the pacing strategy becomes more even (Abbiss &
Laursen, 2008; Tucker & Noakes, 2009).
For endurance performance over an undulating course and/or with varying wind
resistance, a variable pacing strategy is usually employed (Abbiss & Laursen, 2008).
The undulating terrain and various sub-techniques employed during sprint races in
c.c. skiing make pacing even more complex than in other endurance sports. No
intermediate times are currently provided during sprint events, which limits the
possibility for detailed analyses of skiers’ technical and tactical strategies. One
possibility for providing more detailed performance analyses of pacing in the field
is the differential global navigation satellite system (d-GNSS), which has a superior
measurement accuracy compared to conventional global positioning system (GPS)
devices (Terrier et al., 2000; Terrier & Schutz, 2003; Terrier et al., 2005; Takac et al.,
2005). Such measurements, in combination with laboratory assessments of metabolic
responses associated with self-selected pacing during sprint skiing on a simulated

9
treadmill course with a varied topography, would provide novel insights into the
distribution of energetic resources and its relationship to performance.
1.9. THE BASIC MECHANICAL PRINCIPLES OF C.C. SKIING
When a skier applies forces to the ground, the reaction force generated in the
direction of movement (i.e., propulsive forces) is largely determining the velocity
(Smith, 2003). A number of mechanical factors exert direct and indirect effects on the
resulting performance (Frederick, 1992). Gravity is normally the major constraint on
performance, propelling the skier downhill and resisting the skier during the uphill.
The second most significant factor is the snow friction that limits ski glide. The
component of snow friction is the sum of dry friction, wet friction together with
impact and compression resistance when the ski compresses the snow surface. The
influence of each respective factor varies with snow type, temperature and
humidity, making ski selection and waxing crucial to racing performance (Buhl et
al., 2001; Smith, 2003). The third factor restricting performance is aerodynamic drag,
which at high downhill skiing velocities becomes more important than snow
friction. Aerodynamic drag can be minimised by using a tucked position when
gliding downhill, using an aerodynamic racing suit and/or by following closely
behind another skier (Bilodeau et al., 1994; Frederick, 1992). In addition, pacing
strategies designed to minimise overall variation in racing velocity may improve c.c.
skiing performance by lowering aerodynamic drag as previously has been observed
when modelling cycling performance (Atkinson et al., 2007a; Atkinson et al., 2007b;
Boswell, 2012; Swain, 1997) and c.c. skiing performance (Sundström et al., 2013).
1.10. SELECTION OF SUB-TECHNIQUES IN C.C. SKIING
In c.c. skiing a specific sub-technique is mechanically and energetically beneficial for
specific types of terrain and/or velocities (Smith, 2003). The skier’s velocity over a
race course is determined by a combination of resistive forces together with the
metabolic power and GE (Frederick, 1992; Sundström et al., 2013). With any given
sub-technique the ability to apply forces is largely dependent on the skiing velocity,
since the time of force generation and magnitude of force is related to the force-
velocity or power-velocity relationships of muscles (Hill, 1922; Østerås et al., 2002).
When c.c. skiing uphill, pole forces are applied more effectively with DS than DP.
With DP a greater amount of the total work is generated by the upper body and

10
forces may exceed the physiological optimum (Pellegrini et al., 2013). Another
negative aspect of DP during uphill skiing is that the phase of deceleration during
each movement cycle is higher due to the shorter relative phase of propulsion than
for DS, which also involves propulsion generated by the legs (Hoffman et al., 1994;
Millet et al., 1998b). These factors probably exert a direct influence on the energetic
cost of the classical DP sub-technique, making it less economical than DS on inclines
steeper than 3° (Pellegrini et al., 2013).
Although selection of and transitions between sub-techniques are a unique
characteristic of c.c. skiing, the influence of skiing velocity, incline and energetic cost
in relation to transitions during exhaustive sprint-skiing time trials have, to our
knowledge, not yet been evaluated in the field and/or the laboratory. Minimisation
of energetic cost has been proposed to be the main factor determining transitions
between walking and running (Bramble & Lieberman, 2004; Margaria, 1976).
However, the comfort of locomotion is likely to be more dominant than energetic
cost in determining such transitions (Minetti et al., 1994). Moreover, in the context
of classical c.c. skiing, Pellegrini et al. (2013) recently showed that biomechanical
constraints for pole and leg force application were more related to the selection of
sub-techniques. Altogether, the choice of sub-technique used during c.c. skiing is
based on complex interactions between skiing velocity, slope gradient and the
physiological as well as biomechanical ability to generate forces (Cignetti et al., 2009;
Kvamme et al., 2005; Pellegrini et al., 2013). Hence, an additional challenge for the
c.c. skier is not only to decide when to change sub-technique, but also to manage the
biomechanical and physiological changes for the muscles involved (Björklund et al.,
2015; Björklund et al., 2010; van Hall et al., 2003).
1.11. KINETIC ASPECTS OF C.C. SKIING
The classical sub-techniques with the greatest reliance on the upper-body for
generating propulsion are DP and DPkick. In DP all propulsion is generated axially
through the poles over ~ 0.47 s at 15 km/h (Lindinger et al., 2009b; Millet et al., 1998b;
Nilsson et al., 2004a) to 0.25 s at 29 km/h (Lindinger et al., 2009b). The generated
peak pole forces are ~ 25-50% of an individual’s body weight (BW) (Holmberg et al.,
2005; Millet et al., 1998b; Stöggl & Holmberg, 2016), with a propulsive component of
~ 55% of the mean axial resultant force (Stöggl & Holmberg, 2016). With DPkick
employed at a moderate uphill (3°), the peak pole force ranges between 22-28% of

11
BW and is increasing with elevated velocities (from 13 to 19 km/h) (Göpfert et al.,
2013).
The vertical peak leg-thrust forces generated during DS are 200-300% of BW, while
the propulsive peak force is only 10-25% of BW (Smith, 2003; Pierce et al., 1987). In
order to generate this propulsive force, the ski must be stationary for a brief period
(~ 0.10-0.25 s) (Komi, 1987; Komi & Norman, 1987; Nilsson et al., 2004a; Vähäsöyrinki
et al., 2008) and the grip-waxed midsection of the ski has to attach to the snow
momentarily. This vertical force component is important for creating sufficient static
friction to avoid slipping, which differs from roller skiing with ratcheted wheels
(Ainegren et al., 2013a). The pole forces associated with DS on snow are 13-17% of
BW with a propulsive component of ~ 65% (Pierce et al., 1987). Therefore, leg thrust
forces are considerably greater than pole forces, a larger proportion of the axial
poling force is propulsive.
The HB technique is required on steeper uphill terrain and/or when the grip is
insufficient to allow DS. In such cases, the skis are angled outwards in relation to the
direction of skiing in order to achieve sufficient static friction to allow propulsion
and, in contrast to the lateral push-off when skating, the skis are not allowed to glide
(FIS, 2016). To date, the biomechanical aspects of the HB sub-technique have not
been examined in detail.
During G2 skating uphill, leg-thrust forces are applied over an ~ 70% longer time
than during DS and pole forces are ~ 2-4 times greater, contributing to ~ 60% of the
total propulsion (Smith, 1992). However, Stöggl & Holmberg (2015) recently
reported that pole forces contribute to 44% of the total propulsion in G2. The force
effectiveness (i.e., the ratio between propulsive and resultant forces) was noticeably
higher for the pole than leg forces (~ 59% versus 11%), with resultant peak-pole and
leg-thrust forces of ~ 34% and ~ 140% of BW, respectively. Moreover, the
contribution of the upper body to total propulsion may be even greater for uphill
skiing with G3, emphasising the importance of well-developed upper-body strength
and endurance (Smith, 2003).
1.12. KINEMATIC ASPECTS OF C.C. SKIING
Speed (m/s) of c.c. skiing is equal to cycle length (m) multiplied by cycle rate (cycles/s
[Hz]) (Bilodeau et al., 1996). Several studies (Bilodeau et al., 1996; Lindinger et al.,
2009a; Norman et al., 1989; Sandbakk et al., 2010; Smith, 1992) evaluating the skating

12
and/or classical styles of c.c. skiing have revealed that faster skiers generate longer
cycle lengths with more powerful leg and/or pole thrusts, while the cycle rate for
skiers of different levels is relatively similar. With all sub-techniques skiers may
regulate velocity primarily by adjusting the cycle rate (Hoffman et al., 1995; Millet
et al., 1998b; Nilsson et al., 2004a). However, recent studies (Lindinger & Holmberg,
2011; Lindinger et al., 2009b; Vähäsöyrinki et al., 2008) have shown that elite skiers
regulate the velocity by adjustments of both cycle rate and cycle length up to high
velocities, while the increase from high up to maximal velocities mainly relies on an
elevated cycle rate (Lindinger et al., 2009b; Vähäsöyrinki et al., 2008).
In an analysis of a World Cup sprint competition, Zory et al. (2005) found a positive
correlation between cycle rate and DS velocity, where cycle rate was also related to
overall performance, but there was no evident relationship between cycle length and
performance. Thus, the fastest skiers generated sufficient force to conserve cycle
length at a higher cycle rate, despite the shorter time for generating propulsive
forces. In addition, in order to maintain the duration and momentum of the leg
thrust while increasing the velocity of uphill (7°) DS roller skiing from high to
maximal, skiers adopt a high-frequency running DS technique without gliding, i.e.,
utilising a substantially higher cycle rate and shorter cycle length (Stöggl et al., 2011).
Although a long cycle length is important for DS skiing performance (Lindinger et
al., 2009a), an increased cycle rate is probably more important for generating high
maximal velocities (Stöggl et al., 2011). This may be even more essential in the case
of steep uphill skiing, since a high cycle rate minimises the absolute duration of the
non-propulsive deceleration phase (Zory et al., 2005) and large oscillations in kinetic
energy are costly from a metabolic standpoint (Frederick, 1992). The HB sub-
technique, which is usually employed on the steepest uphill sections, lacks a gliding
phase; this limits the possibility of increasing cycle length, so that adaptation of cycle
rate may be more important in regulating velocity.
A fundamental question in connection with all skiing techniques is how velocity is
regulated. Nevertheless, only Vähäsöyrinki et al. (2008) have examined the effects of
different velocities on both the kinematics and kinetics of DS on snow. However,
that study was performed on an incline of 2.5°, where elite skiers would normally
use the DPkick or DP sub-techniques (Göpfert et al., 2013; Smith, 2003). Therefore, a
similar biomechanical investigation at a gradient on which DS is normally
performed would be informative.

13
1.13. THE COMPLEXITY OF C.C. SKIING PERFORMANCE
A schematic illustration of the various key factors that influence performance in c.c.
skiing is illustrated in Figure 4. Skiing velocity is directly related to power output
and mechanical constraints (Frederick, 1992). The power output is set by the total
metabolic rate multiplied by the GE, which are each further related to several
physiological and biomechanical factors. The regulation of velocity (i.e., pacing) and
hence the metabolic rate is set by a feedback control system between the central
nervous system and the skeletal muscles in order to optimise performance in relation
to the duration and physiological resources, as well as to avoid critical metabolic
disturbances that may lead to a deterioration in performance (Noakes et al., 2005; St
Clair Gibson et al., 2006; Tucker & Noakes, 2009; Ulmer, 1996). Although
performance in all endurance sports is set by a complex integration of governing,
mechanical, biomechanical and physiological factors, performance in c.c. skiing is
even more complex due to the different sub-techniques involved, the variety of
course distances and terrain, the varying external conditions and the importance of
proper selection and preparation of skis.
Figure 4. A modified schematic illustration of the interaction between key factors related to c.c. skiing
performance. The physiological part of this illustration is mainly based on the work of Joyner & Coyle
(2008). Abbreviations: MRtot, total metabolic rate; MRae, aerobic metabolic rate; MRan, anaerobic metabolic
rate; GE, gross efficiency.

14
1.14. DIFFERENCES BETWEEN C.C. SKIING ON SNOW AND ROLLER SKIING
Skiers use roller skiing for training and testing due to the close similarities to c.c.
skiing on snow (Mahood et al., 2001; Millet et al., 2002). However, one major
difference between the two skiing modes involves the components of friction
(Dillman & Dufek, 1983). Roller skiing encompasses work against rolling resistance,
while skiing on snow involves gliding resistance, which is more complex and
relatively difficult to quantify. The coefficient of rolling resistance of a pre-warmed
roller ski is influenced slightly by the normal force (i.e., the weight of the skier),
decreasing linearly with greater loading (Ainegren et al., 2008). By contrast, the
coefficient of snow friction is lower for heavier skiers than that for lighter skiers only
at temperatures below -6°C, with no clear dependency of loading on the gliding
properties at warmer temperatures (Buhl et al., 2001). In addition, the resistance for
gliding on snow is lowest at a surface temperature of ~ -3° C.
To avoid compromising internal validity due to changing weather conditions, many
recent investigations on c.c. skiing have been performed indoors using roller skis on
large treadmills (Ainegren et al., 2013b; Björklund et al., 2010; Holmberg et al., 2005;
Lindinger et al., 2009b; Sandbakk et al., 2010; Stöggl et al., 2011; McGawley &
Holmberg, 2014; Mourot et al., 2015). Although tests in such a controlled
environment exhibit high internal validity, the external validity may be
questionable, since roller skiing does not exactly replicate skiing on snow (Ainegren
et al., 2013a). Therefore, field measurements are highly important for developing our
knowledge of the physiological and biomechanical responses to c.c. skiing on snow.

15
2. AIMS
The overall aim of the present thesis was to further our current understanding of the
biomechanical and physiological factors that influence c.c. sprint-skiing
performance in the field and in the laboratory.
The general aims of the studies were as follows:
1. (a) To describe skiing velocities and choice of sub-techniques during a simulated
skating sprint time trial (STT) on snow; (b) To describe the relationships of these
factors, as well as V̇O2max and speed capacity to performance (Study I).
2. To evaluate the biomechanics of velocity adaptation during DS and HB on snow,
as well as to characterise the biomechanics of HB in greater detail (Studies II and III).
3. To assess the contributions of aerobic and anaerobic energy during a classical
1,300-m STT on a simulated undulating treadmill course and to determine the O2
deficit using a novel GE approach (Studies IV and V).
4. To evaluate the relative impact of V̇O2, O2 deficit and GE on STT performance
(Study IV) and to describe the metabolic response associated with self-selected
pacing strategies during four successive 1,300-m STTs (Study V).
The aims and hypotheses are described in greater detail in the individual articles.

16

17
3. METHODS
3.1. PARTICIPANTS
In the present thesis a total of 33 male c.c. skiers competing in sprint and distance
races at a national or international level volunteered to participate (some were
involved in more than one study) and their characteristics are documented in Table
1. Study I included four members of the Swedish National Team, Studies II and III
included elite Norwegian c.c. skiers and Studies IV and V included well-trained
Swedish skiers. All studies were conducted in accordance with the Declaration of
Helsinki and were pre-approved by the Regional Ethical Review Board of Umeå
University, Umeå, Sweden.
Table 1. Characteristics of the male participants included in Studies I-V, mean ± SD.
N Age (yr) Body mass (kg) Body height (m) V̇O2max* (mL/kg/min)
Study I 9 25.9 ± 3.5 74.5 ± 6.2 1.81 ± 0.05 73.4 ± 5.8
Study II 11 23.5 ± 4.8 77.4 ± 6.9 1.81 ± 0.06 72.1 ± 4.6
Study III 11 23.2 ± 4.4 78.2 ± 7.5 1.82 ± 0.05 73.5 ± 5.2
Study IV 11 24.3 ± 3.6 78.7 ± 5.9 1.82 ± 0.05 64.9 ± 4.0
Study V 10 24.6 ± 3.5 80.1 ± 5.8 1.83 ± 0.05 64.9 ± 6.3
* determined with diagonal stride roller skiing on a treadmill
3.2. STUDY OVERVIEW
3.2.1. In the field
Study I involved two days of testing with a V̇O2max test and three performance tests
on snow, including maximal speed tests over 20 m in G3 and DP, respectively,
followed by a 1,425-m skating STT. A d-GNSS that was synchronised with video
recordings was used to evaluate skiing velocity and gear selection.
Study II involved biomechanical measurements during c.c. skiing on snow using DS
on a 50-m uphill slope (7.5°), with data analysed from the final 20 m. Each skier
performed the test at maximal (100%), high (80% of maximal) and moderate (65% of
maximal) velocities.
Study III involved skiing up a slope on snow, employing DS for 40 m at an incline of
~ 7.5° followed by 10 m of skiing with HB at an incline of ~ 15°. The skiing over the
last 8 m of this slope was analysed. All skiers performed three separate trials at
similar relative intensities as those used in Study II. Kinematics and kinetics of uphill
c.c. skiing at the three different relative velocities were analysed through

18
measurements of pole and plantar forces that were time synchronised with video
recordings (Studies II and III).
3.2.2. In the laboratory
Studies IV and V included a series of laboratory tests where skiers were tested on a
treadmill, employing roller skiing during five separate test days over three weeks.
The first four test days served as pre-tests for the main sprint performance test,
which involved four self-paced 1,300-m STTs using the DP and DS sub-techniques
on a simulated course consisting of 70% flat (1°) and 30% uphill (7°) terrain.
Treadmill velocity and V̇O2 were measured during the STTs. Pre-tests were used to
assess the technique-specific V̇O2max, GE and Vmax, as well as to familiarise the skiers
with the course. In addition, the effects of velocity and incline on GE in the two
different sub-techniques were assessed for the purpose of the anaerobic energy
calculations in the STT. The aerobic and anaerobic energy contributions and
determinants of performance were evaluated (Study IV), together with the metabolic
responses in relation to pacing strategies and performance (Study V).
3.3. EQUIPMENT
3.3.1. In the field
Ski track and skiing equipment. In Study I a simulated sprint c.c. skiing competition
using the skating technique was performed on snow for two laps on an undulating
712.5-m course consisting of approximately equal amounts of flat, uphill and
downhill terrain. The maximal height difference between the lowest and highest
points was 17 m with a total climb of 26 m per lap. On the basis of terrain properties,
each lap was divided into 10 different sections (S1-S10) marked with reference poles.
In Studies I-III skiers used their own racing poles and skis with standardised and
appropriate glide and grip wax applied by a professional ski technician. All testing
was performed on single days under stable weather conditions and tracks were
machine-groomed on the evenings prior to testing.
Time measurements. In Study I a d-GNSS was used to analyse skiing velocity and
position on the course. The d-GNSS system was time synchronised with continuous
video recording (Panasonic NV-GS 280, Osaka, Japan) from a snow-mobile. The d-

19
GNSS system (Leica Geosystems AG, Heerbrugg, Switzerland) uses signals from
both the United States and Russian global navigation systems (GPS and GLONASS)
with a high measurement accuracy (Takac et al., 2005). The skiers wore the rover of
the d-GNSS system in a specially-designed small backpack (total weight ~ 1.64 kg).
In Studies II and III two pairs of photocells (IVAR, LL Sport, Mora, Sweden) provided
section times and average velocities. In addition, the trials were filmed continuously
using a panning camera (Panasonic NV-GS 280, Osaka, Japan). In Study III two
cameras (Sony Handycam HDR-HC1E PAL, Tokyo, Japan) were fixed
perpendicularly to one another to allow a three-dimensional video reconstruction.
Kinematics and kinetics. In Studies II and III kinematic values were obtained from
the pole and plantar force measurements providing cycle times and phase durations
for the poling, gliding and kick phases (for further details, see section 3.5). In
addition, pole angles and the angles between body segments were analysed in Study
III by a three dimensional video reconstruction (SIMI Reality Motion System GmbH,
Unterschleissheim, Germany).
In Studies II and III, custom-designed poles with a strain-gauge load cell (Hottinger
Baldwin Messtechnik GmbH, Darmstadt, Germany) mounted directly below the
grip monitored ground reaction forces at a rate of 1500 Hz. The plantar pressure of
each leg was recorded at 100 Hz using the Pedar Mobile System (Novel GmbH,
Munich, Germany) and then converted to plantar force in the normal direction to
the surface of the insole by multiplying pressure by area. In the current thesis plantar
force is referred to as leg force. The area of the foot was divided into forefoot and
rear-foot halves and inside- and outside-foot areas. The pole and plantar measuring
systems were validated according to Holmberg et al. (2005). Plantar insoles were
calibrated using a Pedar device with homogenous air pressure using a computer-
aided procedure. The kinetic and kinematic parameters were analysed during the
same skiing cycles. All data were processed using the IKE-Master Software (IKE-
Software Solutions, Salzburg, Austria) and Office Excel 2007 (Microsoft Corporation,
Redmond, WA, USA).
3.3.2. In the laboratory
Treadmill and skiing equipment. All of the laboratory tests in Studies I and III-V were
performed on a motor-driven treadmill designed specifically for roller skiing

20
(Rodby Innovation AB, Vänge, Sweden). Pro-Ski C2 roller-skis (Sterners, Dala-Järna,
Sweden) equipped with either NNN (Rottefella, Klockarstua, Norway) or SNS
(Salomon, Annecy, France) binding systems were used. The rolling resistance for the
two sets of roller skis was similar and determined as described previously by
Ainegren et al. (2008). Before testing, the roller skis were pre-warmed for at least 60
min in a heating box to avoid subsequent changes in resistance of the wheels and
bearings due to a warm-up effect. The skiers used their own poles (equipped with
special carbide tips) during all the roller-skiing tests. In Studies IV and V, self-pacing
was possible with lasers that automatically increased (0.68 km/h/s) or decreased
(0.40 km/h/s) the velocity when the athlete moved to the front or rear of the treadmill
belt, respectively, maintaining a constant velocity otherwise.
Physiological measurements. In Studies I and III-V, all respiratory variables were
measured using an AMIS 2001 model C (Innovision A/S, Odense, Denmark)
ergospirometry system, which was calibrated before each test according to the
specifications of the manufacturer. Ambient conditions were monitored with an
external apparatus (Vaisala PTU 200, Vaisala Oy, Helsinki, Finland). Fingertip blood
samples (20 µl) were used for the determination of blood lactate concentration using
a Biosen 5140 analyser (EKF diagnostic GmbH, Magdeburg, Germany). Heart rate
was measured with heart-rate monitors (model S610 or S810, Polar Electro Oy,
Kempele, Finland).
3.4. MEASUREMENTS AND PROTOCOLS
3.4.1. In the field
Study I involved three different tests: 1) a maximal velocity test using the skating G3
sub-technique (G3-Vmax) on flat terrain, where the skier was instructed to accelerate
over a 100-m section and to reach maximal velocity when entering the 20-m
measurement zone; 2) a 20-m acceleration test with a standing start on flat terrain
with the DP sub-technique (DP-Vpeak), with the skier being instructed to accelerate
maximally over this section; and 3) a single STT employing the skating style. The d-
GNSS equipment provided maximal, peak and average velocities during all testing.
Both the G3-Vmax and DP-Vpeak tests were carried out twice, each separated by four
minutes of light activity. During the STT, heart rate was monitored continuously and
blood lactate concentration was determined 1, 3 and 5 min after the finish.

21
In Studies II and III the skier performed skiing over a short (50-m) uphill slope at
three relative velocities (65%, 80% and 100% of maximal) using either DS or DS
together with HB. Trials were repeated if the skier deviated extensively from the
predetermined velocity (by 10% for DS and 5% for HB). The relative velocities were
similar to those normally used in distance races (65-80% of maximal) or sprint races
(80-100% of maximal). Prior to testing, each skier performed a 15-min warm-up at
60-75% of maximal heart rate and each trial was separated by 6 min of light active
recovery (~ 50% of maximal heart rate).
3.4.2. In the laboratory
In Studies I-III, V̇O2max during DS roller skiing was determined at a fixed velocity of
11 km/h and an initial treadmill incline of 4°, which was raised by 1°/min. In Studies
IV and V the tests of V̇O2max with DP or DS started at velocities of 21 or 9 km/h and at
fixed inclines of 1° or 7°, respectively, with subsequent increases of 1 km/h every 60
s with DP or 0.5 km/h every 45 s for DS until exhaustion. The average of the three
highest consecutive 10-s V̇O2 values was defined as V̇O2max (Studies I-V).
In Studies IV and V, five different tests were performed on separate days, with the
first four serving as pre-tests for the final STT performance test. Submaximal V̇O2
and V̇O2max in DP and DS were determined. All of the DP and DS roller-skiing tests
were performed on fixed gradients of 1° and 7°, respectively. Gas exchange (i.e., V̇O2
and V̇CO2) was analysed during the last minute of each submaximal stage. For DP, a
5-min warm-up at 17 km/h was followed by the submaximal test that began at 19
km/h, with an increase by 1 km/h every 4-min up to a velocity of 22 km/h and
thereafter by 0.5 km/h every 4 min until the highest steady-state velocity or highest
pre-programmed skiing velocity of 26.5 km/h was reached. For DS, submaximal V̇O2
was determined during five continuous 4-min workloads, or up to a respiratory
exchange ratio (RER) ≤ 1.00 (McArdle et al., 2010). Following a 5-min warm-up at 7.0
km/h, the test started at 7.5 km/h, with subsequent workload increases of 0.5 km/h.
The submaximal tests were used to determine the relationship, based on the seven
last stages in DP and five stages in DS, between velocity and GE for assessing
anaerobic energy production during the STT performance tests on test day 5 (for
further details see section 3.5).
To evaluate the impact of incline on GE and energetic cost, submaximal V̇O2 was
measured during DP or DS skiing for an initial 10-min workload at 16.0 or 9.5 km/h

22
and 1.4° or 3.5°, respectively, with subsequent increases by 0.4° or 0.7° every 5 min.
This test was continued for six workloads or up to the highest steady-state intensity
with a RER ≤ 1.00. The relationships between gradient, GE and energetic cost were
assessed by regression and utilised for calculations concerning the technique
transitions, when the gradient was changing, during the STT performance test.
Tests of Vmax were performed using DP (1°) and DS (7°). After a self-paced warm-up
(~ 18 min) followed by a 2-min passive recovery, the test with DP or DS began with
20 s at 22.5 km/h or 14 s at 12.0 km/h, with subsequent increases of 1.5 km/h every
10 s or 1.0 km/h every 7 s, respectively, until exhaustion. Following this testing, each
participant became familiarised with the STT test, by performing two maximal 1,300-
m STTs (as described below), using the same warm-up and cool-down procedures
as on test day 5. The order of sub-technique was randomised and similar during all
the four pre-tests.
The four STT performance tests were completed over a simulated 1,300-m sprint
course (Fig. 5) that consisted of five different sections (S1–S5) involving the DP and
DS sub-techniques intermittently, thereby requiring four transitions (T1-T4) and a
start-up phase (S). The skiers were only allowed to use the DP and DS sub-
techniques, i.e., DPkick was not allowed to use during the transitions. The participants
were instructed to use DP on S1, S3 and S5 and DS on S2 and S4. Before the first STT,
a 15-20-min warm-up over 3900 m (three times the course) was conducted at a self-
selected velocity, with the warm-ups prior to the subsequent next three STTs
consisting of one self-paced STT “lap” (1,300 m). The total time for cool-down (one
self-paced “lap”), passive recovery and warm-up between trials was 45 min. Each
participant could follow his velocity and position on the course on a large computer
screen in front of the treadmill. V̇O2 was measured continuously during the STT and
the time elapsed and distance travelled was recorded by a computer at 2.5 Hz.

23
Figure 5. The sprint time trial (STT) course profile. The vertical lines indicate the start-up of the treadmill
(s) and the four transitions (T1-T4) between the three sections (S1, S3 and S5, 1° incline) of double poling
(DP) and the two sections (S2 and S4, 7° incline) of diagonal stride (DS).
3.5. CALCULATIONS (FOR DETAILS, SEE STUDIES II-V)
In Studies II and III absolute cycle time (CT), poling/leg thrust, gliding (only during
DS in Study II) and recovery times, cycle rate (the reciprocal of CT) and cycle length
(the product of CT and skiing velocity) were determined. Relative time phases (% of
CT) for poling, arm swing, gliding (only during DS), pre-loading (only during DS in
Study II), kick and leg swing were calculated by dividing the durations for the
separate phases by the CT (see Fig. 6). The average right and left pole and leg forces
for each subject over five cycles (in Study II) or four cycles (in Study III) of skiing
were combined. Pole and leg force impulses during one cycle were obtained from
the total values of the right and left pole and leg thrust, respectively. The absolute
peak force and time to peak force were determined on the basis of the pole and leg
kinetics, respectively, and relative peak force (% of BW) was calculated by dividing
the absolute force by the skier’s body weight. The relative times to peak pole and leg
forces were calculated by dividing the time to attain the maximal value by the total
poling or leg thrust time, respectively. The rate of force development was obtained
by dividing the peak force by the time required to achieve this peak.

24
Figure 6. Sequence of actions (#1–7) and time course of pole and leg force characteristics associated with
the diagonal stride skiing sub-technique over one cycle. a = unloading phase (leg force minima); b = peak
pole force; c = peak leg force; PLP, pre-loading phase; KP, kick phase. Data are presented for one subject
skiing at high velocity and are mean values of five successive time normalised cycles.
In Study III propulsive forces provided by the poles and leg thrust were estimated.
The force impulse over a single cycle was time normalised by dividing the force
impulses for poling (IPF) and leg thrust (ILF) for the two sides of the body by CT to
obtain the average cycle pole force (ACPF) and average cycle leg force (ACLF)
generated over one second. Then, the average cycle total force generated by pole and
leg thrusts could be calculated as the sum of ACPF and ACLF. For estimation of the
propulsive force provided by the poles (ACPFP; eq. 1), the average sagittal and
lateral angles between the poles at the time of plant and pole off were employed as
follows:
𝐴𝐶𝑃𝐹𝑃[𝑁] = (𝑐𝑜𝑠(𝛼) × 𝐴𝐶𝑃𝐹) × 𝑠𝑖𝑛(𝛽) (1)
where α is the average lateral pole inclination and β the average sagittal pole
inclination during the poling phase (Fig. 7A). These angles are not constant and the
instantaneous angle and force should actually be considered and is hence a
limitation of the current procedure.
The propulsive force of the leg thrust could not be evaluated in a similar manner,
since the Pedar system does not provide information concerning force direction.
However, when a skier moves at a constant velocity, this propulsive force is equal
in size, but opposite in direction to the gravitational force component along the

25
slope. Therefore, to obtain an average cycle propulsive leg force (ACLFP; eq. 2), the
following equation was applied:
𝐴𝐶𝐿𝐹𝑃[𝑁] = (𝑚 × 𝑔 × 𝑠𝑖𝑛(𝛾)) − 𝐴𝐶𝑃𝐹𝑃 (2)
where m × g × sin(γ) is the gravitational force component along the slope, with m
representing the mass of the skier’s body, g gravitational acceleration and γ the
incline. This formula does not take into account the force exerted against ground
friction and air drag, which, in studies on similar types of locomotion such as
running and walking on steep uphill terrain, are also routinely excluded from
calculations (Minetti et al., 2002).
In Study III the average of the angles of the right and left poles at the start (defined
as the first frame of pole-ground contact) and end (the last frame of pole-ground
contact) of the poling phase during each cycle was calculated. The sagittal and lateral
pole angles were defined as illustrated in Figure 7A and lateral angulation of the skis
as the average angle between the left and right skis during their contact with the
ground. The angles between body segments were calculated at the start and end of
the right ski being in contact with the ground (see Fig. 7B). Inclination of the whole
body, upper body, thigh and shank in the sagittal plane with respect to the ground
was determined as were the angles of the hip and knee in the sagittal plane.
Figure 7. (A) Illustration of the sagittal (β) and lateral (α) pole angles. The y-coordinate is in the skiing
direction, the x-coordinate is in the lateral plane which is perpendicular to the skiing direction and the z-
coordinate is perpendicular to the slope; (B) Body segment and joint angles.
In Studies IV and V the power output (PO) during skiing was calculated as the sum
of the power exerted to elevate the total mass against gravity and to overcome rolling
resistance

26
𝑃𝑂 [𝑊] = 𝑚𝑡𝑜𝑡 × 𝑔 × 𝑠𝑖𝑛(𝛾) × 𝑣 + µ𝑅 × 𝑚𝑡𝑜𝑡 × 𝑔 × 𝑐𝑜𝑠(𝛾) × 𝑣. (3)
Where mtot is the skier’s body mass together with equipment mass, g is gravitational
accelerations, v is the treadmill velocity [m/s], µR is the rolling resistance coefficient
and γ is the treadmill incline. The aerobic metabolic rate was determined from V̇O2
[L/min] and V̇CO2 and gross energy expenditure using RER values ≤ 1.00 (McArdle
et al., 2010). Gross efficiency was calculated as PO divided by aerobic metabolic rate
(J/s) and energetic cost (J/kg/m) as aerobic metabolic rate (J/s) divided by mtot (kg)
and velocity (m/s).
The calculations used to estimate the anaerobic energy supply in Studies IV and V
were based on the submaximal relationships for skiing velocity and incline versus
GE. These relationships were assessed with linear or exponential regression as based
on the highest r2 value and used to estimate the GE in the respective sub-techniques
(DP and DS) during the supramaximal STT. The relationship between GE and
velocity (v) or incline (i) in DP and DS was defined as either independent if r2 < 0.5
and dependent if r2 ≥ 0.5. If velocity dependency was observed, the equation of the
linear regression was used for prediction as
𝐺𝐸𝑣 = 𝐺𝐸(𝑣). (4)
If GE was shown to be independent of velocity, the average GE during the
submaximal tests was applied. When incline dependency was observed the equation
of the regression was used for prediction as
𝐺𝐸𝑖 = 𝐺𝐸(𝑖). (5)
The values obtained from eq. 5 were then divided by the GEi at the fixed sectional
inclines of 1° and 7°, respectively, resulting in the following ratio
𝐺𝐸𝑖 (𝑟𝑎𝑡𝑖𝑜) = 𝐺𝐸𝑖 ÷ 𝐺𝐸𝑖 (1° 𝑜𝑟 7°). (6)
If GE was shown to be independent of incline, the GEi (ratio) was set to 1 (i.e., no effect
of incline on GE).
By combining eq. 4 and 6, a velocity and incline-dependent GE relationship (GEvi)
could be expressed as
𝐺𝐸𝑣𝑖 = 𝐺𝐸𝑣 × 𝐺𝐸𝑖 (𝑟𝑎𝑡𝑖𝑜). (7)
The total metabolic rate (MR) during the STT was calculated as
𝑀𝑅 [𝑊] = 𝑃𝑂 ÷ 𝐺𝐸𝑣𝑖 (8)

27
where PO is the STT power output (eq. 3), GEvi is the supramaximal GE (eq. 7). The
total MR was converted to a VO2 requirement and the accumulated O2 deficit was
calculated as the difference between the VO2 requirement and VO2 uptake.
The Vmax during the incremental tests (Studies IV and V) was linearized by using a
similar equation to that introduced by Kruipers et al. (1985).
𝑉𝑚𝑎𝑥 [𝑚/𝑠] = 𝑉𝑓 + (𝑡 ÷ 𝑇 × 𝑉𝑑) (9)
where Vf is the velocity [m/s] of the last workload completed, t is the duration [s] of
the last workload, T is the standard duration [s] of the workload and Vd is the
difference in velocity [m/s] between the last two workloads.
3.6. STATISTICS
In all studies, all data were checked for normality and presented as mean and
standard deviation (± SD) with some variables presented as median and/or range.
The coefficient of variation (100 × SD / mean) was used as a measure of relative
variability in Studies I, IV and V. Mean values were compared with a paired sample
t-test (Studies I, IV), independent sample t-test (Study IV), one-way ANOVA (Study
I), one-way repeated measures ANOVA (Studies II-V) and two-way ANOVA (Studies
IV and V). Relationships between variables were assessed with the Pearson’s
correlation analysis (Studies I, IV and V) and linear or exponential regressions
(Studies IV and V). A block-wise multiple regression was used to determine the
explained variance in performance for the selected independent variables (Studies IV
and V). When data deviated from a normal distribution the following non-
parametric alternatives were used: Wilcoxon signed-rank test (Study I), Mann-
Whitney U test (Study II) and Spearman’s rho rank correlation (Study I). In all
studies, the level of statistical significance was set at α ≤ 0.05. Statistical tests were
processed using Office Excel 2006, 2007 or 2010 versions (Microsoft Corporation,
Redmond, WA, USA) and SPSS 17.0 (SPSS Inc., Chicago, IL, USA) or SPSS 21 (IBM
Corp., Armonk, NY, USA). The statistical methods are described further in detail in
the separate articles.

28

29
4. RESULTS
4.1. STUDY I
Nine male elite c.c. skiers performed a Vmax test using G3 (G3-Vmax) and a maximal
acceleration test in DP (DP-Vpeak), followed by a skating STT (sub-techniques are
illustrated in Fig. 8).
Figure 8. Schematisation of the different skating sub-techniques (gears [G2-7]) used in c.c. skiing. G2, G3,
and G4 is sometimes termed V1, V2, and V2-alternate, respectively.
The maximal velocities reached in the DP-Vpeak (20 m) and G3-Vmax (120 m) tests were
7.87 ± 0.36 m/s (28.3 ± 1.3 km/h) and 10.21 ± 0.41 m/s (36.8 ± 1.5 km/h), respectively.
The time to complete the STT was 207.4 ± 7.4 s, with an average velocity of 6.9 ± 0.3
m/s (24.8 ± 1.1 km/h). The velocity profile over the STT course is shown in Figure 9.
Figure 9. The 1,425-m sprint time trial course profile (grey area under the curve), skiing velocity (solid
line; mean ± SD), and coefficient of variation (CV) (dashed upper line) plotted against racing distance (m)
for both laps. The vertical lines represent all the sections (S1-10) of one lap.

30
The STT encompassed a large velocity range (2.9-12.8 m/s [10.4-46.1 km/h]) with the
highest inter-individual variation (i.e., CV) observed for the uphill skiing velocity.
The average velocity for G3 skiing during the final stretch (20 m) before the finish
line corresponded to ~ 80% of G3-Vmax. The average velocities for the three different
categories of terrain (i.e., uphill, downhill and flat) are shown in Figure 10A. During
the STT, 29.1 ± 4.0 gear transitions were performed and higher gears were used at
higher velocities (Fig. 10B).
Figure 10. (A) Mean skiing velocities for different categories of terrain (uphill, downhill and flat): during
the total race, 1st and 2nd laps; (B) Mean skiing velocities for the skating sub-techniques (G2-7). The
different letters indicate significant differences between terrain (Fig. A [a-c]) and gears (Fig. B [a-f]), and
* indicates a significant difference between laps, P < 0.05. Values expressed as mean ± SD.
The first lap of the STT was 2.9% faster than the second lap (102.1 ± 3.7 versus 105.2
± 4.4 s; P < 0.05). The average velocities over the second lap were 12.9% and 5.3%
slower for the uphill and downhill sections, respectively, whereas the skiers were
7.6% faster over the flat sections (Fig. 10A). The distribution of the main skating
gears, G2-4, were on average 31%, 63% and 6%, respectively. The slower uphill
velocities over the second lap were associated with a shift in gear choice towards
less use of G3 (- 6.8%) and larger use of G2 (+ 5.9%) (P < 0.05).
The STT performance time was highly correlated to uphill time (r = 0.92, P < 0.05).
The reduction in uphill velocity on the second lap was negatively correlated with
the pre-determined V̇O2max (r = - 0.78, P < 0.05). There was a negative correlation
between STT performance time and DP-Vpeak, as well as for the total time spent on
the uphill sections (r = -0.71 and r = -0.73, both P < 0.05). The time used on the steepest
uphill section (S2) during both laps was negatively correlated with DP-Vpeak (first
and second laps: r = - 0.79, and r = - 0.84, both P < 0.05), and DP-Vpeak correlated

31
positively with the skiers’ percentage of racing time using G3 and negatively with
the skiers’ time using G2 (r = 0.71 and r = -0.83, respectively, both P < 0.05).
4.2. STUDY II
This study examined cycle and force characteristics in eleven elite male c.c. skiers
using the DS sub-technique while skiing uphill (7.5°) on snow at moderate, high and
maximal velocities.
Absolute cycle, poling, arm swing, gliding, kick, and leg swing times decreased
significantly with an elevated velocity (Table 2). The relative phases remained
constant from moderate to high velocity, whereas the relative glide, the relative kick
and leg swing times were prolonged from high to maximal velocity (Table 2). The
cycle rate and cycle length increased from moderate to high velocity, while cycle rate
increased and cycle length decreased at maximal velocity (Fig. 11A).
Table 2. Cycle and force characteristics of diagonal skiing at moderate, high and maximal velocity.
Velocity
Moderate High Maximal
Velocity (km/h) 12.6 ± 1.1 16.2 ± 1.4 20.2 ± 2.2
Cycle time (s) 1.15 ± 0.07bc 1.01 ± 0.10ac 0.69 ± 0.09ab
Poling time (s) 0.45 ± 0.07bc 0.38 ± 0.04ac 0.27 ± 0.03ab
AST (s) 0.70 ± 0.04bc 0.63 ± 0.09ac 0.41 ± 0.07ab
Gliding time (s) 0.42 ± 0.05bc 0.36 ± 0.08ac 0.19 ± 0.07ab
PLT (s) 0.07 ± 0.01 0.06 ± 0.01 0.05 ± 0.01
Kick time (s) 0.19 ± 0.03bc 0.16 ± 0.02ac 0.14 ± 0.02ab
LST (s) 0.47 ± 0.06bc 0.43 ± 0.06ac 0.32 ± 0.05ab
PTrel (%) 39 ± 4 38 ± 4 40 ± 3
ASTrel (%) 61 ± 4 62 ± 4 60 ± 3
GTrel (%) 36 ± 3c 36 ± 5c 27 ± 8ab
PLTrel (%) 6 ± 1 6 ± 1 7 ± 1
KTrel (%) 17 ± 2c 16 ± 2c 20 ± 2ab
LSTrel (%) 41 ± 5c 43 ± 5c 46 ± 7ab
PPF (N) 100 ± 24bc 118 ± 36ac 197 ± 44ab
PLF (N) 1531 ± 217 1538 ± 184 1448 ± 187
RFDpole (kN/s) 1.0 ± 0.9bc 1.6 ± 1.5ac 5.8 ± 1.5ab
RFDleg (kN/s) 10.1 ± 2.4bc 12.6 ± 2.3ac 13.9 ± 2.4ab
IPF (Ns) 22 ± 4c 22 ± 5c 18 ± 2ab
ILF (Ns) 235 ± 39c 215 ± 27c 174 ± 21ab
Values presented as mean ± SD (n = 11). AST, arm swing time; PLT, pre-loading time; LST, leg swing time;
PTrel, relative poling time; ASTrel, relative arm swing time; GTrel, relative glide time; PLTrel, relative pre-
loading time; KTrel, relative kick time; LSTrel, relative leg swing time. PPF, peak pole force; PLF, peak leg
force; RFDpole, rate of force development for poling; RFDleg, rate of force development for the leg during
the ski-loading phase; IPF, impulse of pole force; ILF, impulse of leg force. The letters indicate statistically
significant differences from moderate (a), high (b) or maximal (c) velocity (P < 0.05).

32
The relative pole forces increased considerably from moderate to maximal velocity
(13% to 26% of BW), while the time to peak pole force decreased by 79% (Fig. 11B).
The relative leg force was unchanged across velocities (~ 190% of BW), while time to
peak leg force decreased by 26% from moderate to maximal velocity (Fig. 11C).
During gliding, most of the force was distributed on the inside rear-foot, with a
distinct shift of loading to the inside forefoot during the kick (Fig. 11D).
Figure 11. (A) Cycle rate (CR) and cycle length (CL); (B) relative peak pole force (PPFrel) and time to peak
pole force (TPPF); (C) Relative peak leg force (PLFrel) and time to peak leg force (TPLF), at three different
diagonal skiing velocities (mean ± SD [n = 11]); (D) Force distribution on inside rear-foot (IRF), outside
rear-foot (ORF), inside forefoot (IFF) and outside forefoot (OFF), for one participant skiing at high
velocity; PLP, pre-loading phase; KP, kick phase. The letters indicate statistically significant differences
from moderate (a), high (b) or maximal (c) velocity (P < 0.05).
At maximal velocity, sprint-specialised skiers were 14% faster than distance-
specialised skiers (22.4 vs. 19.7 km/h), attributed to a higher cycle rate (1.64 vs. 1.34
Hz), a shorter poling time (0.26 vs. 0.30 s), glide time (0.17 vs. 0.24 s), and kick time
(0.13 vs 0.15 s) (all P < 0.05). The sprint-specialised skiers developed a higher peak
leg force (195 vs. 176 % of BW), and a higher rate of leg force development (14.1 vs.
11.9 kN/s) than the distance skiers (both P < 0.05).

33
4.3. STUDY III
Eleven elite male c.c. skiers performed HB skiing on a steep uphill (15°) at maximal
(13.7 ± 1.4 km/h), high (10.8 ± 1.4 km/h) and moderate (8.6 ± 1.4 km/h) velocities. A
schematic illustration of the HB sub-technique performed at high velocity, with the
corresponding kinetic and kinematic characteristics of a representative individual
skier, is presented in Figure 12.
Figure 12. Kinetic and kinematic characteristics of an individual skier during one cycle of the herringbone
sub-technique performed at high velocity. The numbers (1-5) on all graphs represent the different phases
of the cycle (side view [A] and back view [B]); (C) Time course of the pole and leg thrust forces; (D)
Relative distribution of the force (as % of the total force) between the inside forefoot (IFF), outside forefoot
(OFF), inside rearfoot (IRF) and outside rearfoot (ORF); (E) Lateral and sagittal pole angles; (F) Upper and
total body angles (see Fig. 7A for definition of angles).
The cycle rate increased with velocity, being 1.20 ± 0.08, 1.31 ± 0.08, and 1.60 ± 0.14
Hz at the moderate, high, and maximal velocities, respectively, whereas the cycle
length increased from moderate up to high velocity (2.04 ± 0.23 to 2.31 ± 0.23 m),
with no further change up to maximal velocity (2.34 ± 0.22 m). The absolute poling

34
and leg thrust times gradually decreased with higher velocity, while relative poling
and leg thrust times were independent of velocity (Fig. 13A-B).
Figure 13. (A) Absolute and relative poling times (PT and PTrel); (B) Absolute and relative leg thrust times
(LTT and LTTrel); (C) Relative peak pole force (PPFrel) and time to peak pole force (TPPF); (D) Relative
peak leg force (PLFrel) and time to peak leg force (TPLF) for herringbone skiing at three different velocities.
The values presented are means ± SD (n = 11). The letters indicate significant differences in comparison to
moderate (a), high (b) or maximal (c) velocity (P < 0.05).
Force characteristics across the three different velocities of HB skiing are
documented in Table 3. The relative peak pole force increased 74% from moderate
to maximal velocity, while the time to peak pole force declined by 75% (Fig. 13C).
The relative peak leg force was increased by 7% from moderate to high velocity, with
no further change from high to maximal velocity. The time required to attain peak
leg force was 24% lower at maximal than at moderate velocity (Fig. 13D).
As documented in Table 3, the higher peak force and the shorter time required to
attain this force resulted in an almost 4-fold increase in the rate of force development
by the poles from moderate to maximal velocity, with only a 38% increase for the leg
thrust. The pole and leg force impulses remained relatively constant across velocities
upon increasing from moderate to high velocity and then fell at maximal velocity.

35
The leg force impulse was mainly (66%) distributed on the inside forefoot at all three
velocities. The average pole and leg forces per movement cycle were independent of
velocity. The average relative propulsive pole and leg forces per cycle were ~ 71%
and 20%, respectively, at all velocities. Of the total propulsion, pole and leg forces
contributed with ~ 23% and 77%, respectively.
Table 3. Force characteristics associated with skiing with the herringbone sub-technique at three different
velocities.
Velocity
Moderate High Maximal
PPF (N) 112 ± 24bc 143 ± 32ac 194 ± 43ab
PLF (N) 1530 ± 240b 1640 ± 216a 1610 ± 234
RFDpole (kN/s) 2.28 ± 1.29bc 4.03 ± 1.74ac 8.74 ± 2.81ab
RFDleg (kN/s) 8.45 ± 2.09bc 10.10 ± 2.46ac 11.70 ± 2.25ab
IPF (Ns) 52 ± 5c 49 ± 7c 42 ± 7ab
ILF (Ns) 653 ± 133c 617 ± 103 505 ± 102a
ACPF (N) 62 ± 7 64 ± 9 67 ± 13
ACLF (N) 774 ± 153 808 ± 133 807 ± 149
ACPFP (N) 44 ± 5 45 ± 6 47 ± 8
ACLFP (N) 160 ± 23 155 ± 17 153 ± 17
ACPFP_rel (%) 71 ± 1 71 ± 2 70 ± 3
ACLFP_rel (%) 21 ± 4 19 ± 3 19 ± 3
FIP_ratio (%) 29 ± 5 30 ± 4 31 ± 6
Values presented as mean ± SD (n = 11). PPF (N), peak pole force; PLF (N), peak leg force; TPPFrel (%),
relative time required to attain peak pole force; TPLFrel (%), relative time required to attain peak leg force;
RFDpole (N⋅s-1), rate of development of pole force; RFDleg (N⋅s-1), rate of development of leg force; IPF (Ns),
Impulse of the pole force; ILF (Ns), impulse of the leg force; ACPF (N), average pole force per cycle; ACLF
(N), average leg force per cycle; ACPFP (N), average propulsive pole force per cycle; ACLFP (N), average
propulsive leg force per cycle; ACPFP_rel (%), average relative propulsive pole force per cycle; ACLFP_rel
(%), average relative propulsive leg force per cycle; FIP_ratio (%), ratio of the propulsive pole to leg force
impulse. The letters indicate significant differences in comparison to moderate (a), high (b) and maximal
(c) velocities (P < 0.05).
4.4. STUDY IV
Eleven male c.c. skiers were tested on a treadmill in the laboratory for determination
of GE, V̇O2max, and Vmax. The main performance test involved four self-paced STTs
over a 1,300-m simulated sprint course on the treadmill including three flat (1°) DP
sections interspersed with two uphill (7°) DS sections (see Fig. 15A for details).
The relationships between skiing velocity and GE in DP and DS are shown in Figure
14. Although no significant influence of velocity on GE was observed (Fig. 14A), five
skiers demonstrated a linearly decreasing GE against velocity (Skier A in Figure 14B
was one of those). The relationship between GE and incline exhibited a slightly

36
inverted u-shape for DP, but was linearly increasing in the case of DS (Fig. 14C).
When expressed as an energetic cost plotted against incline at the same velocities as
in Figure 14C, a cross-over in energetic cost for DP and DS was observed at 3.3° (Fig.
14D). The Vmax in DP and DS were 32.8 ± 1.8 and 18.4 ± 1.1 km/h, respectively.
Figure 14. (A) Gross efficiency for submaximal double poling (DP) and diagonal stride (DS) at fixed
inclines of 1° (DP) and 7° (DS), plotted against skiing velocity; (B) Two individual relationships between
gross efficiency and DP velocity; (C) Gross efficiency for submaximal DP and DS treadmill roller skiing
at fixed velocities of 16.0 and 9.5 km/h, respectively, plotted against incline; and (D) Energetic cost plotted
against incline at the same velocities as in (C), including upward and downward trend lines. The values
are presented as mean ± SD (Fig. A, C-D). The letters indicate statistically significant differences between
the six stages of skiing with DP (a-f) and DS (g-l).
The skiers completed the STT in 232 ± 10 s (distributed as 55 ± 3% DP and 45 ± 3%
DS) with an average velocity of 20.2 ± 1.1 km/h, power output of 324 ± 26 W, and
metabolic rate of 1.87 ± 0.18 kW. The aerobic and anaerobic energy contributions
were 82 ± 5% and 18 ± 5%, respectively, with an accumulated O2 deficit of 45 ± 13
mL/kg. The peak V̇O2 of 5.20 ± 0.48 L/min did not differ significantly from the highest
V̇O2max value of 5.14 ± 0.48 L/min attained with DP or DS skiing during the pre-tests.
The blood lactate concentrations 1-min before and immediately after the STT were
3.6 ± 1.0 and 12.8 ± 1.9 mmol/L, respectively.

37
The physiological and biomechanical parameters observed for each of the five
different sections are documented in Figure 15 and Table 4. The highest variations
in skiing velocity (as reflected in the coefficient of variation [CV]) were observed in
connection with the start of the two uphill sections involving DS (S2 and S4) (Fig.
15A). An increased O2 deficit was detected in S1, S2 and S4 combined with a slightly
reduced O2 deficit in S3 and S5 (Fig. 15B-D). The mean metabolic rate for all three
DP sections was 23% lower than for the two DS sections (1.7 ± 0.3 versus 2.2 ± 0.1
kW; P < 0.05).
Figure 15. (A) Skiing velocity, coefficient of variation and vertical climb. The vertical lines represent the
three double poling (DP) course sections (S1, S3 and S5 at a 1° incline) and the two diagonal stride (DS)
sections (S2 and S4 at a 7° incline) together with the start-up (S) and the four transition phases (T1-T4);
(B) O2 demand, V̇O2 and relative work intensity (WI) in percent of V̇O2max; (C) accumulated O2 uptake
(AOU) and O2 deficit (AOD); (D) relative energy system contributions plotted against skied distance. The
values presented are an average of four sprint time trials and are presented as mean ± SD, except for
Figures B and C where only means where presented.
Block-wise multiple regression revealed that GE, V̇O2 and O2 deficit explained 53.4%,
30.1%, 15.2% of the total variance in STT performance time, respectively (all
contributions P < 0.05). None of the three pair-wise correlations between STT time
and GE, V̇O2 and O2 deficit were statistically significant. The Vmax in DP and DS were
negatively correlated to the respective DP and DS total section times (r = - 0.79 and -
0.56, both P < 0.05).

38
Table 4. Biomechanical and physiological results for the five sections (S1-5) of the 1,300-m skiing time
trials.
S1 (DP) S2 (DS) S3 (DP) S4 (DS) S5 (DP)
Velocity (km/h) 28.1 ± 1.8c,e 14.0 ± 0.7* 25.9 ± 1.1 13.3 ± 0.7 26.3 ± 1.1
Cycle rate (Hz) 1.01 ± 0.10e 0.88 ± 0.04* 0.97 ± 0.08e 0.86 ± 0.04 1.09 ± 0.10
Cycle length (m) 7.7 ± 0.8c,e 4.5 ± 0.3* 7.4 ± 0.5e 4.3 ± 0.3 6.7 ± 0.3
Power output (W) 255 ± 27c,e 445 ± 32* 236 ± 20 430 ± 31 240 ± 22
Metabolic rate (W) 1796 ± 358b,c,e 2204 ± 121c,d,e 1577 ± 247d 2131 ± 139e 1633 ± 288
GE (%) 15 ± 2 20 ± 1 15 ± 1 20 ± 1 15 ± 2
VO2req (mL/kg) 39 ± 5 60 ± 3 27 ± 3 39 ± 2 28 ± 3
VO2 (mL/kg) 13 ± 1 44 ± 3 31 ± 1 33 ± 2 31 ± 2
AOD (mL/kg) 26 ± 5 16 ± 3 -3 ± 3 7 ± 2 -3 ± 3
V̇O2max_FU (%) 35 ± 3 91 ± 5 102 ± 3 99 ± 4 104 ± 2
The values are presented as mean ± SD (n = 11) and are an average of four time trials. Abbreviations: DP,
double poling; DS, diagonal stride; GE, gross efficiency; VO2req, required oxygen uptake; VO2,
accumulated oxygen uptake; AOD, accumulated oxygen deficit; V̇O2max_FU, fractional utilisation of
maximal oxygen uptake. Significantly different from S1 (a), S2 (b), S3 (c), S4 (d) or S5 (e) (P < 0.05),
*significantly different from S4 (P < 0.05). No statistical comparisons were performed for all the variables
below metabolic rate.
As based on velocity and incline, the energetic cost at the four transition points (T1
and T3, DP to DS; T2 and T4, DS to DP) were similar between DP and DS at T1 and
T3 (~ 4.0 ± 1.2 J/kg/m). In contrast when changing from DS to DP at T2 and T4 the
energetic cost for DP was considerably higher than for DS (5.7 ± 1.1 versus 5.3 ± 0.7
J/kg/m and 6.1 ± 1.0 versus 5.4 ± 0.6 J/kg/m, respectively) resulting in main effects
between transitions and sub-techniques as well as an interactive effect between these
(all P < 0.05).
4.5. STUDY V
Ten well-trained male c.c. skiers performed four 1,300-m STTs on a treadmill, each
separated by 45 min of recovery (same STT course as in Study IV, see Fig. 16A).
Preliminary testing was performed similarly as in Study IV.
Performance, mechanical and physiological responses to the four STTs, together
with statistical comparisons, are presented in Table 5. The peak V̇O2 in each
respective STT was similar to the highest V̇O2max of 62.2 ± 6.0 mL/kg/min observed in
the incremental pre-tests. The velocity profiles for the two fastest and slowest STTs
in relation to the average STT velocity are presented in Figure 16B. It can be noted
that the most aggressive pacing strategy was utilised in STT1. The skiers’ work
intensities were highest on the two uphill DS sections (~ 118-128% of DS V̇O2max on
S2 and S4) and slightly below their DP V̇O2max on the final two DP sections (~ 90-100%

39
of DP V̇O2max on S3 and S5), with a decrease in O2 deficit on S3 and S5 (Fig. 16C-D).
The individually fastest and slowest STTs were completed in 225 ± 10 s and 233 ± 10
s, respectively (P < 0.05), this superior performance in the fastest STT was reflected
by a more aggressive pacing with a higher power output (~ 5%) during the first two
sections of the course (Fig. 16E).
Figure 16. (A) The sprint time trial (STT) course profile. (B) Relative velocity as a percentage of the average
velocity for all four STTs (% of STTavg) for the two fastest (STT1 and 4: 228 s) and slowest (STT2, 231s;
STT3, 230 s) STTs; (C) The metabolic rate (MR) for the respective trials and the average work intensity
(WIavg) in percent of V̇O2max for the two fastest and slowest STTs; (D) Accumulated O2 uptake (AOU) and
O2 deficit (AOD) during the four STTs; (E) Ratio between power output during the individually fastest
and slowest STTs (Pratio) and absolute power output and metabolic rate during the two respective STTs;
(F) Aerobic and anaerobic contributions to power output. The inserted square shows a magnification of
the AOU over the last 30 m. The data are presented as mean values.
The CV for individual trial-to-trial variability in STT time, V̇O2 and O2 deficit (both
expressed in mL/kg/min) were 1.3 ± 0.4%, 1.4 ± 0.9% and 11.2 ± 4.9%, respectively.
In addition, trial-to-trial variations in O2 deficit and V̇O2 explained 69% (P < 0.05) and
11% (P > 0.05), respectively, of the individual variation in STT performance.

40
Table 5. Performance during four repeated 1,300-m sprint time trials (STT1-4) and the associated
mechanical and physiological responses.
STT1 STT2 STT3 STT4
Time (s) 228 ± 9b,c 231 ± 10d 230 ± 9d 228 ± 9
Average velocity (km/h) 20.6 ± 0.8b,c 20.3 ± 0.9d 20.3 ± 0.8d 20.6 ± 0.9
Average power output (W) 326 ± 27b,c 321 ± 24d 322 ± 26d 326 ± 27
Average metabolic rate (kW) 1.89 ± 0.20b,c 1.84 ± 0.17d 1.86 ± 0.17d 1.89 ± 0.19
Accumulated VO2 (mL/kg) 197 ± 10b,c,d 203 ± 10 202 ± 11 200 ± 10
Accumulated O2 deficit (mL/kg) 49 ± 14b,c 41 ± 11d 43 ± 14d 47 ± 13
Average V̇O2 (mL/kg/min) 52 ± 3 52 ± 3 53 ± 3 53 ± 3
Average O2 deficit (mL/kg/min) 13 ± 4b,c 11 ± 3d 11 ± 4d 12 ± 4
Anaerobic energy contribution (%) 20 ± 5b,c 17 ± 4d 17 ± 4d 19 ± 5
Statistically significantly different from b = STT2, c = STT3, d = STT4 (P < 0.05). The values are presented
as mean ± SD.
As shown in Figure 17A, the skiers employed positive pacing throughout all STTs
as explained by the shorter time on the first half (H1) than the second half (H2). The
absolute energy contributions on the first and second halves of the course for each
of the four STTs are shown in Figure 17B. The average Vmax (mean of Vmax for DP and
DS) was positively correlated to the time difference between H2 and H1 (using an
average of the four STTs), i.e., the skiers with the highest Vmax employed the most
aggressive pacing strategies (r = 0.66, P < 0.05).
Figure 17. (A) Times spent on the first (1) and second (2) halves of the course for each of the four 1,300-m
sprint time trials (STTs), (B) accumulated O2 uptake (AOU) and O2 deficit (AOD) on the two course halves.
Statistically significantly different from b = STT2, c = STT3, d = STT4 (P < 0.05). #Main effect between STT1-
4. †Main effect between the first and second halves of the course. $Interactive effect. P* = P < 0.01 and P**
= P < 0.001. pη2 = partial eta effect size.
On average, the skiers covered the 740 m of DP skiing in 99 s and the 300 m of DS
skiing in 79 s corresponding to velocities of 27.0 and 13.7 km/h or 81% and 73% of
Vmax for the respective sub-techniques. The metabolic rate was, on the average, 23%

41
lower during the flat DP compared to the uphill DS skiing (1.68 versus 2.18 kW). The
ratio of the completed time using DS divided by DP in STT1-4 was on average 79 ±
4%, and was positively correlated to the skier’s total mass (r = 0.67, P < 0.05).

42

43
5. DISCUSSION
The present thesis provides methodological advances as well as physiological and
biomechanical insights into elite c.c. skiing performance. Measurements were
conducted in the field on snow (Studies I-III) and during treadmill roller skiing in the
laboratory (Studies IV and V). In Study I, a d-GNSS system combined with video
recording were used for continuous evaluation of performance along a 1,425-m race
course, revealing important knowledge about gear selection and pacing strategies in
relation to overall sprint-skiing performance. Studies II and III were designed to
analyse the effects of increasing velocity on the kinematics and kinetics of the DS
and HB sub-techniques on snow, thus furthering our understanding of classical c.c.
skiing on the steepest uphill sections of a course. In Studies IV and V a modified GE
method was applied to estimate the anaerobic energy supply during STTs over a
1,300-m simulated treadmill course, which improved our understanding of the
physiological determinants of sprint performance. Finally, Study V focused on the
influence of self-selected pacing strategies on metabolic responses during four
repeated STTs.
5.1. KINEMATICS
Study II demonstrated that regulation of velocity from high to maximal is mainly
related to a substantially increased cycle rate at a shortened cycle length, which
corroborate previous findings by Stöggl et al. (2011) who employed DS roller skiing
at a similar incline. By contrast, previous studies examining velocity adaptations
during DS on flat and slightly uphill (2.5°) terrains on snow have shown that
increases in velocity are mainly associated with increases in cycle rate, with a nearly
constant cycle length up to maximal velocity (Nilsson et al., 2004a; Vähäsöyrinki et
al., 2008). This inconsistency may, at least in part, be related to differences in slope
gradients, where the higher resistance due to gravity in the current study is likely to
increase the importance of a high cycle rate for reducing velocity fluctuations
(Hoffman et al., 1995).
The velocity of HB skiing (Study III) was mainly regulated by changes in cycle rate,
with observed cycle rates of 1.19 to 1.61 Hz, exceeding those reported previously for
DS at similar velocities, but lower inclines (Lindinger et al., 2009a; Stöggl & Müller,
2009). This difference probably reflects the additional resistance by gravity imposed
by the steep incline, together with the lack of a gliding phase in HB. In comparison

44
to steep uphill running at a similarly high velocity (Gottschall & Kram, 2005), the
cycle length during HB was somewhat longer, most likely due to the additional
propulsion provided by the poles. In DS, non-linear, concave upward and
downward curves were observed for the cycle rate and cycle length adaptations
across the three velocities, which is similar to the velocity adaptation in running
(Hay, 2002). Hay (2002) demonstrated that the maximal cycle length during running
was attained at a velocity corresponding to ~ 85% of the maximal velocity and a
similar relationship was observed in Study II.
A comparison of the velocity adaptation characteristics between sprint- and
distance-specialised skiers was made in Study II. The sprint-specialised skiers were
10% faster than the distance-specialised skiers at the high velocity due to their ability
to generate longer cycle lengths. Furthermore, at maximal velocity the sprint-
specialised skiers exhibited a more rapid cycle rate to compensate for a reduced cycle
length and reached 14% higher velocities than the distance-specialised skiers.
Therefore, the slower maximal velocities attained for the distance-specialised skiers
were probably, in part, explained by an ineffective technical strategy and/or a
physiological inability.
With DS (Study II) and HB (Study III) the absolute phase durations of the poling and
kick decreased similarly as the velocity increased from moderate to high velocity.
However, from high to maximal velocity during DS, the kick time decreased
considerably less than the poling time (13% versus 29%), with no such pattern
observed for HB. This difference is probably related to the considerably shorter kick
duration at maximal velocity in DS than HB (0.14 versus 0.25 s), indicating that the
critical time for leg force impulse application during DS was reached at the high
velocity, due to the prolonged relative kick phase duration that was combined with
a decreased cycle length at maximal velocity. In DS, the kick times observed across
the different velocities are in agreement with earlier findings reported by
Vähäsöyrinki et al. (2008), and the kick time at maximal velocity is comparable to
the contact times reported for sprint running uphill (Weyand et al., 2000).
In the case of HB the relative phases (as percentages of a total cycle) of poling, leg
thrust and recovery were constant across all the velocities, whereas for DS the
relative kick was prolonged and the gliding phase shortened at maximal velocity.
These findings emphasise the importance of fast and substantial leg-force
generation, especially during DS, due to the limited time available for force
application. This is especially important with respect to the leg thrust during

45
classical skiing, since the ski must be stationary as force is applied to the ground,
differing substantially from skating where the ski is gliding during the leg thrust
(Smith, 2003).
5.2. KINETICS
The peak pole forces observed with DS and HB ranged from 15-25% and 13-25% of
BW, respectively, values that are relatively high in comparison to DS roller skiing on
a treadmill at velocities corresponding to the moderate intensity used in Study II
(Björklund et al., 2010; Lindinger et al., 2009a). The observed gradual increase in
peak pole forces with elevated velocities corroborate previous findings by Stöggl et
al. (2011), showing a considerable increase (19% to 29% of BW) in peak pole force
from submaximal to maximal DS roller skiing.
The peak leg forces were similar across all velocities for both sub-techniques (i.e., DS
and HB), with peak forces of ~ 2 times BW, which is similar to previous findings for
diagonal roller skiing (Lindinger et al., 2009a; Stöggl et al., 2011) and diagonal skiing
on snow (Komi & Norman, 1987). In Study III the relative contributions of the
resultant pole and leg forces to propulsion in HB were constant across velocities (~
71% and 20%, respectively). In addition, of the total propulsive force generated, the
poling and leg thrust contributed 23% and 77%, respectively. Thus, although pole
forces are more effectively applied, leg forces contribute most to the total propulsion
during HB.
The rate of force development for the leg thrust with both DS and HB increased with
higher velocities, which is consistent with findings for running (Kram & Taylor,
1990), where faster velocities are primarily related to higher rates of force generation
(Weyand et al., 2000). By contrast, Stöggl et al. (2011) observed no increase in the rate
of force development for the leg thrust with an elevated DS roller skiing velocity.
However, compared to the observations at a similar maximal velocity and incline by
Stöggl et al. (2011), Study II revealed time to peak pole and leg forces that were
considerably shorter (both ~ 25%) with higher rates of force development during
poling (53%) and ski-loading (28%) for DS performed on snow. Hence, the
importance of proper timing and the rate of leg force generation (here measured as
the normal force generated on the insole of the ski boot) during roller skiing and
skiing on snow might differ. When skiing on snow, considerable vertical forces must
be applied rapidly during pre-loading and at the beginning of the kick phase in

46
order to press down the grip waxed ski camber to attain sufficient static friction for
the propulsive kick phase (Komi, 1987; Komi & Norman, 1987), which contrasts to
roller skiing (Ainegren et al., 2013a). Accordingly, the ideal DS roller skiing and on-
snow skiing techniques are likely to differ, a problem that has to be considered
during the off-season when athletes are employing DS roller skiing for training, as
well as a problem when generalising laboratory data to the field. In addition, the
impact of leg force generation (perpendicular to the slope) increases with slope
steepness, being highly important for steep uphill skiing with the HB sub-technique.
Here, we observed that skiers load the inside forefoot extensively during the leg
thrust, probably in order to create enough static friction to avoid slipping.
5.3. SPEED CAPACITY
The importance of Vmax over a short distance (50 m) for sprint-skiing performance
over a longer distance (1000 m) has been previously documented (Stöggl et al., 2006)
and was also observed here (Studies I, IV and V). Since these previous findings are
based on time trials, the importance of Vmax is likely even greater during head-to-
head races that usually finish with a short all-out spurt. The Vmax is probably
determined by a combination of factors, including muscular strength and anaerobic
metabolic characteristics, as well as motor control (i.e., technical factors) (Rusko,
2003; Stöggl et al., 2006).
In Study I, G3-Vmax was positively correlated to the relative use of G3 during the STT
and the Vpeak in the DP acceleration test was negatively related to STT time. In
addition, skiers with a higher DP-Vpeak utilised G3 to a greater extent during the STT
and were faster over the steepest uphill section than slower skiers. This finding
emphasises the necessity for high upper-body strength in sprint skiing, probably
related to the substantial propulsive force generated by the upper body during
uphill skating with G3 (Smith, 1992).
The importance of Vmax was further confirmed in Study IV, where Vmax in DP and DS
were negatively correlated to the respective DP and DS total section times during
the 1,300-m STT. In addition, Study V revealed that the best individual STT
performances were characterised by more aggressive positive pacing strategies and
skiers with the highest Vmax utilised more aggressive pacing strategies. Therefore,
short-interval speed training (20-s all-out intervals interspersed by 120-s of rest)
designed to improve Vmax may also improve performance over longer distances, as

47
previously shown by Nilsson et al. (2004b). Altogether, these findings clearly
illustrate the necessity of a high maximal speed capacity for success in modern c.c.
sprint skiing.
5.4. AEROBIC ENERGY SUPPLY
In endurance sports the upper limit for aerobic metabolic rate (i.e., V̇O2max) is an
important prerequisite for success (Joyner & Coyle, 2008; Saltin & Åstrand, 1967),
and when comparing top athletes from different sports, male c.c. skiers have
demonstrated remarkably high absolute (≥ 6 L/min) and relative (~ 80-90
mL/kg/min) V̇O2max values (Burtscher et al., 2011; Holmberg et al., 2007; Ingjer, 1991;
Rusko, 2003; Sandbakk & Holmberg, 2014; Strømme et al., 1977). Although world-
class sprint skiers have similarly high absolute V̇O2max values, relative values are
somewhat lower (~ 70-80 mL/kg/min) than for the best distance c.c. skiers
(Losnegard & Hallén, 2014; Sandbakk et al., 2010). At the same time, among a
relatively homogenous group of athletes, other physiological and/or biomechanical
factors may be equally crucial for success (Coyle, 1995; Joyner & Coyle, 2008).
In the current thesis, V̇O2max on its own was not shown to be significantly related to
the overall STT performance times observed in Studies I and IV, but was related to
the ability to maintain uphill skiing velocity, with more even pacing strategies being
employed by the skiers with the highest V̇O2max values (Study I). Although rather
speculative, the more even pacing strategies by the skiers’ with the highest values of
V̇O2max may have been related to their potentially lower anaerobic capacity.
Even though an aerobic energy contribution of 82% was observed in Study IV, only
30% of the variation in STT performance could be related to the aerobic metabolic
rate (i.e., performance V̇O2), with no significant correlation observed between V̇O2max
and STT performance. This corroborates previous findings by Stöggl et al. (2007) and
Losnegard et al. (2012a) showing no clear relationships between V̇O2max and sprint-
skiing performance. By contrast, Sandbakk et al. (2011) observed a significant
relationship between V̇O2max and STT performance in an international competition.
These contrasting observations are likely related to different physiological
characteristics of the participants involved in the different studies. Although some
elite endurance athletes possess relatively low V̇O2max values, they can still be
successful. This is possible by compensating with a higher GE and/or fractional
utilisation of V̇O2max, which indicate that “best-in-class” values for each performance

48
factor are unlikely to appear in the same athlete (Joyner & Coyle, 2008; Lucia et al.,
2002; Weston et al., 2000). Furthermore, c.c. skiing comprises several different sub-
techniques and V̇O2max in each sub-technique is important to performance. In Study I
we observed that G3 was the most frequently used (~ 63%) sub-technique and hence
the V̇O2max in G3 is likely to be more important to performance than V̇O2max in other
sub-techniques.
In Studies IV and V, relatively low RER values were observed in DP at high sub-
maximal intensities and the V̇O2max attained using DP and DS were relatively similar.
Moreover, the ratio of the respective V̇O2max values in DP and DS was substantially
higher compared to previous findings (0.96 versus 0.86) by Holmberg et al. (2007),
and probably a consequence of an enhanced emphasis on specific upper-body
endurance and strength training by elite skiers of today (Sandbakk & Holmberg,
2014).
5.5. GROSS EFFICIENCY (GE)
The most common concept of whole body efficiency is GE, defined as the amount of
metabolic energy transferred to external work (van Ingen Schenau & Cavanagh,
1990). An alternative to GE is an expression of economy (Saunders et al., 2004) and
several earlier studies on c.c. skiing have used this concept (Hoff et al., 1999;
Hoffman, 1992; Hoffman & Clifford, 1990; 1992; Hoffman et al., 1994; Losnegard et
al., 2013; Mahood et al., 2001; Mikkola et al., 2007; Millet et al., 1998a; Millet et al.,
2003; Østerås et al., 2002). Movement economy is usually expressed as the V̇O2 at a
given submaximal velocity or, alternatively, as the VO2 per distance covered
(mL/kg/m); i.e., the O2 cost. However, since economy or O2 cost do not take the
different caloric equivalents for fat and carbohydrate into account, it is potentially
more accurate to convert the O2 cost to an energetic cost (J/kg/m) by combining the
VO2 and RER values (Weir, 1949). Since a lowering of the RER by 0.10 reduces the
gross metabolic rate by 2.2% (Weir, 1949), it is perhaps surprising that V̇O2 or O2 cost
have been utilised to evaluate economy at various running intensities without
considering the influence of substrate utilisation (Conley & Krahenbuhl, 1980;
Daniels & Daniels, 1992; Helgerud et al., 2010).
Therefore, GE and energetic cost were analysed in Studies IV and V. The GEs
associated with the DP and DS sub-techniques were, on average, ~ 16% and 20%,
respectively, which are in agreement with previous observations using DP

49
(Lindinger & Holmberg, 2011) and DS (Ainegren et al., 2013b), but generally lower
as compared to cycling at high work rates (Coyle et al., 1992; Gaesser & Brooks, 1975;
Ettema & Lorås, 2009). Although a linear decline in GE with an elevated DP velocity
was demonstrated by five skiers in Study IV, no significant relationship was
observed between velocity and GE (Study IV). For DS, GE was independent of
velocity (Studies IV and V). The GE for DS increased gradually with steeper inclines,
whereas with DP the GE improved slightly up to an incline of 2.3° and fell at steeper
gradients (Study IV). In addition, when expressed as an energetic cost, DP was more
economical at inclines < 3.3° and DS at inclines > 3.3°, which is in agreement with
Pellegrini et al. (2013).
The GE and economy values of elite cyclists and runners are typically better than
those of amateurs (Lucia et al., 1998; Saunders et al., 2004). Among elite athletes with
similar V̇O2max values, factors such as GE and/or economy become increasingly
important (Conley & Krahenbuhl, 1980; Costill et al., 1971; Weston et al., 2000; Lucia
et al., 1998). In connection with world class cycling, Jeukendrup et al. (2000)
calculated that a 1 percentage point increase in GE would lower the time required to
cycle 40 km by 48 s. In addition, Sandbakk et al. (2011) showed a negative correlation
between GE and sprint-race time (r = - 0.83) in a group of world-class skiers.
C.c. skiing can be considered as a technically complex endurance sport and as such,
GE is likely strongly associated with performance. The relative importance of GE to
sprint-skiing performance was assessed for the first time in Study IV, explaining 53%
of the inter-individual variability in STT performance time, while V̇O2 explained only
30%. Even though the individual variations in V̇O2max and GE were similar (CV = ~
4.5%), GE was a better predictor of performance, perhaps at least in part because this
measure is related to not only aerobic but also anaerobic metabolic demands. In
addition, GE and O2 cost have been observed to vary more than V̇O2max during a
training season in both cyclists (Hopker et al., 2009) and c.c. skiers (Losnegard et al.,
2013). Therefore, the influence of training on GE should be tested on a regular basis
and strategies designed to improve GE should be developed further.
5.6. ANAEROBIC ENERGY SUPPLY
In c.c. skiing sprint races are performed over undulating terrain at varying
intensities, forcing skiers to alternate between different sub-techniques. Therefore,
the production and distribution of anaerobic energy when alternating between the

50
DP and DS sub-techniques during self-paced STTs on a treadmill were analysed in
Studies IV and V. At present, two commonly used approaches for estimating
anaerobic energy production are the MAOD (Medbø et al., 1988) and GE (Serresse
et al., 1988) methods. The MAOD method is regularly employed in sports where the
external work, and hence the GE, cannot adequately be determined (e.g., in
running), while the GE method is convenient for cycle ergometry where the external
work is easy to quantify (Noordhof et al., 2013; van Ingen Schenau & Cavanagh,
1990). Although GE can also be determined during treadmill roller skiing (Sandbakk
et al., 2010), previous examinations of anaerobic energy production during roller
skiing at fixed uphill gradients have used the MAOD method exclusively
(Losnegard et al., 2015; Losnegard & Hallén, 2014; Losnegard et al., 2012a; Losnegard
et al., 2013; McGawley & Holmberg, 2014; Sandbakk et al., 2016). By contrast, GE
was used for estimating the anaerobic energy production in the current thesis
(Studies IV and V).
In Study IV, GE was influenced by both the skiing velocity and incline in a manner
dependent on the sub-technique employed, so the conventional GE procedure for
determining anaerobic energy production was inadequate. As such, a novel
approach incorporating both velocity and incline had to be developed. This
approach enabled estimation of the anaerobic energy supply during simulated
sprint skiing over undulating terrain. Clearly, the potential influence of velocity and
incline on GE should routinely be taken into consideration.
The anaerobic energy contribution of ~ 18% observed in Studies IV and V is consistent
with previous values for other types of sporting events of similar duration (i.e., 210
to 250 s) (Bangsbo et al., 1993; Gastin, 2001; Spencer & Gastin, 2001). However, the
absolute O2 deficit of ~ 45 mL/kg was lower than previously reported for uphill (600-
m, 7°) V1 and V2 ski-skating (Losnegard et al., 2012a) and DS skiing (McGawley &
Holmberg, 2014). This difference may to some extent be related to the constant uphill
gradients used in these previous studies and thereby providing no opportunity for
the reconstitution of anaerobic energy during flat sections. Although the influence
of incline on anaerobic capacity in c.c. skiing has not previously been evaluated,
considerably greater (~ 60-80%) O2 deficits have been observed in running when the
slope gradient was elevated from 1% (0.6°) to 15% (8.5°) (Olesen, 1992; Sloniger et
al., 1997), which also may be the case for c.c. skiing. This suggestion is supported by
our finding that the peak O2 deficit was reached after the second uphill section (Fig.
15C and 16D) and not at the finish line (Studies IV and V).

51
In Study IV, only 15% of the inter-individual variability in STT performance was
related to variations in the total accumulated O2 deficit. By contrast, Losnegard et al.
(2012a) showed anaerobic energy production to explain ~ 50% of the inter-individual
variability in sprint-skiing performance. These differences may be related to the ~
35% longer STT completion times in the current thesis (Studies IV and V), with a
lower relative anaerobic energy contribution (18% versus 26%), as well as differences
in subject characteristics. Moreover, Study V showed that the intra-individual (i.e.,
within-athlete) variability in STT performance was highly (69%) related to variations
in the O2 deficit. This latter relationship confirms that the anaerobic component of
metabolic power is more variable than the aerobic.
The relative anaerobic energy contribution in c.c. skiing is likely to vary between ~
18-26% during sprint races (Studies IV and V; Losnegard et al., 2012; McGawley &
Holmberg, 2014) and down to < 1% during long distance (i.e., 50 km) races (assuming
a maximal O2 deficit of ~ 50 ml/kg). However, intensity varies during c.c. ski races,
with work intensities exceeding V̇O2max during uphill sections (Norman et al., 1989;
Sandbakk et al., 2011) and dropping below V̇O2max during longer downhill sections
(Rusko, 2003). Therefore, substantial production of anaerobic energy while skiing
uphill is likely to attenuate the decline in V̇O2 on the subsequent downhill section,
thereby enhancing the fractional utilisation of V̇O2max. Moreover, the irregular
distribution of the anaerobic energy produced over the course (Figs. 15C, 16D) in the
current thesis (Studies IV and V) provide some evidence for this assumption and
sprint races on snow over an actual course that also include downhill stretches
would probably result in an even more irregular distribution of anaerobic energy.
5.7. PACING STRATEGIES AND ASSOCIATED METABOLIC RESPONSES
During the 1425-m STT in Study I, a positive pacing strategy involving 3% more time
spent on the second than the first lap was employed, while the positive pacing
during all STTs in Study V involved 3-9% longer times on the second half (Fig. 17A).
A beneficial aspect of positive pacing with a fast start may be related to faster V̇O2
kinetics (Aisbett et al., 2009; Bishop et al., 2002), as the time to reach V̇O2max has been
found to be inversely related to the starting intensity (Jones et al., 2008). In Study V,
skiers reached their predetermined V̇O2max in each respective STT after ~ 98 s, with
no significant difference in the time to peak V̇O2 between STTs. This V̇O2 response
supports earlier findings showing that elite athletes can reach near maximal V̇O2
values within 2-min of exhausting exercise (Hettinga et al., 2009).

52
The skiers with the highest Vmax used more aggressive pacing strategies (Study V),
while V̇O2max was related to the ability to maintain uphill skiing velocity in Study I.
These findings suggest that skiers adapt their pacing strategies not only to course
length but also to their individual physiological and biomechanical abilities. The
importance of a fast start was emphasised by the finding that the fastest trials
involved an approximately 5% greater power output over the first half of the course
(Fig. 16E), with a larger anaerobic energy supply but the same aerobic energy supply
as in the slowest trial. Although an over-aggressive pacing strategy may be
deleterious for overall performance due to premature fatigue, the worst
performances in Study V were related to slower initial velocities where athletes were
not able to make up for the lost time. Therefore, a too fast start and so called “over-
pacing” does not seem to be a problem when well-trained skiers are performing self-
paced 1300-m (~ 4 min) STTs on a treadmill. Conversely, Losnegard et al. (2012a)
introduced a protocol that involved a relatively slow fixed starting velocity (10.8
km/h, ~ 100% of V̇O2max) during the initial 36 s (~ 21%) of the 600-m (~ 3 min) uphill
(7°) skating time trial to avoid over pacing.
Unlike earlier laboratory studies of pacing performed on fixed inclines (Abbiss &
Laursen, 2008), Study V involved a simulated course with both flat and uphill
sections. As illustrated in Figure 16C and as hypothesised, more aggressive pacing
was utilised on the uphill than on the flat sections, with considerably higher (~ 30%)
metabolic rates for uphill DS than for flat skiing with DP. In addition, skiers with a
greater body mass tended to take relatively longer to complete the uphill sections
than lighter skiers. Altogether, this corroborates previous findings that elite skiers
generate the highest metabolic rates during uphill skiing (Norman et al., 1989;
Sandbakk et al., 2011) and shows that terrain-specific pacing is affected by the skiers
body mass, which has been observed previously when modelling cycling
performance (Boswell, 2012). The importance of uphill skiing for overall race results
has been previously observed in traditional skiing by Berg & Forsberg (2008), who
stated that more than half of the race time is spent uphill when the course contains
equal amounts of uphill, downhill and flat terrain. This is comparable to sprint
skiing on snow, where ~ 47% of the total STT time was spent during uphill skiing
(Study I).
The benefits of more aggressive pacing on the uphill than on the flat sections may
be related to a combination of physiological, biomechanical and mechanical factors.
Skiers may generate larger maximal O2 deficits during uphill compared to flat skiing,

53
similarly to previous observations in running (Olesen, 1992; Sloniger et al., 1997). A
linearly decreasing GE, or increasing energetic cost, was observed in four skiers
during DP when the velocity was elevated (see Fig. 14B). No such effect could be
observed during sub-maximal uphill DS skiing, which provides a rationale for the
considerably higher power output and metabolic rate during uphill DS skiing. In
addition, the higher power outputs and metabolic rates observed during uphill
skiing may enhance skiing performance outdoors, primarily by reducing
fluctuations in velocity and thereby overall air-drag (Sundström et al., 2013).
Altogether, anaerobic capacity and power are probably key determinants of effective
pacing, allowing athletes to work at considerably higher work rates uphill than on
easier parts of the course that can be utilised for “anaerobic recovery” (i.e.,
decreasing the O2 deficit).
5.8. TRANSITIONS BETWEEN SUB-TECHNIQUES
In c.c. skiing, Kvamme et al. (2005) proposed that O2 cost is an important
determinant of technique selection. They reported that G2 is more economical at
gradients > 4.5°, while G3 is more economical < 4.5°. By contrast, no differences in
O2 cost or STT performance have recently been observed in elite skiers using these
gears at 4-8° slope inclines (Losnegard et al., 2012a; b). Furthermore, during the
1,425-m STT in Study I, G3 was used at slope gradients up to ~ 9°, with higher-ranked
skiers utilising relatively more G3 than G2. Therefore, gear selection was not
determined solely by slope inclination, since skiing velocity and the length of the
uphill slopes were also important factors.
The frequent alterations between sub-techniques unique to c.c. skiing are illustrated
by the 21-34 gear transitions performed during the STT in Study I. Although it is
commonly assumed that animals, including humans, change gait for lowering the
energetic cost of movement (Hoyt & Taylor, 1981; Margaria, 1976), several studies
(Minetti et al., 1994; Rotstein et al., 2005; Thorstensson & Roberthson, 1987) have
proposed that the comfort of locomotion is a more important factor for a gait
transition than a reduced energetic cost.
In Study IV, the spontaneous transition points between the DP and DS sub-
techniques during a STT were analysed for the first time. Recent findings by
Pellegrini et al. (2013) suggest that such transitions are related to a variety of factors,
with force generation appearing to be one crucial determinant. However, a trade-off

54
problem is likely to exist between different variables, such as force production,
metabolic cost and muscular fatigue (Allen et al., 1995; Griffin et al., 2003; Hill, 1938;
Minetti et al., 1994).
Study IV revealed that the preceding workload exerts a more pronounced influence
on the spontaneous transition point than does the energetic cost, which is analogous
to earlier findings for walk-to-run transitions (Hreljac, 1993; Minetti et al., 1994).
Although the change from DP to DS involved no difference in metabolic cost, but
with the reverse order of transition (DS to DP); skiers were changing to DP when DS
still was less energy consuming. Thus, the early transitions to DP on steep inclines
(4.5° and 4.8°) were probably related to comfort of movement, since the preceding
DS was performed with considerably higher metabolic rates. Thus, potential fatigue
in skiing muscles associated with DS resulted in an uneconomical (i.e. energetically
too early) transition to DP at a relatively steep incline (~ 4.7°) in attempt to minimise
exertion.
5.9. METHODOLOGICAL CONSIDERATIONS
In Study III, the propulsive force components were estimated as based on force
balance (Frederick, 1992; de Koning & van Ingen Schenau, 2000), where gravity was
considered as the only opposing force due to the steep uphill gradient (15°), slow
skiing velocities (2.4-3.8 m/s) and absence of gliding. Even though the exclusion of
air drag and potential force losses during the pole and leg thrusts have
shortcomings, similar simplifications have been made during the analyses of
running and walking on steep uphill terrain (Minetti et al., 2002).
Classical roller skiing with ratcheted wheels allows generation of static friction
during the leg kick that is several times greater than that for skiing on snow, which
allow skiers to generate high propulsive forces without the ski slipping and is thus
less dependent on technical skills (Ainegren et al., 2013a). In Study II, the rates of
leg/plantar force application were substantially higher for DS skiing on snow than
for roller skiing at a similar velocity and incline (Stöggl et al., 2011), so that
generalising results from the former to the latter may be questionable. Therefore, a
more detailed analysis of such differences, including forces in both the normal and
forward directions, is required (Kehler et al., 2014; Vähäsöyrinki et al., 2008).
A precise determination of GE and the aerobic and anaerobic energy contributions
require accurate measures of V̇O2 (Studies IV and V). The V̇O2 was measured using a

55
metabolic cart with a mixing chamber (Studies I, IV and V) (Jensen et al., 2002). This
system was tested for validity against the “gold standard” Douglas bag system
(Carter & Jeukendrup, 2002) during treadmill roller skiing at four different
submaximal intensities (~ 50% to 85% of V̇O2max, RER ≤ 1.00), as described previously
(Ainegren et al., 2013b). The typical error for the difference between the metabolic
cart and the Douglas bag system was 0.07 L/min, indicating a high validity, with a
smallest worthwhile difference (Mann et al., 2014) in V̇O2 of 0.20 L/min.
In Studies IV and V the O2 deficit was estimated by using a modified GE method. The
GE and MAOD methods are commonly applied for estimating the O2 deficit during
supramaximal exercise (Noordhof et al., 2013) and both methods have been shown
to be similarly reliable (Noordhof et al., 2011). Although a low agreement between
the estimated O2 deficits with the GE and MAOD methods was reported by
Noordhof et al. (2011), a high level of agreement has been demonstrated more
recently (Andersson & McGawley, 2016). However, the main problem with both of
these methods involves the assumption that the relationship between energy cost
and power output or velocity is similar at supramaximal exercise, an error that has
been proposed to amplify with higher supramaximal intensities (Bangsbo, 1998).
The relatively long STT durations (~ 4 min) in Studies IV and V resulted in relatively
low supramaximal intensities and should therefore have minimised this potential
error. In addition, supramaximal 4000-m cycling time trials have recently been
shown to decrease GE (from ~ 23% to 20.5%) (Noordhof et al., 2015), which might be
a potential limitation with the GE method used for estimating the O2 deficit.
However, a previous study (Åsan Grasaas et al., 2014) showed only a slight decline
in GE (15.5% to 15.2%) during high-intensity roller skiing, which indicates a
relatively low potential effect of this parameter on the estimated O2 deficit during
c.c. skiing.
Although the O2 deficit is often viewed as an exclusively anaerobic component, a
small fraction of the measured O2 deficit comes from oxidative phosphorylation
from the O2 stored in haemoglobin and myoglobin. However, these O2 stores have
been estimated to be ~ 6 mL/kg (Medbø et al., 1988; Milne, 1988) and constitute only
a relatively small fraction (~ 10%) of the total O2 deficit. To obtain a more accurate
estimate of anaerobic capacity in c.c. skiers, other investigators (Losnegard et al.,
2012a; McGawley & Holmberg, 2014) have subtracted the estimated stored O2 (8.8
mL/kg) from the O2 deficit. However, since the amount of stored O2 can only be

56
approximated (Medbø et al., 1988), no such adjustment was made here (Studies IV
and V).
The skiers’ Vmax was analysed in all of the studies included in the current thesis. In
Studies I-III all-out performances over short distances (~ 10-20 m) including a short
run-up (30-40 m) were performed. These short all-out efforts were likely to provide
measures of maximal anaerobic metabolic rate (Smith & Hill, 1991; Vandewalle et
al., 1987). By contrast, the incremental Vmax protocols for treadmill roller skiing in
Studies IV and V were considerably longer (~ 60-90 s) and the associated Vmax measure
was probably more related to the total amount of anaerobic energy produced (i.e.,
anaerobic capacity) than maximal anaerobic metabolic rate (Vandewalle et al., 1987).
Even though these two variables are usually related (Goslin & Graham, 1985; Maud
& Shultz, 1986; Medbø & Burgers, 1990; Scott et al., 1991) they represent different
metabolic entities (Minahan et al., 2007). However, Stöggl et al. (2006) showed that
a short-distance (50 m, 7.6-9.8 s) DP Vmax test conducted in the field was highly
correlated (r = 0.86) to a longer duration (~ 68 s) incremental Vmax test on a treadmill.
In addition, both tests were highly reliable with a low individual test-retest
variability (CV of 1.7-1.8%). Therefore, while short- and long-duration measures of
Vmax probably reflect slightly different physiological abilities, they appear to be
closely related.
In Studies I, IV and V self-paced time trials were performed over a set distance (i.e.,
“closed-end” tests). Previous studies have shown time trials to be significantly more
reliable than time-to-exhaustion tests that are “open end” (Jeukendrup et al., 1996;
Schabort et al., 1998a; Schabort et al., 1998b). In Study V, the within-athlete variability
in the STT performance times were low (1.3 ± 0.4%) and similar to previous findings
(Hickey et al., 1992; Schabort et al., 1998b; Stone et al., 2011; Schabort et al., 1998a).
In addition, the best performances in Study V were in the first and last trials, which
were equally fast, indicating appropriate familiarisation and an ability to recover
between trials. Although the reliability and/or validity may be questionable when
conducting laboratory time trials for evaluating sports performance, a cycling
ergometry time-trial performance was found to be highly correlated (r = 0.98) to an
outdoor road race (Palmer et al., 1996). Altogether, self-paced laboratory time trials
appear to be sufficiently reliable and race specific for monitoring sports
performance.

57
6. CONCLUSIONS
In Study I, better performance in the 1425-m STT was closely related to faster uphill
skiing and a greater utilisation of the G3 sub-technique. Additionally, the percentage
of racing time using G3 was positively related to both G3-Vmax and DP-Vpeak.
Moreover, V̇O2max was related to the ability to maintain racing velocity on the uphill
sections during the second lap. The skiers employed a positive pacing strategy, with
a faster first than second lap. In addition, the decrease in velocity during the second
lap was mainly related to slower uphill skiing, with a shift in gear choice from G3
towards a higher utilisation of G2.
In Studies II and III, increased skiing velocity from moderate to high (i.e., from ~ 63%
to 80% of maximal velocity) with DS and HB were associated with synchronous
increases of both cycle rate and cycle length, while further increases up to maximal
velocity were solely related to a substantially higher cycle rate. At all velocities, leg
thrust times were considerably shorter than poling times, especially in the case of
DS, and the rate of force development during both the poling and leg thrust phases
increased with higher velocities (Studies II and III). When DS velocity was elevated
from high to maximal, the skiers shortened the relative gliding phase for a longer
relative kick phase, thereby reducing the decline in absolute kick time. These
observations emphasise the importance of a rapid generation of leg force in
connection with DS (Study II). With HB, where gliding is absent, cycle rates were
considerably higher (~ 22%) than with DS and absolute leg thrust times were
considerably longer (~ 34%). In addition, 77% of the total forward propulsion was
generated by the legs during HB (Study III). Altogether, these findings highlight the
particular importance of leg-force generation during uphill classical skiing with the
DS and HB sub-techniques (Studies II and III).
Studies IV and V revealed that the relative aerobic and anaerobic energy
contributions during a 1,300-m STT (~ 4 min) were ~ 82% and 18%, respectively.
Moreover, the novel GE method developed in this thesis enables the anaerobic
energy supply during time trials involving multiple sub-techniques on varying
inclines to be estimated. In the case of Study IV, multiple regression analysis revealed
that V̇O2, O2 deficit and GE explained 30%, 15% and 53%, respectively, of the total
variance in STT performance time. In contrast to the low importance of anaerobic
energy production for overall performance (Study IV), intra-individual (i.e., within-
athlete) variations in performance during the four successive STTs were closely
related (69%) to variations in anaerobic energy production (Study V). In Study V,

58
positive pacing was employed throughout all the four STTs, with the best individual
performances involving more aggressive pacing from the start. In addition, the
pacing was regulated to the terrain, where considerably greater metabolic rates were
generated on the uphill than on the flat sections of the course, resulting in an
irregular distribution of the anaerobic energy reserve (Studies IV and V).
Furthermore, the predetermined Vmax was related to overall STT performance (Study
IV), as well as to the pacing strategy, with skiers demonstrating higher Vmax using
more aggressive pacing.

59
7. PRACTICAL APPLICATIONS
The current thesis aimed to assess important biomechanical and physiological
determinants of high velocity c.c. skiing, with a specific focus on sprint skiing.
Findings showed Vmax to be highly related to performance, suggesting that c.c. skiers
should emphasise training of specific maximal strength, power and speed, as well
as technical ability, to enhance sprint-skiing performance. These important aspects
of maximal speed and motor control should be considered especially when
designing training for children and youth (Bompa & Haff, 2009; Stöggl & Stöggl,
2013).
A fundamental biomechanical constraint during high-velocity skiing is the inverse
relationship between force and velocity of the contracting muscles (i.e., a high
shortening velocity results in a low force and vice versa). This is specifically
problematic in classical skiing as the ski has to be stationary during the leg kick. In
DS, kick times associated with Vmax were similar to the contact times reported for
uphill sprint running (~ 0.14 s) (Weyand et al., 2000). Therefore, training to enhance
Vmax should probably focus on a combination of maximal strength, power and speed
training exercises, together with a particular focus on technique development. Such
improvements may also enhance skiing economy as demonstrated previously (Hoff
et al., 1999; Mikkola et al., 2007; Østerås et al., 2002; Helgerud et al., 2001).
The current thesis also provides support for the high importance of GE (or energetic
cost/economy) for c.c. skiing performance, which emphasises the need for regular
testing of GE in addition to other common physiological tests (i.e., V̇O2max and lactate
thresholds). Moreover, a decline in GE with an elevated DP velocity was evident in
some skiers during the high-intensity submaximal test. Although specific
mechanisms that explain such a decline in GE need further investigation, it may, at
least in part, be related to the aforementioned force-velocity constraint associated
with high muscle contraction velocities with an increased energetic cost of
generating force (Barclay et al., 1993; Houdijk et al., 2006; Kram & Taylor, 1990).
The performance of elite sprint c.c. skiers during a one-year season was monitored
by Losnegard et al. (2013), who found a considerable improvement (7%) from June
to January in 1000-m uphill skating time-trial performance. This improvement was
only associated with an enhanced anaerobic capacity and economy, whereas the
V̇O2max remained unchanged (~ 79 mL/kg/min). Therefore, when athletes have
reached their upper ceiling for V̇O2max, other decisive performance factors (such as

60
fractional utilisation of V̇O2max and GE) need to be emphasised during testing and
training. Moreover, since c.c. ski races are performed on undulating terrain at
intermittent intensities, the magnitude and distribution of anaerobic energy
contributions may be highly important, most likely also influencing V̇O2max
utilisation during a race, since the aerobic and anaerobic energy systems are
interrelated (Skiba et al., 2012; Jones et al., 2008).
In the current thesis, individually self-paced sprint-skiing time trials were
performed with positive and variable pacing and were usually finished with a short
all-out end spurt. Although a fast starting strategy is generally associated with a fast
V̇O2 response that potentially can enhance performance (Jones et al., 2008), over-
aggressive pacing with a large initial depletion of the anaerobic energy reserve can
induce early fatigue that leads to a deterioration in performance (de Koning et al.,
2011; Tucker & Noakes, 2009). Skiers’ should also consider the mechanical
advantage of increasing work intensity during uphill terrain for reducing the overall
velocity fluctuations and hence the total air-drag (Sundström et al., 2013).
Furthermore, in sprint skiing the knock-out heats after the individual qualification
impose an additional determinant of pacing, i.e., the regulation of the work intensity
with regard to the opponents’ pacing decisions and race tactics (Konings et al., 2015;
Konings et al., 2016; Tomazini et al., 2015). Therefore, different pacing strategies
should be evaluated during race-simulated training, performed individually and
head-to-head, over various ski-courses in order to adapt the regulatory mechanisms
of pacing and race tactics toward an optimum, which may allow a maximised
utilisation of the energetic resources with regard to the finishing point (de Koning et
al., 2011; St Clair Gibson et al., 2006; St Clair Gibson & Noakes, 2004; Ulmer, 1996).

61
8. ACKNOWLEDGEMENTS
Firstly, I would like to thank my supervisors, Hans-Christer Holmberg, Thomas
Stöggl and Glenn Björklund, for the great support throughout the work of this thesis.
Hans-Christer for introducing me in the field of sport science and for always being
generously supportive. Thomas Stöggl the talented and positive minded researcher
who opened the door of c.c. skiing biomechanics for me. Glenn Björklund for all the
guidance and interesting discussions about work physiology and sports
performance.
Several people have been involved in the accomplishment of this thesis and I would
like to express my gratitude to my fellow colleagues for their great friendship during
this doctorial period. Thanks to all employees at the Department of Health Sciences
and/or the Swedish Winter Sports Research Centre and particularly Sture Espwall,
Åsa Eklund, Malin Jonsson, Andreas Kårström, Hampus Lindblom, Mikael Swarén,
Jesper Sjökvist, Helen Hanstock, Haris Pojskic, Erika Schagatay, Angelica Lodin-
Sundström, Alexander Patrician, Lara Rodriguez, Maria Warne, Louise Dovrén, and
Emma Hagqvist.
A specific thanks to Kerry McGawley and Marie Ohlsson for interesting but
sometimes intense discussions about various topics and for generous feedback on
article drafts etc.
I also have to thank my former colleagues, Martina Höök, Kurt Jensen, Marko
Laaksonen, Anders Strid, Mattias Persson, Lars Ljung, Per Tesch, Tommy Lundberg,
Maria Görlin, Lina Johansson, Harald Engan, Lars Wedholm, Ola Rawald, Jonas
Enqvist and Mats Ainegren, for the positive atmosphere that you created.
In addition, I would like to thank David Sundström and Jonas Danvind at the Sports
Tech Research Centre for all inspiring discussions.
Thanks to my co-authors: Øyvind Sandbakk (Studies I-III), Barbara Pellegrini (Studies
II and III), Gertjan Ettema (Study III), Niels Ørtenblad (Studies IV and V), Matej Supej
(Study I), and Billy Sperlich (Study I).
I also have to thank Dennis Born from the University of Wuerzburg for all the nice
training sessions and chit chats.
I do also appreciate the generous support from all of the trainees from the University
of Bath, thanks to Hannah Wishart, Ben Stocks, Simon Platt, and Jonathan Watkins.

62
Thanks for the administrative assistance by Maud Magnusson, Thomas Brännström,
Anki Englund and Maria Evans.
Thanks to the ski and/or biathlon coaches in Östersund, Fredrik Uusitalo, Anna
Maria Uusitalo, Johan Hagström and in Meråker, Per-Øyvind Torvik.
Huge thanks to all participating athletes and coaches.
Lastly, I would like to thank my parents (Ingmarie and Yngve) for my upbringing
and their firm support and understanding through life, as well as for taking me out
on skis in early childhood. My sister Elin with family (Fredrik, Maja and Wilma),
thanks for all the rigorous generosity, happiness and support.

63
9. REFERENCES
Abbiss C. R. & Laursen P. B. 2008. Describing and understanding pacing strategies
during athletic competition. Sports Med, 38, 239-52.
Ainegren M., Carlsson P. & Tinnsten M. 2008. Rolling resistance for treadmill roller
skiing. Sports Eng, 11, 23-29.
Ainegren M., Carlsson P. & Tinnsten M. 2013a. An experimental study to compare
the grip of classical style roller skis with on-snow skiing. Sports Eng, 16, 115-
22.
Ainegren M., Carlsson P., Tinnsten M. & Laaksonen M. S. 2013b. Skiing economy
and efficiency in recreational and elite cross-country skiers. J Strength Cond
Res, 27, 1239-52.
Aisbett B., Lerossignol P., McConell G. K., Abbiss C. R. & Snow R. 2009. Influence of
all-out and fast start on 5-min cycling time trial performance. Med Sci Sports
Exerc, 41, 1965-71.
Allen D. G., Lannergren J. & Westerblad H. 1995. Muscle cell function during
prolonged activity: cellular mechanisms of fatigue. Exp Physiol, 80, 497-27.
Almåsbakk B., Whiting H. T. & Helgerud J. 2001. The efficient learner. Biol Cybern,
84, 75-83.
Andersson E. & McGawley K. 2016. A comparison between different methods of
estimating anaerobic energy production during cross-country roller-skiing.
Book of Abstracts of the 21st annual Congress of the European College of
Sport Science–6-9th July ECSS Vienna, 2016.
Åsan Grasaas C., Ettema G., Hegge A. M., Skovereng K. & Sandbakk Ø. 2014.
Changes in technique and efficiency after high-intensity exercise in cross-
country skiers. Int J Sports Physiol Perform, 9, 19-24.
Atkinson G., Peacock O. & Law M. 2007a. Acceptability of power variation during a
simulated hilly time trial. Int J Sports Med, 28, 157-63.
Atkinson G., Peacock O., St Clair Gibson A. & Tucker R. 2007b. Distribution of power
output during cycling: impact and mechanisms. Sports Med, 37, 647-67.
Bangsbo J. 1998. Quantification of anaerobic energy production during intense
exercise. Med Sci Sports Exerc, 30, 47-52.
Bangsbo J., Michalsik L. & Petersen A. 1993. Accumulated O2 deficit during intense
exercise and muscle characteristics of elite athletes. Int J Sports Med, 14, 207-
13.
Barclay C. J., Constable J. K. & Gibbs C. L. 1993. Energetics of fast- and slow-twitch
muscles of the mouse. J Physiol, 472, 61-80.
Bassett D. R., Jr. & Howley E. T. 2000. Limiting factors for maximum oxygen uptake
and determinants of endurance performance. Med Sci Sports Exerc, 32, 70-84.
Bergh U. & Forsberg A. 2008. Cross‐Country Ski Racing. In: RJ Shephard and PO
Åstrand editors. Endurance in Sport. Oxford: Blackwell Publisher, 844-56.

64
Bilodeau B., Boulay M. R. & Roy B. 1992. Propulsive and gliding phases in four cross-
country skiing techniques. Med Sci Sports Exerc, 24, 917-25.
Bilodeau B., Roy B. & Boulay M. R. 1994. Effect of drafting on heart rate in cross-
country skiing. Med Sci Sports Exerc, 26, 637-41.
Bilodeau B., Rundell K. W., Roy B. & Boulay M. R. 1996. Kinematics of cross-country
ski racing. Med Sci Sports Exerc, 28, 128-38.
Bishop D., Bonetti D. & Dawson B. 2002. The influence of pacing strategy on VO2
and supramaximal kayak performance. Med Sci Sports Exerc, 34, 1041-7.
Björklund G., Holmberg H. C. & Stöggl T. 2015. The effects of prior high intensity
double poling on subsequent diagonal stride skiing characteristics.
Springerplus, 4, 1-12.
Björklund G., Laaksonen M. S. & Holmberg H.-C. 2011. Blood lactate recovery and
respiratory responses during diagonal skiing of variable intensity. Eur J
Sport Sci 11, 317-26.
Björklund G., Stöggl T. & Holmberg H. C. 2010. Biomechanically influenced
differences in O2 extraction in diagonal skiing: arm versus leg. Med Sci Sports
Exerc, 42, 1899-908.
Bompa T. O. & Haff G. 2009. Periodization: Theory and methodology of training, Human
Kinetics.
Boswell G. P. 2012. Power variation strategies for cycling time trials: a differential
equation model. J Sports Sci, 30, 651-9.
Bramble D. M. & Lieberman D. E. 2004. Endurance running and the evolution of
Homo. Nature, 432, 345-52.
Buhl D., Fauve M. & Rhyner H. 2001. The kinetic friction of polyethylen on snow:
the influence of the snow temperature and the load. Cold Reg Sci Technol, 33,
133-40.
Burtscher M., Nachbauer W. & Wilber R. 2011. The upper limit of aerobic power in
humans. Eur J Appl Physiol, 111, 2625-8.
Calbet J. A., Jensen-Urstad M., van Hall G., Holmberg H. C., Rosdahl H. & Saltin B.
2004. Maximal muscular vascular conductances during whole body upright
exercise in humans. J Physiol, 558, 319-31.
Carter J. & Jeukendrup A. E. 2002. Validity and reliability of three commercially
available breath-by-breath respiratory systems. Eur J Appl Physiol, 86, 435-
41.
Chavarren J. & Calbet J. A. 1999. Cycling efficiency and pedalling frequency in road
cyclists. Eur J Appl Physiol Occup Physiol, 80, 555-63.
Cignetti F., Schena F., Zanone P. G. & Rouard A. 2009. Dynamics of coordination in
cross-country skiing. Hum Mov Sci, 28, 204-17.
Clifford P. S. 1992. Scientific basis of competitive cross-country skiing. Med Sci Sports
Exerc, 24, 1007-9.
Conley D. L. & Krahenbuhl G. S. 1980. Running economy and distance running
performance of highly trained athletes. Med Sci Sports Exerc, 12, 357-60.

65
Costill D. L., Branam G., Eddy D. & Sparks K. 1971. Determinants of marathon
running success. Int Z Angew Physiol, 29, 249-54.
Coyle E. F. 1995. Integration of the physiological factors determining endurance
performance ability. Exerc Sport Sci Rev, 23, 25-63.
Coyle E. F. 1999. Physiological determinants of endurance exercise performance. J
Sci Med Sport, 2, 181-9.
Coyle E. F. 2005. Improved muscular efficiency displayed as Tour de France
champion matures. J Appl Physiol 98, 2191-6.
Coyle E. F., Sidossis L. S., Horowitz J. F. & Beltz J. D. 1992. Cycling efficiency is
related to the percentage of type I muscle fibers. Med Sci Sports Exerc, 24,
782-8.
Daniels J. & Daniels N. 1992. Running economy of elite male and elite female
runners. Med Sci Sports Exerc, 24, 483-9.
Daniels J. T. 1985. A physiologist's view of running economy. Med Sci Sports Exerc,
17, 332-8.
de Koning J. J., Bobbert M. F. & Foster C. 1999. Determination of optimal pacing
strategy in track cycling with an energy flow model. J Sci Med Sport, 2, 266-
77.
de Koning J. J., Foster C., Bakkum A., Kloppenburg S., Thiel C., Joseph T., Cohen J.
& Porcari J. P. 2011. Regulation of pacing strategy during athletic
competition. PLoS One, 6, e15863.
de Koning J. J. & van Ingen Schenau G. J. 2000. Performance-determining factors in
speed skating. Biomechanics in sport: Performance enhancement and injury
prevention. Olympic encyclopaedia of sports medicine, 9, 232-46.
di Prampero P. E., Atchou G., Bruckner J. C. & Moia C. 1986. The energetics of
endurance running. Eur J Appl Physiol Occup Physiol, 55, 259-66.
Dillman C. J. & Dufek J. S. 1983. Cross-country skiing: a comparative analysis
between roller and on-snow skiing. Ski Coach, 6, 4-8.
Duffield R., Dawson B. & Goodman C. 2005a. Energy system contribution to 400-
metre and 800-metre track running. J Sports Sci, 23, 299-07.
Duffield R., Dawson B. & Goodman C. 2005b. Energy system contribution to 1500-
and 3000-metre track running. J Sports Sci, 23, 993-002.
Ettema G. & Lorås H. W. 2009. Efficiency in cycling: a review. Eur J Appl Physiol, 106,
1-14.
Farrell P. A., Wilmore J. H., Coyle E. F., Billing J. E. & Costill D. L. 1979. Plasma
lactate accumulation and distance running performance. Med Sci Sports, 11,
338-44.
FIS 2016. International Ski Competition Rules (ICR). Available at http://www.fis-
ski.com.
Formenti F., Ardigo L. P. & Minetti A. E. 2005. Human locomotion on snow:
determinants of economy and speed of skiing across the ages. Proc Biol Sci,
272, 1561-9.

66
Frederick E. C. 1992. Mechanical constraints on Nordic ski performance. Med Sci
Sports Exerc, 24, 1010-4.
Gaesser G. A. & Brooks G. A. 1975. Muscular efficiency during steady-rate exercise:
effects of speed and work rate. J Appl Physiol, 38, 1132-9.
Gastin P. B. 2001. Energy system interaction and relative contribution during
maximal exercise. Sports Med, 31, 725-41.
Göpfert C., Holmberg H. C., Stöggl T., Müller E. & Lindinger S. J. 2013.
Biomechanical characteristics and speed adaptation during kick double
poling on roller skis in elite cross-country skiers. Sports Biomech, 12, 154-74.
Goslin B. R. & Graham T. E. 1985. A comparison of 'anaerobic' components of O2
debt and the Wingate test. Can J Appl Sport Sci, 10, 134-40.
Gottschall J. S. & Kram R. 2005. Ground reaction forces during downhill and uphill
running. J Biomech, 38, 445-52.
Griffin T. M., Roberts T. J. & Kram R. 2003. Metabolic cost of generating muscular
force in human walking: insights from load-carrying and speed
experiments. J Appl Physiol 95, 172-83.
Hay J. G. 2002. Cycle rate, length, and speed of progression in human locomotion. J
Appl Biomech, 18, 257-70.
Helgerud J., Støren Ø. & Hoff J. 2010. Are there differences in running economy at
different velocities for well-trained distance runners? Eur J Appl Physiol, 108,
1099-105.
Helgerud J., Vik J. T. & Hoff J. 2001. The effect of maximal strength training on
endurance performance in upper body for highly trained male cross-
country skiers. Corpus, Psyche et Societas, 8, 90-03.
Hettinga F. J., De Koning J. J. & Foster C. 2009. VO2 response in supramaximal
cycling time trial exercise of 750 to 4000 m. Med Sci Sports Exerc, 41, 230-6.
Hickey M. S., Costill D. L., McConell G. K., Widrick J. J. & Tanaka H. 1992. Day to
day variation in time trial cycling performance. Int J Sports Med, 13, 467-70.
Hill A. V. 1922. The maximum work and mechanical efficiency of human muscles,
and their most economical speed. J Physiol, 56, 19-41.
Hill A. V. 1938. The heat of shortening and the dynamic constants of muscle. Proc R
Soc London B Biol Sci, 126, 136-95.
Hoff J., Helgerud J. & Wisløff U. 1999. Maximal strength training improves work
economy in trained female cross-country skiers. Med Sci Sports Exerc, 31,
870-7.
Hoffman M. D. 1992. Physiological comparisons of cross-country skiing techniques.
Med Sci Sports Exerc, 24, 1023-32.
Hoffman M. D. & Clifford P. S. 1990. Physiological responses to different cross
country skiing techniques on level terrain. Med Sci Sports Exerc, 22, 841-8.
Hoffman M. D. & Clifford P. S. 1992. Physiological aspects of competitive cross-
country skiing. J Sports Sci, 10, 3-27.

67
Hoffman M. D., Clifford P. S. & Bender F. 1995. Effect of velocity on cycle rate and
length for three roller skiing techniques. J Appl Biomech, 11, 257-66.
Hoffman M. D., Clifford P. S., Bota B., Mandli M. & Jones G. M. 1990. Influence of
body mass on energy cost of roller skiing. Int J Sport Biomech, 6, 374-85.
Hoffman M. D., Clifford P. S., Watts P. B., Drobish K. M., Gibbons T. P., Newbury
V. S., Sulentic J. E., Mittelstadt S. W. & O'Hagan K. P. 1994. Physiological
comparison of uphill roller skiing: diagonal stride versus double pole. Med
Sci Sports Exerc, 26, 1284-9.
Holmberg H. C., Lindinger S., Stöggl T., Eitzlmair E. & Müller E. 2005.
Biomechanical analysis of double poling in elite cross-country skiers. Med
Sci Sports Exerc, 37, 807-18.
Holmberg H. C., Rosdahl H. & Svedenhag J. 2007. Lung function, arterial saturation
and oxygen uptake in elite cross country skiers: influence of exercise mode.
Scand J Med Sci Sports, 17, 437-44.
Hopker J., Coleman D. & Passfield L. 2009. Changes in cycling efficiency during a
competitive season. Med Sci Sports Exerc, 41, 912-9.
Houdijk H., Bobbert M. F. & de Haan A. 2006. Evaluation of a Hill based muscle
model for the energy cost and efficiency of muscular contraction. J Biomech,
39, 536-43.
Hoyt D. F. & Taylor C. R. 1981. Gait and the energetics of locomotion in horses.
Nature, 292, 239-40.
Hreljac A. 1993. Preferred and energetically optimal gait transition speeds in human
locomotion. Med Sci Sports Exerc, 25, 1158-62.
Ingjer F. 1991. Maximal oxygen uptake as a predictor of performance ability in
women and men elite cross‐country skiers. Scand J Med Sci Sports, 1, 25-30.
ISHA 2016. The International Skiing History Association (ISHA). Available at
https://skiinghistory.org.
Jensen K., Jørgensen S. & Johansen L. 2002. A metabolic cart for measurement of
oxygen uptake during human exercise using inspiratory flow rate. Eur J
Appl Physiol, 87, 202-6.
Jeukendrup A., Saris W. H., Brouns F. & Kester A. D. 1996. A new validated
endurance performance test. Med Sci Sports Exerc, 28, 266-70.
Jeukendrup A. E., Craig N. P. & Hawley J. A. 2000. The bioenergetics of world class
cycling. J Sci Med Sport, 3, 414-33.
Jones A. M. 2006. The physiology of the world record holder for the women's
marathon. Int J Sports Sci Coaching, 1, 101-16.
Jones A. M., Wilkerson D. P., Vanhatalo A. & Burnley M. 2008. Influence of pacing
strategy on O2 uptake and exercise tolerance. Scand J Med Sci Sports, 18, 615-
26.
Joyner M. J. & Coyle E. F. 2008. Endurance exercise performance: the physiology of
champions. J Physiol, 586, 35-44.

68
Kehler A. L., Hajkova E., Holmberg H. C. & Kram R. 2014. Forces and mechanical
energy fluctuations during diagonal stride roller skiing; running on wheels?
J Exp Biol, 217, 3779-85.
Komi P. V. 1987. Force measurements during cross-country skiing. Int J Sport
Biomech, 3, 370-81.
Komi P. V. & Norman R. W. 1987. Preloading of the thrust phase in cross-country
skiing. Int J Sports Med, 8 Suppl 1, 48-54.
Konings M. J., Noorbergen O. S., Parry D. & Hettinga F. J. 2015. Pacing behaviour
and tactical positioning in 1500 m short-track speed skating. Int J Sports
Physiol Perform, 11, 122-9.
Konings M. J., Schoenmakers P. P., Walker A. J. & Hettinga F. J. 2016. The behavior
of an opponent alters pacing decisions in 4-km cycling time trials. Physiol
Behav, 158, 1-5.
Kram R. & Taylor C. R. 1990. Energetics of running: a new perspective. Nature, 346,
265-7.
Kuipers H., Verstappen F. T., Keizer H. A., Geurten P. & van Kranenburg G. 1985.
Variability of aerobic performance in the laboratory and its physiologic
correlates. Int J Sports Med, 6, 197-01.
Kvamme B., Jakobsen V., Hetland S. & Smith G. A. 2005. Ski skating technique and
physiological responses across slopes and speeds. Eur J Appl Physiol, 95, 205-
12.
Larsen H. B. 2003. Kenyan dominance in distance running. Comp Biochem Physiol A
Mol Integr Physiol, 136, 161-70.
Lindinger S. J., Göpfert C., Stöggl T., Müller E. & Holmberg H. C. 2009a.
Biomechanical pole and leg characteristics during uphill diagonal roller
skiing. Sports Biomech, 8, 318-33.
Lindinger S. J. & Holmberg H. C. 2011. How do elite cross-country skiers adapt to
different double poling frequencies at low to high speeds? Eur J Appl Physiol,
111, 1103-19.
Lindinger S. J., Stoggl T., Müller E. & Holmberg H. C. 2009b. Control of speed during
the double poling technique performed by elite cross-country skiers. Med
Sci Sports Exerc, 41, 210-20.
Losnegard T. 2013. Physiological determinants of performance in modern elite cross-
country skiing. PhD diss., Norwegian School of Sport Sciences, Oslo.
Losnegard T., Andersen M., Spencer M. & Hallén J. 2015. Effects of active versus
passive recovery in sprint cross-country skiing. Int J Sports Physiol Perform,
10, 630-5.
Losnegard T. & Hallén J. 2014. Physiological differences between sprint- and
distance-specialized cross-country skiers. Int J Sports Physiol Perform, 9, 25-
31.
Losnegard T., Myklebust H. & Hallén J. 2012a. Anaerobic capacity as a determinant
of performance in sprint skiing. Med Sci Sports Exerc, 44, 673-81.

69
Losnegard T., Myklebust H. & Hallén J. 2012b. No differences in O2-cost between V1
and V2 skating techniques during treadmill roller skiing at moderate to
steep inclines. J Strength Cond Res, 26, 1340-7.
Losnegard T., Myklebust H., Spencer M. & Hallén J. 2013. Seasonal variations in
VO2max, O2-cost, O2-deficit, and performance in elite cross-country skiers. J
Strength Cond Res, 27, 1780-90.
Lucia A., Hoyos J., Perez M., Santalla A. & Chicharro J. L. 2002. Inverse relationship
between VO2max and economy/efficiency in world-class cyclists. Med Sci
Sports Exerc, 34, 2079-84.
Lucia A., Pardo J., Durantez A., Hoyos J. & Chicharro J. L. 1998. Physiological
differences between professional and elite road cyclists. Int J Sports Med, 19,
342-8.
Mahood N. V., Kenefick R. W., Kertzer R. & Quinn T. J. 2001. Physiological
determinants of cross-country ski racing performance. Med Sci Sports Exerc,
33, 1379-84.
Mann J. B., Ivey P. J., Brechue W. F. & Mayhew J. L. 2014. Reliability and smallest
worthwhile difference of the NFL-225 test in NCAA Division I football
players. J Strength Cond Res, 28, 1427-32.
Margaria R. 1976. Biomechanics and energetics of muscular exercise, Clarendon Press,
Oxford.
Maud P. J. & Shultz B. B. 1986. Gender comparisons in anaerobic power and
anaerobic capacity tests. Br J Sports Med, 20, 51-4.
McArdle W. D., Katch F. I. & Katch V. L. 2010. Essentials of Exercise Physiology
Philadelphia, Lippincott Williams & Wilkins.
McGawley K. & Holmberg H. C. 2014. Aerobic and anaerobic contributions to
energy production among junior male and female cross-country skiers
during diagonal skiing. Int J Sport Physiol, 9, 32-40.
Medbø J. I. & Burgers S. 1990. Effect of training on the anaerobic capacity. Med Sci
Sports Exerc, 22, 501-7.
Medbø J. I., Mohn A. C., Tabata I., Bahr R., Vaage O. & Sejersted O. M. 1988.
Anaerobic capacity determined by maximal accumulated O2 deficit. J Appl
Physiol 64, 50-60.
Mikkola J. S., Rusko H. K., Nummela A. T., Paavolainen L. M. & Hakkinen K. 2007.
Concurrent endurance and explosive type strength training increases
activation and fast force production of leg extensor muscles in endurance
athletes. J Strength Cond Res, 21, 613-20.
Millet G., Perrey S., Candau R., Belli A., Borrani F. & Rouillon J. D. 1998a. External
loading does not change energy cost and mechanics of rollerski skating. Eur
J Appl Physiol Occup Physiol, 78, 276-82.
Millet G. P., Boissiere D. & Candau R. 2003. Energy cost of different skating
techniques in cross-country skiing. J Sports Sci, 21, 3-11.

70
Millet G. Y., Hoffman M. D., Candau R. B. & Clifford P. S. 1998b. Poling forces during
roller skiing: effects of technique and speed. Med Sci Sports Exerc, 30, 1645-
53.
Millet G. Y., Perrey S., Candau R. & Rouillon J. D. 2002. Relationships between
aerobic energy cost, performance and kinematic parameters in roller ski
skating. Int J Sports Med, 23, 191-5.
Milne C. J. 1988. Rhabdomyolysis, myoglobinuria and exercise. Sports Med, 6, 93-106.
Minahan C., Chia M. & Inbar O. 2007. Does power indicate capacity? 30-s Wingate
anaerobic test vs. maximal accumulated O2 deficit. Int J Sports Med, 28, 836-
43.
Minetti A. E., Ardigo L. P. & Saibene F. 1994. The transition between walking and
running in humans: metabolic and mechanical aspects at different gradients.
Acta Physiol Scand, 150, 315-23.
Minetti A. E., Moia C., Roi G. S., Susta D. & Ferretti G. 2002. Energy cost of walking
and running at extreme uphill and downhill slopes. J Appl Physiol, 93, 1039-
46.
Morgan D. W. & Daniels J. T. 1994. Relationship between VO2max and the aerobic
demand of running in elite distance runners. Int J Sports Med, 15, 426-9.
Mourot L., Fabre N., Andersson E., Willis S., Buchheit M. & Holmberg H. C. 2015.
Cross-country skiing and postexercise heart-rate recovery. Int J Sports
Physiol Perform, 10, 11-6.
Mygind E., Andersen L. B. & Rasmussen B. 1994. Blood lactate and respiratory
variables in elite cross‐country skiing at racing speeds. Scand J Med Sci
Sports, 4, 243-51.
Nilsson J., Tveit P. & Eikrehagen O. 2004a. Effects of speed on temporal patterns in
classical style and freestyle cross-country skiing. Sports Biomech, 3, 85-107.
Nilsson J. E., Holmberg H. C., Tveit P. & Hallén J. 2004b. Effects of 20-s and 180-s
double poling interval training in cross-country skiers. Eur J Appl Physiol, 92,
121-7.
Noakes T. D., St Clair Gibson A. & Lambert E. V. 2005. From catastrophe to
complexity: a novel model of integrative central neural regulation of effort
and fatigue during exercise in humans: summary and conclusions. Br J
Sports Med, 39, 120-4.
Noordhof D. A., Mulder R. C., Malterer K. R., Foster C. & de Koning J. J. 2015. The
decline in gross efficiency in relation to cycling time-trial length. Int J Sports
Physiol Perform, 10, 64-70.
Noordhof D. A., Skiba P. F. & de Koning J. J. 2013. Determining anaerobic capacity
in sporting activities. Int J Sports Physiol Perform, 8, 475-82.
Noordhof D. A., Vink A. M., de Koning J. J. & Foster C. 2011. Anaerobic capacity:
effect of computational method. Int J Sports Med, 32, 422-8.

71
Norman R., Ounpuu S., Fraser M. & Mitchell R. 1989. Mechanical power output and
estimated metabolic rates of Nordic skiers during Olympic competition. Int
J Sport Biomech, 5, 169-84.
Olesen H. L. 1992. Accumulated oxygen deficit increases with inclination of uphill
running. J Appl Physiol, 73, 1130-4.
Østerås H., Helgerud J. & Hoff J. 2002. Maximal strength-training effects on force-
velocity and force-power relationships explain increases in aerobic
performance in humans. Eur J Appl Physiol, 88, 255-63.
Palmer G. S., Dennis S. C., Noakes T. D. & Hawley J. A. 1996. Assessment of the
reproducibility of performance testing on an air-braked cycle ergometer. Int
J Sports Med, 17, 293-8.
Pellegrini B., Zoppirolli C., Bortolan L., Holmberg H. C., Zamparo P. & Schena F.
2013. Biomechanical and energetic determinants of technique selection in
classical cross-country skiing. Hum Mov Sci, 32, 1415-29.
Pierce J. C., Pope M. H., Renström P., Johnson R. J., Dufek J. & Dillman C. 1987. Force
measurement in cross-country skiing. Int J Sports Biomech, 3.
Rotstein A., Inbar O., Berginsky T. & Meckel Y. 2005. Preferred transition speed
between walking and running: effects of training status. Med Sci Sports Exerc,
37, 1864-70.
Rusko H. 2003. Physiology of cross country skiing In H. Rusko (Ed.), Handbook of
sports medicine and science: Cross country skiing, 1-31.
Sahlin K., Harris R. C. & Hultman E. 1979. Resynthesis of creatine phosphate in
human muscle after exercise in relation to intramuscular pH and availability
of oxygen. Scand J Clin Lab Invest, 39, 551-8.
Saltin B. & Åstrand P. O. 1967. Maximal oxygen uptake in athletes. J Appl Physiol, 23,
353-8.
Sandbakk Ø., Ettema G., Leirdal S., Jakobsen V. & Holmberg H. C. 2011. Analysis of
a sprint ski race and associated laboratory determinants of world-class
performance. Eur J Appl Physiol, 111, 947-57.
Sandbakk Ø., Hegge A. M., Losnegard T., Skattebo Ø., Tønnessen E. & Holmberg H.
C. 2016. The physiological capacity of the world's highest ranked female
cross-country skiers. Med Sci Sports Exerc.
Sandbakk Ø. & Holmberg H. C. 2014. A reappraisal of success factors for Olympic
cross-country skiing. Int J Sports Physiol Perform, 9, 117-21.
Sandbakk Ø., Holmberg H. C., Leirdal S. & Ettema G. 2010. Metabolic rate and gross
efficiency at high work rates in world class and national level sprint skiers.
Eur J Appl Physiol, 109, 473-81.
Saunders P. U., Pyne D. B., Telford R. D. & Hawley J. A. 2004. Factors affecting
running economy in trained distance runners. Sports Med, 34, 465-85.
Schabort E. J., Hawley J. A., Hopkins W. G., Mujika I. & Noakes T. D. 1998a. A new
reliable laboratory test of endurance performance for road cyclists. Med Sci
Sports Exerc, 30, 1744-50.

72
Schabort E. J., Hopkins W. G. & Hawley J. A. 1998b. Reproducibility of self-paced
treadmill performance of trained endurance runners. Int J Sports Med, 19, 48-
51.
Scott C. B., Roby F. B., Lohman T. G. & Bunt J. C. 1991. The maximally accumulated
oxygen deficit as an indicator of anaerobic capacity. Med Sci Sports Exerc, 23,
618-24.
Serresse O., Lortie G., Bouchard C. & Boulay M. R. 1988. Estimation of the
contribution of the various energy systems during maximal work of short
duration. Int J Sports Med, 9, 456-60.
Sjödin B. & Svedenhag J. 1985. Applied physiology of marathon running. Sports Med,
2, 83-99.
Skiba P. F., Chidnok W., Vanhatalo A. & Jones A. M. 2012. Modeling the expenditure
and reconstitution of work capacity above critical power. Med Sci Sports
Exerc, 44, 1526-32.
Sloniger M. A., Cureton K. J., Prior B. M. & Evans E. M. 1997. Anaerobic capacity
and muscle activation during horizontal and uphill running. J Appl Physiol
83, 262-9.
Smith G. A. 1992. Biomechanical analysis of cross-country skiing techniques. Med Sci
Sports Exerc, 24, 1015-22.
Smith G. A. 2003. Biomechanics of cross country skiing. In H. Rusko (Ed.), Handbook
of sports medicine and science: Cross country skiing, 32-61.
Smith J. C. & Hill D. W. 1991. Contribution of energy systems during a Wingate
power test. Br J Sports Med, 25, 196-9.
Spencer M. R. & Gastin P. B. 2001. Energy system contribution during 200- to 1500-
m running in highly trained athletes. Med Sci Sports Exerc, 33, 157-62.
St Clair Gibson A., Lambert E. V., Rauch L. H., Tucker R., Baden D. A., Foster C. &
Noakes T. D. 2006. The role of information processing between the brain and
peripheral physiological systems in pacing and perception of effort. Sports
Med, 36, 705-22.
St Clair Gibson A. & Noakes T. D. 2004. Evidence for complex system integration
and dynamic neural regulation of skeletal muscle recruitment during
exercise in humans. Br J Sports Med, 38, 797-06.
Stöggl T. & Holmberg H. C. 2015. Three-dimensional force and kinematic
interactions in V1 skating at high speeds. Med Sci Sports Exerc, 47, 1232-42.
Stöggl T. & Holmberg H. C. 2016. Double-poling biomechanics of elite cross-country
skiers: Flat versus uphill terrain. Med Sci Sports Exerc.
Stöggl T., Kampel W., Müller E. & Lindinger S. 2010. Double-push skating versus V2
and V1 skating on uphill terrain in cross-country skiing. Med Sci Sports Exerc,
42, 187-96.
Stöggl T., Lindinger S. & Müller E. 2006. Reliability and validity of test concepts for
the cross-country skiing sprint. Med Sci Sports Exerc, 38, 586-91.

73
Stöggl T., Lindinger S. & Müller E. 2007. Analysis of a simulated sprint competition
in classical cross country skiing. Scand J Med Sci Sports, 17, 362-72.
Stöggl T., Müller E., Ainegren M. & Holmberg H. C. 2011. General strength and
kinetics: fundamental to sprinting faster in cross country skiing? Scand J Med
Sci Sports, 21, 791-03.
Stöggl T., Müller E. & Lindinger S. 2008. Biomechanical comparison of the double-
push technique and the conventional skate skiing technique in cross-
country sprint skiing. J Sports Sci, 26, 1225-33.
Stöggl T. & Stöggl R. 2013. Cross-country skiing in the 21st century - altered
demands and consequences for training in children and youths. In: A.
Hakkarainen, V. Linnamo & Lindinger, S. (eds.) Science and Nordic Skiing II.
Proceedings of the 2nd International Congress on Science and Nordic Skiing
(ICSNS) Finland.
Stöggl T. L. & Müller E. 2009. Kinematic determinants and physiological response of
cross-country skiing at maximal speed. Med Sci Sports Exerc, 41, 1476-87.
Stone M. R., Thomas K., Wilkinson M., St Clair Gibson A. & Thompson K. G. 2011.
Consistency of perceptual and metabolic responses to a laboratory-based
simulated 4,000-m cycling time trial. Eur J Appl Physiol, 111, 1807-13.
Strømme S. B., Ingjer F. & Meen H. D. 1977. Assessment of maximal aerobic power
in specifically trained athletes. J Appl Physiol Respir Environ Exerc Physiol, 42,
833-7.
Sundström D., Carlsson P., Ståhl F. & Tinnsten M. 2013. Numerical optimization of
pacing strategy in cross-country skiing. Struct Multidiscip O, 47, 943-50.
Swain D. P. 1997. A model for optimizing cycling performance by varying power on
hills and in wind. Med Sci Sports Exerc, 29, 1104-8.
Takac F., Hilker C., Kotthoff H. & B. R. 2005. Combining measurements from
multiple global navigation satellite systems for RTK applications.
International Symposium on GPS/GNSS. Hong Kong.
Terrier P., Ladetto Q., Merminod B. & Schutz Y. 2000. High-precision satellite
positioning system as a new tool to study the biomechanics of human
locomotion. J Biomech, 33, 1717-22.
Terrier P. & Schutz Y. 2003. Variability of gait patterns during unconstrained
walking assessed by satellite positioning (GPS). Eur J Appl Physiol, 90, 554-
61.
Terrier P., Turner V. & Schutz Y. 2005. GPS analysis of human locomotion: further
evidence for long-range correlations in stride-to-stride fluctuations of gait
parameters. Hum Mov Sci, 24, 97-15.
Thorstensson A. & Roberthson H. 1987. Adaptations to changing speed in human
locomotion: speed of transition between walking and running. Acta Physiol
Scand, 131, 211-4.
Tomazini F., Pasqua L. A., Damasceno M. V., Silva-Cavalcante M. D., de Oliveira F.
R., Lima-Silva A. E. & Bertuzzi R. 2015. Head-to-head running race

74
simulation alters pacing strategy, performance, and mood state. Physiol
Behav, 149, 39-44.
Tucker R., Lambert M. I. & Noakes T. D. 2006. An analysis of pacing strategies
during men's world-record performances in track athletics. Int J Sports
Physiol Perform, 1, 233-45.
Tucker R. & Noakes T. D. 2009. The physiological regulation of pacing strategy
during exercise: a critical review. Br J Sports Med, 43, 1-9.
Ulmer H. V. 1996. Concept of an extracellular regulation of muscular metabolic rate
during heavy exercise in humans by psychophysiological feedback.
Experientia, 52, 416-20.
Vähäsöyrinki P., Komi P. V., Seppala S., Ishikawa M., Kolehmainen V., Salmi J. A. &
Linnamo V. 2008. Effect of skiing speed on ski and pole forces in cross-
country skiing. Med Sci Sports Exerc, 40, 1111-6.
van Hall G., Jensen-Urstad M., Rosdahl H., Holmberg H. C., Saltin B. & Calbet J. A.
2003. Leg and arm lactate and substrate kinetics during exercise. Am J Physiol
Endocrinol Metab, 284, E193-05.
van Ingen Schenau G. J. & Cavanagh P. R. 1990. Power equations in endurance
sports. J Biomech, 23, 865-81.
Vandewalle H., Peres G. & Monod H. 1987. Standard anaerobic exercise tests. Sports
Med, 4, 268-89.
Wagner P. D. 1991. Central and peripheral aspects of oxygen transport and
adaptations with exercise. Sports Med, 11, 133-42.
Wagner P. D. 1996. Determinants of maximal oxygen transport and utilization. Annu
Rev Physiol, 58, 21-50.
Wagner P. D. 2000. New ideas on limitations to VO2max. Exerc Sport Sci Rev, 28, 10-14.
Weir J. B. 1949. New methods for calculating metabolic rate with special reference to
protein metabolism. J Physiol, 109, 1-9.
Welde B., Evertsen F., von Heimburg E. & Medbø J. I. 2003. Energy cost of free
technique and classical cross-country skiing at racing speeds. Med Sci Sports
Exerc, 35, 818-25.
Weston A. R., Mbambo Z. & Myburgh K. H. 2000. Running economy of African and
Caucasian distance runners. Med Sci Sports Exerc, 32, 1130-4.
Weyand P. G., Sternlight D. B., Bellizzi M. J. & Wright S. 2000. Faster top running
speeds are achieved with greater ground forces not more rapid leg
movements. J Appl Physiol 89, 1991-9.
Zory R., Barberis M., Rouard A. & Schena F. 2005. Kinematics of sprint cross-country
skiing. Acta Bioeng Biomech, 7, 87-96.