physiological and morphological characterization of …physiological and morphological...
TRANSCRIPT
Physiological and morphological characterization of two
Bacillus strains
Emil Ruff
Abstract
Organisms of the genus Bacillus have been described more than 100 years ago and
cultivated, engineered and used as a model system in microbiology for many decades.
Despite their ubiquitous and successful use in wide areas of research and industry
little was known about some of the most basic rules concerning their cell development
and cell differentiation as well as biofilm and colony formation. This project describes
the behaviour of two strains of Bacillus under different growth conditions. The
responses of the strains toward certain conditions turned out to be very different,
which might be linked to their function or survival strategy within the natural
environment. One strain seemed to follow the r- another the K-strategy. Furthermore,
it was observed that cell motility within a colony can vary significantly depending on
nutrient availability and is likely triggered at certain developmental stages of the
colony.
Introduction
Strains of the genus Bacillus have been isolated for over 150 years, with the first
scientific description dating back to 18721. They are aerobic endospore forming
bacteria belonging to the Firmicutes that live mostly in soil, but also occur in animal
guts and other environments2. Bacillus species are also known to be human
pathogens, which is part of the reason why they are not only well studied and
understood, but also used as a widespread model system in microbiology, e.g for cell
development and spore formation3. However, it was not until recently that cell
development and arrangement within Bacillus colonies and biofilms has been
elucidated4. Over the last ten years many exciting findings concerning cell
development5 and biofilm formation6 have been discovered, but comparatively little
research has been done connecting those cell capabilities to ecosystem function and
microbial ecology. This project was aimed at describing cell physiology and colony
morphology in relation to different nutrient and agar conditions. Observing responses
of the organisms toward these conditions might reveal some information about their
metabolic capabilities or life styles.
Materials and Methods
Sampling and isolation
2 g of soil from Bell Tower Field was suspended in 10 ml ultrapure water (18 M -
Milli-Q) by thorough vortexing and incubated at 80 °C for 10 min. 100 µl each of
four dilutions (10-1 – 10-4) of this suspension were plated on Nutrient agar plates
(Difco) and incubated at 30 °C over night (o.n.). 12 colonies were chosen according
to their colour and morphology, restreaked for isolation on Nutrient agar plates and
incubated at 30 °C o.n. This procedure was repeated to assure isolation of clonal
strains.
Cultivation media
Normal LB broth: 2.5% LB powder (Difco) in Milli-Q
(0.5% yeast extract, 1% NaCl, 1% peptone
from casein)
Low nutrient LB broth: 0.25 % LB powder (Difco) in Milli-Q
Cultivation plates
Nutrient agar plates: 0.5% sodium chloride (NaCl)
0.5% Peptone
0.3% yeast extract
1.5% agar (Difco)
Low agar/ high nutrient (LAHN) plates: 1% agar
2.5% LB powder (Difco)
Low agar/low nutrient (LALN) plates: 1% agar
0.25% LB powder
Low agar/double nutrient (LADN) plates: 1% agar
5% LB powder
High agar/low nutrient (HALN): 2.5% agar
0.25% LB powder
High agar/high nutrient (HAHN) 2.5% agar, 2.5% LB powder
Cell counts and growth rates
Cell numbers in 0.1 µl of liquid cultures were assessed using a Neubauer chamber and
then extrapolated to cells/ml. Depending on the cell density the cultures were diluted
before counting. Growth rates and doubling times of the liquid cultures were
calculated using the absorption of the culture as measured by a photometer at a
wavelength of 600 nm.
Microscopy
Colony and cell morphology, as well as size and motility, was observed and measured
via binoculars (Zeiss) and microscopy (Zeiss Discovery.V8 SteREO; Zeiss
Imager.A2; Zeiss C-LSM 700). The pictures and movies were acquired and processed
digitally using the implemented software AxioVision.
Embedding, Cryo-Sectioning and Staining
Bacterial cultures were cut out of agar plates using a sterile scalpel, placed in a silicon
Cryo-mold and fixed in a 1 PBS solution containing 4% formaldehyde and 0.5%
glutaraldehyde for 1 h at RT. The fixative was removed with a pasteur pipette and the
cultures washed for 30 min in 1 PBS. After removing the PBS the cultures were
embedded in O.C.T. Tissue Tek (Sakura, CA, USA) and incubated for several hours.
Then the mold was shock frozen in liquid nitrogen, transferred to -80°C for several
hours and then stored at -20°C for at least another few hours. Embedded colonies
were sectioned with a cryo-microtome into 20 µm sections and placed onto polysine-
covered glass slides (Thermo Fisher Scientific Inc., Schwerte, Germany). Slides were
stored at -20°C until used.
Slides were stained with Alcian Blue solution (2.5% Alcian Blue powder in
3% actic acid). The solution was dropped onto the sections, incubated for 30 min at
RT and rinsed carefully twice with 1 PBS and Milli-Q. The slides were air dried,
embedded in mouting medium (Citifluor:Vetashield, 4:1), that contained 1µg/ml
DAPI and stored at -20°C until used.
Microsensor
Measuring oxygen consumption by the liquid cultures was carried out using a
Microsensor system (Unisense) and the software MicOx. Measurements in mV were
converted to µmol/l by the software and the data processed with Xcel (Microsoft).
Data Analysis
The pictures taken by the microscope were processed with iPhoto (v6.0.6; Apple
Computer, Inc.) and the movies animated with ImageJ (v1.38x;
www.rsb.info.nih.gov/ij). Statistical analysis of the data was carried out using R
(v2.7.0; The R Foundation for Statistical Computing)
3. Results and Discussion
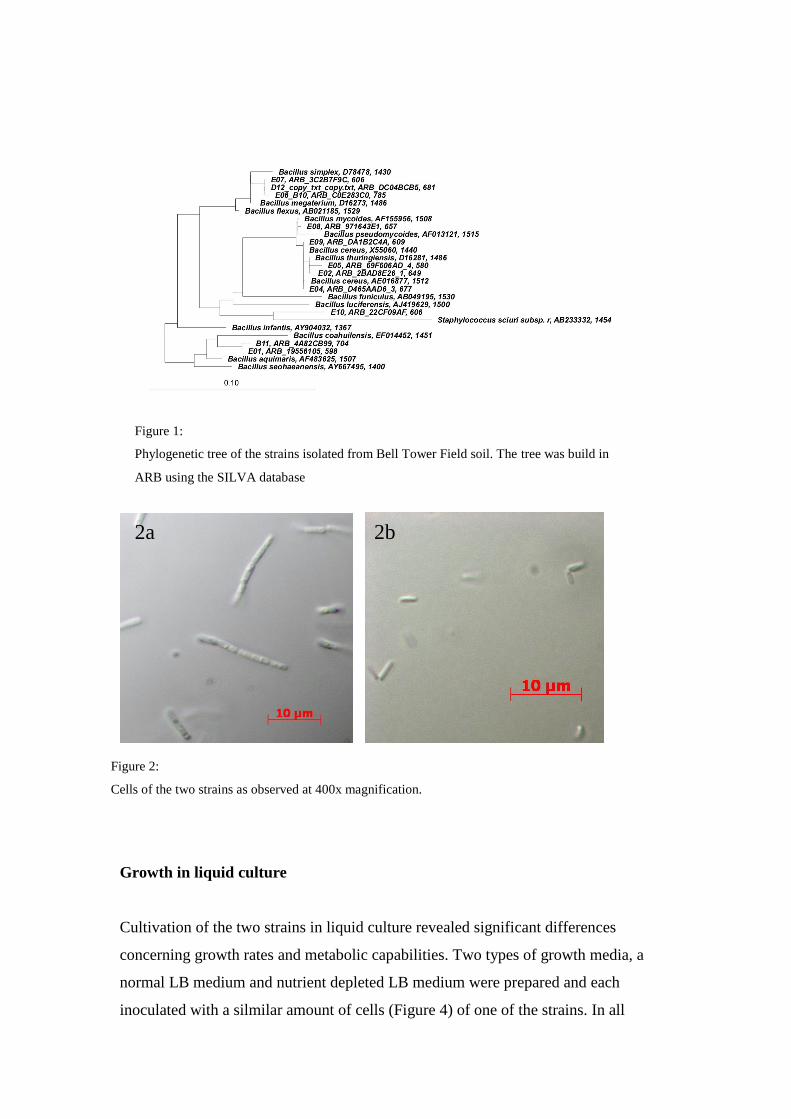
Isolation and identification of different Bacillus strains
Pasteurization of 2 g soil and subsequent cultivation of the viable spores it contained,
yielded 12 different colony morphotypes of aerobic spore forming bacteria. These
morphotypes were isolated and their 16S rRNA amplified and identified. All 12
isolates (ASF1-12 (B11, D12, E01-E10); see Suppl. CD) belonged to the genus
Bacillus (Figure 1). Two of these organisms were chosen for further characterization
based on their identity, cell and colony morphology. The first organism (isolate E05)
was closely related to Bacillus cereus (ASF6), the second one (isolate E10) was a
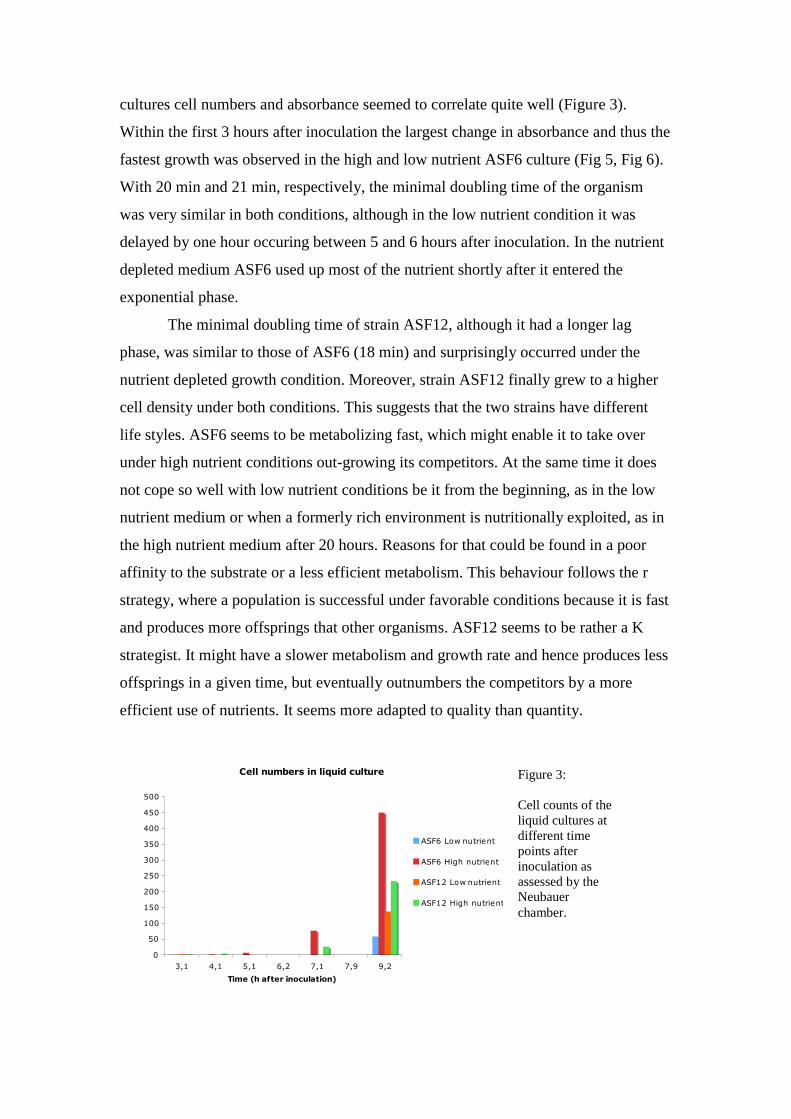
close relative of Bacillus pumilus (ASF12). Cells of ASF6 were around 10 µm long
and slightly motile (Figure 2a, Suppl. Movie 6_LAHN). Cells of ASF12 were around
2.5 µm long and highly motile (Figure 2b).
Growth in liquid culture
Cultivation of the two strains in liquid culture revealed significant differences
concerning growth rates and metabolic capabilities. Two types of growth media, a
normal LB medium and nutrient depleted LB medium were prepared and each
inoculated with a silmilar amount of cells (Figure 4) of one of the strains. In all
Figure 1:
Phylogenetic tree of the strains isolated from Bell Tower Field soil. The tree was build in
ARB using the SILVA database
Figure 2:
Cells of the two strains as observed at 400x magnification.
2a 2b
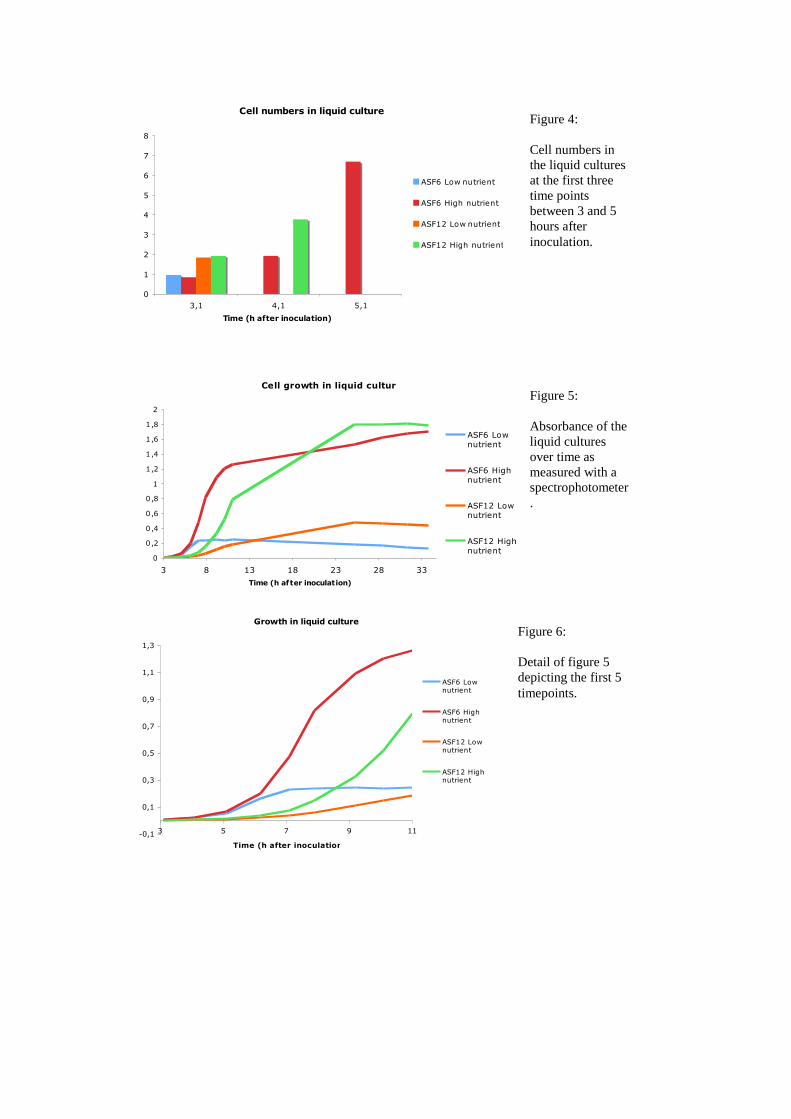
cultures cell numbers and absorbance seemed to correlate quite well (Figure 3).
Within the first 3 hours after inoculation the largest change in absorbance and thus the
fastest growth was observed in the high and low nutrient ASF6 culture (Fig 5, Fig 6).
With 20 min and 21 min, respectively, the minimal doubling time of the organism
was very similar in both conditions, although in the low nutrient condition it was
delayed by one hour occuring between 5 and 6 hours after inoculation. In the nutrient
depleted medium ASF6 used up most of the nutrient shortly after it entered the
exponential phase.
The minimal doubling time of strain ASF12, although it had a longer lag
phase, was similar to those of ASF6 (18 min) and surprisingly occurred under the
nutrient depleted growth condition. Moreover, strain ASF12 finally grew to a higher
cell density under both conditions. This suggests that the two strains have different
life styles. ASF6 seems to be metabolizing fast, which might enable it to take over
under high nutrient conditions out-growing its competitors. At the same time it does
not cope so well with low nutrient conditions be it from the beginning, as in the low
nutrient medium or when a formerly rich environment is nutritionally exploited, as in
the high nutrient medium after 20 hours. Reasons for that could be found in a poor
affinity to the substrate or a less efficient metabolism. This behaviour follows the r
strategy, where a population is successful under favorable conditions because it is fast
and produces more offsprings that other organisms. ASF12 seems to be rather a K
strategist. It might have a slower metabolism and growth rate and hence produces less
offsprings in a given time, but eventually outnumbers the competitors by a more
efficient use of nutrients. It seems more adapted to quality than quantity.
Cell numbers in liquid culture
0
50
100
150
200
250
300
350
400
450
500
3,1 4,1 5,1 6,2 7,1 7,9 9,2
Time (h after inoculation)
Ce
lls (
x 1
0^
6 p
er m
l)
ASF6 Low nutrient
ASF6 High nutrient
ASF12 Low nutrient
ASF12 High nutrient
Figure 3:
Cell counts of the
liquid cultures at
different time
points after
inoculation as
assessed by the
Neubauer
chamber.
Cell numbers in liquid culture
0
1
2
3
4
5
6
7
8
3,1 4,1 5,1
Time (h after inoculation)
Ce
lls (
x 1
0^
6 p
er m
l)
ASF6 Low nutrient
ASF6 High nutrient
ASF12 Low nutrient
ASF12 High nutrient
Cell growth in liquid culture
0
0,2
0,4
0,6
0,8
1
1,2
1,4
1,6
1,8
2
3 8 13 18 23 28 33
Time (h after inoculation)
Absorban
ce (
at
60
0 n
m) ASF6 Low
nutrient
ASF6 Highnutrient
ASF12 Lownutrient
ASF12 Highnutrient
Growth in liquid culture
-0,1
0,1
0,3
0,5
0,7
0,9
1,1
1,3
3 5 7 9 11
Time (h after inoculation)
Ab
sorb
an
ce (
at
60
0 n
m)
ASF6 Lownutrient
ASF6 Highnutrient
ASF12 Lownutrient
ASF12 Highnutrient
Figure 5:
Absorbance of the
liquid cultures
over time as
measured with a
spectrophotometer
.
Figure 6:
Detail of figure 5
depicting the first 5
timepoints.
Figure 4:
Cell numbers in
the liquid cultures
at the first three
time points
between 3 and 5
hours after
inoculation.
Growth on hard substrate
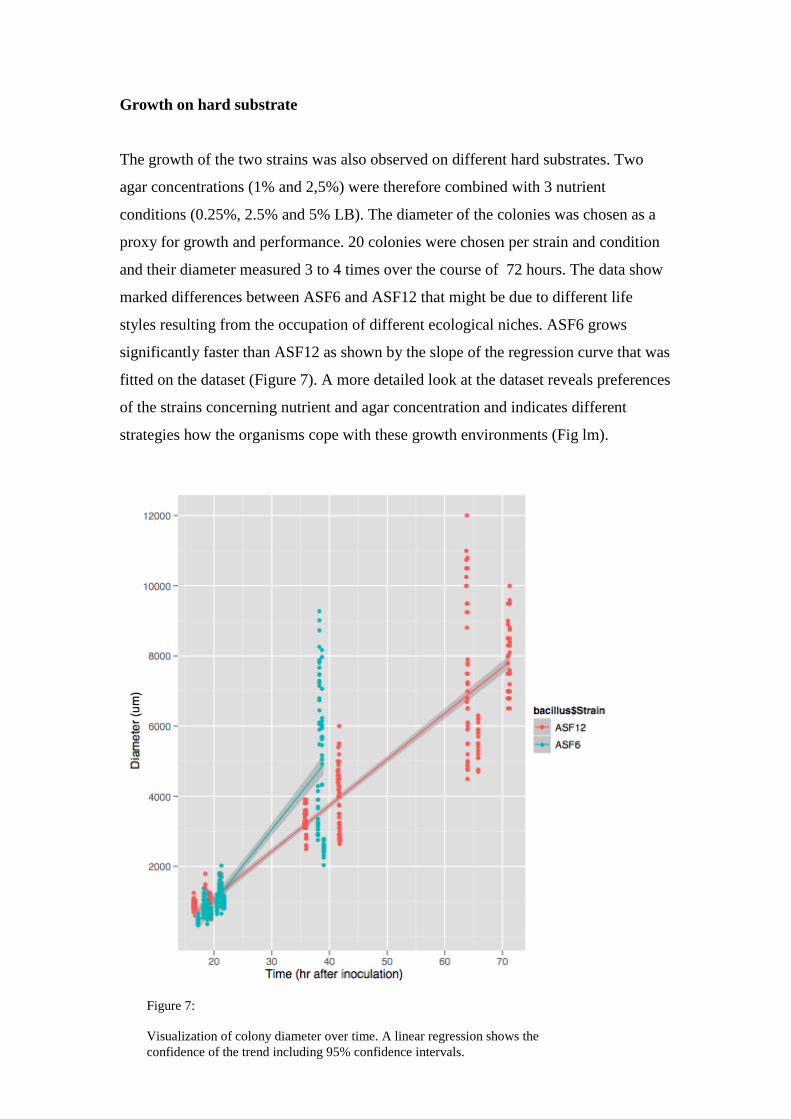
The growth of the two strains was also observed on different hard substrates. Two
agar concentrations (1% and 2,5%) were therefore combined with 3 nutrient
conditions (0.25%, 2.5% and 5% LB). The diameter of the colonies was chosen as a
proxy for growth and performance. 20 colonies were chosen per strain and condition
and their diameter measured 3 to 4 times over the course of 72 hours. The data show
marked differences between ASF6 and ASF12 that might be due to different life
styles resulting from the occupation of different ecological niches. ASF6 grows
significantly faster than ASF12 as shown by the slope of the regression curve that was
fitted on the dataset (Figure 7). A more detailed look at the dataset reveals preferences
of the strains concerning nutrient and agar concentration and indicates different
strategies how the organisms cope with these growth environments (Fig lm).
Figure 7:
Visualization of colony diameter over time. A linear regression shows the
confidence of the trend including 95% confidence intervals.
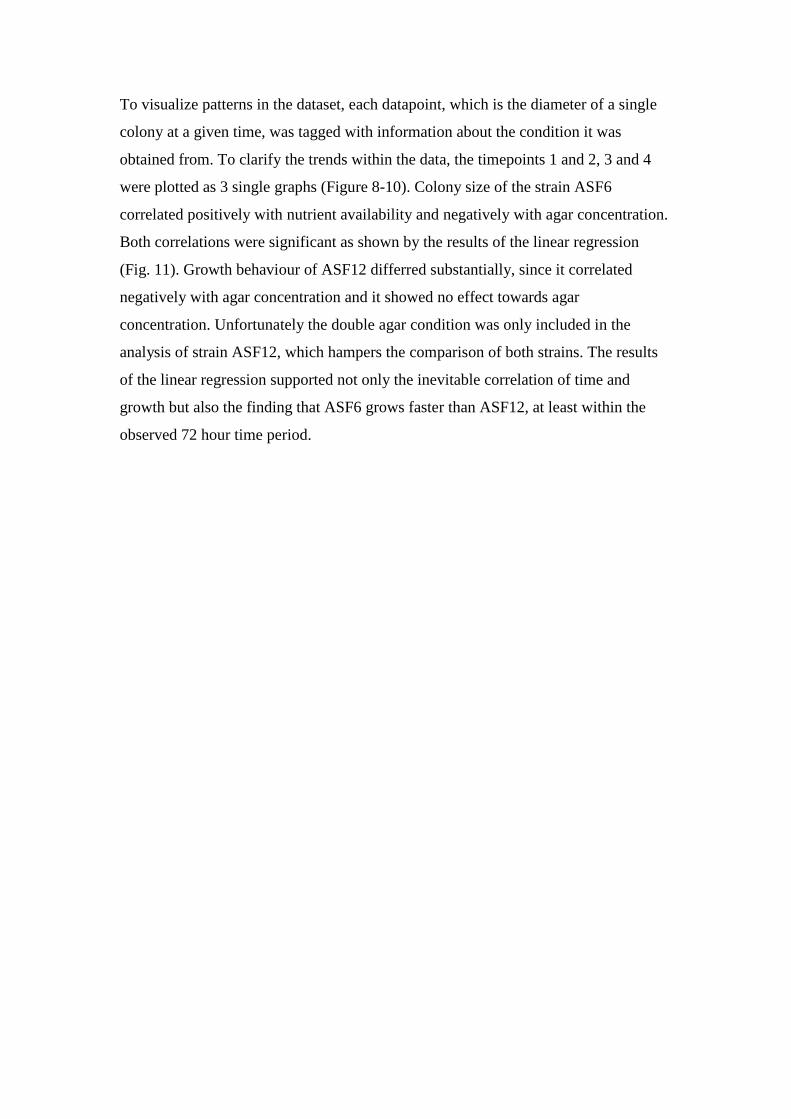
To visualize patterns in the dataset, each datapoint, which is the diameter of a single
colony at a given time, was tagged with information about the condition it was
obtained from. To clarify the trends within the data, the timepoints 1 and 2, 3 and 4
were plotted as 3 single graphs (Figure 8-10). Colony size of the strain ASF6
correlated positively with nutrient availability and negatively with agar concentration.
Both correlations were significant as shown by the results of the linear regression
(Fig. 11). Growth behaviour of ASF12 differred substantially, since it correlated
negatively with agar concentration and it showed no effect towards agar
concentration. Unfortunately the double agar condition was only included in the
analysis of strain ASF12, which hampers the comparison of both strains. The results
of the linear regression supported not only the inevitable correlation of time and
growth but also the finding that ASF6 grows faster than ASF12, at least within the
observed 72 hour time period.
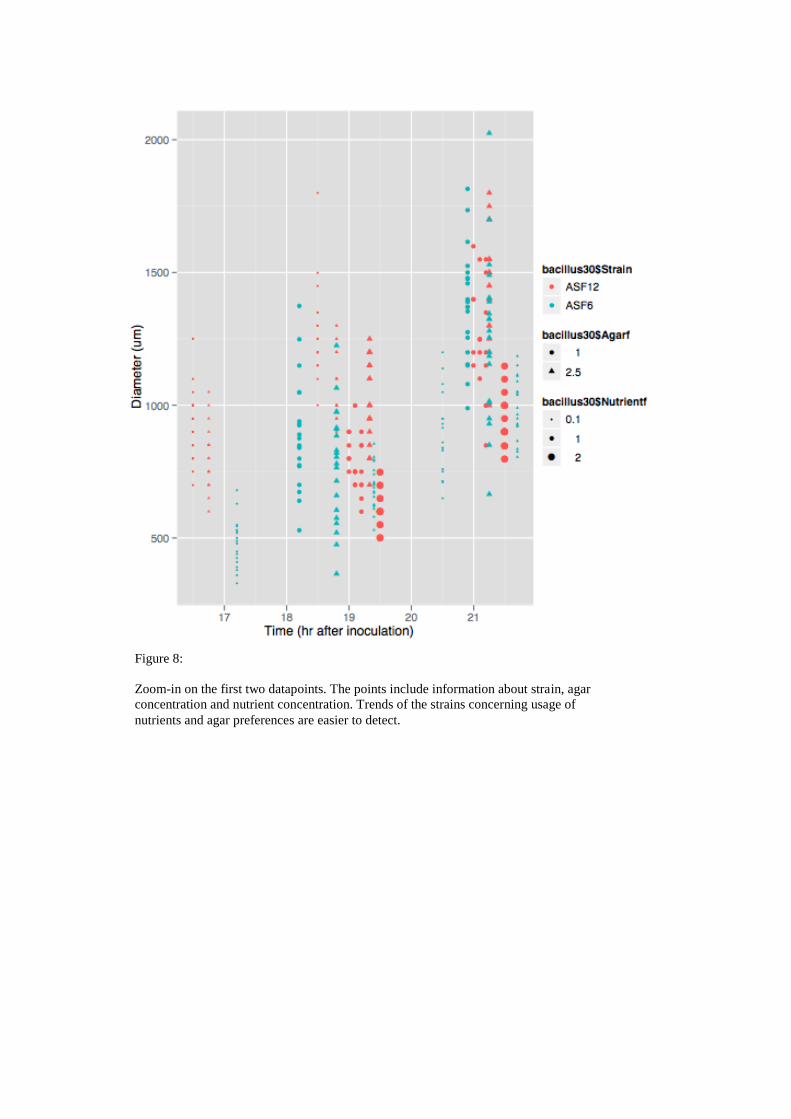
Figure 8:
Zoom-in on the first two datapoints. The points include information about strain, agar
concentration and nutrient concentration. Trends of the strains concerning usage of
nutrients and agar preferences are easier to detect.
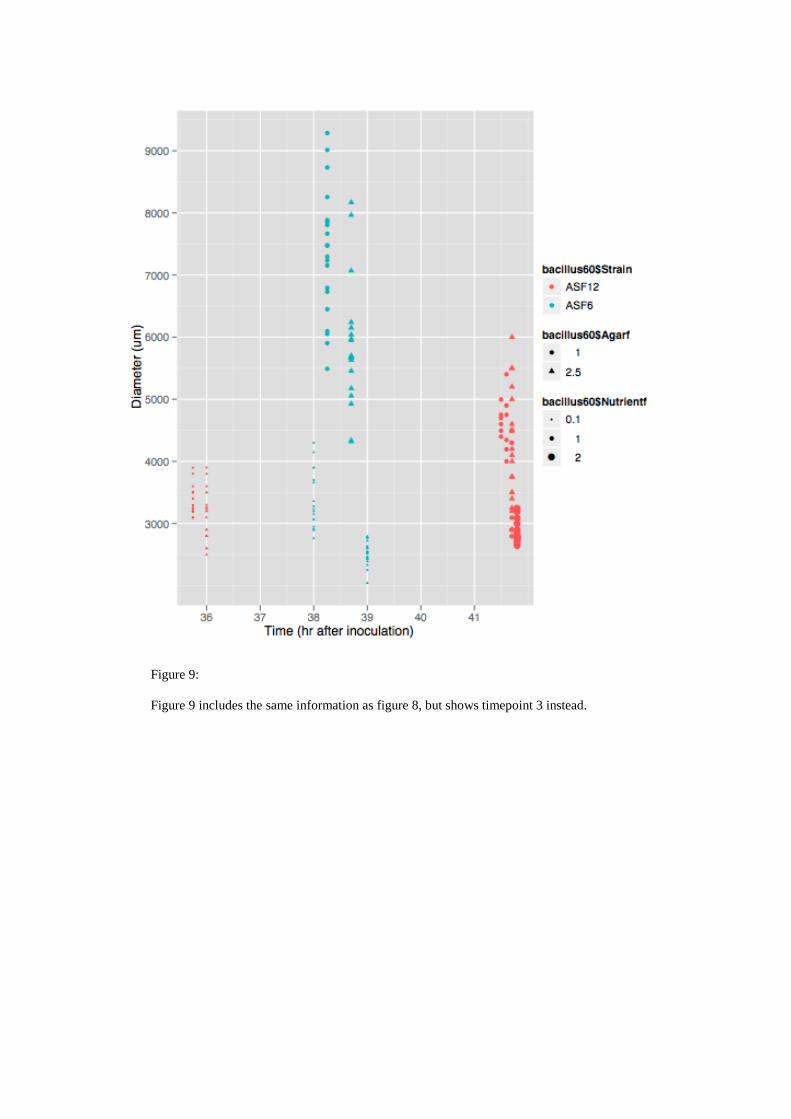
Figure 9:
Figure 9 includes the same information as figure 8, but shows timepoint 3 instead.
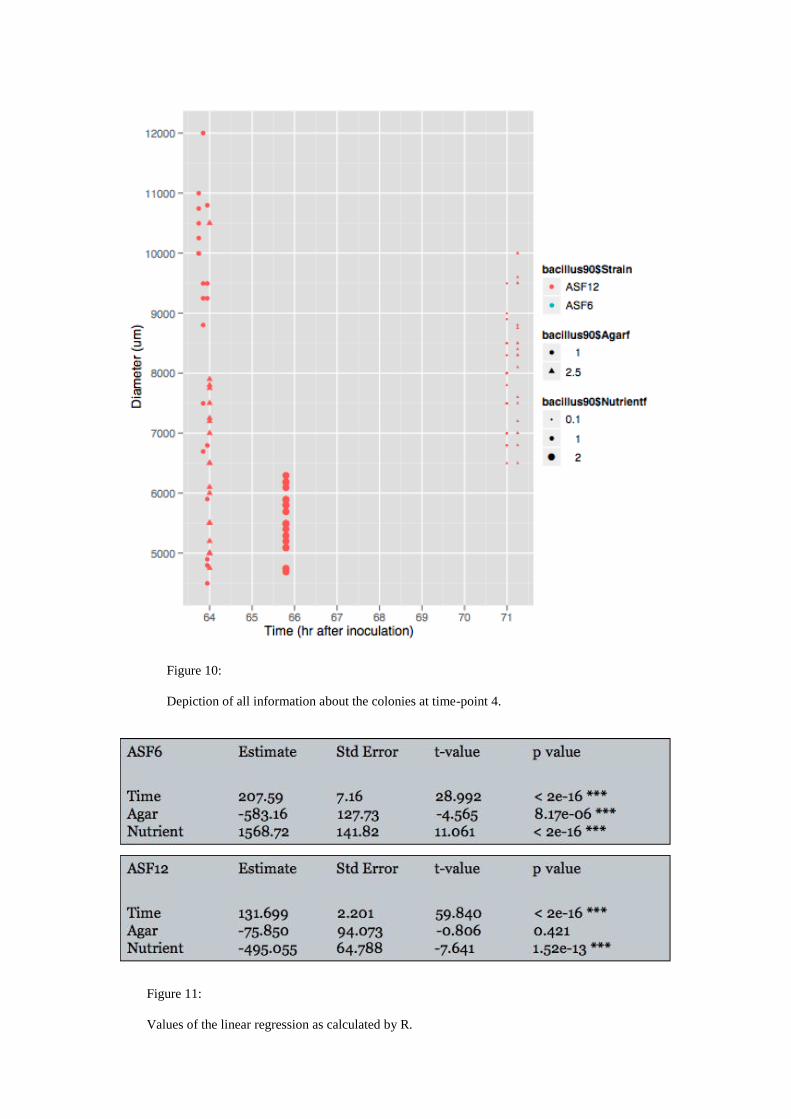
Figure 10:
Depiction of all information about the colonies at time-point 4.
Figure 11:
Values of the linear regression as calculated by R.
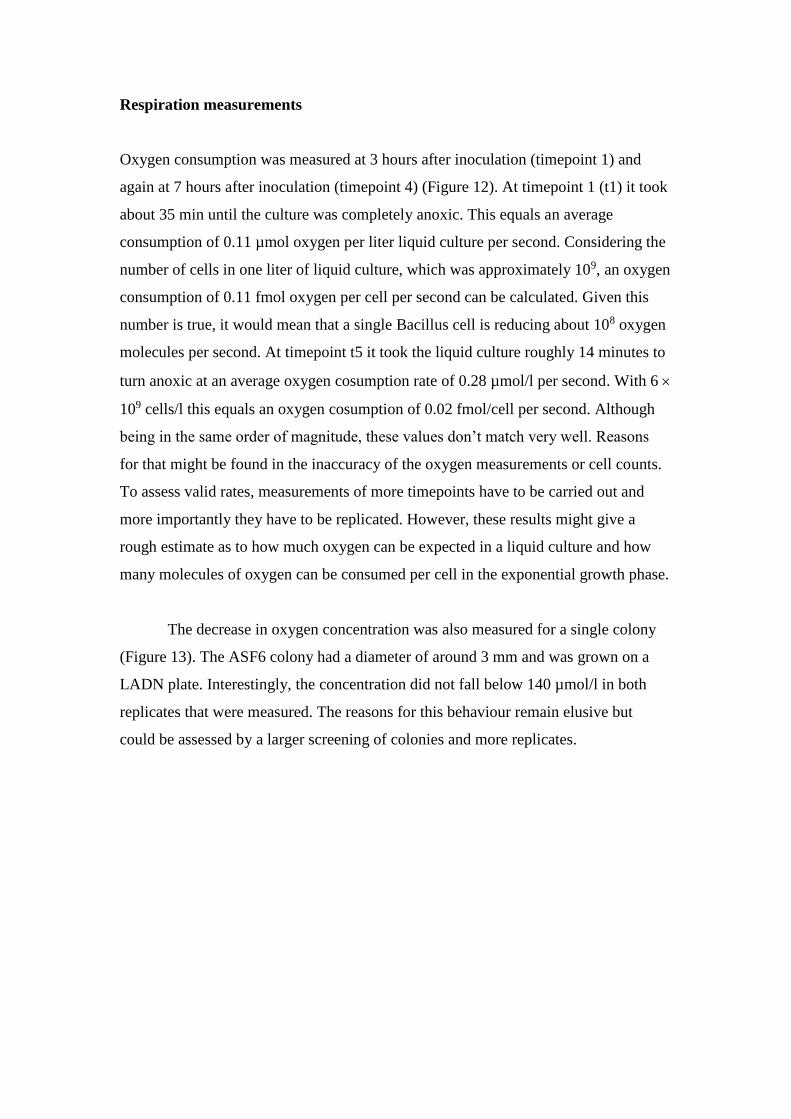
Respiration measurements
Oxygen consumption was measured at 3 hours after inoculation (timepoint 1) and
again at 7 hours after inoculation (timepoint 4) (Figure 12). At timepoint 1 (t1) it took
about 35 min until the culture was completely anoxic. This equals an average
consumption of 0.11 µmol oxygen per liter liquid culture per second. Considering the
number of cells in one liter of liquid culture, which was approximately 109, an oxygen
consumption of 0.11 fmol oxygen per cell per second can be calculated. Given this
number is true, it would mean that a single Bacillus cell is reducing about 108 oxygen
molecules per second. At timepoint t5 it took the liquid culture roughly 14 minutes to
turn anoxic at an average oxygen cosumption rate of 0.28 µmol/l per second. With 6
109 cells/l this equals an oxygen cosumption of 0.02 fmol/cell per second. Although
being in the same order of magnitude, these values don’t match very well. Reasons
for that might be found in the inaccuracy of the oxygen measurements or cell counts.
To assess valid rates, measurements of more timepoints have to be carried out and
more importantly they have to be replicated. However, these results might give a
rough estimate as to how much oxygen can be expected in a liquid culture and how
many molecules of oxygen can be consumed per cell in the exponential growth phase.
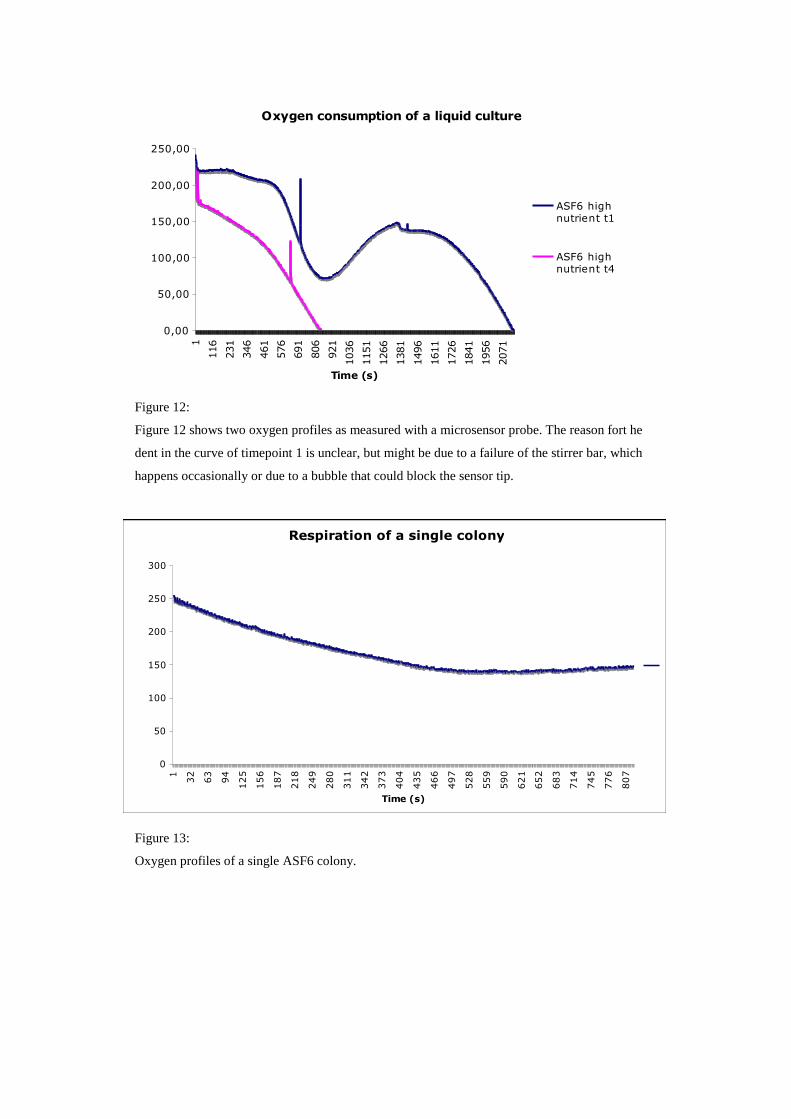
The decrease in oxygen concentration was also measured for a single colony
(Figure 13). The ASF6 colony had a diameter of around 3 mm and was grown on a
LADN plate. Interestingly, the concentration did not fall below 140 µmol/l in both
replicates that were measured. The reasons for this behaviour remain elusive but
could be assessed by a larger screening of colonies and more replicates.
Oxygen consumption of a liquid culture
0,00
50,00
100,00
150,00
200,00
250,00
1
116
231
346
461
576
691
806
921
1036
1151
1266
1381
1496
1611
1726
1841
1956
2071
Time (s)
Ox
yg
en
co
nce
ntr
atio
n (
µm
ol/
l)
ASF6 highnutrient t1
ASF6 highnutrient t4
Respiration of a single colony
0
50
100
150
200
250
300
1
32
63
94
125
156
187
218
249
280
311
342
373
404
435
466
497
528
559
590
621
652
683
714
745
776
807
Time (s)
Oxygen
(µ
mol/
l)
Figure 12:
Figure 12 shows two oxygen profiles as measured with a microsensor probe. The reason fort he
dent in the curve of timepoint 1 is unclear, but might be due to a failure of the stirrer bar, which
happens occasionally or due to a bubble that could block the sensor tip.
Figure 13:
Oxygen profiles of a single ASF6 colony.
Observation of the structure and growth of Bacillus colonies using microscopy
The quasi crystalline structure of cells within colonies grown at different conditions
was observed using cell dyes and confocal laser scanning microscopy. Unfortunately
the embedding of colonies, the cryo-sectioning and subsequent staining with Alcian
Blue and DAPI did not yield satisfying results. Although, the structure of the colony
and the arrangement of cells was visible, good pictures could not be obtained.
However, it seemed like there are two major types of structure, a crystalline type,
where the rods a lined up more or less straight and an amorphous type, where bundles
of rods were arranged in loops, waves and knots.
Colonies of both strains at different growth conditions and timepoints revealed
very different morphologies and behaviour when they were observed over longer
periods of time. To visualize cell movement at the edges the colonies were
illuminated with a bright field and phase contrast, movements within the colonies
were observed using a dark field. A picture was taken every 10 s for 20 min and then
animated to a movie. Colonies of ASF6 showed movement of cells and growth
mainly on the edges when they were grown on normal LB plates (Movie
6_LAHN.avi). On double nutrient plates (5% LB) the movement of cells was
restricted to the interior part of the colony, creating a circular flow that resembled
convection (Movie 6_LADN_20min_oxygen.avi). This observation indicates that
cells have different motilites and orientation within a colony depending on external
factors such as nutrient concentration. Hence, this finding supports our recently
established understanding of heterogeneity and cell differentiation within clonal cell
colonies5. To see whether or not oxygen availability could be a reason to create a
current within the colony, which would ensure a constant mixing of air, the colonies
were incubated in a mixture of N2/CO2 (4:1). No response was observed within 30
min (Movie 6_LADN_20min_N2/CO2.avi), which could be either because the
organism needs a longer response time or because the current was not established to
mixing of oxygen, but rather of nutrients or else.
Other interesting motions and wavelike movements were observed in some colonies
at certain growth stages. The four movies (12_LAHN_movie1-4) depicting these
motions are from the same spot recorded in a bright and dark field. Notably they are
not time-lapsed but in real time, which shows that colonies can be very dynamic
systems.
Conclusion and Outlook
This work has tapped into a great diversity of behaviour, carried out by the two strains
ASF6 and ASF12 in response to changes in environmental conditions. It revealed the
organisms strategies to make a living on the plates, which could be a good
approximation of their life styles in the environment. ASF6 seems to follow the r
strategy of success through quantity, whereas ASF12 seems to be rather a K strategist.
Cells and colonies grow and act differently under different conditions concerning cell
size and motility among others. Cell differentiation and heterogeneity, hence, could to
be a much more relevant and ubiquitous trait of microorganisms thriving everywhere
out there.
To follow up on these experiments and confirm some of the preliminary
findings it is necessary to create larger and thus more stable datasets. More replicates
of the tested conditions need to be included and more strains tested. The protocols for
embedding, staining as well as measuring respiration rates have to be optimized not
only for a culture approach but also for assessment and observations of single cells.
The dawning era of single cell methods will greatly improve our understanding of
individual cells and their interactions with each other and their environment.
Acknowledgements
References
1. Cohn, F.: „Untersuchungen über Bakterien.“ Beitraege zur Biologie der Pflanzen
Heft (1872); 127-224.
2. Madigan, M. et al. (ed.): Brock: Biology of Micoorganisms (13th edition, 2011)
3. Errington, J. (2003): „Regulation of endospore formation in Bacillus subtilis“ Nat
Rev Microbiol 1, 117-126.
4. Branda, S. (2001): „Fruiting body formation by Bacillus subtilis.“ PNAS 98,
11621-11626.
5. López, D.; Kolter, R. (2009): „Extracellular signals that define distinct and
coexisting cell fates in Bacillus subtilis.“ FEMS Microbiol Rev 34, 134-149.
6. Chai, Y. et al. (2007): „Biostability and biofilm formation in Bacillus subtilis.“ Mol
Microbiol 67 254-263.

7. Ludwig, W.; et al. (2004): “ARB: a software environment for sequence data.“ Nucl
Acid Res 32, 1363-1371.
8. Pruesse, E., et al. (2007): “SILVA: a comprehensive online resource for quality
checked and aligned ribosomal RNA sequence data compatible with ARB.” Nucl
Acid Res 35 7188-7196.