pi global portfolios annual report · 2 days ago · statements of total return fs1 statements of...
TRANSCRIPT

Pi Global Portfolios
Annual Report Year ended 31 March 2018

Contents Page Directory 1 Manager's Investment Reports 2 Report to Unitholders 4 Report of the Trustee 10 Statement by the Manager 11 Independent Auditor's Report 12 Statements of Total Return FS1 Statements of Financial Position FS2 Statements of Movements in Unitholders' Funds FS3 Statements of Portfolio FS4 Notes to the Financial Statements FS10 Important Information FS20

1
Pi Global Portfolios
MANAGER
Phillip Capital Management (S) Ltd
250 North Bridge Road
#06-00 Raffles City Tower
Singapore 179101
(Company Registration No. 199905233W)
DIRECTORS OF THE MANAGER
Lim Hua Min
Jeffrey Lee Chay Khiong
Linus Lim Wen Sheong
Lee Ken Hoon
Lim Wah Sai
Louis Wong Wai Kit
TRUSTEE & REGISTRAR
BNP Paribas Trust Services Singapore Limited
20 Collyer Quay, #01-01
Singapore 049319
(Company Registration No. 200800851W)
CUSTODIAN AND FUND ADMINISTRATOR
BNP Paribas Securities Services Singapore Branch
20 Collyer Quay, #01-01
Singapore 049319
(Company Registration No. T08FC7287D)
AUDITORS
KPMG LLP
16 Raffles Quay #22-00
Hong Leong Building
Singapore 048581
SOLICITORS TO THE MANAGER
Chan & Goh LLP
50 Craig Road, #03-01
Singapore 089688
SOLICITORS TO THE TRUSTEE
Dentons Rodyk & Davidson LLP
80 Raffles Place
#33-00 UOB Plaza 1
Singapore 048624

Pi Global Portfolios
2
MANAGER'S INVESTMENT REPORTS Pi-5 Global Portfolio The Fund rose by 2.6% for the full year ending 31 March 2018, including distributions paid. The Fund paid out distributions totaling 1.1 Singapore cents per unit within the full year.
2017 saw a continuation of the strength across equity markets. Data from various key economies, such as the US and China but also including big exporters such as Japan and Germany, pointed to rebounding global demand and a broad-based economic recovery. The US Federal Reserve resumed its rate hike cycle, with three quarter-point hikes within 2017. Despite fears of market correction, markets were well-supported, which suggested that such rate hikes had been well-signalled and markets were therefore well-prepared already. Over this period, equity markets posted broad-based returns, led by emerging markets, with developed markets less strong. The start of 2018 saw a similar positive tone, but February saw a dramatic shift in narrative with concerns raised about rising inflation which might necessitate a more aggressive rate tightening by various countries, in particular the US Federal Reserve. The worries in the global equity markets then shifted to trade tensions, with the US firing the first salvo through unilateral declaration of tariffs on various imported products. Given that the globalisation theme of the past few decades was at risk of unravelling if a trade war breaks out, global equity markets saw an extension of the weakness. Going forward, the US Federal Reserve is now in a steady rate hike cycle, and investors have been plagued by numerous concerns in recent months -- in addition to rising yields and looming trade wars, we now add fund outflows and dramatically weakening currencies in certain emerging markets (Argentina, Turkey) to the mix. To some extent, investor fatigue might have set in given the market volatility. What this also means, however, is that current market valuations are significantly more attractive than several months back. The key long-term risk, we believe, is that of a full-scale trade war developing. Another risk is that the US Federal Reserve hikes rates too aggressively. We are hopeful that these risks do not materialise. A focus on the long term is paramount for the sufficiently diversified investor, and this is what we set out to do in this multi-asset portfolio. With regard to our positioning for the Fund, on the equities front, we are focused on having a bigger allocation to developed market equities for the Fund, with a big majority in US equities and a minority in Europe and Japan. Our belief is that this allocation lends stability to the portfolio, given that emerging market equities are susceptible to foreign fund flows which can be volatile. For bonds, we continue to like high-quality bond exposures as a cushion for the overall portfolio.

Pi Global Portfolios
3
MANAGER'S INVESTMENT REPORTS Pi-7 Global Portfolio The Fund rose by 5.4% for the full year ending 31 March 2018.
2017 saw a continuation of the strength across equity markets. Data from various key economies, such as the US and China but also including big exporters such as Japan and Germany, pointed to rebounding global demand and a broad-based economic recovery. The US Federal Reserve resumed its rate hike cycle, with three quarter-point hikes within 2017. Despite fears of market correction, markets were well-supported, which suggested that such rate hikes had been well-signalled and markets were therefore well-prepared already. Over this period, equity markets posted broad-based returns, led by emerging markets, with developed markets less strong. The start of 2018 saw a similar positive tone, but February saw a dramatic shift in narrative with concerns raised about rising inflation which might necessitate a more aggressive rate tightening by various countries, in particular the US Federal Reserve. The worries in the global equity markets then shifted to trade tensions, with the US firing the first salvo through unilateral declaration of tariffs on various imported products. Given that the globalisation theme of the past few decades was at risk of unravelling if a trade war breaks out, global equity markets saw an extension of the weakness. Going forward, the US Federal Reserve is now in a steady rate hike cycle, and investors have been plagued by numerous concerns in recent months -- in addition to rising yields and looming trade wars, we now add fund outflows and dramatically weakening currencies in certain emerging markets (Argentina, Turkey) to the mix. To some extent, investor fatigue might have set in given the market volatility. What this also means, however, is that current market valuations are significantly more attractive than several months back. The key long-term risk, we believe, is that of a full-scale trade war developing. Another risk is that the US Federal Reserve hikes rates too aggressively. We are hopeful that these risks do not materialise. A focus on the long term is paramount for the sufficiently diversified investor, and this is what we set out to do in this multi-asset portfolio.
With regard to our positioning for the Fund, on the equities front, we have a balanced allocation to developed market equities and emerging market equities for the Fund. Our belief is that this allocation lends stability to the portfolio. Emerging market equities are expected to have higher long-term potential growth but are susceptible to foreign fund flows which can be volatile. For bonds, we continue to like high-quality bond exposures as a cushion for the overall portfolio.

Pi Global Portfolios Report To Unitholders Year ended 31 March 2018
4
The following contains additional information relating to the Fund. 1. Distribution of investments
Please refer to the Statements of Portfolio on pages FS4 to FS9. 2. Schedule of investments by asset class
Pi-5 Global Portfolio
Asset Class
Fair value as at 31 March 2018
S$
Percentage of total net assets attributable to
unitholders as at 31 March 2018
% Exchange traded funds 20,137,797 73.61 Unit Trusts 7,195,095 26.30 Cash and cash equivalents 661,400 2.42 Other net current liabilities (636,310) (2.33)
27,357,982 100.00
Pi-7 Global Portfolio
Asset Class
Fair value as at 31 March 2018
S$
Percentage of total net assets attributable to
unitholders as at 31 March 2018
% Exchange traded funds 18,680,845 81.01 Unit Trusts 3,301,210 14.32 Cash and cash equivalents 2,122,605 9.20 Other net current liabilities (1,044,939) (4.53)
23,059,721 100.00

Pi Global Portfolios Report To Unitholders Year ended 31 March 2018
5
3. Top 10 holdings
Pi-5 Global Portfolio 10 largest holdings at 31 March 2018
Fair value as at 31 March 2018
S$
Percentage of total net assets attributable to
unitholders as at 31 March 2018
% IShares MSCI Emerging Market UCITS ETF USD DIST 2,434,292 8.90 Lion-Phillip S-REIT ETF 2,294,970 8.39 SPDR S&P 500 ETF Trust 2,011,747 7.35 Nikko AM Singapore STI ETF 1,931,904 7.06 IShares USD Corporation Bond UCITS ETF 1,883,984 6.89 United Asian Bond Fund 1,559,145 5.70 Nikko AM Shenton Short Term Bond Fund 1,479,400 5.41 LionGlobal Asia Bond Fund 1,323,578 4.84 Phillip SGX APAC Dividend Leaders REIT ETF 1,256,003 4.59 SPDR Straits Times Index ETF 1,233,085 4.51 10 largest holdings at 31 March 2017
Fair value as at 31 March 2017
S$
Percentage of total net assets attributable to
unitholders as at 31 March 2017
% IShares USD Corporation Bond UCITS ETF 2,340,059 7.23 United Asian Bond Fund 2,336,537 7.22 SPDR S&P 500 ETF Trust 2,246,905 6.94 IShares MSCI Emerging Market UCITS ETF USD DIST 2,122,035 6.55 Phillip Singapore Real Estate Income Fund 2,026,172 6.26 Phillip SGX APAC Dividend Leaders REIT ETF 1,988,310 6.14 Nikko AM Singapore STI ETF 1,783,296 5.51 Nikko AM Shenton Short Term Bond Fund 1,463,450 4.52 SPDR Straits Times Index ETF 1,456,873 4.50 LionGlobal Asia Bond Fund 1,455,309 4.49

Pi Global Portfolios Report To Unitholders Year ended 31 March 2018 3. Top 10 holdings
6
Pi-7 Global Portfolio 10 largest holdings at 31 March 2018
Fair value as at 31 March 2018
S$
Percentage of total net assets attributable to
unitholders as at 31 March 2018
% IShares MSCI Emerging Market UCITS ETF USD DIST 2,964,285 12.85 IShares MSCI Emerging Market UCITS ETF USD ACC 2,480,753 10.76 SPDR S&P 500 ETF Trust 1,962,403 8.51 Lion-Phillip S-REIT ETF 1,749,030 7.58 Nikko AM Singapore STI ETF 1,502,982 6.52 SPDR Dow Jones Industrial Average ETF Trust 1,033,527 4.48 Phillip SGX APAC Dividend Leaders REIT ETF 903,750 3.92 SPDR Straits Times Index ETF 890,428 3.86 Fullerton Asian Bond Fund 821,748 3.56 IShares 1-3 Year Treasury Bond ETF 750,524 3.25 10 largest holdings at 31 March 2017
Fair value as at 31 March 2017
S$
Percentage of total net assets attributable to
unitholders as at 31 March 2017
% IShares MSCI Emerging Market UCITS ETF USD DIST 2,280,626 9.12 SPDR S&P Dividend ETF 1,881,755 7.52 IShares MSCI Emerging Market UCITS ETF USD ACC 1,778,296 7.11 Phillip Singapore Real Estate Income Fund 1,545,092 6.18 SPDR S&P500 ETF Trust 1,537,985 6.15 Nikko AM Singapore STI ETF 1,391,650 5.56 Phillip SGX APAC Dividend Leaders REIT ETF 1,372,585 5.49 United Asian Bond Fund 1,280,144 5.12 IShares MSCI Pacific Ex Japan UCITS ETF USD DIST 1,163,252 4.65 SPDR Straits Times Index ETF 1,070,883 4.28

Pi Global Portfolios Report To Unitholders Year ended 31 March 2018
7
4. Exposure to derivatives as at 31 March 2018
i. Market value of financial derivative contracts and as a percentage of the scheme’s NAV as at 31 March 2018 Nil
ii. Net gains or losses on financial derivative contracts realised during the year ended 31 March 2018 Nil
iii. Net gains or losses on outstanding financial derivative contracts marked to market as at 31 March 2018 Nil
The global exposure relating to derivative instruments is calculated using the commitment approach.
5. Global exposure to financial derivatives
The global exposure to financial derivatives is computed using the commitment approach which is calculated as the sum of: a. the absolute value of the exposure of each individual financial derivative not involved in
netting or hedging arrangement; b. the absolute value of the net exposure of each individual financial derivative after netting
or hedging arrangements; and c. the sum of the values of cash collateral received pursuant to:
i. the reduction of exposure to counterparties of OTC financial derivatives; and
ii. EPM techniques relating to securities lending and repurchase transactions, and that are reinvested.
6. Collateral
Nil.
7. Securities lending or repurchase transactions Nil.
8. Amount and percentage of total fund size invested in other unit trusts, mutual funds and collective investment schemes as at 31 March 2018
Please refer to the Statements of Portfolio on page FS4 to FS9.
9. Amount and percentage of borrowings of total fund size as at 31 March 2018
Nil

Pi Global Portfolios Report To Unitholders Year ended 31 March 2018
8
10. Amount of units created and cancelled for the year ended 31 March 2018
Pi-5 Global Portfolio S$
Pi-7 Global Portfolio S$
Units created 6,174,953 6,332,852 Units cancelled (11,796,570) (9,534,942)
11. Portfolio turnover ratio
Please refer to Note 11 of Notes to Financial Statements. 12. Expense ratio
Please refer to Note 11 of Notes to Financial Statements. 13. Performance as at 31 March 2018
Pi-5 Global Portfolio
Cumulative (%*) S$ US$
3 Months -2.72 -0.85 6 Months -0.46 3.09 1 Year 2.60 9.34 3 Years 0.46 5.09 5 years 7.76 1.96 Since inception (4 June 2010) 14.99 23.75
Annualised (%*) S$ US$
3 Years 0.15 1.67 5 years 1.51 0.39 Since inception (4 June 2010) 1.80 2.76
Pi-7 Global Portfolio
Cumulative (%*) S$ US$
3 Months -2.43 -0.56 6 Months 0.87 4.46 1 Year 5.35 12.27 3 Years 3.11 7.86 5 years 13.20 7.09 Since inception (4 June 2010) 20.75 29.93
Annualised %*) S$ US$
3 Years 1.03 2.55 5 years 2.51 1.38 Since inception (4 June 2010) 2.44 3.40
Note: * Cumulative returns are based on a bid to bid basis, with net dividends reinvested. Source: Bloomberg 14. Related party transactions
Please refer to Note 10 of Notes to Financial Statements. 15. Any other material information that will adversely impact the valuation of the Sub-Funds
Nil

Pi Global Portfolios Report To Unitholders Year ended 31 March 2018
9
16. Soft dollar commissions The Manager will comply with applicable regulatory and industry standards on soft-dollars. The soft-dollar commissions which the Manager may receive include research and advisory services, economic and political analyses, portfolio analyses including valuation and performance measurements, market analyses, data and quotation services, computer hardware and software or any other information facilities to the extent that they are used to support the investment decision making process, the giving of advice, or the conduct of research or analysis and custodial service in relation to the investments managed for clients. The soft dollar credits utilised are not allocated on a specific client basis. The brokers also execute trades for other funds managed by the Manager. The Manager will not accept or enter into soft dollar commissions/arrangements unless such soft-dollar commissions or arrangements would, in the opinion of the Manager, assist the Manager in its management of clients’ funds, provided that the Manager shall ensure at all times that transactions are executed on the best available terms taking into account the relevant market at the time for transactions of the kind and size concerned, and that no unnecessary trades are entered into in order to qualify for such soft-dollar commissions or arrangements. The Manager does not, and is not entitled to, retain cash rebates for its own account in respect of rebates earned when transacting in securities for account of the Sub-Funds. During the period, soft dollar services received from each broker were investment research and publications, data and quotation services. Soft dollar services were received from the Manager's panel of brokers which executed transactions for the Sub-Funds and other funds managed by the Manager.

Pi Global Portfolios
Report of the Trustee
Year ended 31 March 2018
10
Report of the Trustee
The Trustee is under a duty to take into custody and hold the assets of Pi Global Portfolios in trust
for the unitholders. In accordance with the Securities and Futures Act (Chapter 289), its
subsidiary legislation and the Code on Collective Investment Schemes, the Trustee shall monitor
the activities of the Manager for compliance with the limitations imposed on the investment and
borrowing powers as set out in the Trust Deed in each annual accounting period and report
thereon to unitholders in an annual report.
To the best knowledge of the Trustee, the Manager has, in all material respects, managed
Pi Global Portfolios during the period covered by these financial statements, set out on pages FS1
to FS19, in accordance with the limitations imposed on the investment and borrowing powers set
out in the Trust Deed.
For and on behalf of the Trustee
BNP Paribas Trust Services Singapore Limited
Authorised signatory
26 June 2018

Pi Global Portfolios
Statement by the Manager
Year ended 31 March 2018
11
Statement by the Manager
In the opinion of the directors of Phillip Capital Management (S) Ltd, the accompanying financial
statements set out on pages FS1 to FS19, comprising the Statements of Total Return, Statements
of Financial Position, Statements of Movements of Unitholders’ Funds, Statements of Portfolio
and Notes to the Financial Statements are drawn up so as to present fairly, in all material respects,
the financial position of Pi Global Portfolios as at 31 March 2018, and the total return and
movements in unitholders’ funds for the year then ended in accordance with the recommendations
of Statement of Recommended Accounting Practice 7 “Reporting Framework for Unit Trusts”
issued by the Institute of Singapore Chartered Accountants. At the date of this statement, there are
reasonable grounds to believe that Pi Global Portfolios will be able to meet its financial
obligations as and when they materialise.
For and on behalf of directors of the Manager
Phillip Capital Management (S) Ltd
Jeffrey Lee Chay Khiong
Director
26 June 2018

KPMG LLP
16 Raffles Quay #22-00
Hong Leong Building
Singapore 048581
Telephone +65 6213 3388
Fax +65 6225 0984
Internet www.kpmg.com.sg
12 KPMG LLP (Registration No. T08LL1267L), an accounting limited liability partnership registered in Singapore under the Limited Liability Partnership Act (Chapter 163A) and a member firm of the KPMG network of independent member firms affiliated with KPMG International Cooperative (“KPMG International”), a Swiss entity.
Independent auditors' report
Unitholders
Pi Global Portfolios
(Constituted under a Trust Deed registered in the Republic of Singapore)
Report on the audit of financial statements
Opinion
We have audited the financial statements of Pi Global Portfolios (the “Fund”), which comprise
the Statements of Financial Position and Statements of Portfolio as at 31 March 2018, the
Statements of Total Return and Statements of Movements of Unitholders’ Funds for the year then
ended, and notes to the financial statements, including a summary of significant accounting
policies, as set out on pages FS1 to FS19.
In our opinion, the accompanying financial statements are properly drawn up in accordance with
the recommendations of Statement of Recommended Accounting Practice 7 “Reporting
Framework for Unit Trusts” issued by the Institute of Singapore Chartered Accountants so as to
present fairly, in all material respects, the financial position and portfolio holdings of the Fund as
at 31 March 2018 and the financial performance and movements in unitholders’ funds for the year
ended on that date.
Basis for opinion
We conducted our audit in accordance with Singapore Standards on Auditing (‘SSAs’). Our
responsibilities under those standards are further described in the Auditors’ Responsibilities for
the Audit of the Financial Statements section of our report. We are independent of the Fund in
accordance with the Accounting and Corporate Regulatory Authority Code of Professional
Conduct and Ethics for Public Accountants and Accounting Entities (‘ACRA Code’) together
with the ethical requirements that are relevant to our audit of the financial statements in Singapore,
and we have fulfilled our other ethical responsibilities in accordance with these requirements and
the ACRA Code. We believe that the audit evidence we have obtained is sufficient and
appropriate to provide a basis for our opinion.
Other information
Phillip Capital Management (S) Ltd, the Manager of the Fund (‘the Manager’), is responsible for
the other information contained in the annual report. Other information is defined as all
information in the annual report other than the financial statements and our auditors’ report
thereon.
We have obtained all other information prior to the date of this auditors’ report.
Our opinion on the financial statements does not cover the other information and we do not
express any form of assurance conclusion thereon.
Pi Global Portfolios
Independent auditors’ report
Year ended 31 March 2018
13
In connection with our audit of the financial statements, our responsibility is to read the other
information and, in doing so, consider whether the other information is materially inconsistent
with the financial statements or our knowledge obtained in the audit or otherwise appears to be
materially misstated. If, based on the work we have performed, we conclude that there is a
material misstatement of this other information, we are required to report that fact. We have
nothing to report in this regard.
Responsibilities of the Manager for the financial statements
The Manager is responsible for the preparation and fair presentation of these financial statements
in accordance with the recommendations of the Statement of Recommended Accounting
Practices 7 “Reporting Framework for Unit Trusts” issued by the Institute of Singapore Chartered
Accountants, and for such internal control as the Manager determines is necessary to enable the
preparation of financial statements that are free from material misstatement, whether due to fraud
or error.
In preparing the financial statements, the Manager is responsible for assessing the Fund’s ability
to continue as a going concern, disclosing, as applicable, matters related to going concern and
using the going concern basis of accounting unless the Manager either intends to terminate the
Fund or to cease the Fund’s operations, or has no realistic alternative but to do so.
The Manager’s responsibilities include overseeing the Fund’s financial reporting process.
Auditors’ responsibilities for the audit of the financial statements
Our objectives are to obtain reasonable assurance about whether the financial statements as a
whole are free from material misstatement, whether due to fraud or error, and to issue an auditor’s
report that includes our opinion. Reasonable assurance is a high level of assurance, but is not a
guarantee that an audit conducted in accordance with SSAs will always detect a material
misstatement when it exists. Misstatements can arise from fraud or error and are considered
material if, individually or in the aggregate, they could reasonably be expected to influence the
economic decisions of users taken on the basis of these financial statements.
As part of an audit in accordance with SSAs, we exercise professional judgement and maintain
professional scepticism throughout the audit. We also:
Identify and assess the risks of material misstatement of the financial statements, whether
due to fraud or error, design and perform audit procedures responsive to those risks, and
obtain audit evidence that is sufficient and appropriate to provide a basis for our opinion.
The risk of not detecting a material misstatement resulting from fraud is higher than for
one resulting from error, as fraud may involve collusion, forgery, intentional omissions,
misrepresentations, or the override of internal controls.
Obtain an understanding of internal controls relevant to the audit in order to design audit
procedures that are appropriate in the circumstances, but not for the purpose of
expressing an opinion on the effectiveness of the Fund’s internal controls.

Pi Global Portfolios
Independent auditors’ report
Year ended 31 March 2018
14
Evaluate the appropriateness of accounting policies used and the reasonableness of
accounting estimates and related disclosures made by the Manager.
Conclude on the appropriateness of the Manager’s use of the going concern basis of
accounting and, based on the audit evidence obtained, whether a material uncertainty
exists related to events or conditions that may cast significant doubt on the Fund’s ability
to continue as a going concern. If we conclude that a material uncertainty exists, we are
required to draw attention in our auditor’s report to the related disclosures in the financial
statements or, if such disclosures are inadequate, to modify our opinion. Our conclusions
are based on the audit evidence obtained up to the date of our auditor’s report. However,
future events or conditions may cause the Fund to cease to continue as a going concern.
Evaluate the overall presentation, structure and content of the financial statements,
including the disclosures, and whether the financial statements represent the underlying
transactions and events in a manner that achieves fair presentation.
We communicate with the Manager regarding, among other matters, the planned scope and
timing of the audit and significant audit findings, including any significant deficiencies in internal
controls that we identify during our audit.
KPMG LLP
Public Accountants and
Chartered Accountants
Singapore
26 June 2018

Pi Global Portfolios
Financial statements
Year ended 31 March 2018
The accompanying notes form an integral part of these financial statements
FS1
Statements of Total Return
Year ended 31 March 2018
Pi-5 Global Portfolio Pi-7 Global Portfolio
Note 2018 2017 2018 2017
S$ S$ S$ S$
Income
Dividends 795,051 992,246 594,282 748,694
Interest income 55 50 55 50
Other income 8 – 7 –
795,114 992,296 594,344 748,744
Less:
Expenses
Management fees 451,060 550,370 353,944 436,463
Management fees rebate (16,783) (27,822) (11,848) (21,759)
Trustee fees 12,028 4,544 9,438 3,681
Admin fees 12,028 27,342 9,438 21,647
Custody fees 8,088 14,485 6,557 10,899
Audit fees 12,500 10,379 12,500 10,379
Transaction fees 6,850 35,651 7,773 31,727
Other expenses 16,855 29,540 16,650 26,986
502,626 644,489 404,452 520,023
Net income 292,488 347,807 189,892 228,721
Net gains or losses on
value of investments
and financial
derivatives
Net gains on investments 623,537 2,685,484 1,128,065 3,019,084
Net losses on foreign
exchange (1,816) (2,946) (7,552) (7,472)
621,721 2,682,538 1,120,513 3,011,612
Total return for the
year before income tax 914,209 3,030,345 1,310,405 3,240,333
Less: Income tax 7 (41,686) (45,722) (60,971) (42,148)
Total return for the
year after income tax
before distribution 872,523 2,984,623 1,249,434 3,198,185

Pi Global Portfolios
Financial statements
Year ended 31 March 2018
The accompanying notes form an integral part of these financial statements
FS2
Statements of Financial Position
As at 31 March 2018
Pi-5 Global Portfolio Pi-7 Global Portfolio
Note 2018 2017 2018 2017
S$ S$ S$ S$
Assets
Portfolio of investments 27,332,892 31,600,729 21,982,055 24,268,236
Sales awaiting settlement – – – 252,735
Receivables 3 22,305 223,279 11,009 254,886
Cash and cash
equivalents 4 661,400 1,280,101 2,122,605 1,207,566
Total assets 28,016,597 33,104,109 24,115,669 25,983,423
Liabilities
Payables 5 658,615 725,831 356,866 339,520
Purchases awaiting
settlement – – 699,082 631,526
Total liabilities 658,615 725,831 1,055,948 971,046
Equity
Net assets attributable to
unitholders 27,357,982 32,378,278 23,059,721 25,012,377

Pi Global Portfolios
Financial statements
Year ended 31 March 2018
The accompanying notes form an integral part of these financial statements
FS3
Statements of Movements of Unitholders’ Funds
Year ended 31 March 2018
Pi-5 Global Portfolio Pi-7 Global Portfolio Note 2018 2017 2018 2017
S$ S$ S$ S$ Net assets attributable
to unitholders at the
beginning of financial
year 32,378,278 36,302,258 25,012,377 29,046,411
Operations
Change in net assets
attributable to
unitholders resulting
from operations 872,523 2,984,623 1,249,434 3,198,185
Unitholders’
contributions/
(withdrawals)
Creation of units 6,174,953 5,198,277 6,332,852 4,316,831
Cancellation of units (11,796,570) (11,768,542) (9,534,942) (11,549,050)
Change in net assets
attributable to
unitholders resulting
from net creation and
cancellation of units (5,621,617) (6,570,265) (3,202,090) (7,232,219)
Distributions 8 (271,202) (338,338) – –
Total decrease in net
assets attributable to
unitholders (5,020,296) (3,923,980) (1,952,656) (4,034,034)
Net assets attributable
to unitholders at the
end of financial year 6 27,357,982 32,378,278 23,059,721 25,012,377

Pi Global Portfolios
Financial statements
Year ended 31 March 2018
The accompanying notes form an integral part of these financial statements
FS4
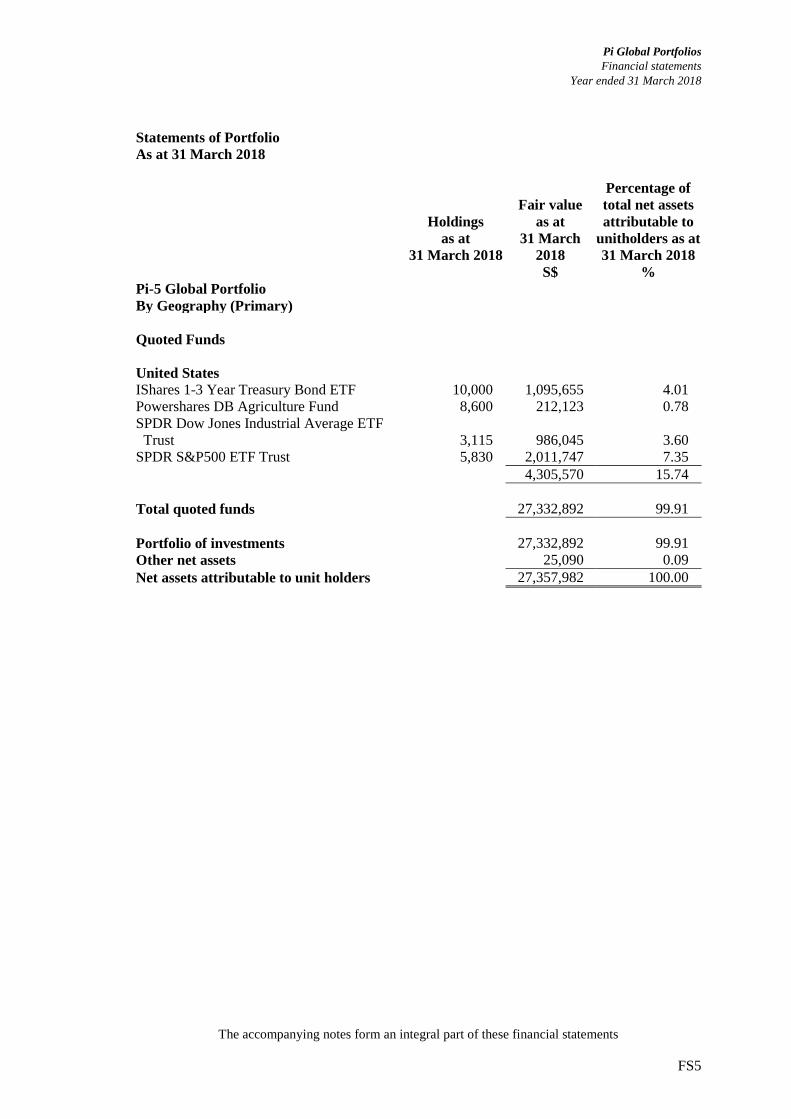
Statements of Portfolio
As at 31 March 2018
Holdings
as at
31 March 2018
Fair value
as at
31 March
2018
Percentage of
total net assets
attributable to
unitholders as at
31 March 2018
S$ %
Pi-5 Global Portfolio
By Geography (Primary)
Quoted Funds
France
Lyxor Commodities Thomson Reuters/Core
commodity CRB TR UCITS ETF - C-EUR 24,001 567,527 2.07
567,527 2.07
Germany
IShares STOXX Europe Select Dividend 30
UCITS ETF DE 30,222 802,244 2.93
802,244 2.93
Ireland
IShares Emerging Market Dividend UCITS
ETF USD DIST 11,386 351,504 1.28
IShares Euro STOXX 50 UCITS ETF EUR
DIST 20,677 1,137,931 4.16
IShares MSCI Emerging Market UCITS ETF
USD ACC 24,128 1,159,970 4.24
IShares MSCI Emerging Market UCITS ETF
USD DIST 40,791 2,434,292 8.90
IShares MSCI Japan USD Hedged UCITS
ETF ACC 10,331 479,971 1.75
IShares MSCI Pacific Ex-Japan UCITS ETF
USD DIST 8,664 510,965 1.87
IShares USD Corporation Bond UCITS ETF 12,788 1,883,984 6.89
7,958,617 29.09
Singapore
Fullerton Asian Bond Fund 710,307 1,178,705 4.31
Fullerton SGD Income Fund 819,948 843,915 3.08
LionGlobal Asia Bond Fund 1,045,480 1,323,578 4.84
LionGlobal Team Fund - Singapore Fixed
Income Investment 366,562 598,229 2.19
Lion-Phillip S-REIT ETF 2,270,000 2,294,970 8.39
Nikko AM Shenton Short Term Bond Fund 1,002,324 1,479,400 5.41
Nikko AM Singapore STI ETF 550,400 1,931,904 7.06
Phillip SGX APAC Dividend Leaders REIT
ETF 983,400 1,256,003 4.59
SPDR Straits Times Index ETF 359,500 1,233,085 4.51
United Asian Bond Fund 908,593 1,559,145 5.70
13,698,934 50.08
Pi Global Portfolios
Financial statements
Year ended 31 March 2018
The accompanying notes form an integral part of these financial statements
FS5
Statements of Portfolio
As at 31 March 2018
Holdings
as at
31 March 2018
Fair value
as at
31 March
2018
Percentage of
total net assets
attributable to
unitholders as at
31 March 2018
S$ %
Pi-5 Global Portfolio
By Geography (Primary)
Quoted Funds
United States
IShares 1-3 Year Treasury Bond ETF 10,000 1,095,655 4.01
Powershares DB Agriculture Fund 8,600 212,123 0.78
SPDR Dow Jones Industrial Average ETF
Trust 3,115 986,045 3.60
SPDR S&P500 ETF Trust 5,830 2,011,747 7.35
4,305,570 15.74
Total quoted funds 27,332,892 99.91
Portfolio of investments 27,332,892 99.91
Other net assets 25,090 0.09
Net assets attributable to unit holders 27,357,982 100.00

Pi Global Portfolios
Financial statements
Year ended 31 March 2018
The accompanying notes form an integral part of these financial statements
FS6
Statements of Portfolio
As at 31 March 2018
Fair value
as at
31 March 2018
Percentage of
total net assets
attributable to
unitholders as at
31 March 2018
Percentage of
total net assets
attributable to
unitholders as at
31 March 2017
S$ % %
Pi-5 Global Portfolio
By Geography (Summary)
Quoted Funds
France 567,527 2.07 0.83
Germany 802,244 2.93 2.37
Ireland 7,958,617 29.09 25.45
Singapore 13,698,934 50.08 49.40
United States 4,305,570 15.74 19.55
Total quoted funds 27,332,892 99.91 97.60
Portfolio of investments 27,332,892 99.91 97.60
Other net assets 25,090 0.09 2.40
Net assets attributable to unitholders 27,357,982 100.00 100.00
By Industry (Secondary)
Exchange traded funds 20,137,797 73.61 63.62
Unit trusts 7,195,095 26.30 33.98
Portfolio of investments 27,332,892 99.91 97.60
Other net assets 25,090 0.09 2.40
Net assets attributable to unitholders 27,357,982 100.00 100.00

Pi Global Portfolios
Financial statements
Year ended 31 March 2018
The accompanying notes form an integral part of these financial statements
FS7
Statements of Portfolio
As at 31 March 2018
Holdings
as at
31 March 2018
Fair value
as at
31 March 2018
Percentage of
total net assets
attributable to
unitholders as at
31 March 2018
S$ %
Pi-7 Global Portfolio
By Geography (Primary)
Quoted Funds
France
Lyxor Commodities Thomson Reuters/Core
commodity CRB TR UCITS ETF - C-EUR 19,052 450,503 1.95
450,503 1.95
Germany
IShares STOXX Europe Select Dividend 30
UCITS ETF DE 27,565 731,714 3.17
731,714 3.17
Hong Kong
Vanguard FTSE Asia Ex Japan High Dividend
Yield Index ETF 800 3,175 0.01
3,175 0.01
Ireland
IShares Emerging Market Dividend UCITS
ETF USD DIST 13,492 416,520 1.81
IShares Euro STOXX 50 UCITS ETF EUR
DIST 12,751 701,734 3.04
IShares MSCI Emerging Market UCITS ETF
USD ACC 51,601 2,480,753 10.76
IShares MSCI Emerging Market UCITS ETF
USD DIST 49,672 2,964,285 12.86
IShares MSCI Japan USD Hedged UCITS
ETF ACC 10,744 499,159 2.16
IShares MSCI Pacific Ex-Japan UCITS ETF
USD DIST 5,020 296,058 1.29
IShares USD Corporation Bond UCITS ETF 3,428 505,028 2.19
IShares MSCI AC Far East Ex-Japan UCITS
ETF USD DIST 6,224 488,992 2.12
8,352,529 36.23

Pi Global Portfolios
Financial statements
Year ended 31 March 2018
The accompanying notes form an integral part of these financial statements
FS8
Statements of Portfolio
As at 31 March 2018
Holdings
as at
31 March 2018
Fair value
as at
31 March 2018
Percentage of
total net assets
attributable to
unitholders as at
31 March 2018
S$ %
Pi-7 Global Portfolio
By Geography (Primary)
Quoted Funds
Singapore
Fullerton Asian Bond Fund 495,199 821,748 3.56
LionGlobal Asia Bond Fund 548,823 694,810 3.02
Lion-Phillip S-REIT ETF 1,730,000 1,749,030 7.58
Nikko AM Singapore STI ETF 428,200 1,502,982 6.52
Phillip SGX APAC Dividend Leaders REIT
ETF 707,600 903,750 3.92
SPDR Straits Times Index ETF 259,600 890,428 3.86
United Asian Bond Fund 434,888 746,267 3.24
7,309,015 31.70
Thailand
One Stoxx Asean Select Dividend Index Fund 155,100 666,281 2.89
666,281 2.89
United States
IShares 1-3 Year Treasury Bond ETF 6,850 750,524 3.25
Powershares DB Agriculture Fund 7,000 172,659 0.75
Powershares DB Base Metals Fund 8,357 199,445 0.87
SPDR Dow Jones Industrial Average ETF
Trust 3,265 1,033,527 4.48
SPDR S&P Dividend ETF 2,929 350,280 1.52
SPDR S&P 500 ETF Trust 5,687 1,962,403 8.51
4,468,838 19.38
Total quoted funds 21,982,055 95.33
Portfolio of investments 21,982,055 95.33
Other net assets 1,077,666 4.67
Net assets attributable to unitholders 23,059,721 100.00

Pi Global Portfolios
Financial statements
Year ended 31 March 2018
The accompanying notes form an integral part of these financial statements
FS9
Statements of Portfolio
As at 31 March 2018
Fair value
as at
31 March 2018
Percentage of
total net assets
attributable to
unitholders as at
31 March 2018
Percentage of
total net assets
attributable to
unitholders as at
31 March 2017
S$ % %
Pi-7 Global Portfolio
By Geography (Summary)
Quoted Funds
France 450,503 1.95 0.88
Germany 731,714 3.17 3.68
Hong Kong 3,175 0.01 0.01
Ireland 8,352,529 36.23 32.51
Singapore 7,309,015 31.70 32.92
Thailand 666,281 2.89 2.53
United States 4,468,838 19.38 24.49
Total quoted funds 21,982,055 95.33 97.02
Portfolio of investments 21,982,055 95.33 97.02
Other net assets 1,077,666 4.67 2.98
Net assets attributable to unitholders 23,059,721 100.00 100.00
By Industry (Secondary)
Exchange traded funds 18,680,845 81.01 75.37
Unit trusts 3,301,210 14.32 21.65
Portfolio of investments 21,982,055 95.33 97.02
Other net assets 1,077,666 4.67 2.98
Net assets attributable to unitholders 23,059,721 100.00 100.00
Pi Global Portfolios
Financial statements
Year ended 31 March 2018
FS10
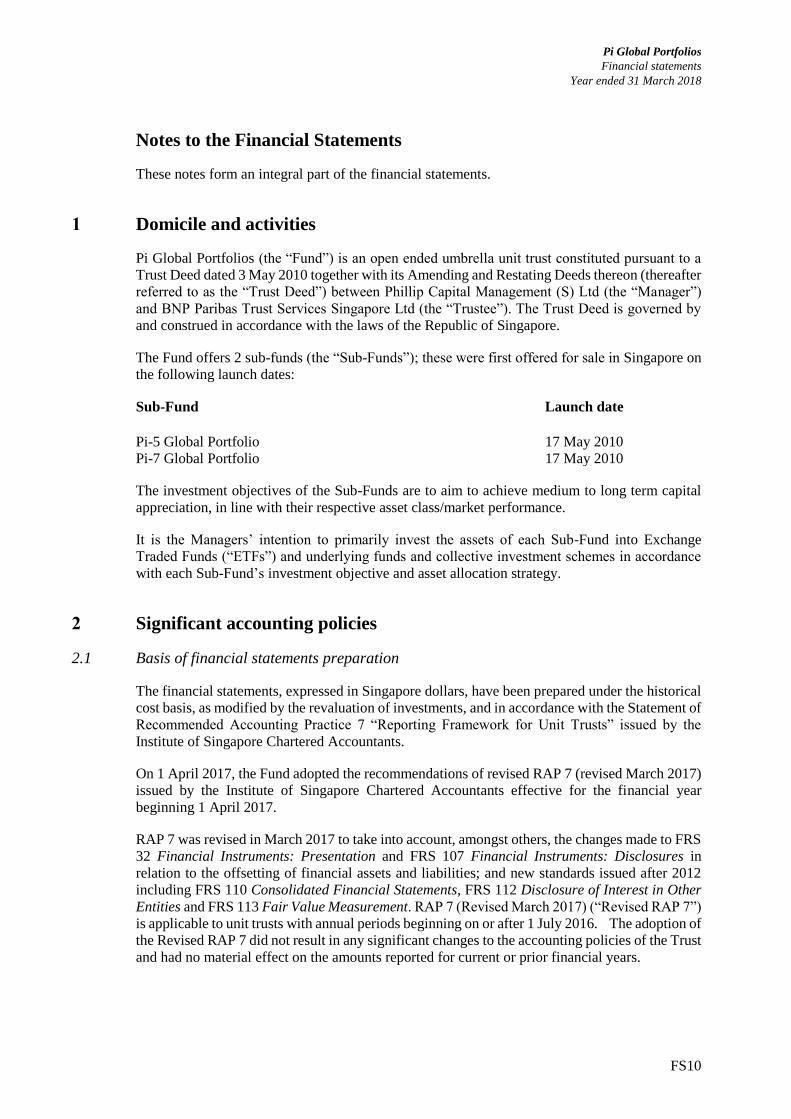
Notes to the Financial Statements
These notes form an integral part of the financial statements.
1 Domicile and activities
Pi Global Portfolios (the “Fund”) is an open ended umbrella unit trust constituted pursuant to a
Trust Deed dated 3 May 2010 together with its Amending and Restating Deeds thereon (thereafter
referred to as the “Trust Deed”) between Phillip Capital Management (S) Ltd (the “Manager”)
and BNP Paribas Trust Services Singapore Ltd (the “Trustee”). The Trust Deed is governed by
and construed in accordance with the laws of the Republic of Singapore.
The Fund offers 2 sub-funds (the “Sub-Funds”); these were first offered for sale in Singapore on
the following launch dates:
Sub-Fund Launch date Pi-5 Global Portfolio 17 May 2010 Pi-7 Global Portfolio 17 May 2010
The investment objectives of the Sub-Funds are to aim to achieve medium to long term capital
appreciation, in line with their respective asset class/market performance.
It is the Managers’ intention to primarily invest the assets of each Sub-Fund into Exchange
Traded Funds (“ETFs”) and underlying funds and collective investment schemes in accordance
with each Sub-Fund’s investment objective and asset allocation strategy.
2 Significant accounting policies
2.1 Basis of financial statements preparation
The financial statements, expressed in Singapore dollars, have been prepared under the historical
cost basis, as modified by the revaluation of investments, and in accordance with the Statement of
Recommended Accounting Practice 7 “Reporting Framework for Unit Trusts” issued by the
Institute of Singapore Chartered Accountants.
On 1 April 2017, the Fund adopted the recommendations of revised RAP 7 (revised March 2017)
issued by the Institute of Singapore Chartered Accountants effective for the financial year
beginning 1 April 2017.
RAP 7 was revised in March 2017 to take into account, amongst others, the changes made to FRS
32 Financial Instruments: Presentation and FRS 107 Financial Instruments: Disclosures in
relation to the offsetting of financial assets and liabilities; and new standards issued after 2012
including FRS 110 Consolidated Financial Statements, FRS 112 Disclosure of Interest in Other
Entities and FRS 113 Fair Value Measurement. RAP 7 (Revised March 2017) (“Revised RAP 7”)
is applicable to unit trusts with annual periods beginning on or after 1 July 2016. The adoption of
the Revised RAP 7 did not result in any significant changes to the accounting policies of the Trust
and had no material effect on the amounts reported for current or prior financial years.

Pi Global Portfolios
Financial statements
Year ended 31 March 2018
FS11
For the purposes of preparation of these financial statements, the basis used for calculating the
expense ratio and turnover ratio are in accordance with the guidelines issued by the Investment
Management Association of Singapore (“IMAS”) and the Code on Collective Investment
Schemes under the Securities and Futures Act (Cap 289) (“Code”) respectively.
2.2 Basis of valuation of investments
Quoted investments are stated at fair value based on the last traded prices for equities at the
reporting date. Unrealised gains/losses on investments are represented by the difference between
the fair value and the carrying value of investments and are recognised in the Statements of Total
Return. Realised gains and losses upon disposal of investments are computed on the basis of the
difference between the carrying value and the selling price of investments on trade date and are
taken to the Statements of Total Return.
2.3 Financial derivatives
Derivatives are recognised initially at fair value; attributable transaction costs are recognised in
the Statements of Total Return when incurred. Subsequent to initial recognition, derivatives are
measured at fair value, and changes in fair value therein are recognised in the Statements of Total
Return.
2.4 Recognition on income
Dividend income is recognised when declared and is stated gross of tax credits.
Interest income is recognised as it accrues in the Statements of Total Return using the effective
interest method.
2.5 Foreign currency translation
Transactions in foreign currencies are translated at the exchange rate at the date of transaction.
Monetary assets and liabilities denominated in foreign currencies at the reporting date are
translated at exchange rates at the reporting date. All exchange differences are recognised in the
Statements of Total Return.
2.6 Income tax expense
The Fund was approved for the Enhanced-Tier Fund Tax Incentive Scheme under Section 13X of
the Income Tax Act by the Monetary Authority of Singapore (“MAS”) with effect from 15
January 2013. The tax exemption status will be for the life of the Fund, provided the Fund
continues to meet all the terms and conditions set out by MAS and the relevant Income Tax
legislations.
2.7 Cash and cash equivalents
Cash and cash equivalents comprise bank balances and amounts held with brokers. Cash
equivalents are short-term highly liquid investments that are readily convertible to known
amounts of cash and are subject to an insignificant risk of changes in value.
2.8 Net assets attributable to unitholders
Net assets attributable to unitholders are classified as equity.

Pi Global Portfolios
Financial statements
Year ended 31 March 2018
FS12
3 Receivables Pi-5 Global Portfolio Pi-7 Global Portfolio
2018 2017 2018 2017
S$ S$ S$ S$
Receivable from
unitholders for creation
of units
15,136 212,948 4,947 246,058
Management fees rebate 1 3,680 1 2,806
Dividends receivable 7,168 6,651 6,061 6,022
22,305 223,279 11,009 254,886
4 Cash and cash equivalents
Pi-5 Global Portfolio Pi-7 Global Portfolio
2018 2017 2018 2017
S$ S$ S$ S$
Bank balances 561,287 1,180,039 2,022,493 1,107,504
Amounts held with
brokers
100,113 100,062 100,112 100,062
661,400 1,280,101 2,122,605 1,207,566
The bank balances are placed with a financial institution related to the trustee.
5 Payables Pi-5 Global Portfolio Pi-7 Global Portfolio
2018 2017 2018 2017
S$ S$ S$ S$
Payable to unitholders for
cancellation of units 585,347 450,670 291,487 234,096
Accrued expenses 73,268 121,559 65,379 104,174
Distribution payable – 152,352 – –
Others – 1,250 – 1,250
658,615 725,831 356,866 339,520

Pi Global Portfolios
Financial statements
Year ended 31 March 2018
FS13
6 Units in issue
During the year, the number of shares issued, redeemed and outstanding were as follows:
Pi-5 Global Portfolio Pi-7 Global Portfolio
2018 2017 2018 2017
Units at the beginning of
financial year 30,470,344 36,741,598 21,831,076 28,298,418
Units created 5,635,263 5,076,832 5,228,834 3,972,928
Units cancelled (10,803,243) (11,348,086) (7,962,594) (10,440,270)
Units at the end of the year 25,302,364 30,470,344 19,097,316 21,831,076
Net assets attributable to
unitholders - S$ 27,357,982 32,378,278 23,059,721 25,012,377
Net asset value per
unit - S$ 1.0812 1.0626 1.2075 1.1457
For subscriptions and redemptions and for various fee calculations, investments are stated at the
last traded price on the valuation day for the purpose of determining net asset value per unit while
for reporting purpose the investments are valued at the relevant last traded prices as at the
reporting date.
The assets of the Sub-Funds are valued in S$. For the purposes of calculating the Net Asset Value
of each unit for the US$ Class, the value will be translated from S$ to US$ at the prevailing
foreign exchange rate.
The effect of last traded price in the net assets attributable to unitholders is as follows:
Pi-5 Global Portfolio Pi-7 Global Portfolio
2018 2017 2018 2017
Net assets attributable to
unitholders per unit per
financial statements 1.0812 1.0626 1.2075 1.1457
Effect of adopting last
traded price per unit (0.0001) 0.0010 (0.0002) 0.0005
Net assets attributable to
unitholders per unit for
issuing/redeeming 1.0811 1.0636 1.2073 1.1462
7 Income tax Pi-5 Global Portfolio Pi-7 Global Portfolio
2018 2017 2018 2017
Singapore income tax 26,556 13,346 42,716 8,731
Overseas income tax 15,130 32,376 18,255 33,417
41,686 45,722 60,971 42,148
The overseas income tax charge relates to withholding tax suffered on receipt of distributions
from overseas investments.
Pi Global Portfolios
Financial statements
Year ended 31 March 2018
FS14
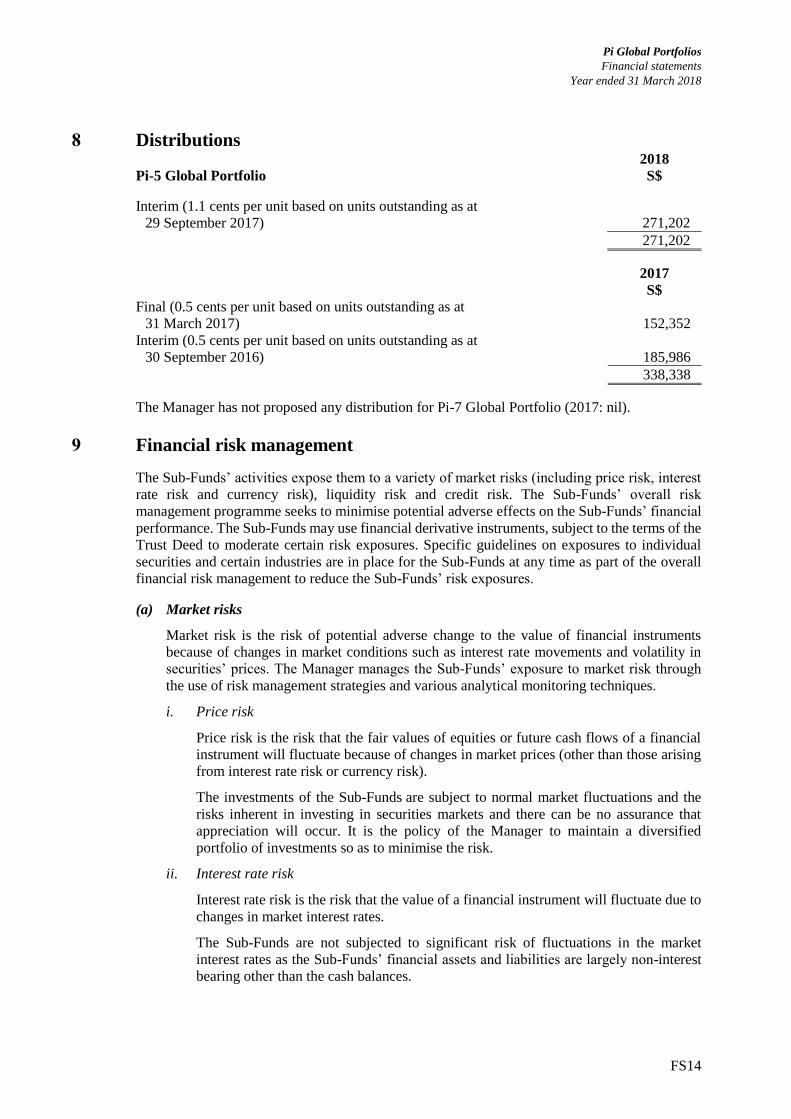
8 Distributions 2018
Pi-5 Global Portfolio S$
Interim (1.1 cents per unit based on units outstanding as at
29 September 2017) 271,202
271,202
2017 S$
Final (0.5 cents per unit based on units outstanding as at
31 March 2017) 152,352
Interim (0.5 cents per unit based on units outstanding as at
30 September 2016) 185,986
338,338
The Manager has not proposed any distribution for Pi-7 Global Portfolio (2017: nil).
9 Financial risk management
The Sub-Funds’ activities expose them to a variety of market risks (including price risk, interest
rate risk and currency risk), liquidity risk and credit risk. The Sub-Funds’ overall risk
management programme seeks to minimise potential adverse effects on the Sub-Funds’ financial
performance. The Sub-Funds may use financial derivative instruments, subject to the terms of the
Trust Deed to moderate certain risk exposures. Specific guidelines on exposures to individual
securities and certain industries are in place for the Sub-Funds at any time as part of the overall
financial risk management to reduce the Sub-Funds’ risk exposures.
(a) Market risks
Market risk is the risk of potential adverse change to the value of financial instruments
because of changes in market conditions such as interest rate movements and volatility in
securities’ prices. The Manager manages the Sub-Funds’ exposure to market risk through
the use of risk management strategies and various analytical monitoring techniques.
i. Price risk
Price risk is the risk that the fair values of equities or future cash flows of a financial
instrument will fluctuate because of changes in market prices (other than those arising
from interest rate risk or currency risk).
The investments of the Sub-Funds are subject to normal market fluctuations and the
risks inherent in investing in securities markets and there can be no assurance that
appreciation will occur. It is the policy of the Manager to maintain a diversified
portfolio of investments so as to minimise the risk.
ii. Interest rate risk
Interest rate risk is the risk that the value of a financial instrument will fluctuate due to
changes in market interest rates.
The Sub-Funds are not subjected to significant risk of fluctuations in the market
interest rates as the Sub-Funds’ financial assets and liabilities are largely non-interest
bearing other than the cash balances.

Pi Global Portfolios
Financial statements
Year ended 31 March 2018
FS15
iii. Currency risk
The Sub-Funds are denominated in Singapore Dollars. The Sub-Funds invest in
underlying securities which are denominated in foreign currencies where fluctuations
in the relevant exchange rates may have an impact on the income and value of the
Sub-Funds. The Manager may seek to minimise exposure to foreign currency
fluctuation to the extent practicable.
As at 31 March 2018 and 2017, the concentration of the Sub-Funds’ investments are set
out in the Statements of Portfolio.
Assets and liabilities denominated in currencies other than the Sub-Funds’ functional
currency comprise the following:
Pi-5 Global Portfolio
USD GBP EUR
2018 S$ S$ S$
Assets
Portfolio of investments 11,438,312 2,649,405 802,244
Receivables 7,168 – –
Cash and cash equivalents 3,446 – –
11,448,925 2,649,405 802,244
2017
Assets
Portfolio of investments 14,369,387 2,457,623 767,384
Receivables 6,651 – –
Cash and cash equivalents 14,427 – –
14,390,465 2,457,623 767,384
Pi-7 Global Portfolio
USD GBP HKD EUR
2018 S$ S$ S$ S$
Assets
Portfolio of investments 10,753,902 4,087,999 3,175 731,714
Receivables 6,061 – – –
Cash and cash equivalents 4,081 – – –
10,764,044 4,087,999 3,175 731,714
Liabilities
Purchases awaiting
settlement 699,082 – – –
2017
Assets
Portfolio of investments 12,339,524 4,144,793 2,934 919,420
Sales awaiting settlement – 252,735 – –
Receivables 6,022 – – –
Cash and cash equivalents 714,412 – – –
13,059,958 4,397,528 2,934 919,420

Pi Global Portfolios
Financial statements
Year ended 31 March 2018
FS16
Pi-7 Global Portfolio
USD GBP HKD EUR
2017 S$ S$ S$ S$
Liabilities
Purchases awaiting
settlement 631,526 – – –
The Sub-Funds’ monetary assets/liabilities are measured for their sensitivity to
exchange rate movements based on the balance of the monetary assets/liabilities,
forecasted exchange rate movements and the net asset value of the Sub-Funds.
As at 31 March, with respect to the monetary assets and monetary liabilities of the
Sub-Funds, had the Singapore Dollar increased/decreased by 10% against foreign
currencies, with all other variables remaining constant, the decrease/increase in net
assets attributable to unitholders would be as follows:
SGD rise by 10%
Decrease/(Increase) in net assets attributable
to unitholders
Phillip Pi-5 Global
Portfolio
Phillip Pi-7 Global
Portfolio
2018 2017 2018 2017
S$ S$ S$ S$
US Dollar 1,144,893 1,439,047 1,006,496 1,242,843
Great British Pound 264,941 245,762 408,800 439,753
Hong Kong Dollar – – 318 293
Euro 80,224 76,738 73,171 91,942
(b) Liquidity risk
The Sub-Funds are exposed to daily redemption of units in the Sub-Funds. Therefore the
majority of their assets are invested in investments that are traded in an active market and
can be readily disposed of.
(c) Credit risk
Credit risk is the risk that a counterparty will fail to perform contractual obligations, either in
whole or in part, under a contract.
The Sub-Funds are exposed to counterparty credit risk on cash and bank balances and other
receivable balances.
All transactions in listed securities are settled/paid upon delivery using approved brokers.
The risk of default is considered minimal, as delivery of securities is only made once the
broker has received payment. Payment is made on a purchase once the securities have been
received by the broker. The trade will fail if either party fails to meet its obligation.
The Sub-Funds may also enter into derivative contracts to manage exposures to currency
risk and price risk, including foreign exchange forward contracts and options. Hence, the
Sub-Funds are also exposed to the risk that amounts held with counterparties for derivative
contracts may not be recoverable in the event of any default by the parties concerned.

Pi Global Portfolios
Financial statements
Year ended 31 March 2018
FS17
(d) Fair value estimation
Except for investments which are measured at fair value, at 31 March 2018 and 2017, the fair
values of assets and liabilities approximate their carrying values on the Statements of
Financial Position due to their short period to maturity.
The fair value of financial assets and liabilities traded in active markets (such as publicly
traded derivatives and securities) are based on quoted market prices at the close of trading on
the reporting date. The quoted market price used for financial assets held by the Sub-Funds
is the current last traded price; the appropriate quoted market price for financial liabilities is
the current asking price. When the Sub-Funds hold derivatives with offsetting market risks,
they use mid-market prices as a basis for establishing fair values for the offsetting risk
positions and applies this bid or asking price to the net open position, as appropriate.
The Sub-Funds classify fair value measurements using a fair value hierarchy that reflects the
significance of the inputs used in making the measurements. The fair value hierarchy has the
following levels:
• Quoted prices (unadjusted) in active markets for identical assets or liabilities (Level 1).
• Inputs other than quoted prices included within level 1 that are observable for the asset
or liability, either directly (that is, as prices) or indirectly (that is, derived from prices)
(Level 2).
• Inputs for the asset or liability that are not based on observable market data (that is,
unobservable inputs) (Level 3).
The following table analyses within the fair value hierarchy the Sub-Funds’ financial assets
and liabilities (by class) measured at fair value at 31 March 2018 and 2017:
Level 1 Level 2 Level 3 Total
S$ S$ S$ S$
Pi-5 Global Portfolio
2018
Assets
Quoted funds 27,332,892 – – 27,332,892
2017
Assets
Quoted funds 31,600,729 – – 31,600,729
Pi-7 Global Portfolio
2018
Assets
Quoted funds 21,982,055 – – 21,982,055
2017
Assets
Quoted funds 24,268,236 – – 24,268,236

Pi Global Portfolios
Financial statements
Year ended 31 March 2018
FS18
10 Related parties
In the normal course of business of the Sub-Funds, management fees and trustee fees have been
paid or are payable to the Manager and the Trustee respectively as noted in the Statements of
Total Return.
In addition, the bank holding company and related parties of the Trustee have also provided
custodian, banking, foreign exchange, fund administration and brokerage services to the
Sub-Funds in the normal course of business at terms agreed between the parties and within the
provisions of the Trust Deed.
The Manager may also use the services of related parties to carry out transactions involving the
purchase and sale of securities.
Except as disclosed elsewhere in the financial statements, the following significant transactions
took place between the Sub-Funds and their related parties during the year:
Pi-5 Global Portfolio Pi-7 Global Portfolio
Note 2018 2017 2018 2017
S$ S$ S$ S$
Interest income received from
a related party of the Trustee 55 50 55 50
Bank balances held with a
related party of the Trustee 4 561,287 1,180,039 2,022,493 1,107,504
Amounts held with a related
party of the Manager 4 100,113 100,062 100,112 100,062
11 Financial ratios Pi-5 Global Portfolio Pi-7 Global Portfolio
2018 2017 2018 2017
Expense ratio
Total operating expenses S$ 495,775 608,737 396,672 488,074
Average daily net asset value S$ 30,048,266 36,691,060 23,580,844 29,081,789
Prorated expense ratio of the
underlying funds (Note 1)
% 0.53 0.56 0.55 0.62
Expense ratio (Note 1)
% 2.18 2.22 2.23 2.30
Turnover ratio
Lower of total value of
purchases or sales S$ 3,674,098 16,978,466 3,708,315 13,918,420
Average daily net asset value S$ 30,048,266 36,691,060 23,580,844 29,081,789
Turnover ratio (Note 2)
% 12.23 46.27 15.73 47.86
Pi Global Portfolios
Financial statements
Year ended 31 March 2018
FS19
Note 1: The expense ratio has been computed based on the guidelines laid down by the IMAS.
The calculation of the expense ratio is based on total operating expenses divided by
the average net asset value for the year.
The total operating expenses do not include (where applicable) brokerage and other
transactions costs, performance fee, interest expense, distribution paid out to
unitholders, foreign exchange gains/losses, front or back end loads arising from the
purchase or sale of other funds and tax deducted at source or arising out of income
received. The Sub-Funds do not pay any performance fee. The average net asset value
is based on the daily balances.
In the case of funds of funds, which are generally defined as funds with more than
50% of their total assets in other underlying funds, a summarised expense ratio of the
target funds and the fund of funds is to be calculated as of the closing date of the
financial year. This corresponds to the sum of:
• The prorated ratio of the individual target funds, weighted according to the share
they represent in the assets of the fund of funds as of the closing date, and the
• Expense ratio of the fund of funds minus any rebates of management fees and
commissions received from the target funds during the reporting period.
Note 2: The turnover ratio is calculated in accordance with the formula stated in the Code. The
calculation of the turnover ratio is based on the total value of purchases (or sales) of the
underlying investments divided by the weighted average daily net asset value. The total
value of purchase (or sales) do not include brokerage and other transaction cost.

Pi Global Portfolios
FS20
IMPORTANT INFORMATION Phillip Pi-5 Global Portfolio and Phillip Pi-7 Global Portfolio (the “Sub-Funds”) are sub-funds of Pi Global Portfolios (the "Fund"), an open-ended umbrella unit trust authorised under the Securities and Futures Act, Chapter 289, by the Monetary Authority of Singapore. This document is published by Phillip Capital Management (S) Ltd, the manager of the Fund (the “Manager”), for information only and it does not constitute a prospectus nor form part of any offer or invitation to subscribe for or to purchase, or solicitation of any offer to subscribe for or to purchase, any units in the Sub-Funds. All applications for units in the Sub-Funds must be made on the application forms accompanying the latest prospectus of the Fund (the “Prospectus”). The information and opinions contained in this document have been obtained from public sources which the Manager believes to be reliable and accurate. However, no representation or warranty, express or implied, is made as to the fairness, accuracy, completeness or correctness of the information and it should not be relied upon as such. Opinions included herein constitute the judgement of the Manager at the time specified and may be subject to change without notice, they are not to be relied upon as authoritative or taken in substitution for the exercise of judgment by any recipient and are not intended to provide the sole basis of evaluation of any investment. Neither the Manager nor the Fund, nor any of their respective associates, directors, officers or employees, accepts any liability whatsoever for any loss arising directly or indirectly from any use of this document or any information contained herein. Given the economic and market risks, there can be no assurance that the Sub-Funds will achieve their investment objectives. Investments in the Sub-Funds are not deposits or other obligations of, or guaranteed, or insured by the Manager or the distributors or their affiliates and are subject to investment risks, including the possible loss of the full principal amount invested. Returns may be affected by, among other things, the investment strategies or objectives of the Sub-Funds and material market and economic conditions. The value of the units and the income from them can fall as well as rise. Past performance is not necessarily indicative of the future performance of the Sub-Funds. This document should not be taken as a recommendation to buy or sell since it does not take into account the specific investment objectives, financial situation and the particular needs of any particular recipient of this document. Investors should seek advice from a financial advisor before purchasing units in the Sub-Funds. In any case, investors should read the Prospectus and consider the risks as well as suitability of the Sub-Funds before deciding whether to subscribe for units in the Sub-Funds. Copies of the Prospectus may be obtained from the Manager.