pide working papers 2007:30 paper/workingpaper-30.pdf · people lacked access to safe drinking...
TRANSCRIPT

PIDE Working Papers 2007:30
Delivering Access to Safe Drinking Water and Adequate Sanitation
in Pakistan
Faheem Jehangir Khan Pakistan Institute of Development Economics, Islamabad
and
Yaser Javed
Quaid-i-Azam University, Islamabad
PAKISTAN INSTITUTE OF DEVELOPMENT ECONOMICS ISLAMABAD

2
All rights reserved. No part of this publication may be reproduced, stored in a retrieval system or transmitted in any form or by any means—electronic, mechanical, photocopying, recording or otherwise—without prior permission of the author(s) and or the Pakistan Institute of Development Economics, P. O. Box 1091, Islamabad 44000.
© Pakistan Institute of Development Economics, 2007.
Pakistan Institute of Development Economics Islamabad, Pakistan E-mail: [email protected] Website: http://www.pide.org.pk Fax: +92-51-9210886
Designed, composed, and finished at the Publications Division, PIDE.

ABSTRACT
Provision of safe drinking water, adequate sanitation and personal hygiene are vital for the sustainable environmental conditions and reducing the incidence of diarrhoea, malaria, trachoma, hepatitis A & B and morbidity levels. Not having access to water and sanitation is a courteous expression for a form of deprivation that threatens life, destroys opportunity and undermines human dignity. Thus, investing in the provision of safe water supply and adequate sanitation is not only a development oriented strategy in itself, it can also yield other socio-economic benefits in terms of improved health status, quality of labour force and reduced burden-of-disease.
Water and Sanitation is the neglected sector in Pakistan. Most of the households in Pakistan do not have access to safe drinking water and lack toilets and adequate sanitation systems. These poor people, mostly living in rural areas or urban slums, are not only deprived of financial resources, but they also lack admittance to basic needs such as education, health, safe water supply and environmental sanitation facilities. As of 2005, approximately 38.5 million people lacked access to safe drinking water source and approximately 50.7 million people lacked access to improved sanitation in Pakistan. By year 2015, if this trend continues, 52.8 million people will be deprived of safe drinking water and 43.2 million people will have no access to adequate sanitation facilities in Pakistan. It is not to calculate what percentages of population have access to a particular service so far and how much numbers of beneficiaries will be added by year 2015; it is to investigate that even if we meet the national and/or regional targets in Pakistan, how much population will still be deprived of these most basic human needs.
JEL classification: C12, C13, C92, E61, E62, G18, H54, I18, I38, O11,
O18, C82 Keywords: Drinking Water, Sanitation, Solid Waste, Waste Water,
Public Policy, Public Expenditure, Hygiene

ABBREVIATIONS
ADB Asian Development Bank AJK Azad Jamu Kashmir CCB Citizen Community Boards CDWI Clean Drinking Water Initiative CRPRID Center for Poverty Reduction & Income Distribution DTCE Devolution Trust for Community Empowerment EAD Economic Affairs Division EPA Environmental Protection Agency FANA Federally Administered Northern Areas FATA Federally Administered Tribal Areas GDP Gross Domestic Product HDR Human Development Report MDGs Millennium Development Goals MICS Multiple Indicator Cluster Survey MIMAP Micro Impact of Macroeconomic Policies M&E Monitoring and Evaluation MTDF Medium Term Development Framework NGOs Non Government Organizations NIPS National Institute of Population Studies NWFP North West Frontier Province O&M Operation and Maintenance PCRWR Pakistan Council for Research in Water Resources PIHS Pakistan Integrated Household Survey PRSP Poverty Reduction Strategy Paper PSLM Pakistan Social Living Measurement TMA Tehsil/Town Municipal Administration UN United Nation UNDP United Nation Development Programme UNICEF United Nations Children’s Fund WASA Water and Sanitation Authority WATSAN Water & Sanitation WHO World Health Organisation

C O N T E N T S
Page
Abstract vii
Abbreviations ix 1. Introduction 1
2. Research Focus 2
3. Literature Overview 3
3.1. WATSAN and Hygiene Links to Health 4
3.2. WATSAN Quantity and Quality Issues 6
3.3. Income and Consumption Effects 9
3.4. Water Consumption Pattern 10
3.5. WATSAN and the Millennium Development Goals 12
3.6. Neglected Sub-sectors 13
4. Public Policy Review—Pakistan 14
4.1. National Drinking Water Policy 15
4.2. National Sanitation Policy 19
4.3. National Environment Policy 22
5. WATSAN Status and Delivering Access 23
5.1. Global Water Status Review 23
5.2. Delivering Access to WATSAN in Pakistan 27
6. Financing the WATSAN Sector 29
6.1. Global Perspective 30
6.2. Government Spending on WATSAN in Pakistan 31
7. Research Analysis—Linking Access to Public Sector Expenditure 33
Scenario 1: Actual Elasticity 35 Scenario 2: Actual Elasticity at 0.1 Change 37 Scenario 3: Actual Elasticity at 0.2 Change 38 Scenario 4: Constant Elasticity at 0.1 39 Scenario 5: Constant Elasticity at 0.3 40
6
Page 8. Findings and Policy Implications 42
References 45
List of Tables
Table 1: Main Source of Drinking Water by Province and Region 28
Table 2: Type of Toilet Used by Household by Province and Region 29
List of Figures
Figure 1: Main Pathways of Human Exposure to Pathogens in the
Aquatic Environment 5
Figure 2: Percentage of the World’s Population with Different Water
Availability (2000) 7
Figure 3: Water Availability versus Population Growth 7
Figure 4: Percentage of Population by Type of Access to Water
(2000) 8
Figure 5: Percentage of Population by Type of Access to Sanitation
(2000) 8
Figure 6: Consumption and Income Effects 10
Figure 7: Competing Water Users (2003) 11
Figure 8: Water Consumption versus Travel Time 11
Figure 9: Share of Organic Water Pollutants by Industrial Sector
(1990s) 14
Figure 10: Population with no Access to Improved Water (Million) 23
Figure 11: Population with no Access to Improved Water Source
(1990–2004) 24
Figure 12: Population with no Access to Improved Sanitation (Million) 25
Figure 13: Population with no Access to Improved Sanitation (1990–
2004) 26
Figure 14: Government Expenditure on Military, Health & WATSAN 30

7
Page Figure 15: Total Government Spending on WATSAN 31
Figure 16: Share in Government Spending on WATSAN 32
Figure 17: Government Spending on WATSAN as % GDP 32
Figure 18: Scenario 1: Water Access Projections 35
Figure 19: Scenario 1: Sanitation Access Projections 36
Figure 20: Scenario 2: Water Access Projections 37
Figure 21: Scenario 2: Sanitation Access Projections 38
Figure 22: Scenario 3: Water Access Projections 38
Figure 23: Scenario 3: Sanitation Access Projections 39
Figure 24: Scenario 4: Water Access Projections 40
Figure 25: Scenario 4: Sanitation Access Projections 40
Figure 26: Scenario 5: Water Access Projections 41
Figure 27: Scenario 5: Sanitation Access Projections 41
List of Boxes
Box 1: Key Targets of the National Drinking Water Policy 17
Box 2: Key Targets of the National Sanitation Policy 22


1. INTRODUCTION
As of 2004, 1.1 billion people lack access to improved water sources and 2.6 billion people lack access to improved sanitation, which represents 17 percent and 42 percent of the world’s population respectively. Not having access to water and sanitation (WATSAN) is a courteous expression for a form of deprivation that threatens life, destroys opportunity and undermines human dignity. Being without access to safe water means that people resort to ditches, rivers and lakes polluted with human and/or animal excrement or used by animals. It also means not having sufficient water to meet even the most basic human needs.
Pakistan is the sixth largest country in the world by population. As of 2005, it has a population of 153.4 million, which represents 2.36 percent of the world’s population, with a density of more than 190 persons per square kilometer. By the year 2025, the population of Pakistan would raise to 228.8 million and 295 million by 2050.1 This increase in population will have direct impact on the water sector for meeting the domestic, industrial and agricultural needs. Pakistan has now essentially exhausted its available water resources and is on the verge of becoming a water deficit country. Of the total annual water resources available to Pakistan, approximately 6 percent is used by the domestic and industrial sector—of which 30 to 40 percent gets wasted—and the remaining 94 percent is used for irrigation purposes. The per capita water availability has dropped from 5600 cubic meter in 1952 to 1200 cubic meter in 2003 and if immediate action will not be taken, the per capita water availability would decrease to less than 1000 cubic meter by year 2012. The quality of ground water and surface water is low and is further deteriorating because of unchecked disposal of untreated municipal and industrial waste-water and excessive use of fertilisers and insecticides.
WATSAN is the neglected sector in Pakistan. The government spending in the WATSAN sector is lowest comparing to other social sectors’ spending. The total public sector budgetary expenditure on WATSAN sector is slightly increasing over time. As percentage of the GDP, the share has improved to only 0.13 percent from 0.12 percent of the GDP in last five years, i.e. after becoming a signatory to the United Nations’ Millennium Declaration in the year 2000; the progress was just of 0.01 percent of GDP between 2000-01 and 2004-05. This demonstrates how much the public sector is committed to invest in the WATSAN sector.
The current study considers the redefined improved facility concept underlining improved access to safe water source and hygiene levels in
1Population Reference Bureau (2006).
2
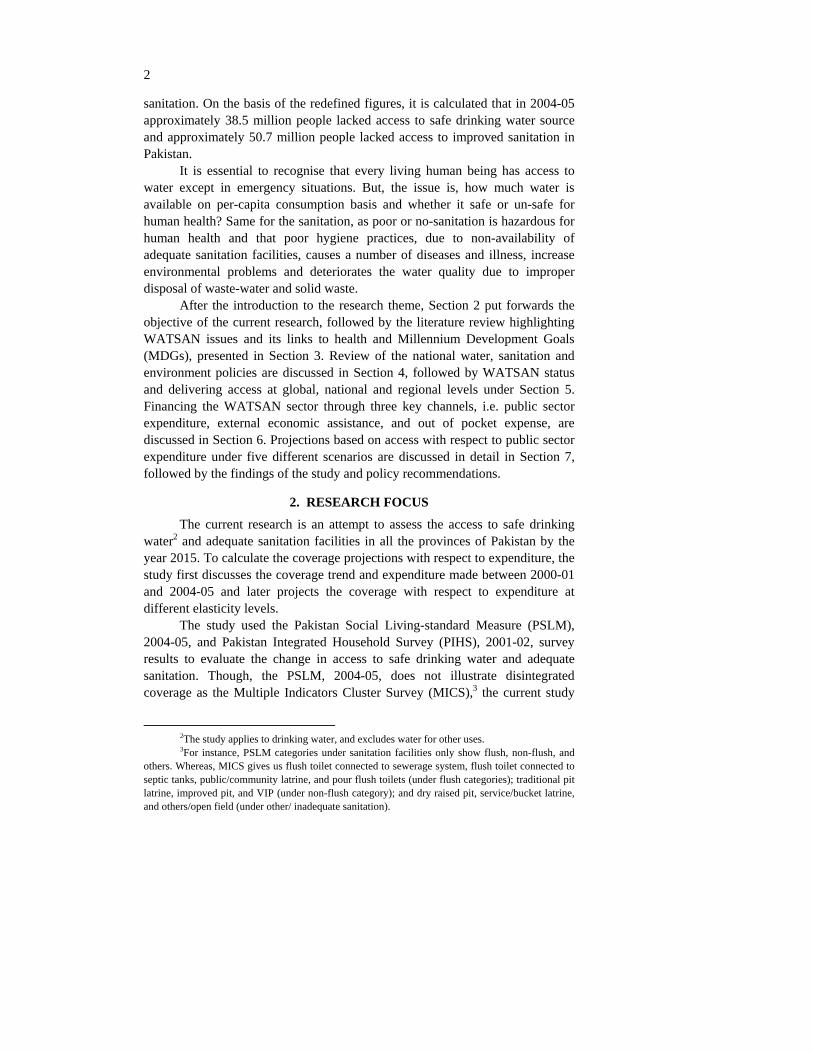
sanitation. On the basis of the redefined figures, it is calculated that in 2004-05 approximately 38.5 million people lacked access to safe drinking water source and approximately 50.7 million people lacked access to improved sanitation in Pakistan.
It is essential to recognise that every living human being has access to water except in emergency situations. But, the issue is, how much water is available on per-capita consumption basis and whether it safe or un-safe for human health? Same for the sanitation, as poor or no-sanitation is hazardous for human health and that poor hygiene practices, due to non-availability of adequate sanitation facilities, causes a number of diseases and illness, increase environmental problems and deteriorates the water quality due to improper disposal of waste-water and solid waste.
After the introduction to the research theme, Section 2 put forwards the objective of the current research, followed by the literature review highlighting WATSAN issues and its links to health and Millennium Development Goals (MDGs), presented in Section 3. Review of the national water, sanitation and environment policies are discussed in Section 4, followed by WATSAN status and delivering access at global, national and regional levels under Section 5. Financing the WATSAN sector through three key channels, i.e. public sector expenditure, external economic assistance, and out of pocket expense, are discussed in Section 6. Projections based on access with respect to public sector expenditure under five different scenarios are discussed in detail in Section 7, followed by the findings of the study and policy recommendations.
2. RESEARCH FOCUS
The current research is an attempt to assess the access to safe drinking water2 and adequate sanitation facilities in all the provinces of Pakistan by the year 2015. To calculate the coverage projections with respect to expenditure, the study first discusses the coverage trend and expenditure made between 2000-01 and 2004-05 and later projects the coverage with respect to expenditure at different elasticity levels.
The study used the Pakistan Social Living-standard Measure (PSLM), 2004-05, and Pakistan Integrated Household Survey (PIHS), 2001-02, survey results to evaluate the change in access to safe drinking water and adequate sanitation. Though, the PSLM, 2004-05, does not illustrate disintegrated coverage as the Multiple Indicators Cluster Survey (MICS),3 the current study
2The study applies to drinking water, and excludes water for other uses. 3For instance, PSLM categories under sanitation facilities only show flush, non-flush, and
others. Whereas, MICS gives us flush toilet connected to sewerage system, flush toilet connected to septic tanks, public/community latrine, and pour flush toilets (under flush categories); traditional pit latrine, improved pit, and VIP (under non-flush category); and dry raised pit, service/bucket latrine, and others/open field (under other/ inadequate sanitation).

3
adopts the PSLM as it is the latest survey done over the same period of time all over Pakistan; which in the case of MICS is not considerable. The MICS was done in all the four provinces by their respective Planning and Development Departments in collaboration with the United Nations Children’s Fund (UNICEF). The NWFP government conducted and published MICS in 2001, Punjab in 2003-04, and Balochistan in 2004 and Sindh conducted its survey in 2003-04; however, the draft report still has to be approved. Furthermore, the study adopts the redefining improved facility method and used the redefined figures for research analysis.
Pakistan Poverty Reduction Strategy Papers (PRSP) public sector budgetary expenditure data4 was used to analyse the public spending on the WATSAN sector between 2000-01 and 2004-05. The hard data on public sector expenditure was collected from the PRSP annual reports.
To project the coverage with respect to public sector expenditure by the year 2015, the proposition was made that with the change in expenditure to a specific sector, how much the access to a particular service would change, whereas the access should decline due to increasing population providing constant expenditure value. Detailed methodology and results will be discussed under Section 7 (i.e. linking access to public expenditure).
3. LITERATURE REVIEW
A comprehensive review of WATSAN literature, research materials, articles and evaluation reports is done to assess the existing situation and policy debate. This includes documents and reports available from WHO, UNICEF, ADB, World Bank, UNDP, CRPRID, Ministry of Environment, PCRWR, and other relevant government and non-government departments.
It is a well recognised fact that the provision of safe drinking water, adequate sanitation and personal hygiene are vital for the sustainable environmental conditions and reducing the incidence of diarrhoea, malaria, trachoma, hepatitis A & B and morbidity levels.
A direct relationship exists between water, sanitation, health, nutrition, natural environment and human well-being. We are made of water, more or less: 70 percent of our tissues and 55 percent of our blood; moreover, two-third of the planet’s surface is covered by water. Thus to control water is to control life. Consumption of contaminated drinking water, improper disposal of human excrete, lack of personal and food hygiene and improper disposal of solid and liquid waste have been the major causes of many diseases in developing countries.5
4The PRSP data provides the overall expenditure on the human resource development activities and these have been broken down by the provinces and by current and development expenditures.
5Sanitation in India (2006).

4
3.1. WATSAN and Hygiene Links to Health
I often refer to it as ‘Health 101’, which means that once we can secure access to clean water and to adequate sanitation facilities for all people, irrespective of the difference in their living conditions, a huge battle against all kinds of diseases will be won.
—Lee Jong-wook, Director-General, World Health Organisation
Disease is usually to do with poor hygiene and failure to confine wastes
containing dangerous bacteria. Safe disposal of excreta and hygienic behaviours are essential for the dignity, status and well-being of every person, be they rich or poor, irrespective of whether they live in rural areas, small towns or urban centres. The available literature on the health, impact of safe drinking water and environmental sanitation indicates that access to piped water and presence of latrine in a household have direct benefits of lowering infant and child mortality and reducing exposure to water-borne diseases.6
According to the World Health Organisation (WHO),7 1.8 million people die every year from diarrhoeal diseases (including cholera); 90 percent are children under 5, mostly in developing countries. 88 percent of diarrhoeal disease is attributed to unsafe water supply, inadequate sanitation and hygiene. 1.3 million people die of malaria each year, 90 percent of whom are children under 5. An estimated 160 million people are infected with schistosomiasis.8 500 million people are at risk from trachoma.9 133 million people suffer from high intensity intestinal helminths infections (i.e. ascariasis, trichuriasis, hookworm) disease, which often leads to severe consequences such as cognitive impairment, massive dysentery, or anaemia. And, there are 1.5 million cases of clinical hepatitis A every year.
Hygiene interventions in the WATSAN sector,10 including hygiene education and promotion of hand washing, can lead to: a reduction of diarrhoeal cases by up to 45 percent; improvements in drinking-water quality through household water treatment, such as chlorination at point of use, can lead to a reduction of diarrhoea episodes by 35 to 39 percent; better management of water resources reduces transmission of malaria and other vector-borne diseases; basic sanitation reduces the schistosomiasis disease by up to 77 percent; and,
6PIDE-UNICEF (2002). 7WHO (2004). 8Schistosomiasis causes tens of thousands of deaths every year, mainly in sub-Saharan
Africa. It is strongly related to unsanitary excreta disposal and absence of nearby sources of safe water.
9The disease is strongly related to lack of face washing, often due to absence of nearby sources of safe water.
10WHO (2004).

5
improving access to safe water sources and better hygiene practices can reduce trachoma morbidity by 27 percent.
The classical mechanisms of transmission of waterborne diseases are poor personal hygiene, described as the short cycle (excreta -> hand -> mouth), and environmental pollution, described as the long cycle (see Figure 1).11 Typically, physical investments in community sanitation most effectively break the long cycle. Breaking the short cycle requires changes in personal behaviours and practices, which present a more difficult challenge.
Fig. 1. Main Pathways of Human Exposure to Pathogens in the Aquatic Environment
Source: Bosch, et al. (2002).
Everyday, everyone needs water, be they rich and/or poor, defecates and urinates daily. But where it takes place has a significant impact on family health. Households with private toilets have measurably lower morbidity rates than households without. Private toilets benefit not only the household but also neighbours who gain protection from the household’s feces. The poor and their neighbours, especially living in rural or non-/under-served areas, often lack private toilets, forcing defecation in public spaces, leaving them more vulnerable than the non-poor to communicable diseases.
11Bosch, et al. (2002).
Fish Shellfish
Drinking Water
Coastal and Surface Water
Surface and Ground Water
Excreta Sewage
People Crops
Plants
Soil
Consumption Consumption
Contact
Direct Contact
Pathogen Excretion
Discharge Discharge Infiltration
Irrigation
Trea
tmen
t Short Cycle
Long Cycle

6
In 1994, a study carried out in Rawalpindi Division (Pakistan), 12 showed that 81,996 cases of water-related diseases were registered in Basic Health Units. According to the United Nations Children’s Fund (UNICEF), 20 to 40 percent beds are occupied in the hospitals of Pakistan by patients suffering from water-related diseases. Diseases such as cholera, typhoid, dysentery, hepatitis, giardiasis, and cryptosporidiosis and guinea worm infections are about 80 percent (including diseases due to sanitation problem) of all diseases and are responsible for 33 percent of deaths in Pakistan.
Key physical improvements in the provision of the WATSAN services could influence health outcomes. For example, increasing the quantity of water could effect on better hygiene (i.e. hand washing); improving the quality of water could effect on reduced ingestion of pathogen; providing means of safe excreta disposal could effect on reducing the number of pathogens in the environment, and finally, all these outcomes would result in reducing infant/child mortality and morbidity. 3.2. WATSAN—Quantity and Quality Issue
It is essential to recognise that every human being living on this planet earth has access to water except in emergency situations. But, the issue is, how much water is available on per-capita consumption basis and whether it safe or un-safe for human health? Same for the sanitation, as poor or no-sanitation is dangerous for human health and that poor hygiene practices, due to non-availability of adequate sanitation facilities, cause a number of diseases and illness, increase environmental problems and deteriorates the water quality due to improper disposal of waste-water and solid waste.
Water quality issues are on the top, in developing countries, followed by air pollution, solid waste and waste water disposal. With the passage of time, quantity of water is becoming scarce and the quality is deteriorating due to urbanisation, industrialisation, deforestation, land degradation, global warming, increasing of population, and diversified domestic uses. It is estimated 13 that in Pakistan around 30 and 40 percent diseases and deaths are attributed to poor water quality respectively. Water quality is linked to the density of population, where population is dense it is susceptible to have more pollution. In Karachi only, more than 10,000 people die annually of renal infection; due to the polluted drinking water.
Figure 2 shows the sufficiency and insufficiency (quantity) availability of water to the world’s population. Only 33 percent (16.7 relatively sufficient and 16.3 plentiful) of the total world’s population has sufficient access to water against 34.7 percent insufficient access, 24.5 percent facing water stress, and 7.8 percent world’s population is under water scarcity.14
12Tahir, et al. (1994). 13PCRWR (2005). 14Clarke and King (2004).

7
Figure 2: Percentage of the World's Population with Different Water Availability
(2000)
Plentiful, 16.3
Relatively sufficient,
16.7
Insufficient water, 34.7
Water s tress, 24.5
Water scarcity, 7.8
Plentiful Relatively sufficient Insufficient water
Water stress Water scarcity
Source: Robin Clarke and Jannet King (2004).
In Pakistan, per capita water availability and population growth shows
inverse relation (see Figure 3).15 In 1951, the per capita water availability was 5650 cubic meter as the population was 33.7 million. By 1972, the population almost got double and the per capita water availability shows the contrary trend (i.e. decreased to 2800 cubic meter). By the year 1992, Pakistan entered into the water stress country and if immediate actions will not be taken the per capita water availability would decrease to less than 1000 cubic meter by 2012.
Figure 3: Water Availability versus Population Growth
0
1000
2000
3000
4000
5000
6000
1951 1961 1972 1981 1992 2000 2003 2012 2020
per c
apita
wat
er a
vaila
bilit
y (p
er c
ubic
met
er)
0
50
100
150
200
250
Popu
latio
n (m
illio
n)
Water availability Population
15PCRWR (2002).
Fig. 2. Percentage of the World’s Population with Different Water Availability (2000)
Fig. 3. Water Availability versus Population Growth

8
Increasing population density, rapid urban development, deforestation, and other physical-infrastructure developments have had damaged our natural environment – causing pollution and deteriorating water quality. Traditionally, our elders used to take water from streams and open wells. Today, these are unsafe or unimproved. 16 At present, 36 percent population in Africa, 19 percent in Asia and 13 percent in Latin America and Caribbean, has access to unimproved water source (see Figure 4).
Source: UNICEF, State of the World’s Children (2004).
Disease is usually to do with poor hygiene and failure to confine wastes
containing dangerous bacteria. Adequate sanitation facilities directly affect the health status of an individual and/or a household. At present, 40 percent population in Africa, 52 percent in Asia and 22 percent in Latin America and Caribbean has access to unimproved sanitation facilities (see Figure 5), whereas, only 13 percent population in Africa and 18 percent in Asia has access to improved sanitation facilities, i.e., sewage connection.
Source: UNICEF, State of the World’s Children (2004).
16Improved sources include: household taps, standpipes, hand pumps, encased wells and
springs, rain-water collection systems, all required construction and maintenance.
Fig. 4. Percentage of Population by Type of Access to Water (2000)
24
40
19
49
32
1321
36
66
0
15
30
45
60
75
Unimproved water Improved water(Household connection)
Improved water (Otheraccess)
Africa Asia Latin America & Caribbean
Fig. 5. Percentage of Population by Type of Access to Sanitation (2000)
40
13
47
18
30
22
49
29
52
0 10 20 30 40 50 60
Unimproved sanitation Improved sanitation(Sewage connection)
Improved sanitation (Otheraccess)
Africa Asia Latin America & Caribbean
9
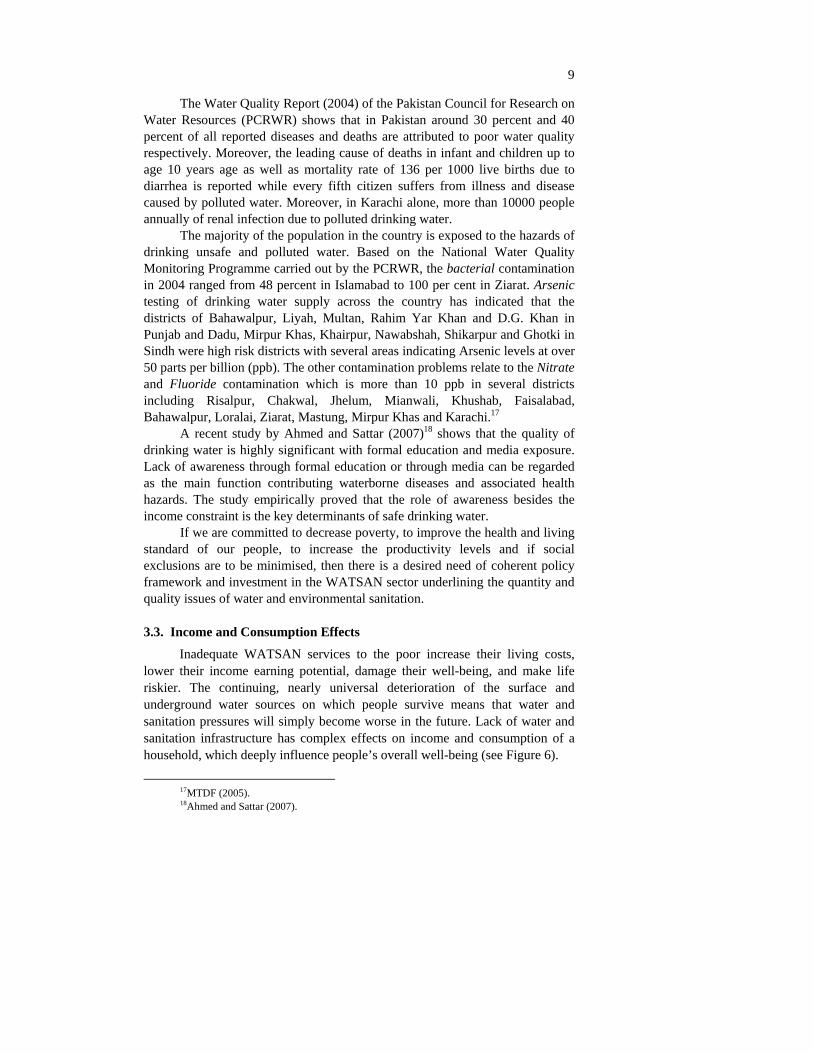
The Water Quality Report (2004) of the Pakistan Council for Research on Water Resources (PCRWR) shows that in Pakistan around 30 percent and 40 percent of all reported diseases and deaths are attributed to poor water quality respectively. Moreover, the leading cause of deaths in infant and children up to age 10 years age as well as mortality rate of 136 per 1000 live births due to diarrhea is reported while every fifth citizen suffers from illness and disease caused by polluted water. Moreover, in Karachi alone, more than 10000 people annually of renal infection due to polluted drinking water.
The majority of the population in the country is exposed to the hazards of drinking unsafe and polluted water. Based on the National Water Quality Monitoring Programme carried out by the PCRWR, the bacterial contamination in 2004 ranged from 48 percent in Islamabad to 100 per cent in Ziarat. Arsenic testing of drinking water supply across the country has indicated that the districts of Bahawalpur, Liyah, Multan, Rahim Yar Khan and D.G. Khan in Punjab and Dadu, Mirpur Khas, Khairpur, Nawabshah, Shikarpur and Ghotki in Sindh were high risk districts with several areas indicating Arsenic levels at over 50 parts per billion (ppb). The other contamination problems relate to the Nitrate and Fluoride contamination which is more than 10 ppb in several districts including Risalpur, Chakwal, Jhelum, Mianwali, Khushab, Faisalabad, Bahawalpur, Loralai, Ziarat, Mastung, Mirpur Khas and Karachi.17
A recent study by Ahmed and Sattar (2007)18 shows that the quality of drinking water is highly significant with formal education and media exposure. Lack of awareness through formal education or through media can be regarded as the main function contributing waterborne diseases and associated health hazards. The study empirically proved that the role of awareness besides the income constraint is the key determinants of safe drinking water.
If we are committed to decrease poverty, to improve the health and living standard of our people, to increase the productivity levels and if social exclusions are to be minimised, then there is a desired need of coherent policy framework and investment in the WATSAN sector underlining the quantity and quality issues of water and environmental sanitation. 3.3. Income and Consumption Effects
Inadequate WATSAN services to the poor increase their living costs, lower their income earning potential, damage their well-being, and make life riskier. The continuing, nearly universal deterioration of the surface and underground water sources on which people survive means that water and sanitation pressures will simply become worse in the future. Lack of water and sanitation infrastructure has complex effects on income and consumption of a household, which deeply influence people’s overall well-being (see Figure 6).
17MTDF (2005). 18Ahmed and Sattar (2007).

10
Fig. 6. Consumption and Income Effects
Source: Bosch, et al. (2002).
The lack of water infrastructure for the poor tend them to buy water from water-vendors at high per litre prices, walking long distances and waiting in long queues at public sources, and/or incurring additional costs for storing and boiling water. This lack of suitable and affordable access to water reduces a poor household’s consumption of other commodities and services, leaves it consuming less than the optimum amount of water for good hygiene, and impacts health and labour productivity of the household members, hence, reducing income-generating opportunities of the household. The lack of sanitation infrastructure contributes in degradation of natural environment as well as more it pollutes surface and ground water, which may be fetched by another consumer. 3.4. Water Consumption Pattern
Growing populations, especially in developing countries, are an important factor in water stress. 500 million people were living in countries chronically short of water in 2000. By 2050, the number is expected to rise by 4 billion, around 40 percent of the world population. Consumption of water in industry, agriculture and domestic use is also rising. In 1900, around 350 cubic meter water was used per head; by 2000, this had risen to 642 cubic meter. 19 At present, agriculture remains much the highest user of water with a global
19Black (2004).

11
average of 70 percent, but industrial water use is much higher in higher-income countries and is proportionately rising (see Figure 7).
30
82
59
10
11
10
0
15
30
45
60
75
90
Per
cent
age
Agriculture Industrial Domestic
Figure 7: Competing Water Users (2003)
High-income countries Low-income countries
Source: Black (2004).
In rural areas of Pakistan, fetching water for cooking and drinking, mostly by women, involves lot of time and distance. Study 20 has shown that the distance to the water source from the house affects the volume of water consumed. For a water sources closer than 30 meters, usage increases, and for more than 1,000 meters, usage falls. Figure 8 shows this experience in terms of minutes required for a return trip to the water source. Distance matters, but so does queuing time. If users can walk 10 meters to a stand-post but then must wait an hour before use, they will collect no more water than someone travelling 200 meters to a stand-post who has no wait in line.
Figure 8: Water Consumption versus Travel Time
0
10
20
30
40
50
60
1 4 7 10 13 16 19 22 25 28 31 34 37 40 43 46
Return Travel Time (minutes)
Wat
er C
onsu
mpt
ion
(lcd
)
Source: Bosch, et al. (2002).
20DFID (1998), Guidance Manual on Water and Sanitation Programmes.
Fig. 7. Competing Water Users (2003)
Fig. 8. Water Consumption versus Travel Time

12
According to the UN study, “while the world population continues to surge, the availability of freshwater is on the decline and in the next two decades; many of the countries in South Asia, Middle East and Africa would face a crunch”.21 3.5. WATSAN and the Millennium Development Goals
We shall not finally defeat AIDS, tuberculosis, malaria, or any of the other infectious diseases that plague the developing world until we have also won the battle for safe drinking water, sanitation and basic health care.
Kofi Annan, United Nations Secretary-General
The Johannesburg World Summit on Sustainable Development
announced a wide range of commitments underlining WATSAN. The UN General Assembly announced the year 2003 as the International Year of Freshwater. Moreover, UN declares (2005-2015) Water for Life as the International Decade for Action and sets the world agenda on a greater focus on water-related issues.
At the UN Millennium Summit, in September 2000, world leaders affirmed their commitment to work on time-bound and measurable agenda envisaging goals and targets for combating poverty and hunger, disease, illiteracy, gender discrimination and environmental degradation.
WATSAN targets are specifically implanted under Goal 7 (ensure environmental sustainability), target 10 and 11, of the MDGs. Nevertheless, goal 4 (reduce child mortality), target 5, and goal 6 (combat HIV/AIDS, malaria and other diseases), target 8 also acknowledged by the debate under WATSAN sector development. By including water supply, sanitation and hygiene in the MDGs, the world community has acknowledged the importance of their promotion as development interventions and has set a series of goals and targets.
• Goal 7–Target 10: Halve by 2015, the proportion of people without sustainable access to safe drinking water and basic sanitation; proportion of the population with sustainable access to an improved water source.
• Goal 7–Target 11: Have achieved by 2020, a significant improvement in the lives of at least 100 million slum dwellers. Proportion of the population with access to adequate sanitation facilities; to halve by 2015, the proportion of the population who do not have access to basic sanitation.
21PCRWR.
13
• Goal 4–Target 5: Reduce by two-thirds, between 1990 and 2015, the under-five mortality rate.
• Goal 6–Target 8: Have halted by 2015 and begun to reverse the incidence of malaria and other major diseases.
As of 2004, global access to water shows that 1.1 billion people lack access to improved water sources, which represents 17 percent of the world’s population. In order to meet the (water supply) MDG target, an additional 260,000 people per day up to 2015 should gain access to improved water sources.22 Nevertheless, between 2002 and 2015, the world’s population is expected to increase every year by 74.8 million people.
Global access to sanitation, as of 2004, shows that 2.6 billion people lack access to improved sanitation, which represents 42 percent of the world’s population. In order to meet the sanitation MDG target and additional 370,000 people per day up to 2015 should gain access to improved sanitation. Today, 60 percent of the people living in developing countries, amounting to some 2.4 billion people, have no access to hygienic means of personal sanitation.
The necessity of achieving the MDGs for WATSAN cannot be overstated. Even if the MDG targets are achieved, there will still be more than 800 million people without water and 1.8 billion people without sanitation in 2015. But, before debating on these numbers, the 2015 MDG target deadline is approaching fast and it reminds us that time is running out; and that limited time is left for the policies, investments and execution needed to deliver outcomes. 3.6. Neglected Sub-sectors
Continuing urbanisation, growing populations and increasing industrialisation have increased water consumption and correspondingly generating higher volumes of waste-water and solid-waste. Untreated waste-water and poor solid-waste management are threats to human health and natural environment. Regrettably, the public and the private sectors, in developing countries including Pakistan, are giving insufficient attention to the waste-water treatment and solid waste management; which is causing severe environmental and health problems.
Most of the waste-water is not treated and with the expansion of urban settlements without waste-water-treatment facilities, it will continue to adversely impact the natural environment and public health. Worst impact is evident in areas which are close to industrial sites.
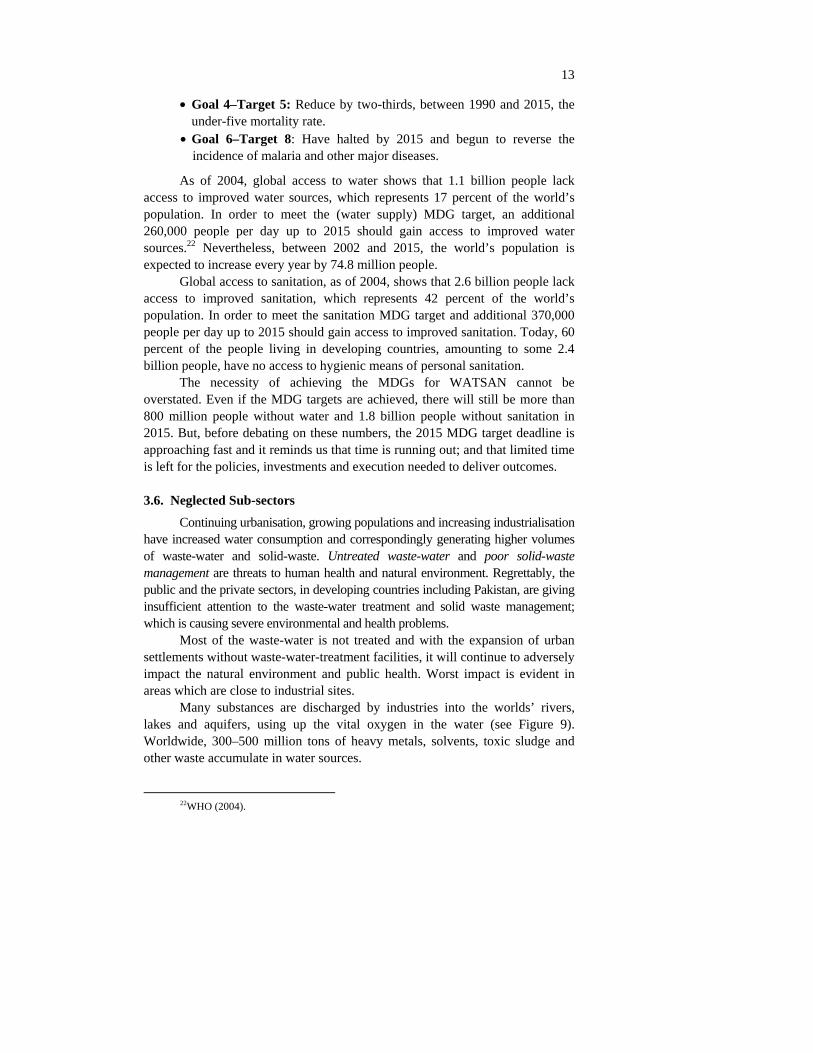
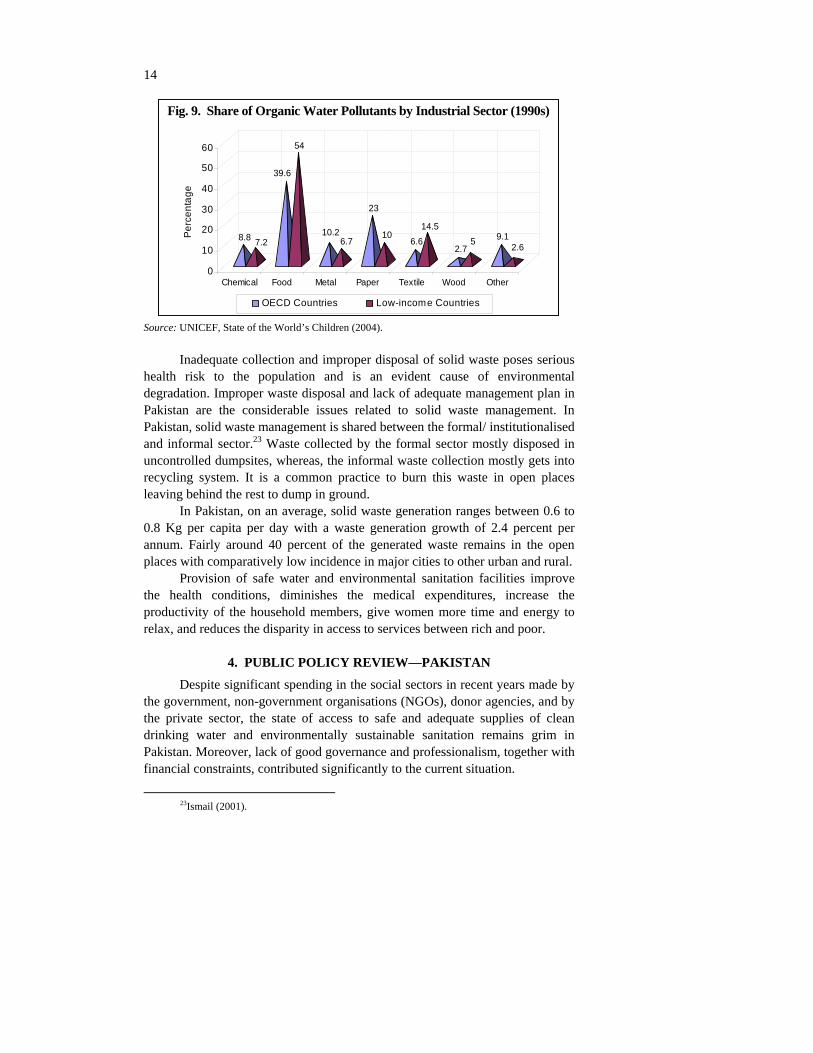
Many substances are discharged by industries into the worlds’ rivers, lakes and aquifers, using up the vital oxygen in the water (see Figure 9). Worldwide, 300–500 million tons of heavy metals, solvents, toxic sludge and other waste accumulate in water sources.
22WHO (2004).
14
8.8 7.2
39.6
54
10.26.7
23
106.6
14.5
2.75 9.1
2.6
0
10
20
30
40
50
60
Perc
enta
ge
Chemical Food Metal Paper Textile Wood Other
Figure 9: Share of Organic Water Pollutants by Industrial Sector (1990s)
OECD Countries Low-income Countries
Source: UNICEF, State of the World’s Children (2004).
Inadequate collection and improper disposal of solid waste poses serious health risk to the population and is an evident cause of environmental degradation. Improper waste disposal and lack of adequate management plan in Pakistan are the considerable issues related to solid waste management. In Pakistan, solid waste management is shared between the formal/ institutionalised and informal sector.23 Waste collected by the formal sector mostly disposed in uncontrolled dumpsites, whereas, the informal waste collection mostly gets into recycling system. It is a common practice to burn this waste in open places leaving behind the rest to dump in ground.
In Pakistan, on an average, solid waste generation ranges between 0.6 to 0.8 Kg per capita per day with a waste generation growth of 2.4 percent per annum. Fairly around 40 percent of the generated waste remains in the open places with comparatively low incidence in major cities to other urban and rural.
Provision of safe water and environmental sanitation facilities improve the health conditions, diminishes the medical expenditures, increase the productivity of the household members, give women more time and energy to relax, and reduces the disparity in access to services between rich and poor.
4. PUBLIC POLICY REVIEW—PAKISTAN
Despite significant spending in the social sectors in recent years made by the government, non-government organisations (NGOs), donor agencies, and by the private sector, the state of access to safe and adequate supplies of clean drinking water and environmentally sustainable sanitation remains grim in Pakistan. Moreover, lack of good governance and professionalism, together with financial constraints, contributed significantly to the current situation.
23Ismail (2001).
Fig. 9. Share of Organic Water Pollutants by Industrial Sector (1990s)

15
The existing WATSAN services in Pakistan are mostly the product of a top-down approach. The WATSAN schemes are often complex, expensive and unsustainable, with little consideration of community participation, hygiene promotion and environmental issues. Water quality is another staid issue that has further aggravated with the recent discovery of arsenic in certain areas. Keeping in view the unsatisfactory performance of the WATSAN sector, the policy thrust remains on improving the access and quality of services with a special focus on the coverage at the grass-root level.
4.1. National Drinking Water Policy
Water is a source of life creation and survival of mankind. However, it is the dilemma of our time that a major proportion of country’s population is deprived from safe drinking water. Reports of WHO and PCRWR revealed that the water supplied to the citizens of many parts of the country is contaminated and harmful for human health. This situation could lead to pressure on government’s health budget and on the poor’s out of pocket expenses.
The National Drinking Water Policy24 presents a framework addressing the key challenges and constraints facing Pakistan in delivering access to safe drinking water to the people of Pakistan.25 The policy highlights the constitutional responsibility of the provincial and local governments (town and tehsil municipal administration) to provide drinking water. The policy asserts provision of safe drinking water to the entire population at an affordable cost in an impartial, efficient and sustainable manner. It also ensures reduction in the incidence of mortality and morbidity caused by water borne diseases.
The objectives of the policy is to provide supportive ground and legal framework that could facilitates sustainable access to and provision of safe drinking water. The guiding principle underlines the right to water for drinking takes precedence over rights to water for all other uses, such as, environment, agriculture, industry, etc. The policy highlights that the existing inequalities in the provision of safe drinking water desires to be removed and ensures participation of the vulnerable and poor in decision-making for the sector at all levels; recognising the key role that women and community plays. Moreover, the document also provides a financial framework within which the provision of water supply can be undertaken in a cost-effective, equitable and sustainable manner and that water treatment will be an integral part of all drinking water supply schemes.
24Ministry of Environment (2003). 25The policy framework is intended to guide and support the provincial and district
governments in discharging their responsibilities. However, all administrative units will formulate their own strategies, plans and programmes underlining drinking water.

16
A set of policy instruments and strategies is also discussed to achieve the objectives of the drinking water policy. The core strategic thrust of the policy emphasises on:
(a) targeting strategy (b) legislative strategy (c) protection of water resources (d) institutional strategy (e) technical strategy (f) operation and maintenance (O&M) strategy (g) drinking water quality standards (h) water quality monitoring and surveillance (i) gender strategy (j) communication and dissemination strategy (k) financial strategy (l) monitoring and evaluation strategy (M&E), and (m) research strategy (for improved implementation and better outcomes).
The targeting strategy provides priority to un-served and under-served areas where there is a shortage of sweet water in the underground aquifers. Those areas will be especially targeted where women/children have to walk more than 0.5 kilometres to acquire access to (safe) drinking water. Moreover, the municipal authorities are held responsible to provide water to urban slums and katchi abadis in their respective jurisdiction.
The legislative strategy counsels the community participation in building more effective scheme identification, implementation, and operations and maintenance (O&M) system. Moreover, participation of the private sector, public-private partnership and the role of NGOs are encouraged. The strategy also put emphasis on regular review and updating of the drinking water policy after every five years.
The protection of water sources, both ground and surface water, which offers sustainable sources of supply for local communities in both urban and rural areas, is ensured in the national water policy.
The institutional strategy is set to strengthen the institutions and emphasises the role of service providers in the drinking water supply at federal, provincial and local government levels. The strategy bounds all the administrative units to develop medium term plans for the drinking water sector keeping the Medium Term Development Framework (MTDF) and the Millennium Development Goals (MDGs) in conjunction with relevant municipal authorities to steer future developments in the sector.

17
The technical strategy assures technical assistance to the provincial and
local government agencies. The approach also supports the Standard Operating Procedures (SOPs) for planning, design, implementation, and M&E for the various categories of the water supply schemes. The plan stresses to use material and parts of good quality in constructing drinking water schemes. A minimum distance is ensured to separate water mains and sewerage lines to avoid contamination of drinking water supply. The strategy also supports the Clean Drinking Water Initiative project by the federal government; providing water filtration plants at tehsil and union council levels.
Under the operations and maintenance (O&M) strategy, the Water and Sanitation Agencies (WASA) and Town Municipal Administration (TMA) are responsible for the O&M in urban areas, whereas, in rural areas TMA will only be responsible for the O&M of mechanised schemes. For small un-mechanised schemes in rural areas, the responsibility for the (routine) O&M is devolved to the intended beneficiaries; however, the TMA will be responsible for un-mechanised schemes rehabilitation in case of major breakdown.
The national water policy also highlights the issue of water quality. In this regard, the drinking water quality standards will be developed for Pakistan by the Ministry of Health using the WHO’s drinking water quality guidelines; which will be approved by the Cabinet and enforced though an act of the Parliament before 2007. Afterwards, it will come into immediate action in both urban and rural areas and the agencies (service providers) will ensure the quality standards. The policy also supports to penalise any vendor or supplier found to be providing water quality lower than the legislated quality standards.
Box 1. Key Targets of the National Drinking Water Policy
While each Provincial Government and District Government pursue their
own targets, the approach of the Federal Government is to facilitate the attainment of the targets mentioned in the MTDF align with the MDGs for the country as a whole. Specific targets entail the following:
I. To provide safe drinking water to 93 percent of the population by 2015 thereby raising the current coverage by almost 30 percent for the existing population and ensuring that the additional population is also provided access;
II. The technical specifications of schemes will be based on the provision of a minimum of 20 litres per capita per day for rural households and 40 litres per capita per day for urban areas;
III. To provide at least one hand pump or sport source for every 250 persons; IV. To establish district and tehsil level water filtration plants by 2007; V. To establish water treatment plants in all urban areas by the year 2015; and
VI. To ensure that water quality standards are approved and a system of surveillance, testing, monitoring and disseminating information regarding water quality is in place by 2007.

18
To enforce the water quality standards, the ministry of environment is responsible for water quality monitoring and surveillance at source and the Pakistan Quality Control Authority and PCRWR will be ensuring water quality standards though surveillance of water quality from different sources, including government schemes in urban areas, wells, hand pumps, bottled water, private vendors, etc. For this purpose, water testing laboratories will be established at the district level.
The policy also incorporates the gender strategy which mainly encouraged the females (the deprived group) to take part in decision-making at the district, tehsil and union council tiers. The strategy puts special efforts to recruit women in TMAs, EPA, and other relevant agencies to ensure that the needs of women clients are addressed.
Realising the need of fast information sharing and knowledge economy, the ministry of environment is held responsible for disseminating information on drinking water quality standards through articles in the national press, leaflets, newsletters and spreading information to schools, through NGOs, civil societies, and citizen community boards (CCBs).
Provision of water supply and sanitation services at affordable rates is promised in the financial strategy. Moreover, drinking water schemes are given highest priority in the allocation of funds to the Citizen Community Boards (CCBs) at local level. The federal government ensures additional resources and funds for the provision of water to the un-served and/or under-served areas. Moreover, the strategy encourages the providers to promote metering and revise current water tariffs (both for residential and commercial users) to discourage the indiscriminate use of water.
Monitoring and evaluation of the development projects is vital to calculate the outcomes at impact at grass root level. In this concern, at the federal level, ministry of environment will produce report on annual basis, i.e., State of Drinking Water in Pakistan, whereas, at provincial level, the local government department and WASAs will be responsible for monitoring the coverage of drinking water supply in rural and urban areas respectively.
The national water policy envisages undertaking pilot tests for new approaches and innovative ideas and arrangements in the drinking water sector, especially those which help to improve access, efficiency, effectiveness and sustainability under its research strategy. Clean Drinking Water Initiative
Clean Drinking Water Initiative (CDWI) taken on part by the federal government with the assistance of provincial and local governments with an objective to provide clean drinking water to the community at large. The assignment is in line with the following MDGs targets; set under world summit on sustainable development, 2002:

19
(a) Target 10a: Halve the proportion of people without sustainable access to safe drinking water by 2015.
(b) Target 10b: Safeguard human health, including reduction in the mortality rate (associated with lack of access to safe drinking water, inadequate sanitation and poor hygiene), by improving the quality of drinking.
The CDWI mega-scheme will provide water purification plants of 2000 gallons/hour capacity in all Towns/Tehsils of Pakistan. In total 445 purified plants shall be installed in all the Tehsils of the country, i.e., 54 in NWFP, 127 in Punjab, 131 in Balochistan, 92 in Sindh, 1 in Islamabad, 18 in AJK, 11 in FANA, and 13 in FATA. The provincial/local government departments will identify places where these plants are to be installed in the provinces keeping in view the criteria for site/location selection for public places. The project will be completed in five years time, i.e. 2009.
4.2. National Sanitation Policy
Sanitation is one of the important indices for socio-cultural development of any country. Better sanitation results in improvement of health, reduced child mortality, improved water quality, household welfare, environment and economic growth of a country. Increasing recognition on how sanitation directly impacts on health, improved living conditions, education outcomes and poverty reduction has exaggerated the advocacy for markedly improved sanitation access. Sanitation in this context refers to the immediate household and community need for human excreta management required for privacy, healthy living conditions and a clean environment. On a wider scale, it also encompasses wastewater and solid waste collection, treatment and disposal.
The National Sanitation Policy26 provides a framework to support and synchronise with the provincial and local governments. The national sanitation policy offers guidelines and facilitates the implementation process and compliment the sanitation related strategies, plans and programmes made by the administrative units.
The prime objective of the sanitation policy aims at improving the quality of life of the people and their physical environment. For its achievement the strategy focuses on: ensuring an open defecation free environment; safe disposal of liquid and solid waste; and the promotion of health and hygiene practices to compliment the desired objective. To implement the primary objectives the policy envisages developing guidelines for the evolution of an effective institutional and financial framework and to link sanitation programmes with environment, housing, water, and city and regional planning policies and programmes.
26Ministry of Environment (2006).

20
For sustainable development, the national sanitation policy document presents policy principles which encourages mobilising local resources and discourages foreign loans. It also supports programmes that are implementable within available resources and enhanced capacities of institutions and communities. It also supports and accepts the role that communities, NGOs, and the formal and informal sectors are playing in the sanitation provision. The policy principles put emphasise to develop and use technologies which are simple and cost effective to install and maintain, and ensures the involvement of the O&M responsible departments/agencies in the planning of sanitation schemes. It also gives priority to the needs of women and children at all levels of planning and implementation and considers sanitation as a fundamental human right. The sanitation policy document offers policy measures which highlights:
(a) the cross sectoral issues (b) government vertical programmes (c) adoption of the component sharing model (d) effluent quality monitoring (e) capacity building (f) awareness and education (g) public toilets (h) public-private partnerships (i) urban and rural sanitation (j) water efficient system, and (k) consultations/communication.
Sanitation issues are closely related to larger environment, housing, city and regional planning, health and education, gender, drainage and industrial effluent disposal policies, regulations, programmes and projects. To address these cross sectoral issues, the strategy demands better process of coordination at the federal, provincial and local government levels is crucial for progressive outcomes.
For the development of sanitation sector, provincial governments held responsible to prepare larger investment plans. These projects will be funded by the federal government’s vertical programmes and/or with the collaboration of the development partners. District governments and the TMAs held in-charge to implement and manage the approved schemes/projects.
The strategy adopts component sharing model for all government schemes. In this model various communities, developers, housing societies finance and build their latrines, lane sewers and collector sewers and local government builds trunk sewers and disposals. At places where disposal developed by the local government is not available, developers will provide sewage and waste water treatment facility. For effluent quality monitoring, the TMAs will be responsible to coordinate with the provincial environmental protection agencies.

21
The capacity building strategy is an important component of the national sanitation policy. Those projects and programmes which will be considered as good practices will be converted in to the training centres for all the stakeholders i.e., government officials, TMAs staff, community activists, representatives and technicians, and elected representatives. Training will be provided to groups in which all stakeholders are present together. The capacity at all levels of the government will be developed to ensure public consultations and self-monitoring and documentation of their work. In this regard, professional academic and research institutions will also be involved in the capacity building process.
Community participation is also being encouraged in the rural water supply and sanitation sector. Rural water supply and sanitation schemes are being prepared in consultation with users’ groups who are required to take over the operation and maintenance of these schemes after completion. There is also a move now for communities to put up a small percentage of the capital cost to help develop ownership of the schemes through CCBs in the new devolved setup.
The sanitation awareness and education strategy advocates sanitation related mass awareness campaign with the collaboration of media, especially TV and radio, to develop special reports/programmes related to sanitation and its relationship between civic responsibility, health and education. The policy ensures adequate public toilets facilities at public places (i.e. markets, parks, playgrounds, etc.) The public-private partnership in solid waste management in Pakistan is well established. Local governments and TMAs are encouraged to identify, support and promote these good practices.
The strategy also provides guidelines for urban and rural sanitation facilities and envisages to review the sanitation policy and city/district level sanitation plans/schemes after every census, i.e., after every 10 years. Moreover, it articulates the roles and responsibilities of the stakeholders, i.e. government institutions, NGOs, community and individual household responsibilities.
The mechanism for implementation and monitoring highlights that the policy will be implemented by the federal and provincial governments, local governments, government agencies, autonomous agencies (such as cantonment boards) in accordance with the guidelines and principles stated in the national sanitation policy document. The strategy also encourages the involvement of the communities, NGOs and the private sector. To ensure effective coordination of the policy implementation and monitoring a national sanitation policy implementation committee shall be established at the federal level which shall report the status of implementation to the relevant federal ministers. Annual workshops on sanitation status, at provincial level in collaboration with the district governments, are also advised.

22
4.3. National Environment Policy
The national environment policy provides an overarching framework for addressing the environmental issues facing Pakistan, particularly pollution of fresh water bodies and coastal water, air pollution, lack of proper waste management, deforestation, loss of biodiversity, natural disasters and climate change.27
The strategy aims to conserve and regain Pakistan’s natural environment in order to improve the citizen’s quality of life through sustainable development. In this regard, the policy document sets objectives to achieve its goal. It includes:
(a) conservation, restoration and efficient management of environmental resources;
(b) integration of environmental consideration in policy making and planning processes;
(c) capacity building of government agencies and other stakeholders at all levels for better environmental management;
(d) meeting international obligations effectively in line with the national aspirations; and
(e) creation of a demand for environment through mass awareness and community mobilisation.
The policy document articulates sectoral and cross-sectoral guidelines for sustainable development as well as it addresses the causes of environmental degradation and options meeting international obligations. Underlining the sectoral guidelines, the strategy provides framework for: water supply and water resource management; air quality and noise pollution; liquid and solid waste management; sustainable management of natural forests; sustainable use of
27Ministry of Environment (2005).
Box 2.
Key Targets of the National Sanitation Policy
The government will follow the targets set under the MTDF (2005-19) and for which it has allocated funds. The implementation of the MTDF will result in the extension of sanitation facilities from the present coverage of 42 percent population (urban 64, rural 30) to serve an additional three million households, thus covering 50 percent of the total population (urban 75, rural 35) by 2010 along with the development of waste water treatment units, recycling provisions and conservation measures in the urban centres up to district level. The MTDF rural sanitation programmes will ensure that villages up to 100 households or 1000 population and above are served by 2010 with sanitation and drainage schemes.

23
biodiversity and effective management of protected areas; climate change and ozone depletion; energy efficiency and renewable resources; agricultural and livestock development, and; multilateral environmental agreements. Highlighting the cross-sectoral guidelines, the guiding principle provides framework for: poverty and environment; population and environment; gender and environment; health and environment; trade and environment; local governance and environment, and; natural disaster management.
5. WATSAN STATUS AND DELIVERING ACCESS
Safe drinking water and adequate sanitation are among the most powerful drivers for human development. They extend opportunity, enhance dignity and help create a virtuous cycle of improving health and rising wealth. With the passage of time water quantity is becoming scarce and the quality is deteriorating due to urbanisation, industrialisation, deforestation, land degradation, global warming, and increasing population. 5.1. Global Water Status Review
Figure 10: Population with No Access to Improved Water (million)
Sub-Sahara Africa, 314
East Asia & Pacific, 406.2
Latin America & Caribbean,
49.4
Arab States, 37.7
South Asia, 228.8
There are 1.4 billion cubic km of water on earth, liquid and frozen.
Hardly any of this is useful for human consumption, i.e., 97.5 percent is in the oceans and is too salty to drink or use for irrigation. Of the remaining 2.5 percent, two-third (or 24 million cubic km) is locked up in polar ice-caps and permanent snow cover. A small amount of the global freshwater supply is in the air at any time, in the form of rain, clouds and/or vapors. Another small amount is contained in living things, i.e. plants, animals, human beings. A large
Fig. 10. Population with no Access to Improved Water (Million)

24
proportion of the remaining 16 million cubic km lies imprisoned in nooks of sedimentary rocks too far under ground to exploit. Freshwater lakes and rivers, from where we obtain most of our water, contain only around 90,000 cubic km, i.e., only 0.26 percent of the global supply. If the amount they contain was spread evenly over the globe, it would make a layer 1.82 meters deep.28
Global access to water supply, as of 2004, showed that 1.1 billion people lack access to improved water sources, which represents 17 percent of the world’s population (see Figure 10). Of the 1.1 billion without improved water sources, 39 percent live in East Asia and the Pacific, 30 percent in Sub-Sahara Africa and 22 percent in South Asia. 29 Over half of the world’s population has access to improved water through household connections or yard tap.
Nevertheless, the universal progress in providing access to an improved water source was somewhat satisfactory between 1990 and 2004 (see Figure 11), but there is still much more to be done. The admirable improvement was observed in the South Asia, followed by East Asia and the Pacific and in Latin America and the Caribbean. However, the worrying situation was observed in Arab States and in the Sub-Sahara Africa.
Figure 11: Population with No Access to an Improved Water Source (1990 - 2004)
0
10
20
30
40
50
60
Sub-SaharaAfrica
East Asia &Pacif ic
South Asia Arab States LatinAmerica &Caribbean
World
Perc
enta
ge
1990
2004
Source: HDR (2006).
In order to meet the water supply MDG target, an additional 260,000 people per day up to 2015 should gain access to improved water sources. The time left for the MDG deadline is not that far from today, keeping it in our mind that between 2002 and 2015, the world’s population is expected to increase every year by 74.8 million people.
28Black (2004). 29HDR (2006).
Fig. 11. Population with no Access to Improved Water Source (1990–2004)

25
5.1.1. Global Sanitation Status Review
Figure 12: Population with No Access to Improved Sanitation (million)
East Asia & Pacif ic, 958.2
Sub-Sahara Africa, 436.7
South Asia, 925.9
Arab States, 80.1
Latin America & Caribbean,
119.4
Source: HDR 2006.
Global access to sanitation, as of 2004, showed that 2.6 billion people
lacked access to improved sanitation, which represented 42 percent of the world’s population (see Figure 12). Of the total, with no access to improved sanitation, 38 percent live in East Asia and the Pacific, 37 percent in South Asia and 17 percent lack access to environmental sanitation in Sub-Sahara Africa. Over half of those without improved sanitation—nearly 1.5 billion people—live in China and India. Only 31 percent of the rural inhabitants in developing countries have access to improved sanitation, as opposed 73 percent of urban dwellers. 30
Since 1990, an estimated 747 million people have gained access to sanitation facilities (i.e. 205,000 people every day). Despite this huge achievement, a further 1089 million rural and 1085 million urban dwellers will need to gain access in the coming 15 years (from 2000), if the 2015 target is to be realised. 31
Nevertheless, the progress in providing access to an improved sanitation was fairly satisfactory between 1990 and 2004 (see Figure 13). Today, 60 percent of the people living in developing countries, amounting to some 2.4 billion people, have no access to hygienic means of personal sanitation. The admirable improvement was observed in the East Asia and the Pacific, followed by the South Asia, Arab States and the Latin America and the Caribbean.
30HDR (2006). 31WHO (2005).
Fig. 12. Population with no Access to Improved Sanitation (Million)

26
However, the worrying situation was observed in the Sub-Sahara Africa. In order to meet the sanitation MDG target, and additional 370,000 people per day up to 2015 should gain access to improved sanitation.
Figure 13: Population with No Access to Improved Sanitation (1990 - 2004)
010203040506070
8090
Sub-SaharaAfrica
East Asia& Pacific
South Asia ArabStates
LatinAmerica &Caribbean
World
Perc
enta
ge
1990
2004
Source: HDR (2006).
The Global Water Supply and Sanitation Assessment Report (2000)
report, of the Joint Monitoring Programme for Water Supply and Sanitation (JMP), showed that, Asia and Africa are the regions where lack of access for both water supply and sanitation is highest. Of the total 1.1 billion people, lacked access to improved water supply, Asia and Africa alone accounted for 86 percent of these (61 percent lived in Asia and 25 percent in Africa). The JMP report also showed that about 2.4 billion people in the world lacked access to improved sanitation and Asia alone accounted for 79 percent of it.
The South Asia region is the home to more than 200 million people lacking access to safe drinking water and 800 million without proper sanitation service; faces some of the lowest per capita freshwater availability in the world. 32 Nearly 40 percent of the world’s poor are living in this region that comprises weak socio-economic indicators; therefore, the performance in South Asia will be critical to achieve the MDGs.
Not having access to water and sanitation is a courteous expression for a form of deprivation that threatens life, destroys opportunity and undermines human dignity. Being without access to safe water means that people resort to ditches, rivers and lakes polluted with human or animal excrement or used by animals. It also means not having sufficient water to meet even the most basic human needs.33
32Kulshrestha and Mittal (2005). 33HDR (2006).
Fig. 13. Population with no Access to Improved Sanitation (1990–2004)

27
5.2. Delivering Access to WATSAN in Pakistan
WATSAN in Pakistan is a neglected sector. Most of the households in Pakistan do not have access to safe drinking water and lack toilets and adequate sanitation systems. These poor people, mostly living in rural areas or urban slums, are not only deprived of financial resources, but they also lack admittance to basic needs such as education, health, safe water supply and environmental sanitation facilities. In recent years, the government aimed to expand access to safe drinking water and to improve sanitation particularly in rural areas.
This section reviews the trend in access underlining the water and sanitation. Moreover, it also considers the redefined improved facility concept underlining improved access to safe water source and hygiene levels in sanitation. In this aspect, the current research follows the method, of defining the improved and unimproved access,34 as adopted by the district based Multiple Indicators Cluster Survey (MICS)35 and by the study on MDG Costing.36 Delivering Access to Safe Drinking Water
To assess the access to safe drinking water source in Pakistan, the study used the 2004-05 PSLM and 2001-02 PIHS data (see Table 1). The overall access to tap water has increased in all the four provinces, with the best progress in Sindh rural, i.e. 20 percent access was recorded in 2004-05 as weighted against 4 percent in 2001-02, followed by rural Punjab, Balochistan, and NWFP; negative change was also observed in Punjab urban. The figures also demonstrate that the use of ground water (i.e. hand-pimp, motor pump, and dug well) was decreased in all the regions due to improved access to tap water.
Based on the redefined improved facility concept,37 computed improved access to safe drinking water (in 2004-05) was 82 for Punjab, 58 for Sindh, 79 for NWFP, and 55 for Balochistan. On the basis of the redefined figures, it is calculated that a total number of 5.72 million households lacked access to improved water source in 2004-05. In Punjab, 2.41 million households lacked
34The Improved Source does not necessarily imply safety. There is potential contamination from pumps and wells, especially outside the household. Even piped water quality can be compromised by leakages and in certain situations, come from suspect sources such as stagnant water. Further, the amount of water was not addressed in this survey, as responses could not be reliably standardised.
35MICS were done in all the four provinces of Pakistan by their relevant Planning and Development Departments in collaboration with the UNICEF, Pakistan. MICS NWFP was done in 2001; MICS Punjab was done in 2003-04; MICS Sindh was done in 2003-04 (final draft report); and MICS Balochistan was done in 2004.
36A recent research exercise on Estimating the Cost to Achieve the MDGs in Pakistan, by the Ministry of Finance (Pakistan), in collaboration with the UNDP, Islamabad (2006).
37Redefined improved Facility Concept for water considers the region-wise safety levels. Tap Water is considered to be cent-percent safe in all the regions and provinces; Ground Water is considered to be half- and/or quarter-cent percent safe in Sindh, Balochistan, and Rural Punjab, whereas Other Sources are considered un-safe.

28
Table 1
Main Source of Drinking Water by Province and Region (Percentage)
2001-02
PIHS 2004-05 PSLM
2004-05 PSLM (Redefined)
Urban Rural Overall Urban Rural Overall Urban Rural OverallPunjab Tap Water 54 6 20 49 16 32 49 16 32 Hand Pump 16 69 54 15 52 34 15 26 26 Motor Pump 30 19 22 34 29 31 34 15 23 Dug Well 1 4 3 0 1 1 0 1 1 Other 0 2 1 2 3 2 – – – Sindh Tap Water 67 4 30 71 20 45 71 20 45 Hand Pump 14 66 44 13 58 36 3 15 9 Motor Pump 11 4 7 10 3 6 5 2 3 Dug Well 1 14 9 2 8 5 1 2 1 Other 8 11 10 5 12 8 – – – NWFP Tap Water 57 35 39 63 41 48 63 41 48 Hand Pump 7 11 10 8 11 10 8 11 10 Motor Pump 19 7 9 15 4 7 15 4 7 Dug Well 14 18 17 10 16 14 10 16 14 Other 3 29 25 3 28 20 – – – Balochistan Tap Water 80 14 25 85 23 40 85 23 40 Hand Pump 2 1 1 2 4 4 1 2 2 Motor Pump 3 12 11 4 4 4 4 4 4 Dug Well 11 35 31 4 24 18 2 12 9 Other 5 38 32 6 45 34 – – – Source: PSLM 2004-05; Table 4.7.
access to safe drinking water, followed by 2.23 million in Sindh, 0.57 million in NWFP, and 0.50 million households in Balochistan. Delivering Access to Adequate Sanitation
To evaluate the access to adequate sanitation facilities in Pakistan, the study used the 2004-05 PSLM and 2001-02 PIHS data (see Table 2). The overall access to flush toilet has increased in all the four provinces, with the finest development in Punjab rural, i.e. 43 percent access was observed in 2004-05 as compared to 31 percent in 2001-02, followed by NWFP urban and Balochistan urban. The use of non-flush toilets were increased by 22 percentage points in Sindh rural, followed by Balochistan and Punjab rural; whereas, NWFP shows lesser use of non-flush toilets over time. Most of the regions, in Pakistan, are deprived of having toilet facilities. The table shows that there has been much development, especially in rural areas, over the last few years underlining the provision of flush and/or non-flush services to those having no access to improved sanitation.

29
Table 2
Type of Toilet used by the Household by Province and Region (Percentage)
2001-02
PIHS 2004-05 PSLM
2004-05 PSLM (Redefined)
Urban Rural Overall Urban Rural Overall Urban Rural Overall Punjab Flush 91 31 48 91 43 66 91 43 66 Non-Flush 2 2 2 2 7 5 1 3.5 2.5 No Toilet 7 68 50 7 50 30 – – – Sindh Flush 91 17 48 88 17 51 88 17 51 Non-Flush 7 34 23 7 56 32 3.5 28 16 No Toilet 3 49 30 5 27 16 – – – NWFP Flush 73 26 33 81 32 48 81 32 48 Non-Flush 23 38 36 13 36 28 6.5 18 14 No Toilet 4 36 31 6 32 24 – – – Balochistan Flush 56 5 13 63 7 23 63 7 23 Non-Flush 38 39 39 33 48 44 16.5 24 22 No Toilet 7 57 48 4 45 33 – – – Source: PSLM 2004-05; Table 4.8.
Based on the redefined improved facility concept,38 calculated improved access to hygiene sanitation (in 2004-05) was 68.5 for Punjab, 67 for Sindh, 62 for NWFP, and 45 for Balochistan. On the basis of the redefined figures, it was calculated that a total number of 7.52 million households lacked access to improved sanitation in 2004-05. In Punjab, 4.11 million households have no access to hygiene sanitation, followed by 1.76 million in Sindh, 1.03 million in NWFP, and 0.61 million households in NWFP.
6. FINANCING THE WATSAN SECTOR
Provision of safe drinking water, adequate sanitation facilities and personal hygiene are vital for improving the environmental conditions and reducing the health problems, such as, incidence of diarrhea and morbidity levels; which in turn have direct impact on lowering child mortality. Thus, investing in provision of safe water supply and adequate sanitation is not only a development oriented strategy in itself, it can also yield other socio-economic benefits in terms of improved health status, quality of labour force and reduced burden-of-disease.
38Redefined Improved Facility Concept for sanitation considers the technology-wise hygiene
levels. Flush is considered to be cent percent hygienic in all the regions and provinces; Non-flush is considered to be fifty-percent hygienic; whereas, No-Toilet facilities are considered zero-percent hygienic.

30
Financing the WATSAN sector comprises three main components. First, increased access requires new infrastructure and rehabilitation of non-functioning/defective infrastructure; second, sufficient fund must be made for O&M of new and existing infrastructure stocks, and; finally, finances are required for WATSAN sector development, including activities such as capacity building and awareness at community level, policy formulation and standard setting, and sector monitoring and regulation.
The financing mechanism consists of three key channels through which the stakeholders play their productive role in the development process, i.e., (a) government/public sector spending, (b) external economic assistance by the development partners, and (c) household self-financing through out-of-pocket expense. The current research only focuses the government/public sector spending over time. 6.1. Global Perspective
Life-saving investment in WATSAN sector is dwarfed by military spending, reported by the Human Development Report (HDR), 2006. In Ethiopia the military budget is 10 times the WATSAN budget; India spends 8 times more of its national wealth on military budgets than on WATSAN, whereas, Pakistan spends 47 times more (see Figure 14).
0
2
4
6
8
10
12
14
Per
cent
age
of G
DP
Ethiopia2000
Yemen2003
Pakistan2003
India 2004 Uganda2002
SouthAfrica2003
Kenya2001
Mexico2003
Zambia2003-04
Figure 14: Government Expenditure on Military, Health and Water & Snaitation
Military Health Water & Sanitation
Source: HDR (2006).
Ethiopia, one of the poorest countries in the world with some of the
lowest coverage rates (and some of the highest child death rates from diarrhoea), still manages to mobilise almost 10 times more for military spending than for water and sanitation. Diarrhoea claims some 450,000 lives annually in India—more than in any other country—and 118,000 in Pakistan. Both countries have
Fig. 14. Government Expenditure on Military, Health and Water and Sanitation

31
far higher death rates from diarrhoea than predicted on the basis of their average incomes. Pakistan ranks 28 places higher in the global league table for deaths from diarrhoea than in GDP per capita and India ranks 14 places higher.39 Of course, many factors are at play, but low levels of spending on water and sanitation surely contribute. 6.2. Government Spending on WATSAN in Pakistan
In case of Pakistan, which ranks low in human development index (i.e. HDI 134), access to safe drinking water and adequate sanitation facilities is limited and there is a need for substantial spending in the WATSAN sector.
The total government spending on WATSAN has increased from Rs 4.49 billion in 2001-02 to Rs 6.53 billion in 2004-05 (see Figure 15). The graph shows an increasing trend in the development expenditure with a less considerable spending in 2002-03, i.e. Rs 1.8 billion.
Figure 15. Total Government Spending on WATSAN
0
1500
3000
4500
6000
7500
2000-01 2001-02 2002-03 2003-04 2004-05
Mill
ion
Rs.
Current Development Total
The share of federal and provinces in total government spending on
WATSAN sector (see Figure 16) shows that the federal is spending the least on average. The major increase in expenditure on WATSAN has been observed in Punjab followed by Balochistan, whereas, the shares of Sindh and NWFP are decreasing over time. In Punjab, the share in total public sector budgetary expenditure has improved to 28 percent in 2004-05 from 11 percent in 2003-04, whereas, in Balochistan, the share has increased from 13 to 52 percent between 2001-02 and 2003-04; followed by a decreasing trend of 39 percent in 2004-05.
39HDR (2006).
Fig. 15. Total Government Spending on WATSAN
Mill
ion
Rs

32
Figure 16. Share in Government Spending on WATSAN
3
1215
7
38 38
16
28
13
20 20 221717
7
21
13
39
52
39
811
910
25
0
10
20
30
40
50
60
2000-01 2001-02 2002-03 2003-04 2004-05
Perc
enta
ge
Federal Punjab Sindh NWFP Balochistan
The total government expenditure as percentage of GDP 40 shows that the
public spending on WATSAN sector has improved to only 0.13 percent from 0.12 percent of the GDP in last five years, i.e., after becoming a signatory to the United Nations’ Millennium Declaration in the year 2000, the progress was just of 0.01 percent of GDP between 2000-01 and 2004-05. This demonstrates how much the public sector is committed to invest in the WATSAN sector. However, the public sector development expenditure as percentage of GDP shows comparative improvement over the same period of time, i.e., increase of 0.03 percent of GDP (see Figure 17).
Figure 17. Government Spending on WATSAN as % GDP0.13
0.13
0.08
0.12 0.12
0.090.10
0.070.06
0.04
0.00
0.03
0.06
0.09
0.12
0.15
2000-01 2001-02 2002-03 2003-04 2004-05
Perc
enta
ge
Total Expenditure Development Expenditure
40GDP at market price constant factor cost (Economics Survey of Pakistan, 2005-06).
Fig. 16. Share in Government Spending on WATSAN
Fig. 17. Government Spending on WATSAN as % GDP
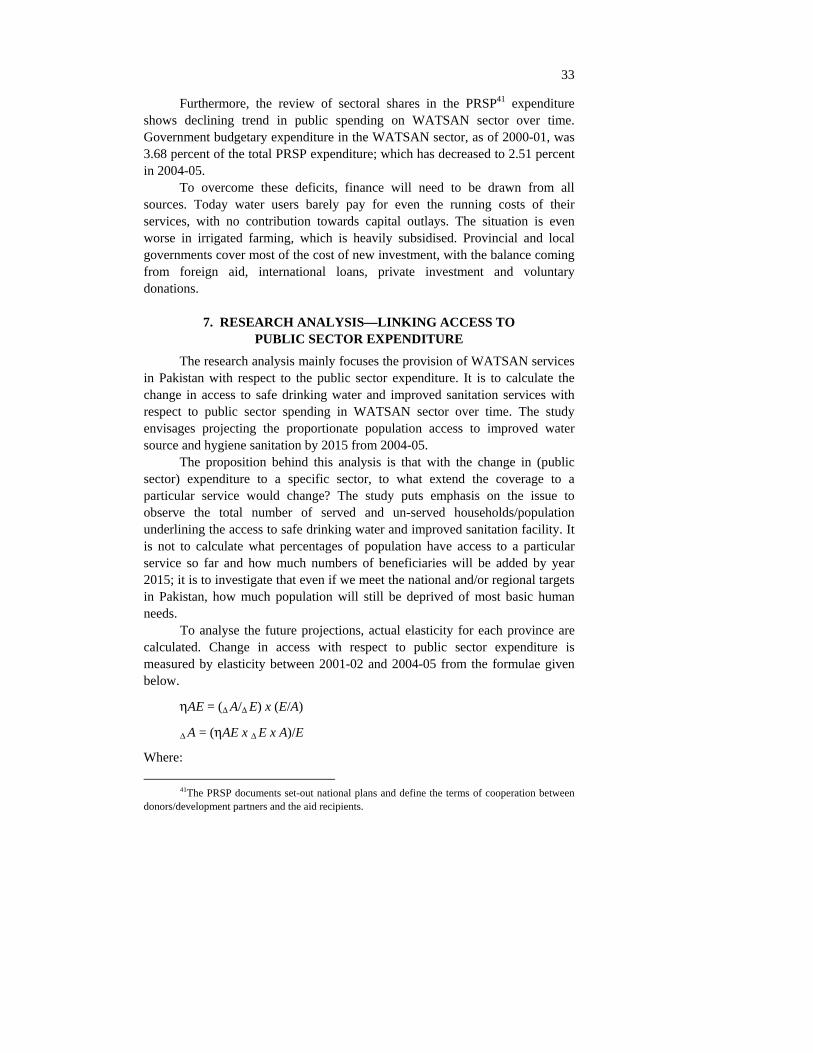
33
Furthermore, the review of sectoral shares in the PRSP41 expenditure shows declining trend in public spending on WATSAN sector over time. Government budgetary expenditure in the WATSAN sector, as of 2000-01, was 3.68 percent of the total PRSP expenditure; which has decreased to 2.51 percent in 2004-05.
To overcome these deficits, finance will need to be drawn from all sources. Today water users barely pay for even the running costs of their services, with no contribution towards capital outlays. The situation is even worse in irrigated farming, which is heavily subsidised. Provincial and local governments cover most of the cost of new investment, with the balance coming from foreign aid, international loans, private investment and voluntary donations.
7. RESEARCH ANALYSIS—LINKING ACCESS TO PUBLIC SECTOR EXPENDITURE
The research analysis mainly focuses the provision of WATSAN services in Pakistan with respect to the public sector expenditure. It is to calculate the change in access to safe drinking water and improved sanitation services with respect to public sector spending in WATSAN sector over time. The study envisages projecting the proportionate population access to improved water source and hygiene sanitation by 2015 from 2004-05.
The proposition behind this analysis is that with the change in (public sector) expenditure to a specific sector, to what extend the coverage to a particular service would change? The study puts emphasis on the issue to observe the total number of served and un-served households/population underlining the access to safe drinking water and improved sanitation facility. It is not to calculate what percentages of population have access to a particular service so far and how much numbers of beneficiaries will be added by year 2015; it is to investigate that even if we meet the national and/or regional targets in Pakistan, how much population will still be deprived of most basic human needs.
To analyse the future projections, actual elasticity for each province are calculated. Change in access with respect to public sector expenditure is measured by elasticity between 2001-02 and 2004-05 from the formulae given below.
ηAE = (∆ A/∆ E) x (E/A)
∆ A = (ηAE x ∆ E x A)/E
Where:
41The PRSP documents set-out national plans and define the terms of cooperation between donors/development partners and the aid recipients.

34
ηAE = Elasticity of access with respect to expenditures. ∆A = Change in Access ∆E = Change in Expenditure
To project the access of n+1 year, we sum A and ∆A, i.e., the proportion of population having the access of that particular service (water or sanitation) in the current year plus the change in access by the next year, dividing proportionate population having access to water or sanitation in period n+1 by the total population of the period n+1.
For the current analysis, secondary data is being used underlining access to and expenditure on WATSAN sector. PIHS (2001-02) and PSLM (2004-05) data on access, underlining water and sanitation, whereas, the PRSP data on public sector budgetary expenditure42 is used for the research analysis. The population projections are obtained from National Institute of Population Studies (NIPS), Islamabad. As discussed earlier, for projections, the study adopts the redefined improved facility concept for water and sanitation. To assess the access to water and sanitation, primarily following assumptions are being made:
• Constant GDP at 7 percent annual growth • Constant share of provincial expenditure as of 2004-05 in national
GDP43 • Out of the total annual WATSAN expenditure, we assume fifty percent
for each water and sanitation.44
The study realises that the respective actual elasticities are calculated from the available data on access and expenditure over the time period of 2001-02 to 2004-05, however, data from last ten years, or more, on coverage and public sector expenditure may give us different elasticities. To address this issue, different scenarios are made on different elasticities. To obtain projected access, following alternative scenarios are developed:
• Scenario 1: use actual elasticity for respective regions • Scenario 2: use actual elasticity at 0.1 change for respective regions • Scenario 3: use actual elasticity at 0.2 change for respective regions • Scenario 4: use constant elasticity at 0.1 for all regions • Scenario 5: use constant elasticity at 0.3 for all regions
All the assumptions given above are applied to all the five scenarios. Results under each scenario are discussed below. (Detailed projected figures on
42PRSP (2007). 43Islamabad Capital Territory (ICT) expenditure is added in the Punjab, as in the case of
PIHS and PSLM access figures. 44Expenditure breakdown on water and sanitation is not available.

35
access and numbers of served and un-served households by province and year can be obtained from the author.) Scenario 1: Actual Elasticity
Scenario 1 analyse the results on calculated actual elasticity, for respective regions, at 7 percent annual GDP growth with constant provincial share in total public sector budgetary expenditure, as of 2004-05.
Figure 18 shows the projected percentage access to safe drinking water source between 2004-05 and 2015. Providing the constant share of expenditure in GDP, Punjab and Balochistan shows slight development by year 2015, however, access in Sindh shows sharp decline based on its calculated actual elasticity between 2001-02 and 2004-05. Sindh, after Punjab, is the second largest province by population and hence its sharp progress or decline would impact the overall access; which in this scenario shows a declining trend.
Based on these projections, it is calculated that a total number of 5.72 million households (approximately 38.5 million people) lacked access to safe drinking water source in 2004-05. In Punjab, 2.41 million households (approximately 15.9 million people) lacked access to safe drinking water, followed by 2.23 million in Sindh (approximately 14.8 million people), 0.57 million in NWFP (approximately 4.0 million people), and 0.50 million households (approximately 3.9 million people) in Balochistan.
Figure 19: Scenario 1: Water Access Projections
40
50
60
70
80
90
100
2004-05
2005-06
2006-07
2007-08
2008-09
2009-10
2010-11
2011-12
2012-13
2013-14
2014-15
% P
opul
atio
n A
cces
s
Punjab Sindh NWFP Balochistan Pakistan
Access to safe drinking water projections, on respective actual elasticity,
shows that, in year 2015, a total number of 7.84 million households (approximately 52.8 million people) will be deprived of safe drinking water. In Punjab, 2.73 million households (approximately 17.9 million people) will have no access to safe drinking water, followed by 3.56 million in Sindh (approximately 23.4 million people), 0.95 million in NWFP (approximately 6.6
Fig. 18. Scenario 1: Water Access Projections

36
million people), and 0.61 million households (approximately 6.7 million people) in Balochistan.
Figure 19 shows the projected percentage access to improved sanitation facility. Considering the constant shares in GDP, the access to hygiene sanitation in Punjab and Balochistan shows progress by year 2015, however, access in Sindh and NWFP shows decline over time. Punjab,45 with its calculated actual elasticity, shows sharp development, due to which the overall access presents a growing trend.
Projections show that a total number of 7.52 million households (approximately 50.7 million people) lacked access to improved sanitation in 2004-05. In Punjab, 4.11 million households (approximately 27.1 million people) have no access to hygiene sanitation, followed by 1.76 million (approximately 11.6 million people) in Sindh, 1.03 million in NWFP (approximately 7.2 million people), and 0.61 million households (approximately 4.7 million people) in Balochistan.
Figure 20: Scenario 1: Sanitation Access Projections
40
50
60
70
80
90
100
2004-05
2005-06
2006-07
2007-08
2008-09
2009-10
2010-11
2011-12
2012-13
2013-14
2014-15
% P
opul
atio
n A
cces
s
Punjab Sindh NWFP Balochistan Pakistan
Access to improved sanitation facility projections, on respective actual
elasticity shows that, in year 2015, a total number of 6.34 million households (approximately 43.2 million people) will have no access to improved sanitation. In Punjab, 1.17 million households (approximately 7.7 million people) have no access to hygiene sanitation, followed by 2.65 million (approximately 17.4 million people) in Sindh, 1.90 million in NWFP (approximately 13.2 million people), and 0.63 million households (approximately 4.8 million people) in Balochistan.
It was observed that at respective actual elasticities, only Punjab and Balochistan showed slight progressive trend underlining safe drinking water and growing trend in improved sanitation facilities. As Punjab, by population,
45Punjab also includes the Islamabad Capital Territory (Federal Capital).
Fig. 19. Scenario 1: Sanitation Access Projections

37
represents the major proportion of Pakistan and Sindh the second major proportion, hence their growing or declining trend in access with respect to expenditure impact the overall national progress. Scenario 2: Actual Elasticity at 0.1 Change
Scenario 2 explore the results on 0.1 improved elasticity change, based on respective calculated actual elasticity, at 7 percent annual GDP growth with constant provincial share in total public sector budgetary expenditure, 2004–05.
Figure 20 shows the projected percentage access to safe drinking water source under scenario 2. The coverage to safe drinking water in all the provinces shows better results as compared to those presented under scenario 1. The overall access to improved water source shows slight development over time; as compared to declining trend under scenario 1, i.e., actual elasticity.
Based on the projections under scenario 2, a total number of 6.47 million households (approximately 43.6 million people) will lack access to improved water source in the year 2015; an addition of 0.76 million households between 2004-05 and 2014-15. Excluding Punjab, total numbers of un-served households are increasing in Sindh, NWFP and Balochistan; a decrease of 0.52 million un-served households (approximately 3.4 million people) in Punjab.
Figure 21: Scenario 2: Water Access Projections
40
50
60
70
80
90
100
2004-05
2005-06
2006-07
2007-08
2008-09
2009-10
2010-11
2011-12
2012-13
2013-14
2014-15
% P
opul
atio
n A
cces
s
Punjab Sindh NWFP Balochistan Pakistan
Figure 21 shows the projected percentage access to improved sanitation
facility under scenario 2. Comparatively, the overall access to hygiene sanitation in all the provinces shows better results from those presented under scenario 1. Due to 0.1 elasticity change in the calculated actual elasticity, the access to improved sanitation in Punjab and Balochistan is on fast-track. As Punjab represents a major proportion of Pakistan’s population, its impact on overall trend is obvious.
Fig. 20. Scenario 2: Water Access Projections

38
Sanitation projections under scenario 2 show that due to an overall rising trend in the coverage of improved sanitation facility, there will be a decrease of 1.78 million households by 2014-15; 5.74 million households (approximately 39.2 million people) will still have no access to hygiene means of sanitation facility in the year 2015.
Figure 22: Scenario 2: Sanitation Access Projections
40
50
60
70
80
90
100
2004-05
2005-06
2006-07
2007-08
2008-09
2009-10
2010-11
2011-12
2012-13
2013-14
2014-15
% P
opul
atio
n Ac
cess
Punjab Sindh NWFP Balochistan Pakistan
Scenario 3: Actual Elasticity at 0.2 Change
Scenario 3 demonstrates the results on 0.2 elasticity change, based on respective calculated actual elasticity, at 7 percent annual GDP growth with constant provincial share in total public sector budgetary expenditure, 2004-05.
Figure 22 exhibits the projected percentage access to safe drinking water source. With the elasticity change of 0.2, the access to improved drinking water source shows relatively improved results in all the regions. Punjab shows far better development track, followed by NWFP and Balochistan.
Based on the projections under scenario 3, the overall coverage trend shows improvement, between 2004-05 and 2015; a total number of 5.16 millions households (approximately 34.8 million people) will demand access to improved water source in year 2015.
Figure 23: Scenario 3: Water Access Projections
40
50
60
70
80
90
100
2004-05
2005-06
2006-07
2007-08
2008-09
2009-10
2010-11
2011-12
2012-13
2013-14
2014-15
% P
opul
atio
n A
cces
s
Punjab Sindh NWFP Balochistan Pakistan
Fig. 21. Scenario 2: Sanitation Access Projections
Fig. 22. Scenario 3: Water Access Projections

39
Figure 23 shows the projected percentage access to improved sanitation facility. Changing the actual elasticity to 0.2, the overall access to hygiene sanitation in all the regions shows far better results. The access to improved sanitation in Punjab and Balochistan is on fast-track development. Only in Punjab, the access to improved sanitation will be closed to 100 by the year 2015; whereas the rest of the three provinces will be far behind in providing the improved sanitation service delivers.
Using the improved sanitation access projections analysis under scenario 3, a total number of 4.57 million households (approximately 31.4 million people) will be deprived of improved sanitation facilities in 2015; a decrease of 2.95 million households (approximately 19.3 million people) since 2004-05.
Figure 24: Scenario 3: Sanitation Access Projections
40
50
60
70
80
90
100
2004-05
2005-06
2006-07
2007-08
2008-09
2009-10
2010-11
2011-12
2012-13
2013-14
2014-15
% P
opul
atio
n A
cces
s
Punjab Sindh NWFP Balochistan Pakistan
Scenario 4: Constant Elasticity at 0.1
Scenario 4 provides the results for all the regions, at constant elasticity of 0.1, at 7 percent annual GDP growth with constant provincial share in total public sector budgetary expenditure, 2004-05.
Figure 24 presents the results at constant elasticity for all the regions in Pakistan. The coverage to improved drinking water source shows somewhat linear growth trend in all the regions of Pakistan. The development in access to safe water is somewhat similar in the case of Punjab and Balochistan when comparing them with their trends under scenario 1, i.e., using actual elasticity.
The constant elasticity projections, at 0.1, shows that despite an overall increasing trend in coverage, a total number of 5.64 million households (approximately 38.1 million people) will have no access to safe drinking water in the year 2015, as compared to 5.72 million households (approximately 38.5 million people) in 2004-05.
Fig. 23. Scenario 3: Sanitation Access Projections

40
Figure 25: Scenario 4: Water Access Projections
40
50
60
70
80
90
100
2004-05
2005-06
2006-07
2007-08
2008-09
2009-10
2010-11
2011-12
2012-13
2013-14
2014-15
% P
opul
atio
n A
cces
s
Punjab Sindh NWFP Balochistan Pakistan
Providing constant elasticity of 0.1, the access to improved sanitation
facility, like safe water source, shows somewhat linear growth trend (see Figure 25). Though, in the current scenario, Punjab and Balochistan are the poor performers as compared to their growth with actual elasticity; presented under scenario 1.
Despite the growing access in all the regions of Pakistan, the results of improved sanitation access at constant elasticity (i.e. 0.1), there will be 7.89 million un-served households (approximately 53.4 million people) in year 2015 as compared to 7.52 million households (approximately 50.7 million people) in the base year.
Figure 26: Scenario 4: Sanitation Access Projections
404550
55606570
7580
2004-05
2005-06
2006-07
2007-08
2008-09
2009-10
2010-11
2011-12
2012-13
2013-14
2014-15
% P
opul
atio
n A
cces
s
Punjab Sindh NWFP Balochistan Pakistan
Scenario 5: Constant Elasticity at 0.3 Scenario 5 provides the results for all the regions, at constant elasticity of
0.3, at 7 percent annual GDP growth with constant provincial share in total public sector budgetary expenditure, 2004-05.
Fig. 24. Scenario 4: Water Access Projections
Fig. 25. Scenario 4: Sanitation Access Projections
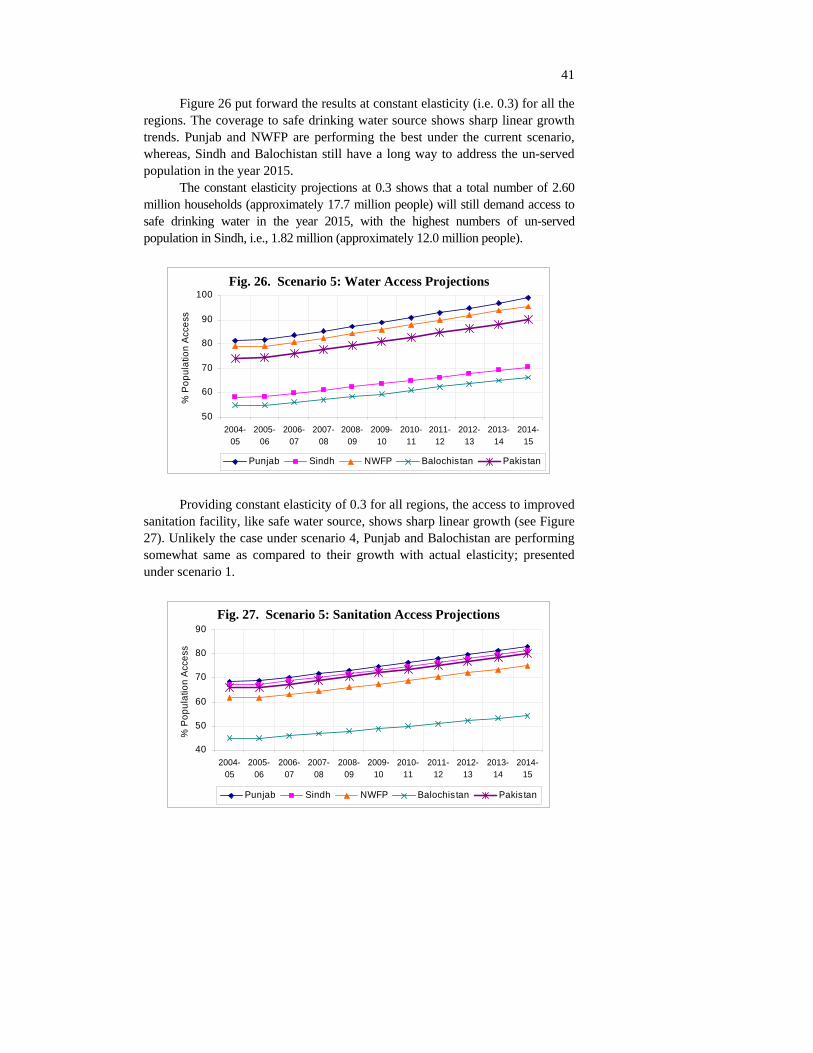
41
Figure 26 put forward the results at constant elasticity (i.e. 0.3) for all the regions. The coverage to safe drinking water source shows sharp linear growth trends. Punjab and NWFP are performing the best under the current scenario, whereas, Sindh and Balochistan still have a long way to address the un-served population in the year 2015.
The constant elasticity projections at 0.3 shows that a total number of 2.60 million households (approximately 17.7 million people) will still demand access to safe drinking water in the year 2015, with the highest numbers of un-served population in Sindh, i.e., 1.82 million (approximately 12.0 million people).
Figure 27: Scenario 5: Water Access Projections
50
60
70
80
90
100
2004-05
2005-06
2006-07
2007-08
2008-09
2009-10
2010-11
2011-12
2012-13
2013-14
2014-15
% P
opul
atio
n A
cces
s
Punjab Sindh NWFP Balochistan Pakistan
Providing constant elasticity of 0.3 for all regions, the access to improved
sanitation facility, like safe water source, shows sharp linear growth (see Figure 27). Unlikely the case under scenario 4, Punjab and Balochistan are performing somewhat same as compared to their growth with actual elasticity; presented under scenario 1.
Figure 28: Scenario 5: Sanitation Access Projections
40
50
60
70
80
90
2004-05
2005-06
2006-07
2007-08
2008-09
2009-10
2010-11
2011-12
2012-13
2013-14
2014-15
% P
opul
atio
n A
cces
s
Punjab Sindh NWFP Balochistan Pakistan
Fig. 26. Scenario 5: Water Access Projections
Fig. 27. Scenario 5: Sanitation Access Projections

42
The sharp growing access to improved sanitation in all the regions of Pakistan, the results show that in year 2015 there will be 5.19 million un-served households (approximately 35.3 million people), with the highest number of un-served households in Punjab, i.e., 2.58 million (approximately 17.0 million people).
8. FINDINGS AND POLICY IMPLICATIONS Findings
(1) Poor people, mostly living in rural areas or urban slums, are not only deprived of financial resources, but they also lack admittance to basic needs such as education, health, safe water supply and adequate sanitation facilities in Pakistan.
(2) Inadequate WATSAN services to the poor increase their living costs, lower their income earning potential, damage their well-being, and make life riskier. The continuing, nearly universal deterioration of the surface and underground water sources on which people survive means that water and sanitation pressures will simply become worse in the future. Lack of water and sanitation infrastructure has complex effects on income and consumption of a household, which deeply influence people’s overall well-being.
(3) The provision of safe drinking water, adequate sanitation and personal hygiene are vital for the sustainable environmental conditions and reducing the incidence of diarrhoea, malaria, trachoma, hepatitis A & B and morbidity levels. Consumption of contaminated drinking water, improper disposal of human excrete, lack of personal and food hygiene and improper disposal of solid and liquid waste have been the major causes of many diseases in developing countries.
(4) Continuing urbanisation, growing populations and increasing industrialisation have increased water consumption and correspondingly generating higher volumes of waste-water and solid-waste. Untreated waste-water and poor solid-waste management are threats to human health and natural environment. Regrettably, the public and the private sectors, in developing countries including Pakistan, are giving insufficient attention to the unsafe disposal of waste-water and solid waste; which is causing severe environmental and health problems.
(5) Review of the national policy documents shows that the government is committed to provide safe drinking water, however, the execution and monitoring departments could not address this issue due to limited resources, increasing population, fast growing urban development, industrialisation, extensive system losses, inadequate operation and
43
maintenance and poor cost recovery, lack of private sector participation, inefficient institutional capacities, and poor linkage among urban and rural water development projects.
(6) Clean Drinking Water Initiative by the federal government is an encouraging step to deliver safe drinking water. However, it is obvious that when we build a complex system we need more resources to keep that system operational. Same is the case with the water filtration plants, we need more resources to cope operation and maintenance cost. If the water filtration plants do not get proper and regular attention, the water from these filtration plants would be more contaminated and dangerous for health as of that collected earlier from other primary sources.
(7) Though, according to the PCRWR figures on per capita water availability Pakistan is a water-stress country, there is more than enough water in the for domestic purposes, for agriculture and for industry. The problem is the sub-optimal use and inadequate storage capacity of available water resources.
(8) Projections based on respective actual elasticity show that a total number of 5.72 million households (approximately 38.5 million people) lacked access to safe drinking water source in 2004-05. By year 2015, a total number of 7.84 million households (approximately 52.8 million people) will be deprived of safe drinking water in Pakistan.
(9) Projections based on respective actual elasticity show that a total number of 7.52 million households (approximately 50.7 million people) lacked access to improved sanitation in 2004-05. By year 2015, a total number of 6.34 million households (approximately 43.2 million people) will have no access to improved sanitation in Pakistan.
Policy Implications
(1) If we are committed to decrease poverty, to improve the health and living standard of our people, to increase the productivity levels and if social exclusions are to be minimised, then there is a desired need of coherent policy framework and investment in the WATSAN sector underlining the quantity and quality issues of water and environmental sanitation.
(2) Considering growing population, urbanisation, industrialisation, and growing urban development, there is a desired need to increase the coverage to safe drinking water and hygiene sanitation in Pakistan. Provision of WATSAN services is the legal responsibility of the provinces and local governments, therefore, the policy makers and provincial and local government representatives must realise the

44
worsening situation and should support to boost up the share of WATSAN expenditure in the national GDP.
(3) The national water and sanitation policies documents provide a broader framework of action. However, these policies should be pro-poor and must be revised after every five years including an independent mid-term and post evaluations.
(4) Nevertheless, the Pakistani government realises the importance of safe drinking water and environmental sanitation, she spends the least on WATSAN sector. Government spending on WATSAN after becoming a signatory to the UN–MDGs is not encouraging; showing just an improvement of 0.01 percent of GDP. The government should revise its financing policy and invest more as per demand.
(5) Government should support cost effective and low cost maintenance WATSAN schemes. Moreover, offering subsidies to households underlining treatment of drinking water at consumer/household level should be considered instead of spending a lot of money in complex and costly schemes.
(6) Leakage and wastage of water must be minimised; causing 30 to 50 percent loss of the total drinking water supply. Awareness must be propagated to minimise the thoughtless and wasteful activities like using running tap water to wash cars or irrigating the lawns and home garden unnecessarily. Each of us has to realise that less water used means less wastewater produced.
(7) The water supply agencies should install meters to change the consumers on the basis of “pay as you use”.
(8) The public and private sectors are giving insufficient attention to the neglected WATSAN sub-sectors, i.e. waste water treatment and solid waste management. If immediate actions will not be taken to address these issues, the remaining water quantity and quality will adversely affect the health, education and economic sectors.
(9) The Environmental Protection Agency (EPA) and allied departments should ensure higher treatment coverage, underlining safe disposal of waste water from households, commercial and industrial units before discharging it to the mainstreams, and improved drainage network. As this has an implication for quality of water for drinking (especially, downstream).
(10) The Environmental Protection Agency (EPA) and allied departments should ensure safe disposal of solid wastes from households and from other enterprises including industrial and medical units in major cities and other urban areas, and encouraging recycling and treatment of toxic solid wastes from industrial sites and form medical enterprises.

45
(11) The government expenditure on WATSAN, as given in the PRSP, presents a collective outlay which does not tell the proportionate share of water and sanitation separately. Therefore, to assess the impact of expenditure on the coverage of water and sanitation separately is not viable without making assumptions. The budgeting of the water and sanitation sectors must be independent to assess their outcomes and impact.
REFERENCES
A Movement Towards Total Sanitation in India, International Sanitation Conference, Islamabad, 2006.
Ahmad, E., and A. Sattar (2007) Awareness and the Demand of Safe Drinking Water Practices. Pakistan Institute of Development Economics, Islamabad. (Working Paper No. 21.)
Akram K., T. Aslam, and R. Hifza (2005) Water Quality Report, Pakistan Council for Research in Water Resources. Pakistan Council for Research in Water Resources.
Balochistan, Government of (2004) Multiple Indicator Cluster Survey. Planning and Development Department, Balochistan.
Black, Maggie (2004) The No-Nonsense Guide to Water. New Internationalist Publications Ltd.
Bosch, Christophe, Kirsten Hommann, Gloria Rubio, Claudia Sadoff, and Lee Travers (2002) Poverty Reduction Strategy Paper Sourcebook, Water and Sanitation. Macroeconomic and Sectoral Approaches. Volume 2, World Bank, Washington, D. C.
C., Robin, and Jannet K. (2004) The Atlas of Water. Earthscan Publications. Centre for Research on Poverty Reduction and Income Distribution, United
Nation Development Program and UNOPS (2000) Pakistan Human Condition Report. Islamabad, Pakistan.
Devolution Trust for Community Empowerment (2004-05) National Report on Social Audit of Governance and Delivery of Public Services.
Gorter and Sandiford (1997); Arif and Ibrahim (1998); Heller (1999); Ahmed and Alibhai (2001); World Bank (2000) and Ali (2001) Pakistan Social Living-standard Measure (2004-05) Federal Bureau of Statistics. Government of Pakistan, Islamabad, Population Reference Bureau, World Population Datasheet 2006, http://www.prb.org/Publications/ Datasheets/2006/2006WorldPopulationDataSheet.aspx http://www.who.int/water_sanitation_health/publications/facts2004/en/index.html
46
Human Development Report (HDR) (2006) Beyond Scarcity: Power, Poverty and the Global Water Crisis. United Nations Development Programme (UNDP).
Ismail, Aquila, Solid Waste Management (2001) City Press Karachi. Centre for Research on Poverty Reduction and Income Distribution (2004, 2005, 2006) Pakistan MDG Report. Islamabad, Pakistan.
Meera, M. (2003) Meeting the Financing Challenge for Water Supply and Sanitation. The World Bank Water and Sanitation Programme.
Ministry of Environment (2003) National Drinking Water Policy. Government of Pakistan. http://www.environment.gov.pk/act-rules/D_NATIONAL_ DRINKING_WATER_POLICY.pdf
Mukul K. and K. M. Atul (2005) Water and Sanitation in South Asia in the Context of the Millennium Development Goals. South Asia Economic Journal 6:1, 99–115.
NWFP, Government of (2001) Multiple Indicator Cluster Survey. Planning and Development Department, NWFP.
Pakistan Council of Research in Water Resource (2002) Strategies to Address the Present and Future Water Quality Issues.
Pakistan Institute of Development Economics–UNICEF (2002) Cost and Impact Analysis of Water Supply and Environmental; Sanitation in Pakistan.
Pakistan, Government of (2005) National Environment Policy. Ministry of Environment. http://www.environment.gov.pk/nep/policy.pdf
Pakistan, Government of (2006) National Sanitation Policy (draft). Ministry of Environment. http://www.asb.org.pk/sanitationpolicy.pdf
Pakistan, Government of (2007) Annual PRSP Reports 2000–2005. Ministry of Finance, Islamabad. (Poverty Reduction Strategy Papers.) http://www. finance.gov.pk/poverty/home.html
Pakistan, Government of (n.d.) Medium Term Development Framework (2005–10) Ministry of Planning and Development, Islamabad.
Public Private Infrastructure Advisory Facility (2002) New Design for Water and Sanitation Transaction.
Punjab, Government of (2003-04) Multiple Indicator Cluster Survey. Planning and Development Department, Punjab.
Sindh, Government of (2003-04) Multiple Indicator Cluster Survey (draft). Planning and Development Department, Sindh.
Tahir, M. A., et al. (1994) Survey of Drinking Water Quality in the Rural Areas of Rawalpindi District, Pakistan Council for Research in Water Resources, Islamabad.
United Nation Development Programme (2006) Estimating the Cost to Achieve Millennium Development Goals in Pakistan. United Nation Development Programme, Ministry of Finance, Islamabad, Pakistan.

47
United Nation Development Programme (UNDP) and World Bank Water and Sanitation Programme (1998) National Seminar on Urban Environmental Sanitation. Seminar Report.
United Nations Children Fund (UNICEF) (2004) State of the World’s Children Report.
World Bank (2005) Scaling-up Rural Sanitation in South Asia. Islamabad, Pakistan.
World Health Organisation (2004) Water, Sanitation and Hygiene Links to Health, Fact and Figures.
World Health Organisation (2005) Sanitation and Hygiene Promotion: Programming Guideline. http://www.who.int/water_sanitation_health/ hygiene/sanhygpromotoc.pdf