pierre j. verlinden - eupvsec · 3 cost of pv modules recent manufacturing cost is comparable for...
TRANSCRIPT
Perspectives for cost decline in the PV industry
EU PVSEC 2016, MunichIEA PVPS Task 1Enhancing PV Competitiveness with Energy StorageJune20th, 2016
Pierre J. Verlinden

2
Cost of PV modules
Learning Rates:
c‐Si: 22.8%
CdTe : 16.3%
CIGS : 8.1%
Crystalline Si technologies benefit from standardization (tools and processes) and larger experience (cumulative production)
[1] Kersten et al., 26th EUPVSEC, p4697, 2011.[2] Photon International, 2011‐2014[3] ITRPV 2014, http://www.itrpv.net/[4] Cost data from financial reports of various companies[5] Verlinden et al. 29th EUPVSEC, 2013

3
Cost of PV modules
Recent manufacturing cost is comparable for silicon wafer‐based and thin films technologies.
Learning rate (LR) for c‐Si, CdTe and CIGS is 22.8%, 16.3% and 8.1% respectively.
Update 2016:
Crystalline Si < ~ 0.40 $/W
CdTe < ~ 0.50 $/W
0.56 $/W (2014)0.58 $/W
0.76 $/W
Mod
ule

4
Cost of PV modules (Projection to 2020)
Recent manufacturing cost is comparable for silicon wafer‐based and thin films technologies.
Learning rate (LR) for c‐Si, CdTeand CIGS is 22.8%, 16.3% and 8.1% respectively.
Assuming 20% annual production growth yields prediction of cost in 2020: 0.64 (CIGS), 0.42 (CdTe) and 0.34 (c‐Si) $/W
Reducing cost (material, labor, Capex, etc.) while improving efficiency is key.
0.34 $/W (2020)
0.42 $/W
0.64 $/W
Mod
ule
5
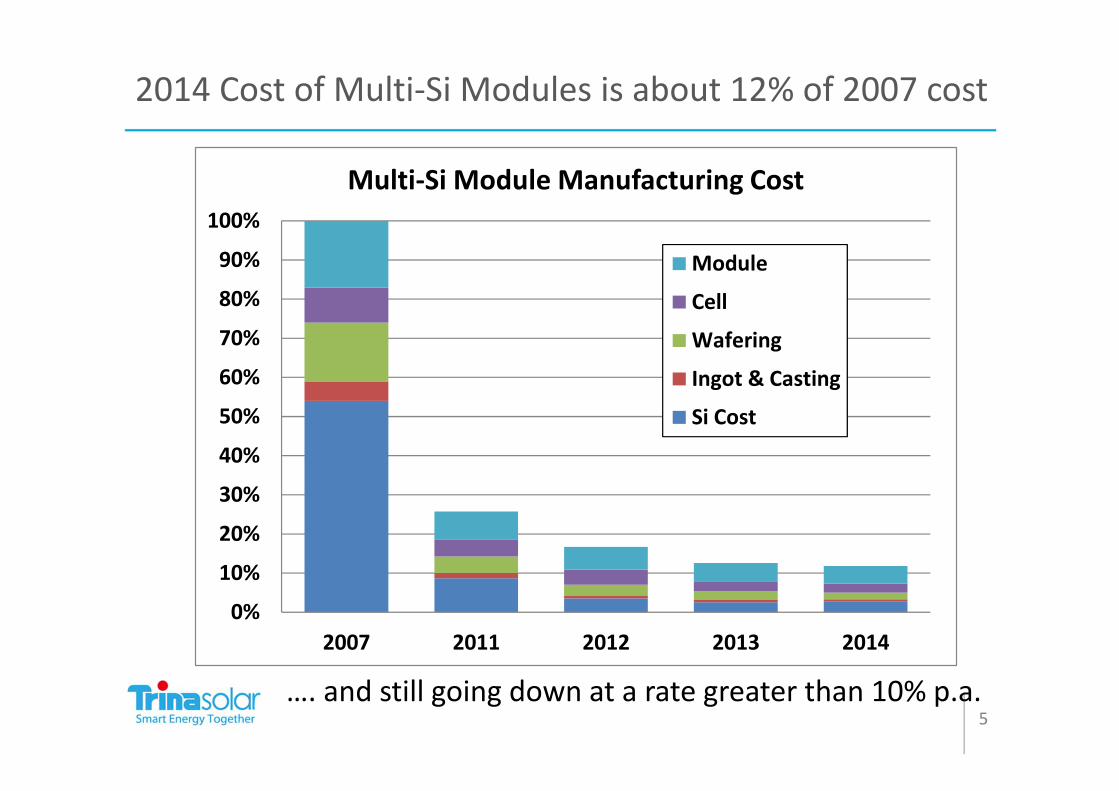
2014 Cost of Multi‐Si Modules is about 12% of 2007 cost
0%
10%
20%
30%
40%
50%
60%
70%
80%
90%
100%
2007 2011 2012 2013 2014
Multi‐Si Module Manufacturing Cost
Module
Cell
Wafering
Ingot & Casting
Si Cost
…. and still going down at a rate greater than 10% p.a.

Manufacturing Cost of Multi‐Si Module

7
Total Manufacturing Cost (Multi‐Si) 2011‐2015
Avg. ‐27.75% per year
Avg. ‐12.5% per year

Silicon Cost has reached a bottom value
8
Almost no change
‐56.2% per year

Silicon Cost vs. Non‐Silicon Cost
9
Average ‐18.8% per year

Non‐Silicon Cost
10

Manufacturing Improvements
11
Automation
Productivity Improvement

12
Drivers to cost reduction
Current cost trend ‐12% p.a. The main drivers are: Standardization of the entire supply chain, processes, tools, materials,…
CAPEX– Manufacturing tools made in China
Efficiency improvement– About +5W per year in module power: => cost ‐2% p.a.
Economies of scale, lines running at capacity, ….
12
13
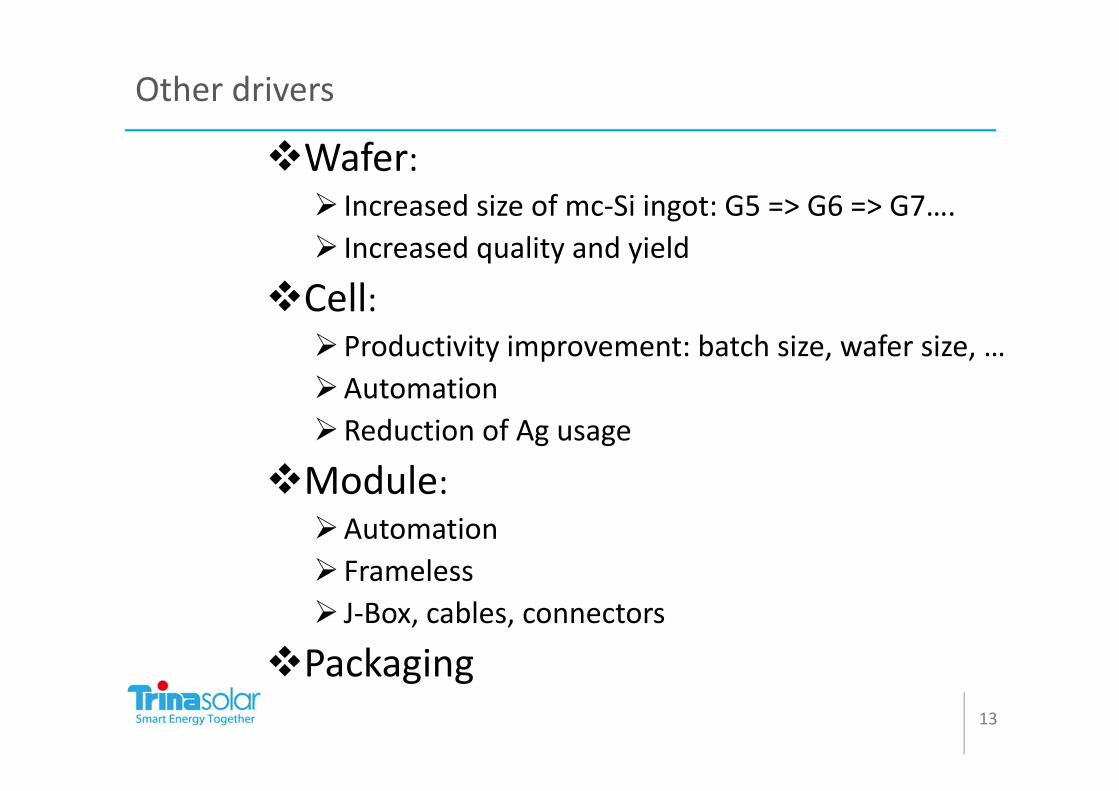
Other drivers
Wafer: Increased size of mc‐Si ingot: G5 => G6 => G7…. Increased quality and yield
Cell: Productivity improvement: batch size, wafer size, …AutomationReduction of Ag usage
Module:Automation Frameless J‐Box, cables, connectors
Packaging

14
Conclusions
Learning Curve analysis based on sales price and real manufacturing cost shows that the learning rates of Si, CdTe and CIGS are significantly different (LR: Si > CdTe > CIGS)
Crystalline Si Technology will keep its cost advantage Module efficiency continues to improve (about 2% rel. p.a.) After 2011, cost continued to decrease at a rate > 12% p.a. Silicon feedstock cost reached a “bottom value” Cost reduction rate is similar in every part of the process Main drivers in cost reduction: Standardization of the entire
supply chain, Capex reduction, productivity enhancement, efficiency improvement

www.trinasolar.com
CHINA
SINGAPORE
JAPAN
CANADA
CHILE
U.S.A.
U.K.
GERMANY
FRANCE
ITALY
SPAIN
SWITZERLAND
AUSTRALIA
Acknowledgements:• Thanks to all the members of the Crystallization,
Solar Cells and Modules R&D teams at Trina Solar• This work is supported by the National High‐Tech
R&D Program (863 program) of the Ministry of Science and Technology of the P.R. China under project number 2012AA050303.