piezoresistiv e foam sensor arr ay s for marine applications
TRANSCRIPT

Piezoresistive foam sensor arrays for marine applications
The MIT Faculty has made this article openly available. Please share how this access benefits you. Your story matters.
Citation Dusek, Jeff E. et al. “Piezoresistive Foam Sensor Arrays for MarineApplications.” Sensors and Actuators A: Physical 248 (September2016): 173–183 © 2016 Elsevier B.V.
As Published http://dx.doi.org/10.1016/J.SNA.2016.07.025
Publisher Elsevier BV
Version Original manuscript
Citable link http://hdl.handle.net/1721.1/118459
Terms of Use Creative Commons Attribution-NonCommercial-NoDerivs License
Detailed Terms http://creativecommons.org/licenses/by-nc-nd/4.0/

Piezoresistive Foam Sensor Arrays for Marine Applications
Jeff E. Duseka,1,∗, Michael S. Triantafylloua, Jeffrey H. Langb
aDepartment of Mechanical Engineering, Massachusetts Institute of Technology, 77 Massachusetts Ave., Cambridge,Massachusetts 02139
bElectrical Engineering and Computer Science Department, Massachusetts Institute of Technology, 77 Massachusetts Ave.,Cambridge, Massachusetts 02139
Abstract
Spatially-dense pressure measurements are needed on curved surfaces in marine environments to providemarine vehicles with the detailed, real-time measurements of the near-field flow necessary to improve per-formance through flow control. To address this challenge, a waterproof and conformal pressure sensor arraycomprising carbon black-doped-silicone closed-cell foam (CBPDMS foam) was developed for use in marineapplications. The response of the CBPDMS foam sensor arrays was characterized using periodic hydrody-namic pressure stimuli from vertical plunging, from which a piecewise polynomial calibration was developedto describe the sensor response. Inspired by the distributed pressure and velocity sensing capabilities ofthe fish lateral line, the CBPDMS foam sensor arrays have significant advantages over existing commercialsensors for distributed flow reconstruction and control. Experimental results have shown the sensor arraysto have sensitivity on the order of 5 Pascal, dynamic range of 50-500 Pascal; are contained in a waterproofand completely flexible package, and have material cost less than $10 per sensor.
Keywords: Pressure Sensors, Carbon Black, Smart-skins, Hydrodynamics, Foam
1. Introduction
Operating in the marine environment places uniquechallenges on unmanned systems that require novelapproaches to sensing and control. Marine vehicleperformance is largely influenced by interactions withthe flow around their hull, both self-generated andenvironmentally-driven. To improve performancethrough flow control, a detailed, real-time measure-ment of the near-field flow is necessary, yet such sens-
∗Corresponding authorEmail address: [email protected] (Jeff E. Dusek)
1This work is based on a portion of the author’s doctoralthesis [1].
Abbreviations CB: Carbon Black, PDMS: Poly-dimethylsiloxane, CBPDMS: Carbon black-PDMS Composite,Ag-CBPDMS: Silver-carbon black-PDMS composite
ing capability is presently unavailable. In nature, fishhave overcome this sensory deficit by utilizing feed-back from the lateral line sensory organ. Compris-ing two subsystems that act as distributed velocityand pressure sensor arrays, respectively, the lateralline has been shown to mediate such complex be-haviors as obstacle detection and avoidance, organ-ism tracking, vortex wake synchronization, and co-operative schooling. When considering the ability offish to thrive in the inhospitable marine environment,achieving even a portion of their capabilities withengineering systems would have tremendous bene-fits to oceanographic research, marine vehicle per-formance, and undersea exploration. To address thechallenges associated with obtaining spatially-densepressure measurements on curved surfaces in marineenvironments, a new waterproof and conformal pres-
Preprint submitted to Sensors and Actuators A: Physical March 8, 2016
arX
iv:1
603.
0215
7v1
[ph
ysic
s.in
s-de
t] 7
Mar
201
6

sure sensor array was developed based on a closed-cellpiezoresistive foam comprising carbon black-doped-silicone composite (CBPDMS foam).
1.1. A Biological Solution: The Lateral Line
Solutions to complex engineering problems can of-ten be found by looking to nature for inspiration,especially when considering the marine environmentwhich is inhospitable to humans, but contains an in-credible degree of bio-diversity. The ability of fish tonavigate the undersea world at high speeds and inclose proximity to obstacles and other individuals isparticularly attractive to ocean engineers seeking toenhance the performance of marine vehicles. The lat-eral line system found in all species of fish and someamphibians is a hair-cell based mechanosensory or-gan comprising two primary subsystems: superficialneuromasts and canal neuromasts. While the twosubsystems share physiological elements, they pro-vide different information to the fish about the sur-rounding fluid flow, allowing for a wide variety ofbehaviors.
1.1.1. Lateral Line Physiology
The main building block of the distributed lat-eral line system is neuromasts, small epithelial organswhich comprises both mechanosensory hair cells andnon-sensory cells. Superficial neuromasts are locatedon the surface of the skin and are generally consid-ered as velocity sensors [2, 3], where stimulation iscaused by deflections due to viscous drag [4].
The canal subsystem comprises a series of canalsbeneath the skin and connected to the surfacethrough an array of pores. When exposed to a pres-sure gradient between adjacent pores, a local flow isinduced in the canal, stimulating canal neuromastslocated within the canal and between the pores [4, 5].The deflection of the canal neuromasts is propor-tional to the velocity within the canal, which is pro-portional to the pressure difference between pores[4, 5]. In this way, the trunk canal subsystem acts ina similar fashion to an array of differential pressuresensors mounted on the animal’s body in hydrody-namically sensitive regions [6].
2. Bringing Lateral Line Inspired Capabilitiesto Marine Vehicles
In order to achieve the lateral line mediated ca-pabilities observed in fish with marine vehicles, ad-vancements are needed in the characterization andutilization of near-body hydrodynamic pressure sig-nals, as well as in the development of bio-inspired dis-tributed sensor arrays. The fish lateral line and thebehaviors it mediates provides an excellent motiva-tion for the development of distributed sensor arrays,however the design requirements for arrays intendedfor marine vehicle use must be scaled appropriatelyto the hydrodynamic stimuli of interest.
To elucidate the design guidelines for a distributedhydrodynamic pressure sensor array, a series of tow-ing tank and field experiments were conducted us-ing arrays of commercially available pressure sensors.Experiments with an instrumented model sailboathull of length L=1 m were conducted in the MITtowing tank [7]. An array of 10 Honeywell 19mm se-ries pressure sensors were connected to taps along thelength of the model’s hull and it was found that thepressure measurements could be used to accuratelyestimate the hull’s angle of attack. Similarly, Honey-well 19mm pressure sensors were utilized to study theformation and shedding of leading edge vortices froma hydrofoil towed at large angles of attack [8]. Theutility of near-body flow sensing on a surface vehiclewas investigated experimentally using an unmannedkayak vehicle equipped with an array of 20 HoneywellSPT series pressure sensors mounted inside the vehi-cle hull, necessitating the drilling of holes throughthe hull to access the flow [9]. It was found that thevehicle dynamics in pitch and roll were measurableby the pressure sensor array, as well as the initiationof vehicle maneuvers due to a characteristic pressuresignature consistent with added mass effects duringunsteady vehicle motions. The magnitude and fre-quency of dynamic pressure signals measured duringthese experiments, and analysis of the sensor spacingon the foil and hull surfaces, lead to the developmentof design guidelines for distributed pressure sensorarrays given in Section 2.1.
2

2.1. Guidelines for Hydrodynamic Pressure SensorArrays
In general, the sensors used in the studies out-lined in Section 2 were rigid and too large for sur-face mounting applications, and were not designedfor prolonged exposure to moisture. Based on theresults of these studies, the attributes of a pressuresensor array designed specifically for marine use weredeveloped as follows.Flexibility Pressure sensor arrays to be surface
mounted on curved surfaces with radius of cur-vature ∼5-10 cm, consistent with unmanned ve-hicle hulls [8, 9, 7].
Form Factor Sensor spacing should be less than 5cm for vehicles on the 1-3 m scale. Sensor thick-ness should be < 5 mm to avoid vortex shedding[8, 6, 7].
Robustness Sensor arrays are meant for sustainedunderwater or exposed operation and may besubject to impacts.
Dynamic Range For marine vehicles of length ∼1-3 m, dynamic pressure stimuli range from ∼10-400 Pa [8, 9, 6, 7].
Sensitivity For marine vehicles of length ∼1-3 m,sensitivity of ∼10 Pa is desired to characterizehydrodynamic stimuli [8, 9, 6, 7].
Cost Sensor cost should be reduced from ∼ $100 persensor to ∼ $10 per sensor [9].
2.2. Doped-Polymer ‘Smart-Skins’ for Marine Appli-cations
Based on the operational requirements for usein distributed pressure sensing on marine vehicles,doped polymer ‘smart-skin’ arrays offer the best com-bination of performance characteristics for marineuse. Doped polymers allow for the development of acompletely waterproof, stretchable, and flexible sen-sor array through the careful selection of bulk matrixmaterial and conductive dopant. The flexibility, ro-bustness, and resistance to moisture of bulk matrixmaterials like PDMS (silicone) make doped compos-ites well suited for prolonged environmental exposurewhile surface mounted on marine vehicle hulls. Ad-ditionally, controlling the material properties of thebulk matrix through the introduction of porosity has
been shown to increase sensitivity in carbon black-PDMS composites, allowing for piezoresistive com-posites to be optimized for pressure ranges consis-tent with hydrodynamic stimulus [10]. Finally, dopedpolymers make use of cheap and easy to work withcomponent materials, allowing for the scaling of dis-tributed pressure sensor arrays to spatially-dense ap-plications.
3. Carbon Black-PDMS Composite SensorDevelopment
Carbon black-PDMS foam pressure sensor arraysrely on the piezoresitivity, or variation in resistancewith strain, of carbon black doped PDMS (silicone)to provide an indirect measurement of pressure stim-ulus. Carbon black-PDMS (CBPDMS) compositehas been studied as an active material for pressureand shear sensors due to its low Young’s modulus,ease of fabrication, and low cost [11, 12, 13, 14, 15].Each component composite in the sensor array uti-lizes PDMS as the matrix material, ensuring strongbonding between sensor components while retainingoverall array flexibility. By varying the carbon blackdoping and Young’s modulus between sections of thesensor array, a linear four by one array of sensor chan-nels was created here. Electrodes were fabricated us-ing a silver-carbon black-PDMS (Ag-CBPDMS) com-posite with a high mass fraction of silver to ensurehigh conductance and low piezoresistivity, as a dis-cussed in Section 4.1.2. Sensing elements were fab-ricated using a closed-cell CBPDMS foam (Section4.1.3) with a low Young’s modulus and carbon blackconcentration near the percolation threshold to en-hance piezoresistivity and improve the sensitivity ofthe array to hydrodynamic stimuli.
3.1. Models of CBPDMS Piezoresistivity
Above a mass fraction of carbon black known asthe percolation threshold, carbon black doped PDMSforms a conductive composite. When the percola-tion threshold is reached, continuous chains of carbonblack particles create conductive pathways throughthe PDMS bulk material; while below the percolationthreshold, CBPDMS composite behaves like an insu-lator. The piezoresistive behavior of CBPDMS relies
3

on the formation and breakdown of these conductivechains as the PDMS matrix material is deformed dueto external stimulus.
The resistance change of CBPDMS compositewhen subjected to an external pressure stimulushas been primarily described using two models, thecompressible and incompressible models [14]. Bothpiezoresistive effects have been observed in CBPDMScomposites, and the relationship between resistanceand strain is highly dependent on the filler material,the type of polymer matrix, and the nature of theloading [14]. For the CBPDMS foam pressure sen-sor array using four-point probe measurements andresponding to isotropic hydrodynamic stimuli, the re-sistance change was found to be consistent with thecompressible model.
The compressible model of CBPMS piezoresistiv-ity, shown in Figure 1, states that as the PDMS ma-trix is compressed due to external pressure stimulus,the volume fraction of CB particles within the com-posite is increased, allowing for the formation of newcontinuous conductive pathways and decreasing theresistance of the composite [14, 16, 17]. When theexternal pressure stimulus on the composite is de-creased, the material relaxes, and the newly formedconductive pathways are broken, leading to a recov-ery of the composite resistance.
3.2. DC Response of CBPDMS Composite
Carbon black-PDMS composites provide a re-versible piezoresistive response to dynamic pressurestimulus, but are not well suited for low frequency,DC type stimulus. Over time at a continuous strain,conductive pathways relax and resistance changes, ef-fectively acting as a high pass filter [18]. Efforts havebeen made to characterize the low frequency behaviorof CBDPMS composites through the use of Burgermodels and modifications of the Burger model byYaul [13] and Lacasse [14]. The hydrodynamic pres-sure stimuli of interest to marine vehicles typicallyhave frequencies ranging from 0.5 Hz (water waves,vortex shedding) to 35 Hz (predator and prey de-tection), and the dynamic response of the CBPDMSfoam sensor arrays will be the focus of this study.
A B
Figure 1: The compressible model of CBPDMS piezoresistivityin which the PDMS matrix is compressed under load, leadingto an increased volume fraction of CB particles in the compos-ite and the formation of new conductive pathways, decreasingresistance. The light grey boxes represent the PDMS foambulk material, and dark grey circles represent free carbon black(CB) particles that have not formed conductive chains. Thegold circles represent CB particles that have linked together toform continuous conductive pathways through the bulk PDMSfoam matrix.
3.3. Addition of Porosity to CBPDMS for IncreasedSensitivity
Version one ‘smart-skin’ pressure sensors were de-veloped utilizing a solid CBPDMS composite ar-ranged in a strain-gauge arrangement on solid PDMSsubstrates [13, 19]. To achieve the sensitivity requiredfor the measurement of hydrodynamic stimuli, strainenhancing diaphragms were molded into the PDMSsubstrates, complicating the sensor fabrication andreducing array reliability. To achieve the sensitivityprovided by the strain enhancing diaphragms with-out the need for additional molded features, the in-troduction of porosity into PDMS through the use ofa sacrificial sugar scaffold, as demonstrated by Kingand Cha [20, 21], was chosen as a viable method tolower Young’s modulus and increase piezoresistivity.
Using a sacrificial sugar scaffold with CBPDMScomposite, version two open-cell CBPDMS foampressure sensor arrays were developed for hydrody-namic sensing applications [10]. The Young’s modu-lus of the CBPDMS active material was reduced bytwo orders of magnitude, leading to a 25 times in-crease in sensitivity over the version one strain-gaugebased ‘smart-skin’ arrays. The open-cell CBPDS
4
foam sensor arrays were tested in the MIT TowingTank using the dynamic pressure signal generated bysurface water waves, demonstrating the utility of thearrays in hydrodynamic sensing applications.
The benefits of the strain enhancing diaphragmswere largely retained in a robust and flexible sim-plified geometry by introducing porosity into theCBPDMS composite to create an open-cell foam[10].However, the introduction of porosity introduceddifferent problems, particularly the time consumingneed to soak the CBPDMS for 24 hours to dissolvethe sugar scaffold, and the requirement to waterproofthe open-cell foam. It was also found that the versiontwo CBPDMS open cell foam sensors were thickerthan desired, and required special attention to bepaid to electrical connections because of the reducedcontact area between the porous material and thewires. Despite these challenges, the improvement insensitivity shown by the CBPDMS foam motivateda continued effort to develop the material for use inhydrodynamic pressure sensing applications.
3.4. Sensor Array Development Goals
The goals of version three sensor development aresummarized below:
1. Retain or improve upon sensitivity of open-cellCBPDMS foam
2. Eliminate the need for additional waterproofinglayers
3. Improve contact between electrodes and piezore-sistive material
4. Improve robustness of the sensor array and as-sociated electrical wiring
4. Closed-Cell CBDPMS Foam Sensor Arrays
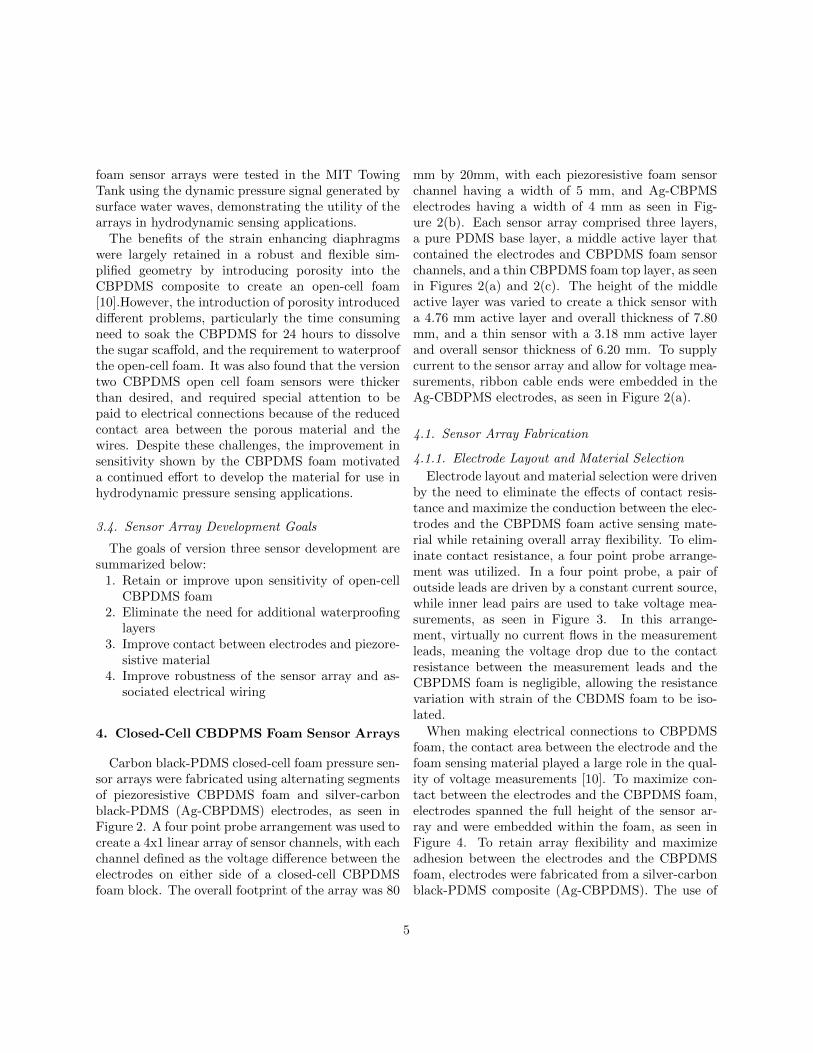
Carbon black-PDMS closed-cell foam pressure sen-sor arrays were fabricated using alternating segmentsof piezoresistive CBPDMS foam and silver-carbonblack-PDMS (Ag-CBPDMS) electrodes, as seen inFigure 2. A four point probe arrangement was used tocreate a 4x1 linear array of sensor channels, with eachchannel defined as the voltage difference between theelectrodes on either side of a closed-cell CBPDMSfoam block. The overall footprint of the array was 80
mm by 20mm, with each piezoresistive foam sensorchannel having a width of 5 mm, and Ag-CBPMSelectrodes having a width of 4 mm as seen in Fig-ure 2(b). Each sensor array comprised three layers,a pure PDMS base layer, a middle active layer thatcontained the electrodes and CBPDMS foam sensorchannels, and a thin CBPDMS foam top layer, as seenin Figures 2(a) and 2(c). The height of the middleactive layer was varied to create a thick sensor witha 4.76 mm active layer and overall thickness of 7.80mm, and a thin sensor with a 3.18 mm active layerand overall sensor thickness of 6.20 mm. To supplycurrent to the sensor array and allow for voltage mea-surements, ribbon cable ends were embedded in theAg-CBDPMS electrodes, as seen in Figure 2(a).
4.1. Sensor Array Fabrication
4.1.1. Electrode Layout and Material Selection
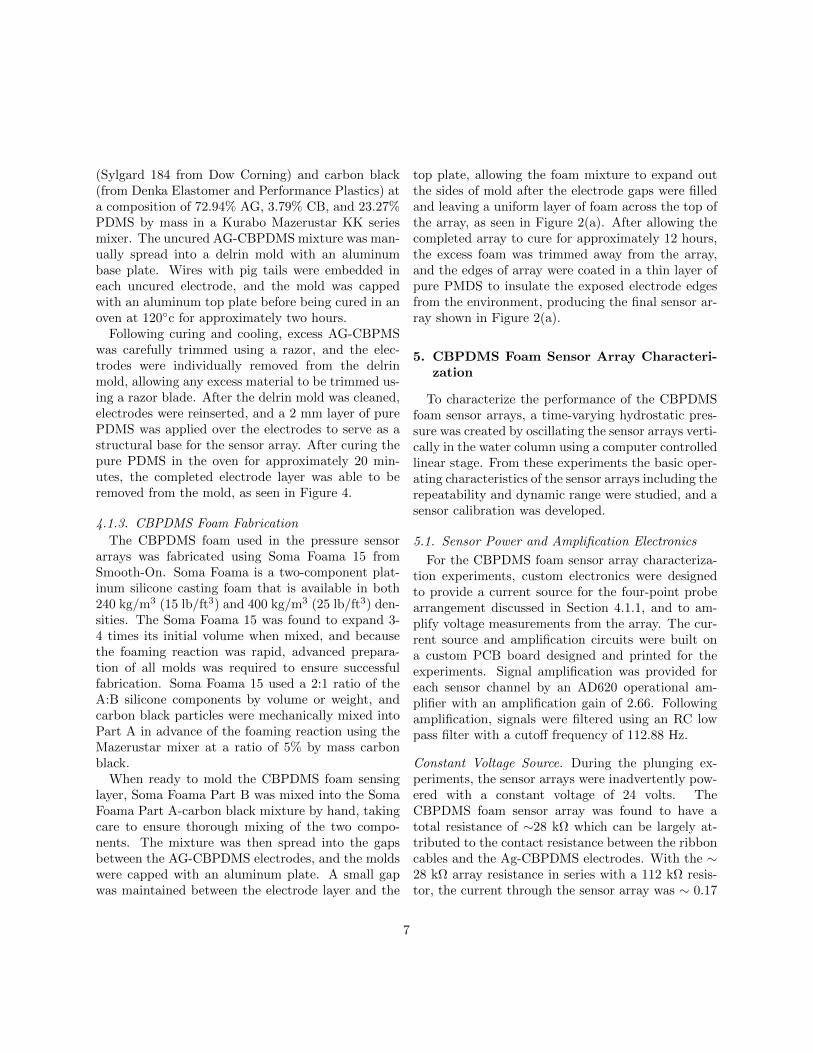
Electrode layout and material selection were drivenby the need to eliminate the effects of contact resis-tance and maximize the conduction between the elec-trodes and the CBPDMS foam active sensing mate-rial while retaining overall array flexibility. To elim-inate contact resistance, a four point probe arrange-ment was utilized. In a four point probe, a pair ofoutside leads are driven by a constant current source,while inner lead pairs are used to take voltage mea-surements, as seen in Figure 3. In this arrange-ment, virtually no current flows in the measurementleads, meaning the voltage drop due to the contactresistance between the measurement leads and theCBPDMS foam is negligible, allowing the resistancevariation with strain of the CBDMS foam to be iso-lated.
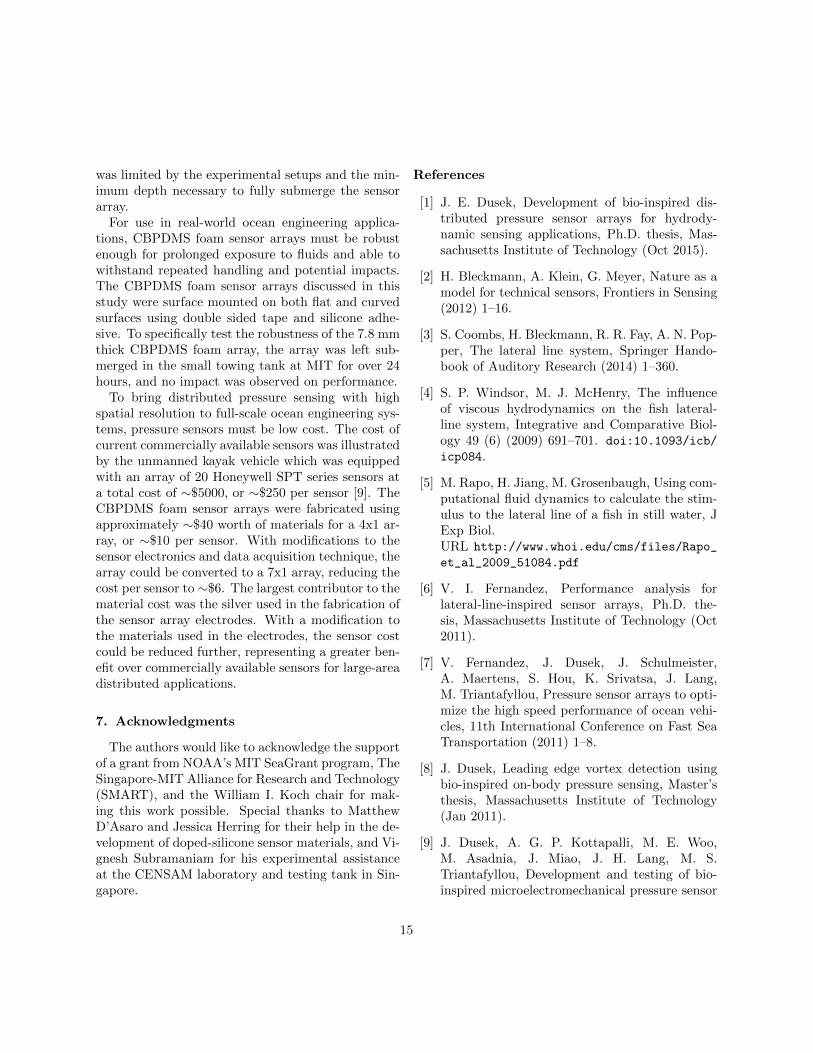
When making electrical connections to CBPDMSfoam, the contact area between the electrode and thefoam sensing material played a large role in the qual-ity of voltage measurements [10]. To maximize con-tact between the electrodes and the CBPDMS foam,electrodes spanned the full height of the sensor ar-ray and were embedded within the foam, as seen inFigure 4. To retain array flexibility and maximizeadhesion between the electrodes and the CBPDMSfoam, electrodes were fabricated from a silver-carbonblack-PDMS composite (Ag-CBPDMS). The use of
5
Top CBPDMS Foam Layer
Ribbon Cable to Electronics
(a) The top of the CBPDMS foam sensor array was coveredwith a thin layer of CBPDMS foam. The ends of a ribbon cablewere embedded in a Ag-CBPDMS electrodes during fabrication.
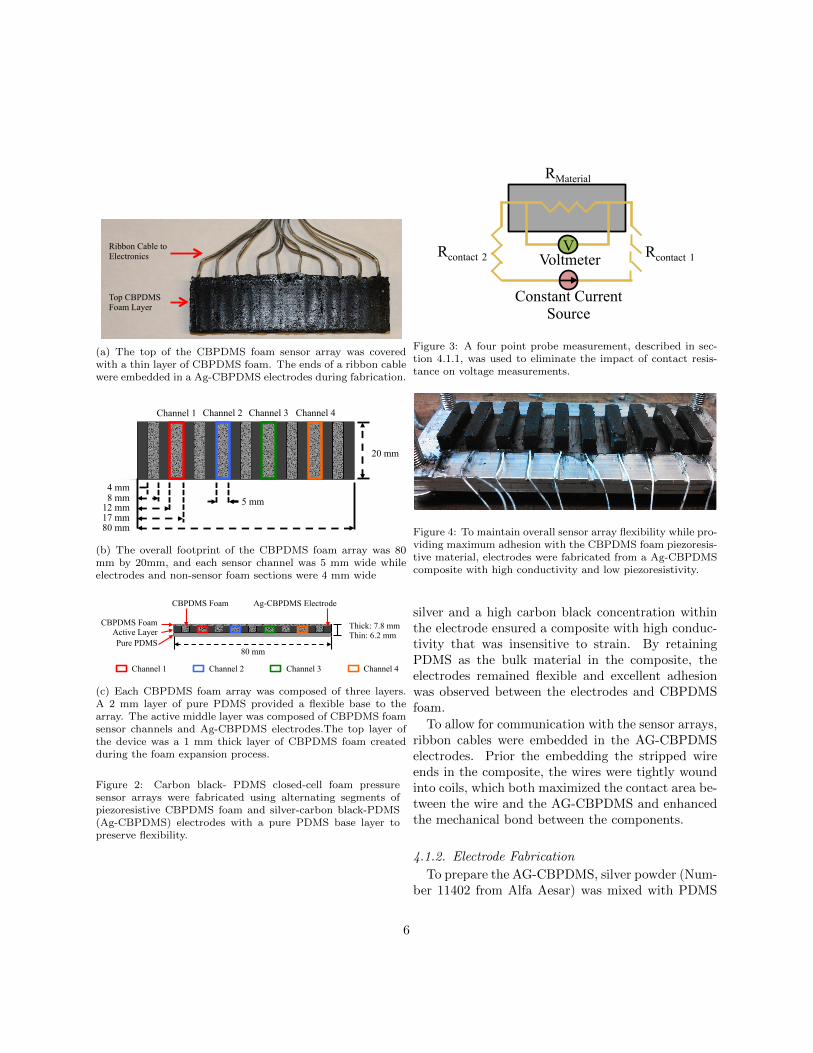
80 mm 17 mm 12 mm 8 mm 4 mm
5 mm
20 mm
Channel 1 Channel 2 Channel 3 Channel 4
(b) The overall footprint of the CBPDMS foam array was 80mm by 20mm, and each sensor channel was 5 mm wide whileelectrodes and non-sensor foam sections were 4 mm wide
80 mm
Thick: 7.8 mm Thin: 6.2 mm
CBPDMS Foam Active Layer Pure PDMS
CBPDMS Foam Ag-CBPDMS Electrode
Channel 1 Channel 2 Channel 3 Channel 4
(c) Each CBPDMS foam array was composed of three layers.A 2 mm layer of pure PDMS provided a flexible base to thearray. The active middle layer was composed of CBPDMS foamsensor channels and Ag-CBPDMS electrodes.The top layer ofthe device was a 1 mm thick layer of CBPDMS foam createdduring the foam expansion process.
Figure 2: Carbon black- PDMS closed-cell foam pressuresensor arrays were fabricated using alternating segments ofpiezoresistive CBPDMS foam and silver-carbon black-PDMS(Ag-CBPDMS) electrodes with a pure PDMS base layer topreserve flexibility.
VVoltmeter
RMaterial
Constant Current Source
Rcontact 1 Rcontact 2
Figure 3: A four point probe measurement, described in sec-tion 4.1.1, was used to eliminate the impact of contact resis-tance on voltage measurements.
Figure 4: To maintain overall sensor array flexibility while pro-viding maximum adhesion with the CBPDMS foam piezoresis-tive material, electrodes were fabricated from a Ag-CBPDMScomposite with high conductivity and low piezoresistivity.
silver and a high carbon black concentration withinthe electrode ensured a composite with high conduc-tivity that was insensitive to strain. By retainingPDMS as the bulk material in the composite, theelectrodes remained flexible and excellent adhesionwas observed between the electrodes and CBPDMSfoam.
To allow for communication with the sensor arrays,ribbon cables were embedded in the AG-CBPDMSelectrodes. Prior the embedding the stripped wireends in the composite, the wires were tightly woundinto coils, which both maximized the contact area be-tween the wire and the AG-CBPDMS and enhancedthe mechanical bond between the components.
4.1.2. Electrode Fabrication
To prepare the AG-CBPDMS, silver powder (Num-ber 11402 from Alfa Aesar) was mixed with PDMS
6
(Sylgard 184 from Dow Corning) and carbon black(from Denka Elastomer and Performance Plastics) ata composition of 72.94% AG, 3.79% CB, and 23.27%PDMS by mass in a Kurabo Mazerustar KK seriesmixer. The uncured AG-CBPDMS mixture was man-ually spread into a delrin mold with an aluminumbase plate. Wires with pig tails were embedded ineach uncured electrode, and the mold was cappedwith an aluminum top plate before being cured in anoven at 120c for approximately two hours.
Following curing and cooling, excess AG-CBPMSwas carefully trimmed using a razor, and the elec-trodes were individually removed from the delrinmold, allowing any excess material to be trimmed us-ing a razor blade. After the delrin mold was cleaned,electrodes were reinserted, and a 2 mm layer of purePDMS was applied over the electrodes to serve as astructural base for the sensor array. After curing thepure PDMS in the oven for approximately 20 min-utes, the completed electrode layer was able to beremoved from the mold, as seen in Figure 4.
4.1.3. CBPDMS Foam Fabrication
The CBPDMS foam used in the pressure sensorarrays was fabricated using Soma Foama 15 fromSmooth-On. Soma Foama is a two-component plat-inum silicone casting foam that is available in both240 kg/m3 (15 lb/ft3) and 400 kg/m3 (25 lb/ft3) den-sities. The Soma Foama 15 was found to expand 3-4 times its initial volume when mixed, and becausethe foaming reaction was rapid, advanced prepara-tion of all molds was required to ensure successfulfabrication. Soma Foama 15 used a 2:1 ratio of theA:B silicone components by volume or weight, andcarbon black particles were mechanically mixed intoPart A in advance of the foaming reaction using theMazerustar mixer at a ratio of 5% by mass carbonblack.
When ready to mold the CBPDMS foam sensinglayer, Soma Foama Part B was mixed into the SomaFoama Part A-carbon black mixture by hand, takingcare to ensure thorough mixing of the two compo-nents. The mixture was then spread into the gapsbetween the AG-CBPDMS electrodes, and the moldswere capped with an aluminum plate. A small gapwas maintained between the electrode layer and the
top plate, allowing the foam mixture to expand outthe sides of mold after the electrode gaps were filledand leaving a uniform layer of foam across the top ofthe array, as seen in Figure 2(a). After allowing thecompleted array to cure for approximately 12 hours,the excess foam was trimmed away from the array,and the edges of array were coated in a thin layer ofpure PMDS to insulate the exposed electrode edgesfrom the environment, producing the final sensor ar-ray shown in Figure 2(a).
5. CBPDMS Foam Sensor Array Characteri-zation
To characterize the performance of the CBPDMSfoam sensor arrays, a time-varying hydrostatic pres-sure was created by oscillating the sensor arrays verti-cally in the water column using a computer controlledlinear stage. From these experiments the basic oper-ating characteristics of the sensor arrays including therepeatability and dynamic range were studied, and asensor calibration was developed.
5.1. Sensor Power and Amplification Electronics
For the CBPDMS foam sensor array characteriza-tion experiments, custom electronics were designedto provide a current source for the four-point probearrangement discussed in Section 4.1.1, and to am-plify voltage measurements from the array. The cur-rent source and amplification circuits were built ona custom PCB board designed and printed for theexperiments. Signal amplification was provided foreach sensor channel by an AD620 operational am-plifier with an amplification gain of 2.66. Followingamplification, signals were filtered using an RC lowpass filter with a cutoff frequency of 112.88 Hz.
Constant Voltage Source. During the plunging ex-periments, the sensor arrays were inadvertently pow-ered with a constant voltage of 24 volts. TheCBPDMS foam sensor array was found to have atotal resistance of ∼28 kΩ which can be largely at-tributed to the contact resistance between the ribboncables and the Ag-CBPDMS electrodes. With the ∼28 kΩ array resistance in series with a 112 kΩ resis-tor, the current through the sensor array was ∼ 0.17
7

x z
Zaber T-Series linear stage
CBPDMS foam sensor arrays
3-D printed array holder
Figure 5: Vertical oscillation of the sensor arrays was providedby a computer-controlled Zaber T-Series linear stage mountedabove the large vehicle testing tank on the CREATE campusin Singapore.
mA. Because the voltage source was constant in thisarrangement, variations in the sensor array resistancecould lead to variations in the current being suppliedto the array. It was observed that during a typical ex-periment, the variation in CBPDMS foam resistancecould cause an ∼ 1% change in supply current. Be-cause the potential change in current was found tobe minor, it will be noted as a source of experimentalmeasurement error, as discussed in Section 5.4.3.
5.2. Plunging Experimental Setup
To allow for vertical plunging of the sensor arrays, aZaber T-Series linear stage (Model T-LSQ300B) wasmounted vertically above the testing tank, as seen inFigure 5. The CBPDMS foam pressure sensor arrayswere mounted in a 3-D printed holder which was at-tached to the linear stage using an aluminum plate.Because the aluminum plate was thin, oscillation ofthe sensor holder due to actuator vibrations or fluidinteractions was a consideration, but were found tobe negligible for the low frequencies (0.5-1 Hz) beinginvestigated.
The motion of the linear stage was controlled us-ing proprietary Zaber Console software running ona laboratory laptop, and connected to the stage viaa USB-serial converter. Motion of the Zaber stagewas provided by a stepper motor, and stage posi-tion and velocity values were reported by the Zaber
Console software. The position of the linear stagewas written to an output file throughout each exper-iment to allow the hydrostatic pressure acting on thearrays to be determined. The output voltage fromthe the pressure sensor arrays was recorded using anNI USB-6218 data acquisition board and National In-struments Labview software running on a laboratorylaptop.
5.3. Experiment Description and Parameters
To characterize the dynamic response of theCBPDMS foam pressure sensor arrays, oscillatoryplunging motions were used to generate a time-varying hydrostatic stimulus. Because of the limita-tions of the Zaber stage, and to minimize the impactof spurious vibrations on the experimental results,experiments were restricted to frequencies of 0.5 Hzand 1 Hz. In each experiment, the stage was posi-tioned with the still waterline level with the top ofthe array, as seen in Figure 5. To allow time syn-chronization between the stage position and the sen-sor voltage output, a step in the positive z directionwas executed at the beginning of each experiment tocreate an easily identifiable feature in both signals.Following the step move, ten oscillatory cycles wereexecuted with peak-to-peak amplitudes ranging from10mm to 30mm.
The total time-varying pressure (PT ) during theplunging experiments comprised both a hydrostaticpressure component (PH) and a dynamic pressurecomponent (PD), as shown in Equation 1. In Equa-tion 1, φ is the velocity potential, ρ is the fluid den-sity, and z is the vertical position of the sensor arraymidpoint. When considering the time-varying pres-sure from a simulated sinusoidal motion with a 30mmpeak-to-peak amplitude at 1 Hz, the dynamic pres-sure component was found to be at least two orders ofmagnitude smaller than the hydrostatic component,and therefore the dynamic pressure component wasneglected from future analysis.
8

PT = PH + PD (1)
PH = −ρ ∗ g ∗ z
PD = −ρ(∂φ
∂t+
1
2|∇φ|2
)It was observed during the course of the experi-
mental program that the sinusoidal motion createdby the Zaber stage was not always consistent in am-plitude and frequency. This was particularly evidentduring low frequency motions were the stage wouldoccasionally hesitate at the peak or trough of a cy-cle. These slight errors in amplitude and frequencywere accounted for by utilizing the actual positionoutput recorded from the stage during each experi-ment instead of relying on the anticipated frequencyand amplitude values.
5.4. Plunging Experiment Results
The voltage output signals from the CBPDMSfoam sensor were bandpass filtered using the ideal-filter function in Matlab. The filter is non-causalwith sharp cutoffs in the frequency domain and non-realizable in real time. The bandpass interval waschosen to be 0.2 to 3.0 Hz for the plunging experi-ments in order to remove any low frequency DC driftfrom the signals, as well as high frequency electricalnoise.
5.4.1. Inverse Pressure-Resistance Relationship
Figure 6 shows an inverse relationship exists be-tween voltage output and pressure magnitude whenthe CBPDMS foam arrays were subjected to an os-cillatory pressure stimulus. For a constant current,channel voltage is proportional to resistance throughOhm’s law, so it follows that the resistance change inthe CBPDMS foam sensing material was inverselyrelated to pressure. The inverse relationship be-tween pressure and resistance follows the compress-ible model of CBPDMS piezoresistivity discussed inSection 3.1. Throughout extensive testing of theCBPDMS foam sensor array using multiple hydrody-namic stimuli, the inverse relationship between the
resistance and pressure remained consistent and re-peatable, and it was concluded that for isotropic hy-drodynamic stimulus, the CBPDMS foam sensor ar-rays follow the compressible model of piezoresistivity.
5.4.2. Sensor Array Repeatability
To evaluate the repeatability of the CBPDMSfoam arrays, voltage was plotted versus hydrostaticpressure for the periodic plunging experiments. Tobe considered repeatable, the pressure-voltage pairsfrom multiple plunging cycles should fall on the samecurve.
As mentioned previously, the oscillatory motion ofthe Zaber stage varied slightly in amplitude and pe-riod throughout an experiment. To account for thesevariations, sensor output voltage values were selectedfor the times corresponding to the position outputsfrom the Zaber stage, as seen in Figure 6(b). In thisway, an accurate picture of the pressure-voltage rela-tionship for the array could be found.
A qualitative assessment of sensor array repeata-bility was found by plotting the results from six inde-pendent plunging experiments with the 7.8 mm thicksensor array on the same pressure vs. voltage axes,as seen in Figure 7(a). Within each experiment, thedata points were found to follow a consistent trend,qualitatively fulfilling the requirement of repeatabil-ity within a given experiment. Although the dynamicresponse of the sensor array appeared consistent be-tween independent experiments, variations in the DCoffset voltage were observed, leading to a distinctspread in the data points.
DC Offset Voltage. When the results from six inde-pendent plunging experiments with the 7.8 mm thicksensor array were plotted on the same pressure vs.voltage axes, it was observed that the DC voltage off-set varied between independent experiments, as seenin Figures 7(a). Because the CBDPSM foam sensorarray is intended for the measurement of AC pres-sure signals, the dynamic response of the array is ofprimary concern. In order to verify the repeatabil-ity of the dynamic response of the sensor array be-tween independent experiments, the DC voltage off-sets were adjusted for consistency, as seen in Figures
9

0 10 20
Time [s]
-0.01
-0.005
0
0.005
0.01
Fil
tere
d O
utp
ut
Volt
age
[v]
Inverse Press.-Volt. Relationship
50
100
150
200
250
Theo
reti
cal
Pre
ssure
[P
a]Ch. 2 Ch. 3 Ch. 4 P
H
(a) Plotting the hydrostatic pressure stimulus (black line) andthe CBPDMS foam sensor voltage output (solid colored lines)together shows that an inverse relationship exists between hy-drostatic pressure and output voltage for the CBPDMS foamsensing material. Because output voltage is proportional to re-sistance, it follows that the resistance change in the material isinversely proportional to pressure.
5 10 15 20
Time [s]
-0.006
-0.004
-0.002
0
0.002
0.004
0.006
Outp
ut
[v]
Sensor Output and Sample Times
Ch. 2 Ch. 3 Ch. 4
(b) To form pressure vs. voltage pairs for use in sensor arraycalibration, the channel voltages were resampled at times corre-sponding to Zaber stage position outputs (designated by circles,squares, and diamonds). The mean voltage has been removedfrom each channel voltage.
Figure 6: The voltage output from the CBPDMS foam sensorarray during oscillatory plunging revealed an inverse relation-ship between pressure and resistance. The voltage time serieswas sampled at discrete times corresponding with position out-puts from the Zaber stage in order to generate pressure-voltagepairs for use in sensor calibration. Sensor array channel 1 wasnot operational and is not shown.
7(b). With the DC voltage offset corrected, the re-sults from all six independent experiments were foundto have a repeatable non-linear pressure vs. voltageresponse.
5.4.3. Experimental Error in Plunging Results
Error in Voltage Measurement. During the plungingexperiments, the CBPDMS foam sensor array waspowered using a constant voltage source, as describedin Section 5.1. It was found that the supply currentto the sensor array could vary by ∼1% if the totalresistance of the sensor array was a summation ofthe resistance of each individual electrode and sensorchannel resistance. To account for this possible vari-ation, the error in voltage, given by the red shadedboxes in Figure 8, was found by scaling each voltagemeasurement based on a supply current increase anddecrease of 1%, as given in Equation 2. For the 6.2mm thick (Thin) sensor array, the magnitude of volt-age fluctuation was found to be approximately twicethat of the 7.8 mm (Thick) array for the same pres-sure stimulus.
verror = (1± 0.01) ∗ v (2)
Error in Theoretical Hydrostatic Pressure. The pres-sure used to generated pressure-voltage pairs in Fig-ures 6 and 7 was the hydrostatic component of pres-sure based on the position output from the Zaberlinear stage. Two likely sources of error in the theo-retical hydrostatic pressure were the presence of sur-face waves in the tank generated by the motion of thesensor holder beneath the surface, and measurementerror in the initial position of the sensor.
The possible error in hydrostatic pressure due tofree surface fluctuations in the tank was characterizedby considering the voltage measurements from theCBPDMS foam array after the motion of the stagehad completed it’s motion. Because the stage mo-tion was complete and the array was at rest, fluctua-tions in the voltage measurements were likely due toresidual free surface motion in the tank. After apply-ing the calibration described in Section 5.5.3 to theraw voltage measurements, the pressure fluctuationswere found to be <∼10 Pa for the 30 mm peak-to-peak case, where maximum free surface disturbances
10

0 100 200 300 400 500
Pressure [Pa]
0.28
0.285
0.29
0.295
0.3
Sen
sor
Ou
tpu
t [v
]
Calibration Data: Channel 2
Data: 10mm-1
Data: 10mm-2
Data: 20mm-1
Data: 20mm-2
Data: 30mm-1
Data: 30mm-2
(a) Foam array channel 2 pressure vs. voltage pairs from plung-ing experiments without DC offset voltage adjustment.
0 100 200 300 400 500
Pressure [Pa]
0.28
0.285
0.29
0.295
0.3
Sen
sor
Ou
tpu
t [v
]
Calibration Data: Channel 2
Data: 10mm-1
Data: 10mm-2
Data: 20mm-1
Data: 20mm-2
Data: 30mm-1
Data: 30mm-2
(b) When the DC offset was adjusted for data sets ‘10mm-2’(light blue diamonds) and ‘30mm-2’ (green circles), the spreadin data points between the six plunging experiments was re-duced.
Figure 7: Pressure-voltage pairs from independent plungingexperiments at 10 mm, 20 mm, and 30 mm peak-to-peak am-plitudes (App). Two experiments were conducted at each am-plitude, and are designated as App-1 and App-2.
0.274 0.278 0.282 0.286 0.29 0.294 0.298
Sensor Output [v]
100
200
300
400
Pre
ssure
[P
a]
Experimental Error
Data
Error
Figure 8: Plunging data for 7.8 mm thick array channel 2.The light red shaded boxes designate the experimental errorin pressure and voltage. Data is plotted as voltage vs. pres-sure to reflect the orientation of the data for calibration of theCBPDMS foam array.
were expected. Because the maximum submergencedepth in the plunging experiments was 40 mm, thedecay of the pressure fluctuations due to free surfacedeformation was found to be small, and a constant±10 Pa error was applied to the pressure values inFigure 8. Additional error in the theoretical hydro-static pressure may have been present due to errorsin the initial measurement of sensor array position,and measurement error was assumed to be of similarmagnitude or less than the ±10 Pa error assumed forfree surface deformations.
5.5. Calibration of 7.8 mm (Thick) CBPDMS FoamArray
5.5.1. Polynomial Fits for Full Data Set
Using the curve fitting function fit in Matlab, ro-bust polynomial fits of order 2-4 were found for the7.8 mm thick CBPDMS foam plunging data, as seenin Figure 9(a) for sensor channel 2. It was ob-served that while the 2nd (red) and 3rd (black) de-gree fits were very similar in shape, the 4th degreefit displayed non-physical characteristics at the high-pressure extreme of the calibration data range due
11

n R2 RMSE [Pa] NRMSE [%]2 0.8823 33.73 9.143 0.8853 33.32 9.024 0.8882 32.92 8.92
Table 1: Goodness of fit measures for the 7.8mm CBPDMSfoam sensor array Channel 2 with outliers included.
to the influence of outliers at particularly low volt-age values. The RMS error between the expectedpressure values and polynomial fit, RMS error nor-malized by the pressure range (Equation 3), and R2
values can be found in Table 1. Based on the resultsfor second, third, and fourth degree polynomials, itwas decided that the third degree polynomial pro-vided the best representation of the voltage-pressurerelationship without the end effects observed for thefourth degree fit.
NRMSE =RMSE
Pmax − Pmin× 100 (3)
5.5.2. Identification and Removal of Outliers
When considering the CBPDMS foam array plung-ing data, outliers were considered samples that fellgreater than 1.5 standard deviations away from thethird degree polynomial fit found using the completedata set in Section 5.5.1. In Figure 9(b), the pointsthat satisfied the outlier criteria are designated withlarge red asterisks, and were removed from the train-ing data set when generating the refined curve fitsshown in black. The third degree polynomial coeffi-cients and the goodness of fit metrics for the refinedcurves can be found in Table 2. The outliers presentin the experimental data were attributed to the firstoscillation of each plunging experiment which consis-tently produced a lower sensor output voltage thansubsequent oscillations. The source of this transientbehavior in the output voltage is unknown, an con-sidered as a direction for future study.
5.5.3. Piecewise Calibration with First-Order Cor-rection
The third order polynomial curve shown for chan-nel 2 in Figure 9(b) was observed to exhibit non-
Channel R2 RMSE [Pa] NRMSE [%]2 0.8881 32.80 8.893 0.8551 37.54 10.174 0.8752 34.49 9.34
Table 2: Refined third degree polynomial goodness of fit mea-sures for the 7.8mm CBPMDS foam sensor array
physical behavior at the low pressure and high volt-age end of the training data set. While the slope ofthe polynomial curve changes from negative to pos-itive, the pressure-voltage relationship in the phys-ical sensor is always inverse with a sensitivity thatdecreases at high levels of strain (pressure). To bet-ter represent the physical performance of the sensorarray, a first-order correction of the form shown inEquation 4 was added to the calibration curve in thelow pressure region to create a piecewise calibration.
P = C3 ∗ v3 + C2 ∗ v2 + C1 ∗ v + C0, v ≤ vin (4)
P = D1 ∗ v +D0, v > vin
To determine the curve fit for the first-order cor-rection, the inflection point (vin, Pin) in the refinedthird degree polynomial fit was found. A linear fitwas then performed on the subset of the data forv > vin with a condition put on the linear fit that itneeded to pass through the point (vin, Pin) from thethird degree polynomial. The linear fit was found us-ing the slmengine function in Matlab which allowsfor curve fitting with prescriptions on shape, piece-wise segments, etc. The calibration curve with firstand third degree polynomial regions for channel 2 ofthe 7.8 mm thick CBPDMS foam array can be seenin Figure 9(c), and the calibration curve parametersare given in Table 3.
5.6. Application of Calibration Curve to Time SeriesData
The piecewise polynomial calibration curves foundfor each of the three operational sensor array chan-nels were tested by applying the calibration to thevoltage output measurements from plunging experi-ments at 10 mm, 20 mm, and 30 mm peak-to-peak
12

Ch. C3 ∗ 107 C2 ∗ 107 C1 ∗ 107 C0 ∗ 106
2 -14.3 12.8 -3.81 3.793 1.15 -1.24 0.43 -0.464 -28.5 32.0 -12.0 15.0Ch. vin [v] Pin [Pa] D1 D0
2 0.291 89.25 -2362.43 775.743 0.432 86.46 -553.09 325.234 0.376 84.99 - 3437.60 1377.53
Table 3: Coefficients and break points for the piecewise polyno-mial calibration of the thick array. For channel 4, an inflectionpoint did not occur within the training data range, so a lin-ear correction was added for v > 0.376 to ensure extrapolatedvalues followed expected behavior.
Ch. Exp. RMSE [Pa] NRMSE [%]2 10 mm 19.78 12.842 20 mm 35.20 12.732 30 mm 47.41 13.343 10 mm 22.04 12.523 20 mm 47.77 15.093 30 mm 55.08 16.434 10 mm 32.58 15.274 20 mm 38.14 12.664 30 mm 71.82 24.92
Table 4: RMS error and normalized RMS error for the piece-wise polynomial calibration applied to time series plunging re-sults for the 7.8 mm thick array.
0.28 0.285 0.29 0.295
Sensor Output [v]
0
200
400
600
800
Pre
ssu
re [
Pa]
Sensor Calibration: Ch 2
2nd Poly fit
3rd Poly Fit
4th Poly Fit
(a) Second, third, and fourth order polynomial curve fitswere found for CBPDMS foam sensor array channel 2.
0.28 0.285 0.29 0.295
Sensor Output [v]
0
200
400
600
800
Pre
ssu
re [
Pa]
Refined Calibration: Ch 2
3rd Poly No Outliers
Outliers > 1.5*STD
(b) Outliers were designated as samples falling furtherthan 1.5 standard deviations away from the third degreepolynomial fit.
0.28 0.285 0.29 0.295
Sensor Output [v]
0
200
400
600
800
Pre
ssu
re [
Pa]
Piecewise Calibration: Ch 2
3rd Poly No Outliers
Linear Correction
Outliers > 1.5*STD
(c) Piecewise polynomial calibration for 7.8 mm thickCBPDMS foam array Channel 2.
Figure 9: The CBPDMS foam sensor arrays were calibrated byrefining a third degree polynomial fit through the eliminationof outlier points and the addition of a linear correction for thelow pressure regime.
13

6 8 10 12 14
0
200
400
Calibration Applied to 30mm Case: Ch. 2
Calibrated Experiment RMS Error Theory
6 8 10 12 14
0
200
400
Pre
ssu
re [
Pa]
Calibration Applied to 20mm Case: Ch. 2
Calibrated Experiment RMS Error Theory
6 8 10 12 14
Time [s]
0
100
200
Calibration Applied to 10mm Case: Ch. 2
Calibrated Experiment RMS Error Theory
Figure 10: The piecewise polynomial calibration was appliedto experimental time series data from plunging experiments(solid colored lines) and compared to the theoretical hydro-static pressure based on the stage position (black dashed lines)for sensor array channel 2.
amplitude, as seen in Figure 10. The RMS error(RMSE) and Normalized RMS error (NRMSE) werethen calculated between the theoretical hydrostaticpressure determined by the vertical location of theZaber stage, and the calibrated sensor results, asgiven in Table 4. The first oscillation of the stagewas removed from each data set as discussed in Sec-tion 5.5.2. Using the piecewise polynomial calibrationcurves, time-varying hydrostatic pressure was repro-duced from sensor voltage measurements with ∼15%NMRSE for the 7.8 mm thick sensor array, and ∼13%NMRSE for the 6.2 mm thick array when comparedto the theoretical hydrostatic pressure based on sen-sor depth.
6. Conclusions
Conformal pressure sensor arrays for use in a ma-rine environment were fabricated using a silicone-based material set. The pressure sensitive compo-nents of the array utilized a closed-cell piezoresis-tive CBPDMS foam, while the sensor array elec-
trodes were composed of a silver-carbon black-PDMScomposite that displayed high conductivity with lowpiezoresistivity. The array utilized a pure PDMS baselayer to provide support during the fabrication pro-cess, and to allow for surface mounting using siliconeadhesives. The array utilized a four-point probe mea-surement technique to mitigate the effects of contactresistance, and electrical connections were providedby a ribbon cable embedded in the Ag-CBPDMS elec-trodes. Overall sensor array dimensions were 80mmx 20mm with thicknesses of 7.8 and 6.2 mm, and foursensor channels were contained in the array.
Sensor characterization experiments using time-varying pressure from vertical plunging revealed fun-damental characteristics of the CBPDMS foam ar-ray performance. Primary among these was thenon-linear and inverse relationship between hydro-dynamic pressure and sensor voltage output that isconsistent with the compressible model of CBPDMSpiezoresistivity presented in Section 3.1. The re-sponse of the sensor arrays across multiple plungingexperiments with increasing amplitude was found tobe repeatable, and using the results from the plung-ing experiments, a piecewise polynomial calibrationwas developed for each channel of the 7.8 mm and6.2 mm thick arrays.
The success of the CBDPMS foam arrays as a hy-drodynamic sensor for use on unmanned marine vehi-cles can be evaluated by comparing the performanceof the arrays during plunging to results from previ-ous studies using distributed arrays of commerciallyavailable sensors. Based on previous experiments invortex tracking on an AUV shaped body [6] and asingle-element hydrofoil [8], sensor spacing of lessthan 5 cm was recommended in order to properlyresolve vortex location. The spacing of individualsensor channels in the CBPDMS foam arrays is 1.7cm, satisfying the sensor spacing guidelines for theunmanned vehicle applications presented. From pre-vious experiments, example hydrodynamic pressurestimuli were found to have dynamic pressure ampli-tudes between 10 and 200 Pa. During the plungingexperiments, the dynamic range demonstrated by theCBPDMS foam pressure sensor array was approxi-mately 50-500 Pa, with a resolution of ∼10 Pa. Inthese experiments, the low end of the dynamic range
14
was limited by the experimental setups and the min-imum depth necessary to fully submerge the sensorarray.
For use in real-world ocean engineering applica-tions, CBPDMS foam sensor arrays must be robustenough for prolonged exposure to fluids and able towithstand repeated handling and potential impacts.The CBPDMS foam sensor arrays discussed in thisstudy were surface mounted on both flat and curvedsurfaces using double sided tape and silicone adhe-sive. To specifically test the robustness of the 7.8 mmthick CBPDMS foam array, the array was left sub-merged in the small towing tank at MIT for over 24hours, and no impact was observed on performance.
To bring distributed pressure sensing with highspatial resolution to full-scale ocean engineering sys-tems, pressure sensors must be low cost. The cost ofcurrent commercially available sensors was illustratedby the unmanned kayak vehicle which was equippedwith an array of 20 Honeywell SPT series sensors ata total cost of ∼$5000, or ∼$250 per sensor [9]. TheCBPDMS foam sensor arrays were fabricated usingapproximately ∼$40 worth of materials for a 4x1 ar-ray, or ∼$10 per sensor. With modifications to thesensor electronics and data acquisition technique, thearray could be converted to a 7x1 array, reducing thecost per sensor to ∼$6. The largest contributor to thematerial cost was the silver used in the fabrication ofthe sensor array electrodes. With a modification tothe materials used in the electrodes, the sensor costcould be reduced further, representing a greater ben-efit over commercially available sensors for large-areadistributed applications.
7. Acknowledgments
The authors would like to acknowledge the supportof a grant from NOAA’s MIT SeaGrant program, TheSingapore-MIT Alliance for Research and Technology(SMART), and the William I. Koch chair for mak-ing this work possible. Special thanks to MatthewD’Asaro and Jessica Herring for their help in the de-velopment of doped-silicone sensor materials, and Vi-gnesh Subramaniam for his experimental assistanceat the CENSAM laboratory and testing tank in Sin-gapore.
References
[1] J. E. Dusek, Development of bio-inspired dis-tributed pressure sensor arrays for hydrody-namic sensing applications, Ph.D. thesis, Mas-sachusetts Institute of Technology (Oct 2015).
[2] H. Bleckmann, A. Klein, G. Meyer, Nature as amodel for technical sensors, Frontiers in Sensing(2012) 1–16.
[3] S. Coombs, H. Bleckmann, R. R. Fay, A. N. Pop-per, The lateral line system, Springer Hando-book of Auditory Research (2014) 1–360.
[4] S. P. Windsor, M. J. McHenry, The influenceof viscous hydrodynamics on the fish lateral-line system, Integrative and Comparative Biol-ogy 49 (6) (2009) 691–701. doi:10.1093/icb/
icp084.
[5] M. Rapo, H. Jiang, M. Grosenbaugh, Using com-putational fluid dynamics to calculate the stim-ulus to the lateral line of a fish in still water, JExp Biol.URL http://www.whoi.edu/cms/files/Rapo_
et_al_2009_51084.pdf
[6] V. I. Fernandez, Performance analysis forlateral-line-inspired sensor arrays, Ph.D. the-sis, Massachusetts Institute of Technology (Oct2011).
[7] V. Fernandez, J. Dusek, J. Schulmeister,A. Maertens, S. Hou, K. Srivatsa, J. Lang,M. Triantafyllou, Pressure sensor arrays to opti-mize the high speed performance of ocean vehi-cles, 11th International Conference on Fast SeaTransportation (2011) 1–8.
[8] J. Dusek, Leading edge vortex detection usingbio-inspired on-body pressure sensing, Master’sthesis, Massachusetts Institute of Technology(Jan 2011).
[9] J. Dusek, A. G. P. Kottapalli, M. E. Woo,M. Asadnia, J. Miao, J. H. Lang, M. S.Triantafyllou, Development and testing of bio-inspired microelectromechanical pressure sensor
15

arrays for increased situational awareness formarine vehicles, Smart Materials and Structures22 (2013) 014002–014015.URL http://iopscience.iop.org/
0964-1726/22/1/014002
[10] J. Dusek, M. E. Woo, J. H. Lang, M. S.Triantafyllou, Carbon black-pdms compositeconformal pressure sensor arrays for near-bodyflow detection, IEEE Oceans 2014- Taipeidoi:10.1109/OCEANS-TAIPEI.2014.6964479.URL http://ieeexplore.ieee.org/xpls/
abs_all.jsp?arnumber=6964479
[11] W. Luheng, D. Tianhuai, W. Peng, Influenceof carbon black concentration on piezoresistiv-ity for carbon-black-filled silicone rubber com-posite, Carbon 47 (14) (2009) 3151–3157. doi:
10.1016/j.carbon.2009.06.050.URL http://dx.doi.org/10.1016/j.carbon.
2009.06.050
[12] J. C. Lotters, W. Olthuis, P. H. Veltink,P. Bergveld, The mechanical properties of therubber elastic polymer polydimethylsiloxane forsensor applications, Journal of Micromechanicsand Microengineering 7 (1997) 145–147.URL http://iopscience.iop.org/
0960-1317/7/3/017
[13] F. M. Yaul, V. Bulovic, J. H. Lang, A flexibleunderwater pressure sensor array using a con-ductive elastomer strain gauge, Journal or Mi-croelectromechanical Systems 21 (4) (2012) 897–907.
[14] M. Lacasse, V. Duchaine, C. Gosselin, Charac-terization of the electrical resistance of carbon-black-filled silicone: Application to a flexible andstretchable robot skin, 2010 IEEE InternationalConference on Robotics and Automation (2010)4842–4848.
[15] N. Ryvkina, I. Tchmutin, J. Vilcakova,M. Peliskova, P. Saha, The deformation behav-ior of conductivity in composites where chargecarrier transport is by tunneling: theoreticalmodeling and experimental results, Synthetic
Materials 148 (2) (2005) 141–146.URL http://www.sciencedirect.com/
science/article/pii/S0379677904004308
[16] M. Hussain, Y. Choa, K. Niihara, Fabricationprocess and electrical behavior of novel pressure-sensitive composites, Composites: PartA 32(2001) 1689–1696.
[17] D. T. Beruto, M. Capurro, G. Marro, Piezoresis-tance behavior of silicone–graphite composites inthe proximity of the electric percolation thresh-old, Sensors and Actuators A 117 (2005) 301–308. doi:10.1016/j.sna.2004.06.027.
[18] T. Ding, L. Wang, P. Wang, Changes in electri-cal resistance of carbon-black-filled silicone rub-ber composite during compression, Journal ofPolymer Science: Part B: Polymer Physics 45(2007) 2700–2706.
[19] V. I. Fernandez, A. Maertens, F. M. Yaul,J. Dahl, J. H. Lang, M. S. Triantafyllou,Lateral-line-inspired sensor arrays for nav-igation and object identification, MarineTechnology Society Journal 45 (4) (2011)130–146.URL http://www.ingentaconnect.
com/content/mts/mtsj/2011/00000045/
00000004/art00015
[20] M. G. King, A. J. Baragwanath, M. C. Rosa-mond, D. Wood, A. J. Gallant, Porous pdmsforce sensitive resistors, Procedia Chemistry1 (1) (2009) 568–571. doi:10.1016/j.proche.
2009.07.142.URL http://dx.doi.org/10.1016/j.proche.
2009.07.142
[21] K. J. Cha, D. S. Kim, A portable pressurepump for microfluidic lab-on-a-chip systemsusing a porous polydimethylsiloxane (pdms)sponge, Biomed Microdevices 13 (5) (2011) 877–883. doi:10.1007/s10544-011-9557-z.
16