piie briefing 17-1: us-china cooperation in a changing ... · 17-1 us-china cooperation in a...
TRANSCRIPT
PIIE Briefi ng
17-1 US-China Cooperation in a Changing Global EconomyAdam S. Posen and Jiming Ha, editors
JUNE 2017
CONTENTS
I Overview 1 Creating a Basis for China-US Economic Cooperation under the New US 3
Administration Adam S. Posen and Jiming Ha
II Impact of Policy Changes2 Prospects for Changes in US Fiscal Policy and Their Effects on the US Economy 9 Karen Dynan
3 What Is the Potential Growth Rate of the US Economy, and How Might Policy 20Affect It?
Jason Furman
4 Impact of Trump Administration’s Proposed Policies on the United States and 34China
Jiming Ha
III Exchange Rates and Finance5 Exchange Rates and the International Monetary System: Not a Scapegoat 42 Guan Tao, Lu Zhengwei, and Guo Jiayi
6 A Stability-Oriented Exchange Rate Policy for China 55 Joseph E. Gagnon
7 The United States at a Crossroads: G-20 Cooperation and the International 62Financial Architecture
Nathan Sheets
8 Thoughts on Overindebtedness from a European Perspective 72 Nicolas Véron and Jeromin Zettelmeyer
IV Trade and Investment9 US-China Trade Disputes and the World Trade Organization 82 Chad P. Bown
10 The Importance of Doing Our BIT: The Economic Potential of a US-China 92Bilateral Investment Treaty
Lee Branstetter, Britta Glennon, and J. Bradford Jensen
11 China-US Bilateral Investment 105 Guo Kai, Wang Bijun, and Yang Yuanchen
12 Foreign Direct Investment in China 115 Zixuan Huang
13 State Resurgence in China 120 Nicholas Lardy
14 The Risks and Costs of Trade Wars 127 Marc Noland
15 Asia-Pacific Regionalism after the Trans-Pacific Partnership 134 Jeffrey J. Schott and Zhiyao Lu
16 Trade Cooperation and Conflicts between the United States and China: Risks 145and Realities
Fan Zhai

3
CHAPTER 1
Creating a Basis for China-US Economic Cooperation under the New US AdministrationJiming Ha and Adam S. Posen
Since the Second World War, the United States has played a crucial role in creating and fostering the rules-based global economic and financial architecture. China, on the other hand, has maintained a lower profile in international governance despite its growing economic power. These traditional roles, however, have suddenly reversed of late. As presidential candidate and now as US president, Donald Trump has described the United States as a victim of the international trade and financial system, while Chinese President Xi Jinping has defended the win-win nature of globalization and the importance of rules-based international institutions like the World Trade Organization (WTO) and International Monetary Fund (IMF).
The Trump administration’s emphasis on “America First” would significantly affect China-US trade and investment, which in turn would affect both countries’ economic performance and global roles (but might not change balance of payments so important to President Trump). The bilateral exchange rate as a rebalancing mechanism would thus remain a focus of China-US negotiations if not conflict. The US government’s proposed tax overhaul, plans for infrastructure investment and financial deregulation, and the corresponding adjustment of the US Federal Reserve’s monetary policy will also have spillover effects on China and the world economy, as well as G-20 relations. More recent perceptions of US withdrawal from G-7 leadership, following Trump’s May 2017 Summit performance, will amplify these effects systemically.
In this PIIE Briefing, scholars from the China Finance 40 Forum (CF40) and the Peterson Institutefor International Economics (PIIE) identify ongoing areas of common economic interest f or Chinese and American governments, practical ways that the two governments might work together on economic issues, consistent with the previously US-held economic regime, and what is at risk if the Trump administration attacks the rules-based international economic system—which the United States created and which has been essential to both US and Chinese prosperity for decades.
I. Overview
Jiming Ha is a fellow at CF40. Adam S. Posen is the president of the Peterson Institute for International Economics.
4
STRUCTURAL FACTORS ARE BEHIND BILATERAL TRADE IMBALANCE
China has a comparative advantage in labor-intensive industries while the United States has a comparative advantage in capital-intensive industries (including high-yield agriculture), though China’s comparative advantage is shifting as both Chinese wages and capital stock rise. The deepening China-US trade rela-tionship has benefited both countries, even though bilateral trade has remained unbalanced. As the largest source of US imports, China contributed 46 percent of the total US goods trade deficit in 2016 (up 33 percent in terms of value added). Far more important to most economists, however, has been Chinese currency intervention and other policies, especially in the mid-2000s, which led to massive overall trade surpluses for China relative to its own and to world GDPs.
Since China has not intervened to weaken the yuan in foreign exchange markets in recent years, issues such as market economy status, intellectual property, state-owned enterprises, and barriers to foreign take-overs of companies should now become the focus of US-China discussions, and will be the source of fric-tions if unresolved. These issues are important, but we should note that they do not determine macroeco-nomic imbalances (except perhaps via long-run productivity trends). The new US government is deeply concerned about the US trade deficit with China, even though bilateral trade balances have no bearing on industrial competitiveness or on households winning or losing from trade. China’s economy is in the process of rebalancing. Improved domestic investment and consumption will help reduce the overall trade imbalance and probably the bilateral one as well. By the same token, increased fiscal deficits in the United States, given Trump’s budget proposals, and their potential effect on the value of the dollar would widen the United States’ overall and bilateral trade deficits (chapter 5).
There is legitimate concern that the Trump administration may use more than trade enforcement mechanisms, or even bypass WTO rules, to give specific American-headquartered companies an advantage over Chinese enterprises. Such trade barriers against Chinese firms would only shift the US trade deficit with China to other countries and result in the loss of efficiency and welfare. If a China-US trade war breaks out, not only would both economies lose but also it would affect the global economy, with severe negative financial and demand repercussions on the two countries (chapter 14).
This is why previous US administrations have built and supported the multilateral rules-based trading system for the last 70 years (chapter 7). This is also why exchange rate manipulation has been dealt with diplomacy, with appeals to the manipulators’ enlightened self-interest and to the creation of norms in the IMF and the G-20, rather than through retribution. And this is why successive Chinese leaders since Deng Xiaoping have been increasingly willing to play by the rules of the open international economy—accept-ing judgments against them by the WTO, for example—and have supported international structures the United States built, even though they were slow to bring Chinese voice and votes in line with Chinese economic size. It thus is ironic and somewhat frightening that the commitment by President Xi Jinping made at Davos in January 2017 to China’s enlightened self-interest coincides with the Trump administra-tion’s decision to chase economic irrelevancies like bilateral trade deficits.
COMPLEMENTARITY OF US AND CHINESE ECONOMIES DRIVES BILATERAL INVESTMENT
The complementarity between Chinese and US economies and the industrial transformation and upgrading in China are the primary drivers of bilateral investment flows between the two countries (chapters 11 and 16). US foreign direct investment (FDI) in China is growing rapidly; it is distributed fairly equally among industries, and the return on investment is relatively high (chapter 12). China’s overseas direct investment (ODI) in the United States is growing faster, with an average annual increase of 58 percent from 2004 to 2015, according to official statistics. This was much higher than the overall increase of China’s ODI
5
during the same period, reflecting the strong incentive for Chinese companies to invest in the United States. Chinese enterprises invest more in advanced manufacturing, consumer goods, and high-tech industries in the United States, which indicates that Chinese enterprises seek technology and other strategic assets and also want to enter the US consumer market.
Trump administration officials and the president himself have expressed interest in increasing the amount of new foreign investment in the United States, especially where it visibly creates production jobs. All else equal, greater capital inflows into the United States would widen its trade deficits, but in reality FDI flows are only a small fraction of total capital flows or of the trade deficit, so this tension should not deter the United States from welcoming more foreign investment.
The bigger issue is one of fairness: US and other foreign firms investing in China face sharper limits than do Chinese firms investing in the United States. Many sectors in China are largely closed to foreign invest-ment, and many more still do not allow majority stakes and true takeovers by foreign firms. This is espe-cially vexing in services, where large Chinese gains are to be had from American private investment. China’s growing services sector is inefficient and devoid of international competition. The United States’ greatest comparative advantage is in the exports of business, financial, and software services; opening up the Chinese services sectors to US competition would benefit Chinese buyers of these services. Beijing’s unwillingness to permit US investment in China has aggravated the concerns of the US public and many politicians that national security may be compromised by Chinese acquisition of US intellectual property. Of course, some of the limits on US FDI into China stem from Chinese officials’ own concerns about national security.
That is why a bilateral agreement would stand the two countries in good stead (chapter 10). Chinese enterprises hope that the Committee on Foreign Investment in the United States (CFIUS) reduces various discriminatory barriers introduced in the name of national security. US concerns focus on China’s busi-ness environment, leveling the playing field and access for foreign companies, intellectual property protec-tion, and other issues. Some concerns arose because recent changes, e.g., more foreign-funded enterprises in China are moving from manufacturing industries, which have a high degree of openness, to services industries, which have a low degree of openness. On both sides, local governments are stepping up efforts to standardize procedures and processes for attracting overseas investment and improving the relevant legal framework—though in the United States “made in America” and government procurement rules push back in the other direction. China and the United States should strive to reach a high-standard, realisti c China-US investment treaty and give full play to the potential of bilateral investment.
RECENT EXCHANGE RATE DEVELOPMENTS HAVE SERVED BOTH COUNTRIES WELL
Under the market expectation of the US fiscal stimulus by 2018 and Federal Reserve rate hikes even before, the US dollar should continue to strengthen on average. This trend, combined with unpredictable occa-sional shifts in capital outflow controls and the natural desire of Chinese savers to diversify assets, increases the depreciation pressure on the renminbi, as seen from mid-2015 to late 2016. The fundamentals-driven depreciation of the renminbi versus the US dollar must be distinguished from mercantilist exchange rate manipulation policies, as China engaged in heavily during the mid-2000s. China’s “8.11” exchange rate reform launched in 2015 was not intended to seek trade advantage through depreciation. The exchange rate reform was to meet the operational requirements of “free convertibility” for inclusion in the IMF’s special drawing rights currency basket and to reduce market surprises. So China and the United States have a common interest for the medium term in avoiding sharp US dollar appreciation against the Chinese yuan. The ongoing decline of China’s foreign exchange reserves shows that China is spending reserves to prevent or at least slow the depreciation of the renminbi. It is doing so in its own interest, and its actions should not be portrayed at home or abroad as a “victory for the United States.”

6
More collaborative exchange rate developments took place in the multilateral context of an agree-ment by G-7 members, starting in December 2012, not to engage in unilateral intervention against other members’ currencies. Diplomatic efforts had been ongoing under US government leadership to extend this agreement within the G-20, and specifically to include China. The US Treasury’s definition for identifying governments manipulating their currencies against the dollar now includes objective criteria such as the direction of intervention and whether the country is moving towards or away from overall trade surpluses (but not bilateral balances). These objective criteria are more consistent with international norms. They helped legitimize the Trump Treasury’s decision to not declare China a currency manipulator in March 2017, despite the president’s threats to do so during the election campaign. Therefore, the institutional arrangements that have emerged in recent years have kept the currency peace and are another example of win-win rules-based multilateralism.
By pursuing exchange rate policy with the objective of stabilizing the current account balance, rather than maximizing the surplus, China gains three advantages: It allows monetary policy to focus on stabilizing employment and inflation; it avoids unnecessary conflict with the United States; and it promotes regional integration by again having the renminbi be a basis for stability, as it was on a much smaller scale during the Asian financial crisis of 1997–98 (chapter 6). The US government should support this shift by China and recognize it in its exchange rate reporting and diplomacy.
CHINA’S ECONOMY CAN MANAGE IMPACT OF TRUMP’S POLICIES, IF STOPS SHORT OF TRADE WAR
The new US government may make significant changes in tax policy, infrastructure investment, financial and energy regulation, and other domestic policies, and the Fed is likely to correspondingly adjust the monetary policy (chapters 2 and 3). These policy changes will affect China’s economy through multiple channels (chapter 4).
First, the reduction in personal and corporate income taxes will stimulate the US economy in theshort term but increase government debt and fiscal deficit in the long term. This will exacerbatecapital outflows from China to the United States. To the degree that this attracts corporate invest-ment in the US economy from China—and if the Trump administration allows it in—the US taxchanges could put pressure on China to reform its own tax system.
Second, if the US Congress approves a significant increase in infrastructure investment, it willimprove China’s exports and global prices for steel, concrete, and other materials that are in oversup-ply. In addition, Chinese enterprises have a high level of expertise in infrastructure construction andcan strengthen cooperation with the United States both in capital and technology to benefit from USinfrastructure plans.
Third, at the financial regulatory level, the US government may simplify and relax some provisions ofthe Dodd-Frank Act, but it is unlikely that the Act will be completely abolished. The direct impact onChina will, therefore, be limited. If the United States were to go further, though, and withdraw fromthe Financial Stability Board (FSB) and international regulatory cooperation, as some in Congressand the new administration have threatened, the potential for a new bout of financial instability orraces to the bottom in financial oversight becomes much higher, at everyone’s cost.
Fourth, the economic policies of the new US government will boost economic growth and raise infla-tion temporarily, which means that the Fed should be expected to increase the pace of interest ratehikes, all else equal. The rise in US interest rates and the strengthening dollar index will put pressure onthe renminbi exchange rate. However, due to China’s strong capital controls, the impact of the externalenvironment on exchange rate movements and domestic financial markets is relatively limited.

7
Of course, any domestic policy adjustments that China undertakes will have only a second-order impact on the US economy—with the possible exception of financial deregulation, which would convince Chinese savers to either save less or seek returns without moving money abroad. There is no simple parity to be had on this dimension of the relationship.
CHINA SHOULD SPEED UP STRUCTURAL REFORM AND MARKET OPENING TO AVOID CONFLICT WITH THE UNITED STATES
Economists in both countries should not legitimize the Trump administration’s obsession with reduc-ing bilateral trade balances, which serves no public purpose and could provoke harmful and unnecessary conflict. If the Trump administration persists in confronting China and other US trading partners about bilateral imbalances, China needs a strategy to defuse tensions in the short term and deal with the problem in the long term. Independent economists and more enlightened US politicians should publicly support China in these efforts.
In the short term, China should respond to US demands by changing some of its economic practices or legal structures in other areas, rather than targeting deficits per se. For example, China can affirm WTO rules and the principles of international commerce that the US government has long championed. To achieve that goal, China can purchase more US products through official channels or state-owned enterpris-es and open the finance, tourism and other service sectors of US exports, as Washington has long requested. These moves would create visible “winners” among US companies and also underscore the contrast with the Trump administration’s destructive “Buy American” campaign, which would constrain US government procurement.
China could also ease tensions by importing more energy, gas, and oil, from the United States. Such a step might displace Russia as an energy exporter but would also induce the United States to continue to deregulate its own energy exports, which are still reliant on official rather than private deals. In addition, China could renew its longstanding requests to the United States to ease restrictions on the export of high-tech products to China. On all these counts, the May 2017 “early harvest” from high-level China-US trade discussions has been consistent with this approach, as befits a short-term negotiation.
Reforming state-owned enterprises would also serve China’s self-interest while paying dividends with the United States, improving prospects for China achieving market economy status in trade relations. Washington has been increasingly and justifiably concerned about the expanding role of “state capitalism” in China (chapter 13). Although the state-owned sector’s market share of the economy has fallen sharply in the past four decades, state-owned enterprises still dominate finance, telecommunications and some other service sectors. The Chinese government also still subsidizes enterprises and provides concessional loans in the dark. Accelerating reform of state-owned enterprises can ease accusations of unfair trade by all of China’s trade partners. Another step China could take to improve the trade atmosphere would be to reduce steel and aluminum overcapacity at a faster rate, handing the Trump administration a “win” (even though India, Korea, and Turkey rather than the US are the true competitors of Chinese steel producers). China would also gain from reducing its overcapacity because such a move would improve Chinese productivity in the steel and aluminum sectors.
Of course, none of these measures will significantly reduce the bilateral trade deficit of the United States with China, certainly not in the short term (and they will have minimal effect in the long term or on overall Chinese or US trade balances). The US current account deficit is set to double or more before the end of Trump’s first term in 2020, based on exchange rate and growth differentials between the United States and the rest of the world that have already emerged. The likely fiscal ease–monetary tightening macro policy mix coming in the United States will only increase the US overall current account deficit, as a similar combina-

8
tion did in the mid-1980s, and China’s bilateral trade surplus with the United States is likely to go up with it. So if the Trump administration goes into the elections in 2018 and 2020 still committed to reducing the country’s bilateral trade deficits with China and other economies, it is likely to be frustrated and embar-rassed. There is a real risk that what happened in the mid-1980s will recur but will be even worse given the Trump team’s hostility toward trade and globalization, meaning the US government could undertake even more aggressive unilateral protectionist policies against China and other major trading partners.
That is why China also needs to plan a medium-term response to the Trump administration’s likely bilateral pressures. And that plan should be primarily multilateral, in two senses. First, it should be multilat-eral in terms of using the available means in the international system to legally challenge and, where appro-priate, retaliate against US protectionism and bullying. China should resist as long as possible the under-standable urge to retaliate unilaterally, which while damaging to the United States would also harm China. Instead China should go after bad US policies as hard as it can via WTO means (chapter 9). Second, the planned response should be multilateral in the other sense of lining up with other economies to jointly rebuff the Trump administration for violating the norms if not rules of the system that previous US governments created. This strategy means making common cause with the European Union and, yes, Japan and Korea in standing up to the United States and defending the system. It also means actively pursuing regional and other free trade agreements, starting with the Regional Comprehensive Economic Partnership (RCEP) but ideally on a principle of open regionalism (chapter 15). This response should show the United States the error of its ways by getting visible but legal trade diversion and making evident the missed opportunities for US business.
One can still hope that such a medium-term plan of uniting opposition globally to Trump administra-tion unilateralism and protectionism will prove unnecessary. The US and Chinese economies have enough in common to cooperate on trade, investment, exchange rates, and other issues. China has the means to give visible “victories” to President Trump by changing policies that ultimately serve China’s own economic reform goals. But given the prospect of further widening of the US current account deficit and therefore of the bilateral trade deficit with China and the foolhardy but serious commitment of the Trump administra-tion to reducing those deficits, both countries may end up on a collision course over trade. If that happens, Chinese leadership will have to cooperate with the EU and the rest of the G20 to save the rules-based open international economy from President Trump’s aggression.

9
CHAPTER 2
Prospects for Changes in US Fiscal Policy and Their Effects on the US EconomyKaren Dynan
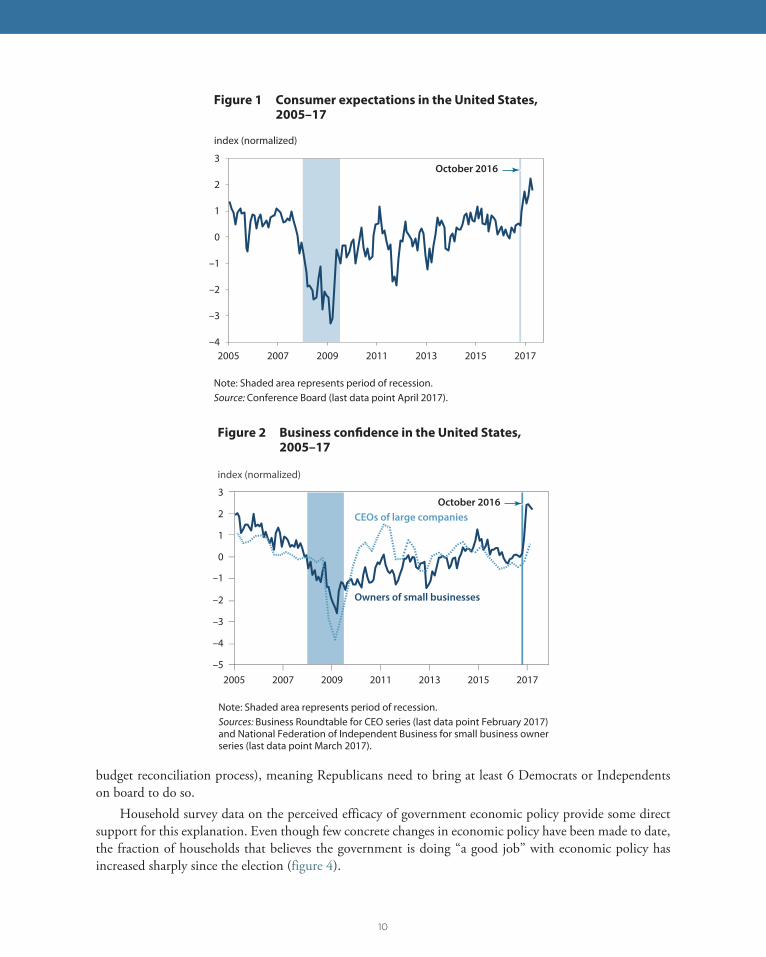
The 2016 US election was followed by a surge in household and business confidence, suggesting that Ameri-cans expect the policies of the new president to enhance both the short- and longer-run performance of the US economy. These expectations are likely to be disappointed, both because changes in policy are likely to be limited and because the changes that do occur are likely to be less potent than people imagine.
INCREASED OPTIMISM ABOUT THE US ECONOMY
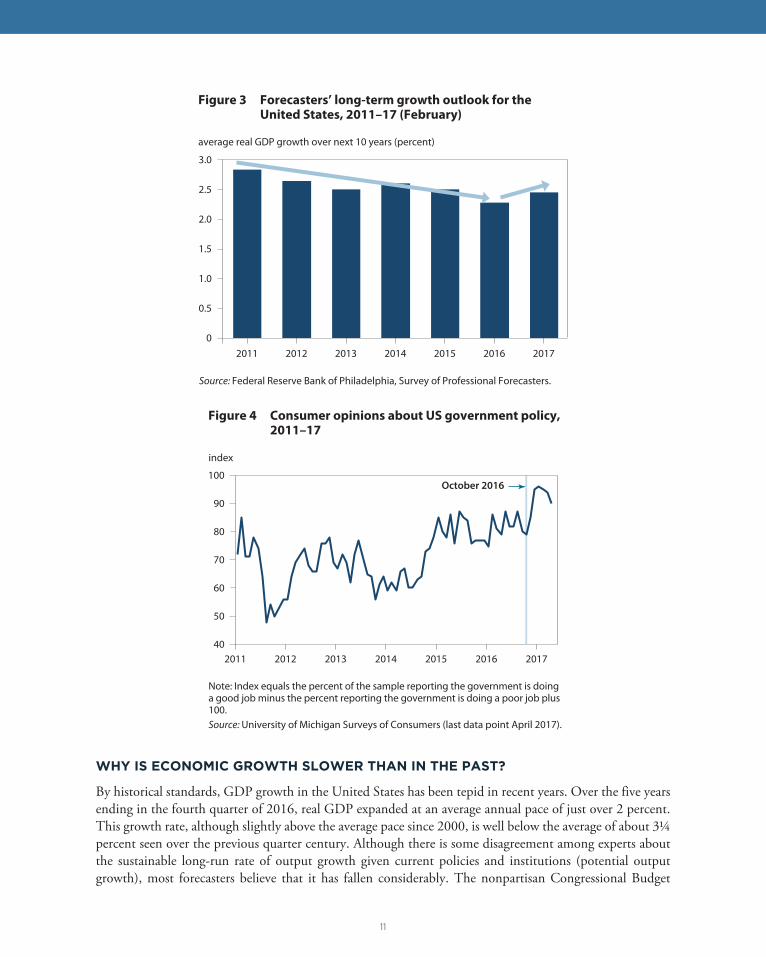
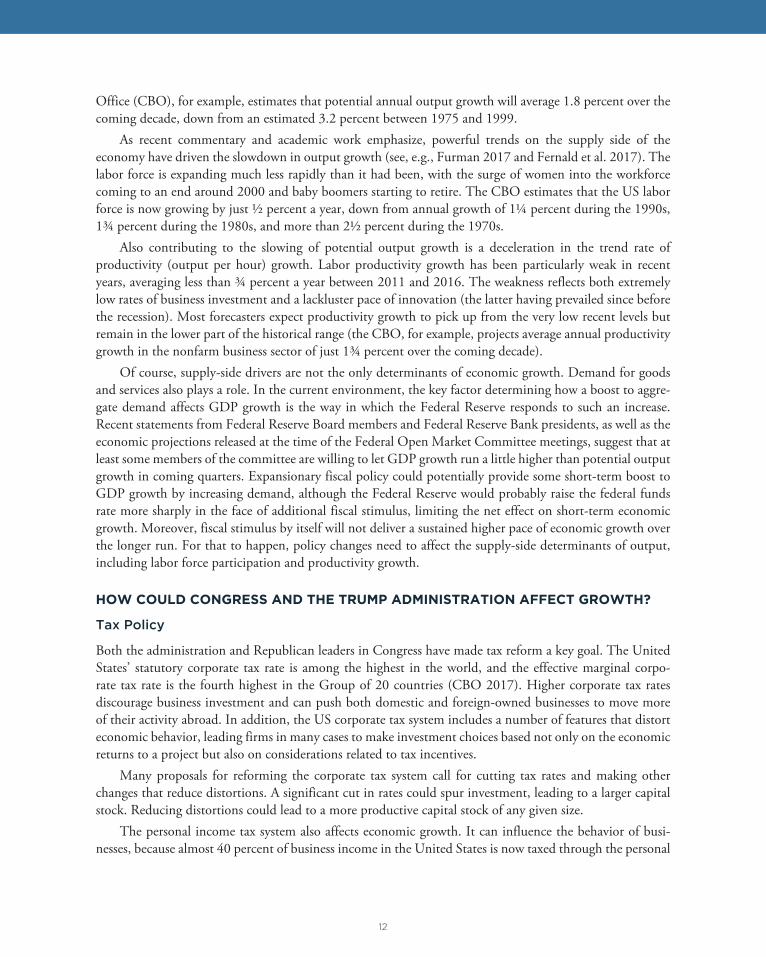
Consumer assessments of economic conditions improved in late 2016 (figure 1). Surveys of both small and larger business owners also showed a sharp increase (figure 2). Even surveys of forecasters indicated greater optimism: The median response in the Survey of Professional Forecasters regarding real GDP growth over the next 10 years ticked up in early 2017 after being marked down repeatedly over the previous half dozen years (figure 3).
The significant rise in US equity prices since the election may also be indicative of greater optimism about the economy. As of the end of April 2017, the S&P 500 index was more than 10 percent higher than it was on election day. With interest rates also higher since the election, the increase appears to reflect higher expectations of capital income rather than a change in discount rates. (Of course, such expectations may be the result not only of a more bullish take on future GDP but also of a belief that the after-tax profit share of GDP will rise.)
The popular explanation for this greater optimism is rooted in political changes in Washington. Both as a candidate and since taking office, Donald Trump has repeatedly emphasized the importance of boosting US economic growth and talked specifically about using fiscal policy to help do so. The fact that the Repub-licans control both houses of Congress enhances the prospects for making the fiscal changes the president wants, although passing legislation requires 60 votes in the Senate (except for changes made through the
Karen Dynan is nonresident senior fellow at the Peterson Institute for International Economics.
II. Impact of Policy Changes
10
budget reconciliation process), meaning Republicans need to bring at least 6 Democrats or Independents on board to do so.
Household survey data on the perceived efficacy of government economic policy provide some direct support for this explanation. Even though few concrete changes in economic policy have been made to date, the fraction of households that believes the government is doing “a good job” with economic policy has increased sharply since the election (figure 4).
–4
–3
–2
–1
0
1
2
3
2005 2007 2009 2011 2013 2015 2017
October 2016
index (normalized)
Figure 1 Consumer expectations in the United States,2005–17
Note: Shaded area represents period of recession.Source: Conference Board (last data point April 2017).
–5
–4
–3
–2
0
1
2
3
2005 2007 2009 2011 2013 2015 2017
Owners of small businesses
CEOs of large companies
index (normalized)
Figure 2 Business confidence in the United States, 2005–17
Note: Shaded area represents period of recession.Sources: Business Roundtable for CEO series (last data point February 2017) and National Federation of Independent Business for small business owner series (last data point March 2017).
–1
October 2016
11
WHY IS ECONOMIC GROWTH SLOWER THAN IN THE PAST?
By historical standards, GDP growth in the United States has been tepid in recent years. Over the five years ending in the fourth quarter of 2016, real GDP expanded at an average annual pace of just over 2 percent. This growth rate, although slightly above the average pace since 2000, is well below the average of about 3¼ percent seen over the previous quarter century. Although there is some disagreement among experts about the sustainable long-run rate of output growth given current policies and institutions (potential output growth), most forecasters believe that it has fallen considerably. The nonpartisan Congressional Budget
0
0.5
1.0
1.5
2.0
2.5
3.0
2011 2012 2013 2014 2015 2016 2017
average real GDP growth over next 10 years (percent)
Figure 3 Forecasters’ long-term growth outlook for the United States, 2011–17 (February)
Source: Federal Reserve Bank of Philadelphia, Survey of Professional Forecasters.
40
50
60
70
80
90
100
2011 2012 2013 2014 2015 2016 2017
index
Figure 4 Consumer opinions about US government policy, 2011–17
Note: Index equals the percent of the sample reporting the government is doing a good job minus the percent reporting the government is doing a poor job plus 100.Source: University of Michigan Surveys of Consumers (last data point April 2017).
October 2016
12
Office (CBO), for example, estimates that potential annual output growth will average 1.8 percent over the coming decade, down from an estimated 3.2 percent between 1975 and 1999.
As recent commentary and academic work emphasize, powerful trends on the supply side of the economy have driven the slowdown in output growth (see, e.g., Furman 2017 and Fernald et al. 2017). The labor force is expanding much less rapidly than it had been, with the surge of women into the workforce coming to an end around 2000 and baby boomers starting to retire. The CBO estimates that the US labor force is now growing by just ½ percent a year, down from annual growth of 1¼ percent during the 1990s, 1¾ percent during the 1980s, and more than 2½ percent during the 1970s.
Also contributing to the slowing of potential output growth is a deceleration in the trend rate of productivity (output per hour) growth. Labor productivity growth has been particularly weak in recent years, averaging less than ¾ percent a year between 2011 and 2016. The weakness reflects both extremely low rates of business investment and a lackluster pace of innovation (the latter having prevailed since before the recession). Most forecasters expect productivity growth to pick up from the very low recent levels but remain in the lower part of the historical range (the CBO, for example, projects average annual productivity growth in the nonfarm business sector of just 1¾ percent over the coming decade).
Of course, supply-side drivers are not the only determinants of economic growth. Demand for goods and services also plays a role. In the current environment, the key factor determining how a boost to aggre-gate demand affects GDP growth is the way in which the Federal Reserve responds to such an increase. Recent statements from Federal Reserve Board members and Federal Reserve Bank presidents, as well as the economic projections released at the time of the Federal Open Market Committee meetings, suggest that at least some members of the committee are willing to let GDP growth run a little higher than potential output growth in coming quarters. Expansionary fiscal policy could potentially provide some short-term boost to GDP growth by increasing demand, although the Federal Reserve would probably raise the federal funds rate more sharply in the face of additional fiscal stimulus, limiting the net effect on short-term economic growth. Moreover, fiscal stimulus by itself will not deliver a sustained higher pace of economic growth over the longer run. For that to happen, policy changes need to affect the supply-side determinants of output, including labor force participation and productivity growth.
HOW COULD CONGRESS AND THE TRUMP ADMINISTRATION AFFECT GROWTH?
Tax Policy
Both the administration and Republican leaders in Congress have made tax reform a key goal. The United States’ statutory corporate tax rate is among the highest in the world, and the effective marginal corpo-rate tax rate is the fourth highest in the Group of 20 countries (CBO 2017). Higher corporate tax rates discourage business investment and can push both domestic and foreign-owned businesses to move more of their activity abroad. In addition, the US corporate tax system includes a number of features that distort economic behavior, leading firms in many cases to make investment choices based not only on the economic returns to a project but also on considerations related to tax incentives.
Many proposals for reforming the corporate tax system call for cutting tax rates and making other changes that reduce distortions. A significant cut in rates could spur investment, leading to a larger capital stock. Reducing distortions could lead to a more productive capital stock of any given size.
The personal income tax system also affects economic growth. It can influence the behavior of busi-nesses, because almost 40 percent of business income in the United States is now taxed through the personal

13
rather than the corporate income tax system.1 Higher personal income tax rates can also discourage personal work effort and saving, which might also affect growth. That said, most economists think that such behav-ioral responses to tax rates are smaller than the effects of tax rates on purely financial decisions, such as when to realize capital gains.
Optimism about the prospects for tax reform has several sources. The last few years have seen strong general interest in pursuing tax reform from both sides of the aisle in Congress. House Republican leaders have expressed a particularly deep commitment to the issue, putting forward a blueprint in the summer of 2016 (see House Republican Leadership 2016). Moreover, in principle tax reform could be enacted with support from just 50 senators, through the budget reconciliation process, if the reform proposal was crafted to be revenue neutral 10 years out and beyond (which some proposals would be).2
Yet there are reasons why it has been 30 years since the last major tax reform, despite long-running interest from both political parties. Tax reform proposals that are revenue neutral will generally have as many winners as losers, and the losers are likely to fight them hard. Tax reform that encourages economic growth by reducing the tax burden on corporations or capital income more generally will tend to lower the tax burden on higher-income people, which can be hard to sell politically. Moreover, the effects on the economy of reform proposals that are neutral from both a revenue and distributional perspective are likely to be limited.
One illustration of this point is the scoring of the comprehensive tax reform proposal released in Febru-ary 2014 by Rep. Dave Camp (chair of the House Ways and Means Committee at the time).3 The nonpar-tisan Joint Tax Committee (2014) projected that the Camp would raise real US GDP by 0.1 to 1.6 percent after 10 years (figure 5); the midpoint of this range would imply an increase in average annual growth of less than 0.1 percentage points.
Of course, other tax proposals could also meet the goals of revenue and distributional neutrality, with slightly different estimated effects of the economy. Moreover, Republican Congressional leaders might decide to relax those constraints, although easing the distributional constraints would be unpopular with many voters and abandoning revenue neutrality would mean that the plan could not be passed through the budget reconciliation.
One issue in the current debate over tax reform is the border tax adjustment (BTA). The BTA has a number of important advantages (including potentially harmonizing the US tax system with that of countries that have a value-added tax), which is why several top economists have supported it (see, e.g., Auerbach and Holtz-Eakin 2016). One very important question is how the value of the dollar would adjust in response to it. Economic models suggest that everything else equal, the value of the dollar would rise enough to fully offset the effects of the BTA on exports and imports. Such an adjustment would be good for the economic effects of the proposal, but it would undercut one common “advantage” cited by noneconomists, which is that it would reduce the trade deficit. In addition, a full adjustment would greatly reduce the dollar value of US assets held overseas and could disrupt the international financial system. If the dollar does not fully adjust, US import-ers would face significant cost pressures, which would hurt their profits or be passed on to US consumers.4
1. According to the Tax Policy Center (2017), 36 percent of business receipts were subject to the individualincome tax in 2012 (most recent data).
2. The reconciliation process allows certain types of legislation to be expedited. Reconciliation bills cannot befi libustered in the Senate; as long as a bill does not increase the defi cit 10 years out or beyond (the Byrd rule),only a simple majority is needed to pass it.
3. “Camp Releases Tax Reform Plan to Strengthen the Economy and Make the Tax Code Simpler, Fairer andFlatter,” House Ways and Means Committee, February 26, 2014.
4. The Peterson Institute for International Economics has produced a large volume of research describing therisks and benefi ts associated with the BTA. See Freund (2017) for a summary of this research.

14
If comprehensive tax reform proves too difficult to pass, Congress is very likely to consider some fall-back changes in the tax code. One issue that has attracted much attention is the problem of US corporate funds “trapped” overseas, with some prominent voices arguing that this situation is holding back economic growth.
The view that a tax break for multinational firms that repatriate such funds would boost growth does not stand up to scrutiny. The argument hinges on the notion that firms would use the repatriated funds to hire workers or invest in new equipment and structures. The problem is that most of these firms already have plenty of cash that they could use for such purposes. The tax break might be good for profits and the shareholders of these firms, but the direct effect on hiring and investment is likely to be limited.5
Another fallback option if tax reform does not succeed would be for Congress to simply pass a tax cut. Doing so would allow Republican leaders to say that they had at least done something on the tax side. Although a permanent tax cut could not be passed by a simple majority in the Senate through the budget resolution reconciliation process, a tax cut that expires within 10 years could be passed, as it was in 2001. Of course, a tax cut that increases the deficit even over the short run might be hard to accept for some Repub-licans. Another way to achieve the outcome would be to structure the tax cut to include features, such as support for the middle class, that would attract some votes from Democrats.
A tax cut would boost aggregate demand. But the Federal Reserve’s response would limit its effects growth over the near term. Longer-run effects on growth would probably be limited as well. The evidence suggests that tax cuts have only small effects on work effort and personal saving (CBO 2014). In addition, there would be an offsetting drag on growth associated with the larger deficit resulting from the cuts.
All told, the odds of achieving major tax reform are low. The odds of achieving one of the fallback options, particularly a tax cut, are much higher. But even comprehensive tax reform is likely to have fairly limited effects on growth; the fallback options are likely to have even smaller effects on growth, particularly over the medium and longer run.
5. There is some historical evidence that tax breaks for repatriation do not increase investment (see, e.g., Galeand Harris 2011).
0
0.4
0.8
1.2
1.6
2.0
percent change
Estimates for different models and assumptions
Figure 5 Joint Tax Committee estimates of the effect of the Camp Plan on GDP in the United States after 10 years
Midpoint implies a boost to annualGDP growth of 0.1 percentage point
Source: Joint Committee on Taxation, US Congress.

15
Appropriations
In coming months, the US Congress will be taking up appropriations for fiscal year (FY) 2018, which is the process by which defense and nondefense discretionary spending is allocated. To pass appropriations bills, Republicans need Democrats, both because such bills require 60 votes in the Senate and because members of the conservative Freedom Caucus in the House of Representatives are unlikely to support bills with levels of spending that most other members of Congress would deem reasonable.
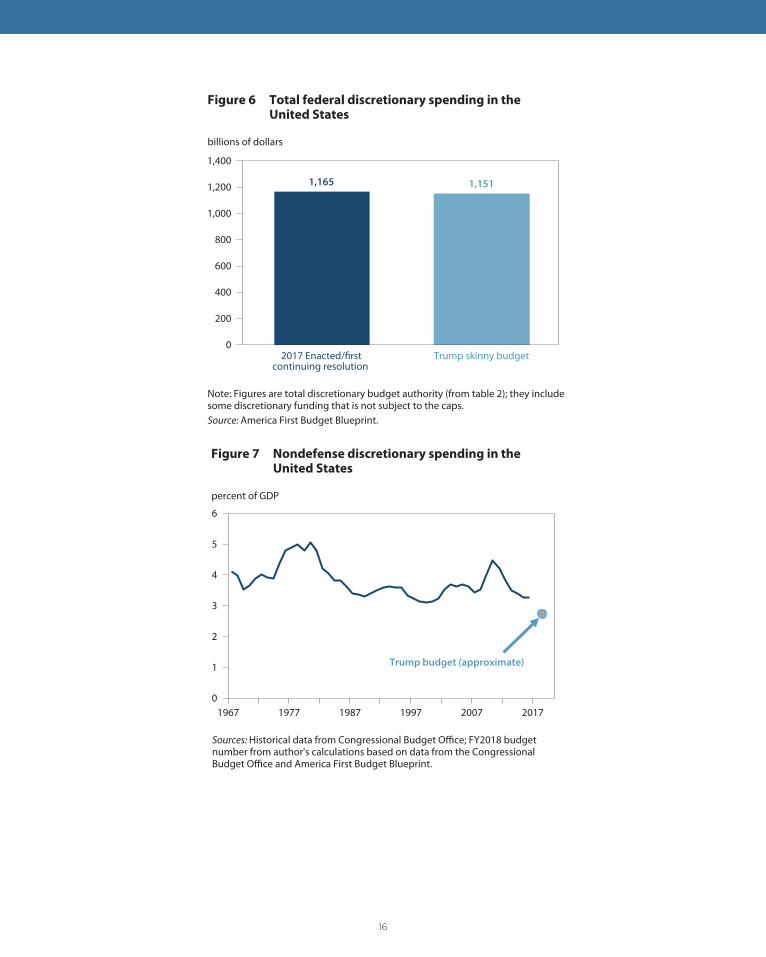
In mid-March President Trump released his “skinny budget” for FY2018 which outlined his plans for federal discretionary spending in FY2018. The budget called for discretionary spending of $1.151 trillion, a decline of $14 billion from the estimated enacted levels of discretionary spending in FY2017 (figure 6). Proposed FY 2018 discretionary spending is equal to the combined amount of defense and nondefense discretionary spending allowed by caps associated with the Bipartisan Budget Act (BBA) of 2015. However, the skinny budget proposed increasing defense spending by $54 billion over its BBA cap, with a comparable decrease in nondefense. The document provided only a partial glimpse of the president’s budget plans, as it did not discuss tax policy or mandatory spending programs, such as Social Security, Medicare, and Medic-aid, which represent more than 60 percent of total federal government outlays.6
The key consideration for thinking about how Trump’s skinny budget would affect the US economy over the near term is how proposed spending levels compare with actual federal spending in FY2018. The $14 billion shortfall relative to the enacted FY2017 levels implies a contraction of aggregate demand. The effect of such a decline would likely be fairly small (on the order of 0.1 percentage point). More troubling for economic growth over the longer term are the substantial cuts in federal nondefense discretionary spend-ing. This category includes the major investments that would be expected to raise economic growth over the longer run, such as spending on infrastructure, education and training, and research and development. Under the budget, federal nondefense discretionary spending would fall to about 2¾ percent of GDP, well below levels of the past 50 years (figure 7). The Trump budget thus hardly seems pro-growth. With interest rates at historically low levels, many have argued that the best thing to do would be to increase such invest-ments right now (Elmendorf and Sheiner 2016).
In practice, presidents’ budgets never get enacted in full. Rather, they signal the administration’s priori-ties and, in the past, sometimes laid the groundwork for Congressional budget decisions. However, the scope for the Trump budget (as laid out to date) to influence the spending levels Congress ultimately enacts seems limited. Sixty votes are needed to pass appropriations bills through the Senate; they cannot be passed with a simple majority via the budget reconciliations process. The cuts will therefore need to be softened so that Congressional leaders can win the support of some Senate Democrats.
Given these considerations, it is perhaps unsurprising that budget negotiations have resulted in autho-rized federal spending on discretionary programs that exceed the caps put in place by BCA 2011, since they were supposed to go into effect on January 1, 2013. Defense spending seems likely to rise in FY2018, given its popularity with members of Congress. Nondefense discretionary spending is not likely to fall much if at all from FY2017 levels, however: As much as some members of Congress (and some citizens) like to deride government programs, they are much more averse to cutting funding when the decisions come down to specifics, like cutting funding for, say, research by the National Institutes of Health. (Indeed, some Repub-lican members of the Senate have already expressed strenuous objections to some specific features of the Trump skinny budget.)
All told, some increases in appropriations are likely in 2018. They will not be sufficient to keep pace with the growth rate of potential output, however.
6. The Administration has said it will release a full budget proposal in late May.
16
1,165 1,151
0
200
400
600
800
1,000
1,200
1,400
billions of dollars
2017 Enacted/firstcontinuing resolution
Trump skinny budget
Figure 6 Total federal discretionary spending in the United States
Note: Figures are total discretionary budget authority (from table 2); they include some discretionary funding that is not subject to the caps.Source: America First Budget Blueprint.
0
1
2
3
4
5
6
1967 1977 1987 1997 2007 2017
percent of GDP
Trump budget (approximate)
Figure 7 Nondefense discretionary spending in the United States
Sources: Historical data from Congressional Budget Office; FY2018 budget number from author's calculations based on data from the Congressional Budget Office and America First Budget Blueprint.
17
Other Policies
Mandatory Government Spending. Congress will need to adopt a FY2018 budget resolution in order to make the reconciliation process available for tax reform. Doing so will mean speaking to their plans for other types of spending, particularly major benefit programs. The Republican budget plans for the last few years achieved a balanced budget 10 years out (something required in order to gain the support of more conservative members of Congress) by including significant cuts to benefits as well as further cuts in annual appropriations. Despite supporting those budget resolutions, Republican members of Congress did not move any legislation that incorporated those cuts. Whether they will do so now that the White House is also controlled by Republicans remains to be seen.
Infrastructure. President Trump has talked about creating a program that would provide $1 trillion in support for infrastructure investment. However, he has provided no specifics about how the program would work, what form the support would take, or when the program would begin. With Washington preoccupied with tax reform and a lack of agreement among Congressional Republicans about what should be done, an infrastructure initiative seems highly unlikely in the near term.
Some subsidies for private providers of infrastructure might be included as part of a tax package. The implications for long-term growth would be limited. In general, tax incentives for infrastructure would have much less effect on the capital stock than direct spending on infrastructure, because some of the subsidy would go to private projects that would otherwise have been done with other types of funding. More-over, such tax credits would not apply to some important types of expenditures, such as repair of existing structures.
Health Care. Congress’s first attempt to pass the American Health Care Act (AHCA), which would repeal and replace the Affordable Care Act (ACA), failed in early 2017, with the bill lacking sufficient support to be brought to a vote in the House. However, a modified version of the bill passed the House in early May. In order to be enacted, the bill will next need to pass the Senate, but many obstacles stand in the way of it doing so. No Democrats will vote for the bill, and the Republicans can lose only two votes of their own if the bill is to pass under the budget reconciliation process. Yet, several Republicans have already expressed concerns about features of the bill that would increase insurance costs for older and poorer Americans, decrease federal funding for Medicaid, and lead to a substantial reduction in health insurance coverage.
Even if the AHCA does not become law, there are ways for the administration to undermine the ACA—by not enforcing the penalty associated with the individual mandate or not maintaining the exchange websites, for example. The degree to which the administration will do so is unclear, as it might blamed for any weakening of the private insurance market.
Repealing or undermining the ACA would have implications for economic security at the individual level, but the implications for the macroeconomy are not large. The CBO estimates that full repeal of the act would increase the labor supply by an amount that raises GDP 5 to 10 years out by an average of just 0.7 percent (CBO 2015).
Regulatory Policy. During his campaign, Donald Trump vowed to roll back regulations on businesses. Shortly after taking office, he issued an executive order that required federal agencies to eliminate two regu-lations for every new regulation issued.
Some important obstacles will limit the administration’s ability to make major changes to the regula-tory code. First, although federal regulations can be changed without legislation, doing so generally involves a long and complicated process. Second, there will undoubtedly be lawsuits that major new regulatory changes are not consistent with the law, just as there are lawsuits that major regulatory changes made by
18
the Obama administration are not consistent with the law. Third, some types of regulations that are often criticized for hurting economic growth or economic dynamism—such as rules that impede infrastructure projects or restrictions on who can enter a particular occupation—are established at the state and local level.
Many types of regulations affect the composition of output and employment but do not have first-order effects on the total size of the economy because they largely shift the composition of spending (from spend-ing on one type of energy to spending on another, for example). Moreover, any near-term stimulative effects from lower costs for businesses are likely to be undone in the aggregate by monetary policy.
It seems likely that some types of regulatory relief could spur higher investment or faster productivity growth. However, the empirical evidence is very mixed on the magnitude of the effects, with many econo-mists skeptical about the entire body of literature because of problems with the data used. Moreover, such gains would involve sacrificing societal objectives.
Immigration. Donald Trump campaigned on limiting immigration, including by building a wall along the border with Mexico. Although the idea was popular among his supporters, it would not be good for growth. A key reason why the US economy is growing more slowly than it has historically is the drop in the growth rate of the labor force, a trend that reducing immigration would exacerbate. There is some evidence as well that immigration is good for productivity growth. One study, for example, finds that immigrants are twice as likely as native-born Americans to take out patents (Hunt and Gauthier-Loiselle 2010).
CONCLUSION
The US economy appears to be expanding at roughly 2 percent a year—about what most forecasters consid-er the currently sustainable longer-term growth rate of real GDP. The lower pace of growth relative to the growth rates seen in the latter part of the last century largely reflects demographic factors that have slowed labor force growth since then. Policy can play a role raising economic growth, but to raise growth on a sustained basis, it needs to boost supply-side drivers of economic performance, such as productivity growth and labor force participation.
Despite surveys showing that consumers and some businesses are optimistic that the new administra-tion’s policies will raise economic growth, the changes in policy that are realized are not likely to fundamen-tally enhance prospects for the US economy. Fiscal policy changes are likely to be limited and have little effect on longer-term growth. Policy changes in other areas—health care, regulation, immigration—are likely to be smaller than expected and have only small positive (and in some cases negative) effects on longer-term GDP growth.
REFERENCESAuerbach, Alan J., and Douglas Holtz-Eakin. 2016. The Role of Border Adjustments in International Taxation (November). American Action Forum.
CBO (Congressional Budget Office). 2014. How CBO Analyzes the Effects of Changes in Federal Fiscal Policies on the Economy (November). Washington.
CBO (Congressional Budget Office). 2015. Budgetary and Economic Effects of Repealing the Affordable Care Act (June). Washington.
CBO (Congressional Budget Office). 2017. International Comparisons of Corporate Income Tax Rates (March). Washington.
Elmendorf, Douglas, and Louise Sheiner. 2016. Federal Budget Policy with an Aging Population and Persistently Low Interest Rates. Working Paper 18. Washington: Brookings Hutchins Center.
19
Fernald, John, Robert Hall, James Stock, and Mark W. Watson. 2017. The Disappointing Recovery of Output after 2009. Brookings Papers on Economic Activity.
Freund, Caroline. 2017. PIIE Debates Border Adjustment Tax. PIIE RealTime Economic Issues Watch blog, Feb-ruary 9. Washington: Peterson Institute for International Economics.
Furman, Jason. 2017. Trump Promised 4 Percent Growth. Here’s Why We’d be Very Lucky to Hit 3. VoxEU, March 21.
Gale, William G., and Benjamin H. Harris. 2011. Don’t Fall for Corporate Repatriation (June 27). Tax Policy Center .
House Republican Leadership. 2016. A Better Way: Our Vision for a Confident America (June 24). Washington.
Hunt, Jennifer, and Marjolaine Gauthier-Loiselle. 2010. How Much Does Immigration Boost Innovation? Ameri-can Economic Journal: Macroeconomics 2, no. 2: 31–56.
Joint Tax Committee. 2014. Macroeconomic Analysis of the “Tax Reform Act of 2014” (February). Washington.
Tax Policy Center. 2017. The Tax Policy Center’s Briefing Book. Washington. Accessed on April 9, 2017.
White House. 2017. America First: A Budget Blueprint to Make America Great Again (March). Washington.
20
CHAPTER 3
What Is the Potential Growth Rate of the US Economy, and How Might Policy Affect It?Jason Furman
The answer to the question “What will future potential growth be?” is as important as it is unknowable. It is important because growth is a critical input to the budget forecast and has a major impact on the magnitude of long-run fiscal imbalances. And it is unknowable because it depends on aspects of the economy that have been, at least historically, some of the most difficult to explain in retrospect or to forecast in advance—including, most importantly, labor productivity growth.
But a critically important part of the answer to the question is known: the US demographic outlook over the next decade. And the aging of the US population during that period, although less dramatic than in many other advanced economies, will constitute a major headwind to economic growth in the coming years.
This chapter attempts to answer the question about the outlook for US economic growth by combining what is unknown (future productivity growth, the performance of the labor market) with what is known (the evolution of the age structure of the population). The question is answered in two ways. The first approach uses the historical experience of potential labor productivity growth, labor force participation, and weekly hours to simulate a range of outcomes for future potential growth. By construction, these forecasts are centered around the 1.8 percent forecast of the Congressional Budget Office (CBO), and thus provide a sense of the confidence interval around this forecast given historical variability in the underlying supply-side inputs to growth. The exercise yields the conclusion that the 90 percent confidence interval around this central estimate ranges from 0.7 percent (the 5th percentile of outcomes) to 3.0 percent (the 95th percentile of outcomes). There is only a 4 percent chance that the growth rate over the next decade exceeds 3 percent and a less than 0.1 percent chance that it exceeds 4 percent. These probabilities should be interpreted as both reflecting uncertainty about the underlying economy itself, including productivity and the labor market, and incorporating a range of possible future policy changes, consistent with such changes’ historical effects on the US economy.
Second, the paper examines a range of specific economic policies that the Trump administration might
Jason Furman is senior fellow at the Peterson Institute for International Economics. He served as a top economic adviser to President Barack Obama during the previous eight years, including as chair of the Council of Economic Advisers. He thanks Harris Eppsteiner and Wilson Powell III for outstanding research assistance.

21
pursue in terms of their impact on the average annual growth rate both in the short run and over the next decade. In the short run, while fiscal stimulus could plausibly create a big upside, or a major deviation from previous trade policies a big downside, both of these are politically and economically implausible. Over the next decade, the impact of the policies along the lines of proposals by President Trump on the annual US growth rate is, in very rough terms, approximately plus or minus half a percentage point—with numbers close to or just below zero the most plausible but highly dependent on what policies are actually pursued and legislated. The growth impact, however, does not capture the full impact on social welfare of changes that would affect the environment, the distribution of income, and other aspects of societal well-being.
RANGE OF POTENTIAL GROWTH RATES
This section assesses the growth of potential real gross domestic product (GDP) over the next decade (2016 to 2026). As such, it abstracts from any cyclical developments that could cause growth to be higher or lower than potential—a reasonable assumption given the length of the period in question and the proximity of the US economy to full employment today.
The starting point for this assessment is the following identity:
(1)
The same identity can be expressed in terms of growth rates:
(2)
This identity says that the growth of GDP can be understood as the sum of the growth of output per hour (or labor productivity) and labor inputs. Labor inputs in turn are the result of the growth in hours, the labor force participation rate, and the population.
Central Scenario
The central scenario in this forecast uses CBO’s 1.8 percent annual rate estimate for potential GDP growth from 2016 to 2026. CBO projects annual potential nonfarm business sector productivity growth of 1.7 percent annually, the equivalent of 1.4 percent annual growth in potential labor productivity for the economy as a whole.1 To put this forecast in context, potential nonfarm productivity growth of 1.7 percent is a relatively pessimistic figure compared to the economic performance of the United States since World War II (it is at the 27th percentile of ten-year changes in CBO’s estimates of potential productivity growth since 1949) but very optimistic compared to its recent performance (1.2 percent annual growth in poten-tial nonfarm business productivity in the last decade, according to CBO’s estimates). On balance, CBO’s forecast is roughly in accord with its estimate of average annual potential productivity growth since 1973.
1. Note that output per hour worked, or labor productivity, in equations (1) and (2) covers the entire economy.Historically, annual labor productivity growth in the economy as a whole has averaged 0.3 percentage pointbelow labor productivity growth in the nonfarm business sector, the more common measure reported on aquarterly basis by the Bureau of Labor Statistics (BLS), because the former includes sectors, like government,with relatively slower (or even zero) productivity growth. In the analysis that follows, I apply this historical“wedge” of 0.3 percentage points to estimates of future potential productivity growth to derive a measure ofeconomywide potential productivity growth.

22
The central scenario also uses, wherever possible, CBO’s assumptions for the other inputs to potential real GDP. CBO’s fore-casts for inputs into GDP imply that average weekly hours per worker will remain constant over the next decade, as shown in figure 1.
CBO also assumes that the age- and sex-adjusted labor force participation rate will increase slightly over the next decade. Nevertheless, because the overall age-sex mix of the population will change over the next decade, especially due to the aging of the baby boomers, the overall potential participation rate is expected to fall by about 0.2 percent-age point each year, as shown in figure 2. This scenario is optimistic relative to the past performance of the participation rate, since the age-adjusted participation rate for men has fallen nearly continuously since the 1950s and the age-adjusted participation rate for women has fallen since around 2000.2 This participation rate is applied to CBO’s forecast of future civilian noninstitutional popula-tion growth, which is similar to the Census Bureau’s projections for growth of the resi-dent population.
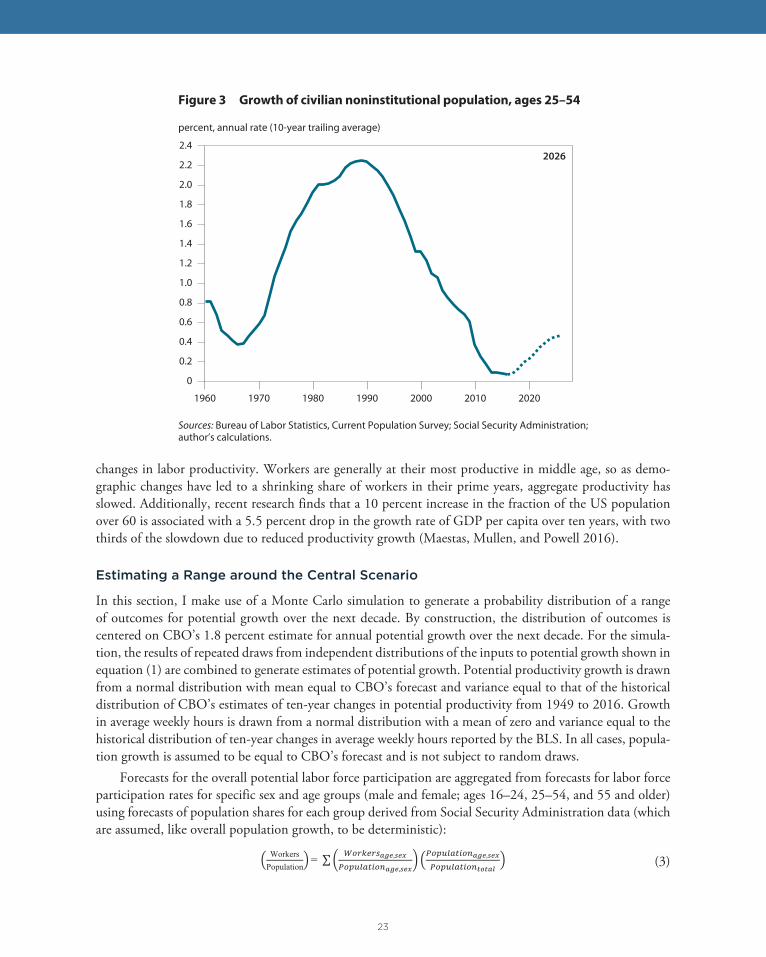
Overall, about two thirds of the difference between CBO’s 1.8 percent projected annual growth rate of potential GDP over the next ten years and the 3.5 percent annual growth rate from 1949 to 2007 can be attributed to differences in demography between the two periods, with the other third explained by the assumption that potential productivity growth will be lower than its postwar average. The starkness of the demographic change can be seen in figure 3, which shows the growth of the prime age (25–54) population. Annual prime
age population growth peaked at more than 2 percent in the 1980s but has since fallen to just above zero and is unlikely to rise above 0.5 percent over the next decade.
Moreover, the slowdown of productivity growth may be, at least in part, a result of this demographic shift. James Feyrer (2007) has found that changes in the age structure of the labor force are correlated with
2. CBO (2017) projects that the eff ects of generational, disability, and marriage trends, which tend to pushdown labor force participation rates, will be roughly off set by increasing educational attainment, the changingracial and ethnic composition of the population, and increasing longevity on an age- and sex-adjusted basis.
Figure 1 Average weekly hours per worker, nonfarm business sector
Source: Bureau of Labor Statistics, Productivity and Costs; author’s calculations.
2026:Q4
30
31
32
33
34
35
36
37
38
39
1950 1960 1970 1980 1990 2000 2010 2020
hours per week
54
56
58
60
62
64
66
68
70
1950 1960 1970 1980 1990 2000 2010 2020
percent
Figure 2 Potential labor force participation rate,1950–2026
Sources: Bureau of Labor Statistics, Current Population Survey; Congressional Budget Office; Social Security Administration; author’s calculations.
2026
23
changes in labor productivity. Workers are generally at their most productive in middle age, so as demo-graphic changes have led to a shrinking share of workers in their prime years, aggregate productivity has slowed. Additionally, recent research finds that a 10 percent increase in the fraction of the US population over 60 is associated with a 5.5 percent drop in the growth rate of GDP per capita over ten years, with two thirds of the slowdown due to reduced productivity growth (Maestas, Mullen, and Powell 2016).
Estimating a Range around the Central Scenario
In this section, I make use of a Monte Carlo simulation to generate a probability distribution of a range of outcomes for potential growth over the next decade. By construction, the distribution of outcomes is centered on CBO’s 1.8 percent estimate for annual potential growth over the next decade. For the simula-tion, the results of repeated draws from independent distributions of the inputs to potential growth shown in equation (1) are combined to generate estimates of potential growth. Potential productivity growth is drawn from a normal distribution with mean equal to CBO’s forecast and variance equal to that of the historical distribution of CBO’s estimates of ten-year changes in potential productivity from 1949 to 2016. Growth in average weekly hours is drawn from a normal distribution with a mean of zero and variance equal to the historical distribution of ten-year changes in average weekly hours reported by the BLS. In all cases, popula-tion growth is assumed to be equal to CBO’s forecast and is not subject to random draws.
Forecasts for the overall potential labor force participation are aggregated from forecasts for labor force participation rates for specific sex and age groups (male and female; ages 16–24, 25–54, and 55 and older) using forecasts of population shares for each group derived from Social Security Administration data (which are assumed, like overall population growth, to be deterministic):
(3)
2026
0
0.2
0.4
0.6
0.8
1.0
1.2
1.4
1.6
1.8
2.0
2.2
2.4
1960 1970 1980 1990 2000 2010 2020
percent, annual rate (10-year trailing average)
Figure 3 Growth of civilian noninstitutional population, ages 25–54
Sources: Bureau of Labor Statistics, Current Population Survey; Social Security Administration; author’s calculations.
24
0
.2
.4
.6
density
−1.5 −1.0 −.5 0 .5 1.0 1.5 2.0 2.5 3.0 3.5 4.0 4.5 5.0potential real GDP growth (percent, annual rate)
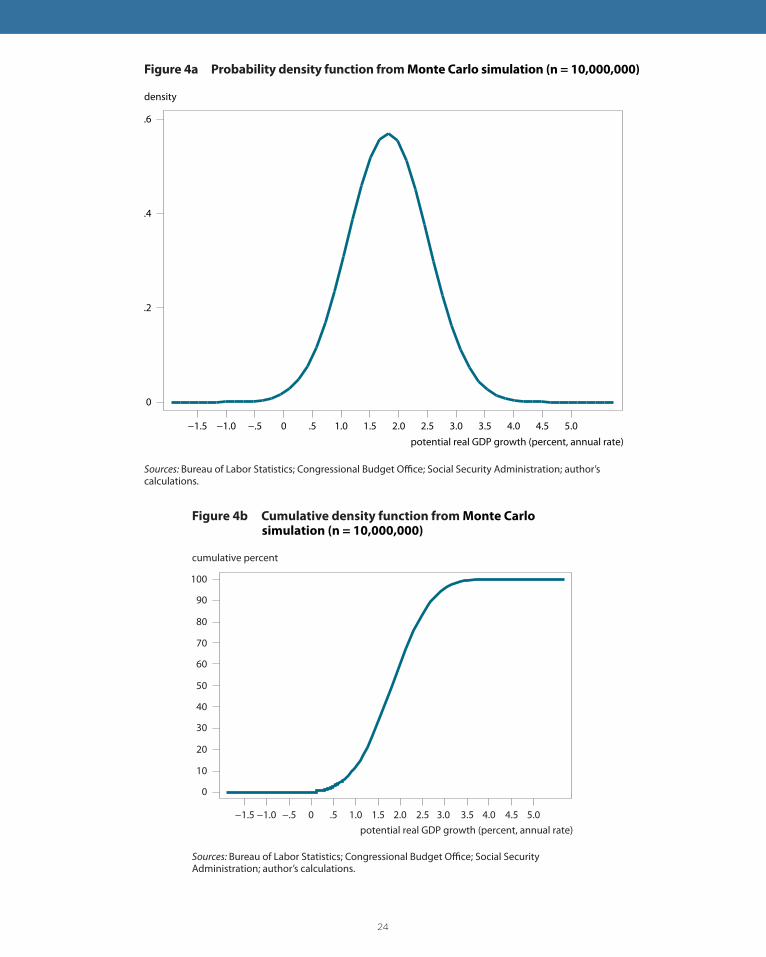
Figure 4a Probability density function from Monte Carlo simulation (n = 10,000,000)
Sources: Bureau of Labor Statistics; Congressional Budget Office; Social Security Administration; author’s calculations.
Figure 4b Cumulative density function from Monte Carlo simulation (n = 10,000,000)
Sources: Bureau of Labor Statistics; Congressional Budget Office; Social Security Administration; author’s calculations.
100
90
80
70
60
50
40
30
20
10
0
−1.5 −1.0 −.5 0 .5 1.0 1.5 2.0 2.5 3.0 3.5 4.0 4.5 5.0
cumulative percent
potential real GDP growth (percent, annual rate)
25
In the Monte Carlo simulation, repeated draws are taken for each age and sex group from independent distributions of ten-year changes in its participation rate. To approximate CBO’s projections, which attribute most of the decline in potential labor force participation to the effects of aging, all distributions are assumed to have a mean of zero (i.e., no change in within-group participation rates over the next decade). The vari-ance for each distribution is taken from the variance of the historical distribution of ten-year changes in the participation rate for the age-sex group in question. Once aggregated, each combination of draws yields a path for the labor force participation rate over the next ten years relative to a baseline with no change in age-and-sex-adjusted participation; this path is then rebased using CBO’s estimate of potential labor force participation to yield a path for potential labor force participation from 2016 to 2026.
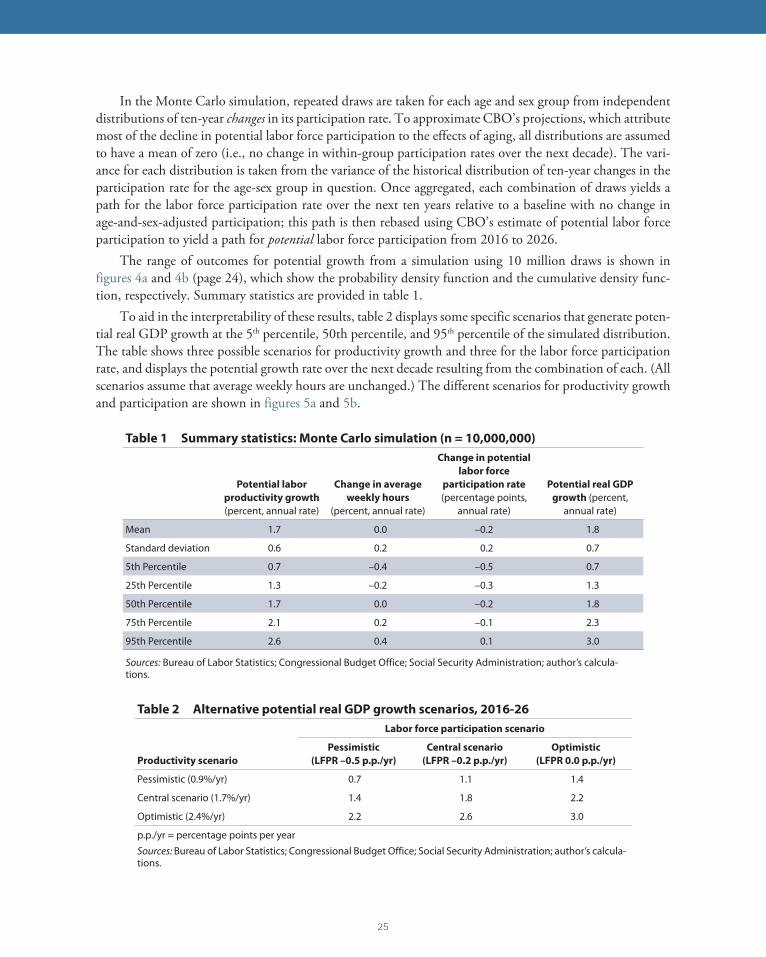
The range of outcomes for potential growth from a simulation using 10 million draws is shown in figures 4a and 4b (page 24), which show the probability density function and the cumulative density func-tion, respectively. Summary statistics are provided in table 1.
To aid in the interpretability of these results, table 2 displays some specific scenarios that generate poten-tial real GDP growth at the 5th percentile, 50th percentile, and 95th percentile of the simulated distribution. The table shows three possible scenarios for productivity growth and three for the labor force participation rate, and displays the potential growth rate over the next decade resulting from the combination of each. (All scenarios assume that average weekly hours are unchanged.) The different scenarios for productivity growth and participation are shown in figures 5a and 5b.
Table 1 Summary statistics: Monte Carlo simulation (n = 10,000,000)
Potential labor
productivity growth
(percent, annual rate)
Change in average
weekly hours
(percent, annual rate)
Change in potential
labor force
participation rate
(percentage points, annual rate)
Potential real GDP
growth (percent, annual rate)
Mean 1.7 0.0 –0.2 1.8
Standard deviation 0.6 0.2 0.2 0.7
5th Percentile 0.7 –0.4 –0.5 0.7
25th Percentile 1.3 –0.2 –0.3 1.3
50th Percentile 1.7 0.0 –0.2 1.8
75th Percentile 2.1 0.2 –0.1 2.3
95th Percentile 2.6 0.4 0.1 3.0
Sources: Bureau of Labor Statistics; Congressional Budget Office; Social Security Administration; author’s calcula-tions.
Table 2 Alternative potential real GDP growth scenarios, 2016-26
Productivity scenario
Labor force participation scenario
Pessimistic
(LFPR –0.5 p.p./yr)
Central scenario
(LFPR –0.2 p.p./yr)
Optimistic
(LFPR 0.0 p.p./yr)
Pessimistic (0.9%/yr) 0.7 1.1 1.4
Central scenario (1.7%/yr) 1.4 1.8 2.2
Optimistic (2.4%/yr) 2.2 2.6 3.0
p.p./yr = percentage points per yearSources: Bureau of Labor Statistics; Congressional Budget Office; Social Security Administration; author’s calcula-tions.

26
2016
Central Scenario
Pessimistic Case
Optimistic Case
0
0.5
1.0
1.5
2.0
2.5
3.0
3.5
1960 1970 1980 1990 2000 2010 2020 2030
percent change, annual rate (10-year trailing average)
Figure 5a Potential labor productivity, nonfarm business sector
Source: Congressional Budget Office; author’s calculations.
Figure 5b Potential labor force participation rate, 1950–2026
Sources: Bureau of Labor Statistics, Current Population Survey; Congressional Budget Office; Social Security Administration; author’s calculations.
2026
54
56
58
60
62
64
66
68
70
1950 1960 1970 1980 1990 2000 2010 2020 2030 2040
percent
OptimisticCase
CentralScenario
Pessimistic Case

27
HOW CAN POLICY AFFECT THE TRAJECTORY OF THE ECONOMY?
The previous section looked at a range of possible future growth rates based on historical experience. This range derives in part from underlying uncertainty about the economy itself; for example, what new products will be invented or how people will participate in the workforce. But the range also reflects a plausible range of different policies and their impact on the economy, given that it is derived from past economic data, which reflect the range of past policy choices.
This section looks more directly at how policy could affect the economy in the short run and over the next decade, looking at plausible proposals from President Trump. In brief, the conclusion is that, given that the economy is at or close to full employment, there is relatively little scope to increase growth through added aggregate demand in the short run. At the same time, very harmful policies—for example, unprecedented trade restrictions—could result in much slower short-run growth, but such policies appear less likely, at least in the immediate future. In the longer run the most pro-growth of the policies along the lines of those proposed to date would, in the upper bound, add about half a percentage point a year to the economy’s growth while the most antigrowth policies would do the reverse. The most plausible impact of policy is likely closer to zero or a small negative.
Limitations of Policy in the Short Run
On the campaign trail, President Trump proposed a number of expansionary policy changes, including increases in infrastructure spending and large-scale tax cuts, and since becoming President has continued to talk about the need to “prime the pump.” In theory, such fiscal stimulus could have a positive impact on the economy in the short run. But there are four reasons why any such impact is likely to be relatively small. First, President Trump and Congress are pushing for larger and faster deficit reduction than the Obama administration did. President Trump’s Budget proposes fiscal expansion of only 0.1 percent of GDP in fiscal year 2018 and consolidation thereafter (although these totals do not include tax reform, which is assumed to be revenue-neutral in the Budget).
Second, in the likely event that actual fiscal policy departed from this proposal, any deficit-increasing legislation would likely not have large immediate effects. This is because of delays in both passing such legis-lation (like tax cuts, which are unlikely to pass until September at the very earliest) and implementing legis-lated fiscal changes (for example, the large lags in defense spending increases and infrastructure spending).
Third, the Federal Reserve is likely to offset much of the fiscal stimulus—and the more lagged the stimulus the greater the Fed’s ability to do so. This is based on their premise that the economy is at or close to full employment, as evidenced by the fact that most labor market indicators are comparable to or stronger than their prerecession averages, with the notable exception of the labor force participation rate, which was on a downward trend long before the recession.
Finally, given the increased capacity constraints in the US economy it is likely that any expansion would manifest itself more in terms of inflation than output increases.
Policy could also be a possible downside in the short run. President Trump’s campaign proposals for a 45 percent tariff on China and a 35 percent tariff on Mexico would be historically unprecedented and would undo more than half a century of trade liberalization. Noland, Robinson, and Moran (2016) estimate that this trade agenda would cause a sharp contraction in the short run—which if it led to retaliation from other countries would manifest itself in a recession in the United States. Moreover, Noland, Robinson, and Moran’s estimate is likely to be a lower bound, since it does not include the cost of breaking existing supply chains. Such a trade policy appears unlikely to be pursued in the short run so this is less of an immediate downside risk.
28
Outer Bounds of the Effects of Policy in the Long Run
In the long run, a number of possible Trump administration policies could have a meaningful positive impact on economic growth, while others would meaningfully subtract from growth in the long run. While the policies explicitly proposed by President Trump all have relatively small impacts on growth, the follow-ing analysis considers policies in the direction proposed by President Trump but much more extreme—to the positive and to the negative—as a bounding exercise of the impact of policies on the long-run growth rate. These are summarized in table 3 and described below.
Policies with a Positive Impact on Growth
Business tax reform: up to 0.3 percentage point increase in the annual growth rate. A sense of anupper bound of the positive effects of tax reform could be derived from variants of the “Better Way” tax reform plan proposed by House Republicans. 3 This plan would shift business taxation to a cash flow-basis, eliminating taxation of the normal return to investment. In addition, the House Repub-lican plan would move the United States to a destination-basis system and would include a border adjustment designed to prevent off-shore gaming of the US tax system. The “Better Way” tax plan leaves many details unspecified, and the details that are specified do not support the claims of the plan’s authors that it is revenue-neutral. Still, previous analyses of US income tax reforms have found that policy changes along these lines could raise growth rates. Using three different dynamic models (a Solow growth model, a Ramsey infinite-horizon growth model, and an overlapping generations lifecycle model), the US Department of the Treasury (2006) concluded that if designed and implemented effectively, a proposed Growth and Income Tax (a cash-flow basis tax akin to the “Better Way” plan) would add about 0.3 percentage point to the annual growth rate. This is similar to other estimates by academics (e.g. Altig et al. 2001). But the current House Republican proposal would need multiple modifications to achieve these growth rates, including changes to make it truly revenue-neutral. Additionally, the likely deviations in any final legislation from the proposed plan, including transition rules or carveouts for key industries, or the undoing of key components of the proposal, are likely to reduce its benefits for growth or even lead to a negative overall economic impact. Additionally, President Trump’s principles for tax reform do not include some of the major features of the House “Better Way” tax plan—including shifting to a more consumption base for taxes and paying for rate reductions—that were projected to add to growth.
Regulatory reform: about 0.1 percentage point increase in the annual growth rate. The Trumpadministration has indicated its interest in regulatory reforms in a range of areas including (but not limited to) banking, telecommunications, labor markets, and energy markets. From a broad public policy perspective, changes to these regulations should be assessed in terms of a cost-benefit frame-work that reflects how well or poorly they improve social welfare on net. But considered narrowly from the perspective of output growth, effectively implemented regulatory reforms would have the potential to raise the growth rate. The magnitude of this increase is very hard to determine, however, because of the paucity of research on the macroeconomic impact of regulations. Douglas Holtz-Eakin (2015) has estimated that not enacting the 2010 Dodd-Frank Wall Street Reform and Consumer Protection Act would have resulted in growth rates that were 0.06 percentage point higher per year by reducing the cost of investment. With a full repeal of Dodd-Frank unlikely, any plausible partial repeal would likely have even smaller impacts on growth. Robert Barro has argued that raising US regulatory standards to best global practices in all dimensions would add 0.3
3. “A Better Way Forward on Tax Reform,” June 2016, available at https://waysandmeans.house.gov/taxre-form/ (accessed May 12, 2017).
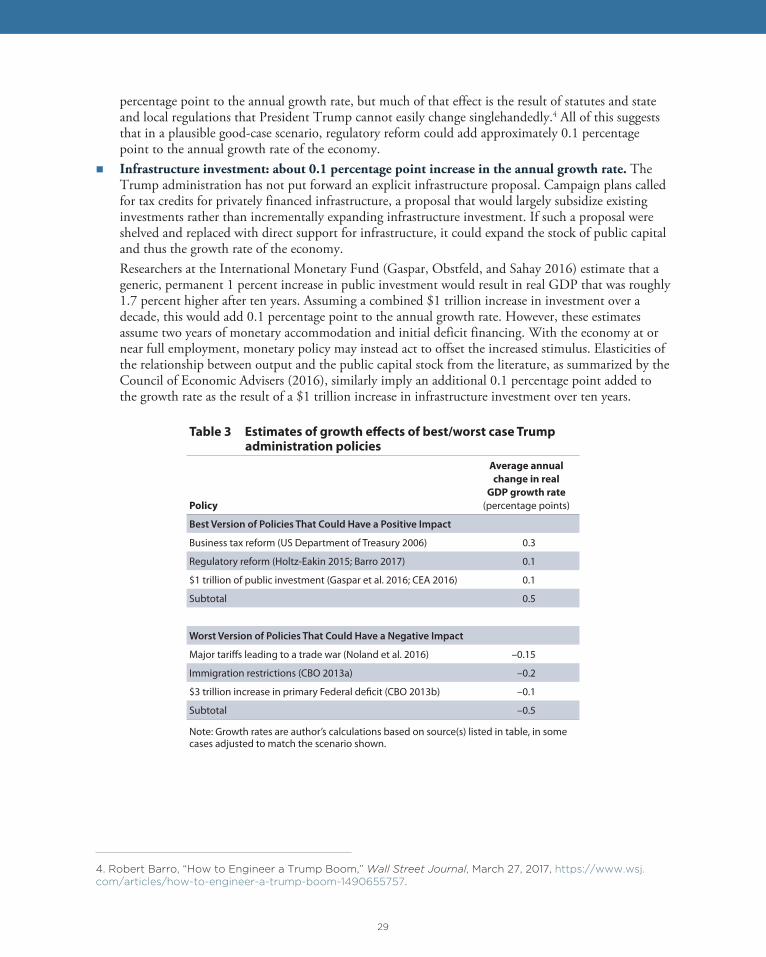
29
percentage point to the annual growth rate, but much of that effect is the result of statutes and state and local regulations that President Trump cannot easily change singlehandedly.4 All of this suggests that in a plausible good-case scenario, regulatory reform could add approximately 0.1 percentage point to the annual growth rate of the economy.
Infrastructure investment: about 0.1 percentage point increase in the annual growth rate. TheTrump administration has not put forward an explicit infrastructure proposal. Campaign plans called for tax credits for privately financed infrastructure, a proposal that would largely subsidize existing investments rather than incrementally expanding infrastructure investment. If such a proposal were shelved and replaced with direct support for infrastructure, it could expand the stock of public capital and thus the growth rate of the economy. Researchers at the International Monetary Fund (Gaspar, Obstfeld, and Sahay 2016) estimate that a generic, permanent 1 percent increase in public investment would result in real GDP that was roughly 1.7 percent higher after ten years. Assuming a combined $1 trillion increase in investment over a decade, this would add 0.1 percentage point to the annual growth rate. However, these estimates assume two years of monetary accommodation and initial deficit financing. With the economy at or near full employment, monetary policy may instead act to offset the increased stimulus. Elasticities of the relationship between output and the public capital stock from the literature, as summarized by the Council of Economic Advisers (2016), similarly imply an additional 0.1 percentage point added to the growth rate as the result of a $1 trillion increase in infrastructure investment over ten years.
4. Robert Barro, “How to Engineer a Trump Boom,” Wall Street Journal, March 27, 2017, https://www.wsj.com/articles/how-to-engineer-a-trump-boom-1490655757.
Table 3 Estimates of growth effects of best/worst case Trump administration policies
Policy
Average annual
change in real
GDP growth rate
(percentage points)
Best Version of Policies That Could Have a Positive Impact
Business tax reform (US Department of Treasury 2006) 0.3
Regulatory reform (Holtz-Eakin 2015; Barro 2017) 0.1
$1 trillion of public investment (Gaspar et al. 2016; CEA 2016) 0.1
Subtotal 0.5
Worst Version of Policies That Could Have a Negative Impact
Major tariffs leading to a trade war (Noland et al. 2016) –0.15
Immigration restrictions (CBO 2013a) –0.2
$3 trillion increase in primary Federal deficit (CBO 2013b) –0.1
Subtotal –0.5
Note: Growth rates are author’s calculations based on source(s) listed in table, in some cases adjusted to match the scenario shown.

30
Policies with a Negative Impact on Growth
Large-scale trade war: about 0.15 percentage point off the annual growth rate. Using a macro-economic simulation model developed by Moody’s Analytics, Noland, Robinson, and Moran (2016) estimate the effects of several “what if” scenarios that could plausibly result from President Trump following through on his campaign promises on trade. Under the most extreme of these scenarios—albeit one consistent with the statements President Trump made during the campaign--the United States would impose tariffs of 45 percent and 35 percent on nonoil imports from China and Mexico, respectively, with those countries retaliating by raising tariffs on US exports to those levels. In the short run, these macroeconomic shocks would cause a dramatic reduction in output, but would be followed by a partial recovery, as shown in figure 6, resulting in a 0.15 percentage point reduction in the annual growth rate measured over the next decade. As the authors themselves note, this estimate likely understates the negative economic consequences of this scenario, since their model does not include effects on supply chains. Additionally, large-scale reductions in trade as the result of a trade war would also be likely to seriously worsen the pace of innovation, a channel that is not captured by Noland, Robinson, and Moran’s model. Nevertheless, such an extreme trade scenario, with no resolution to the trade war after even a decade, is also unlikely. (Noland, Robinson, and Moran also estimate the effects of an “aborted trade war” scenario in which tariffs are reduced to baseline levels by all parties after one year. In such a scenario, growth over the next decade would be slowed by just 0.02 percentage point a year; again, this represents a lower-bound estimate insofar as it does not incorporate the full harms associated with trade restrictions.)
Immigration restrictions: about 0.2 percentage point off the annual growth rate. Restrictionson immigration to the United States—whether legal or unauthorized—could reduce the US growth rate through two channels. The first is slower growth of the workforce, whether because immigrant workers already present in the United States are deported to their home countries or because future immigration is prevented or slowed. The second is reduced total factor productivity (TFP) growth, the likely outcome of attracting fewer high-skilled immigrants and increasing uncertainty for the existing undocumented population. While President Trump has focused a great deal on blocking future unauthorized immigration and stepping up enforcement and deportation of the undocumented immigrants currently present in the United States, his administration has also taken initial steps to slow legal immigration, particu-larly in the form of temporary guest-worker programs like the H-1B program. Other Republicans have proposed more sweeping changes to US immigration law that would greatly reduce immigra-tion over the next decade. Senators Tom Cotton and David Purdue have introduced legislation that would, among other measures, cut back sharply on the number of immigrant visas available for family members of US residents, and would limit the number of refugees admitted to the United States on an annual basis. According to Sens. Cotton and Purdue, the legislation would have the net effect of cutting legal immigration in half after a decade.5 Based on estimates by CBO (2013a) for the effects of immigration reform on workforce and TFP growth, these restrictions to future immigration would subtract 0.2 percentage point from the annual growth rate over the next decade. Notably, while the Trump administration has made a number of shifts in policy and rhetoric towards greater immigra-tion restrictions, it has not embraced this specific legislation.
Deficit increases: about 0.1 percentage point off the annual growth rate. The Trump adminis-tration is likely to propose substantial net deficit reduction, at least in principle. But if some of the costs of its proposals—such as tax cuts, increases in defense spending, or increases in infrastructure
5. “Reforming American Immigration for Strong Employment Act (RAISE Act): A Bill to Restore HistoricalLegal Immigration Levels & Give Working Americans a Fair Shot at Wealth Creation,” February 2017, availableat http://static.politico.com/fd/af/3eebc635479892982f81bdfe3fa2/raise-act.pdf (accessed on May 12, 2017).
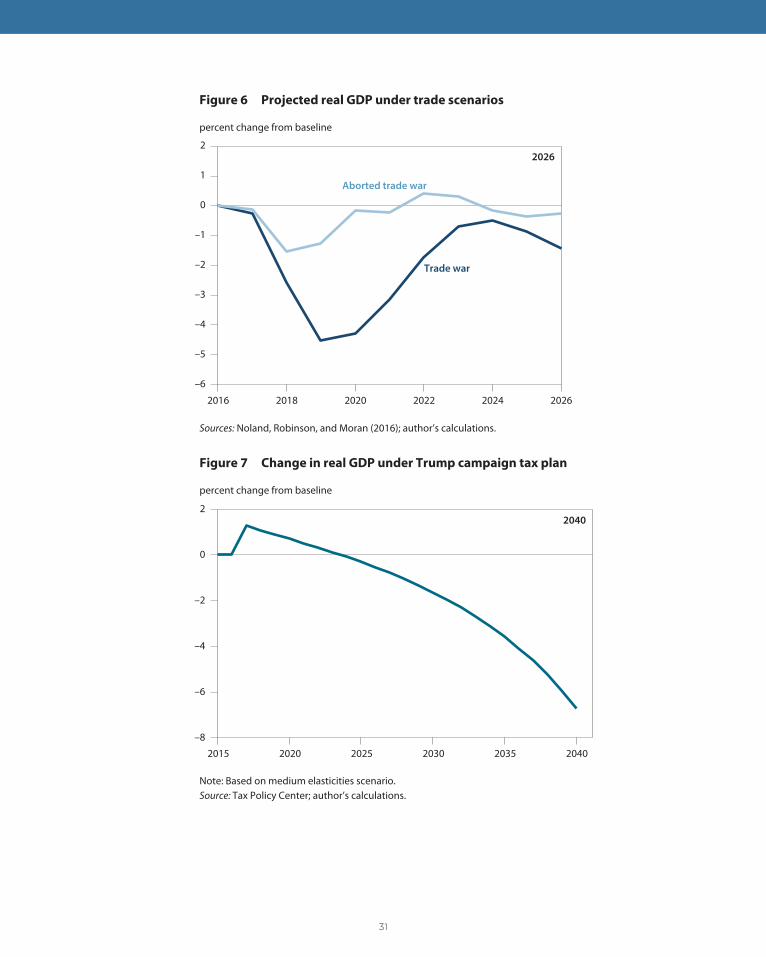
31
Trade war
Aborted trade war
–6
–5
–4
–3
–2
–1
0
1
2
2016 2018 2020 2022 2024 2026
percent change from baseline
Figure 6 Projected real GDP under trade scenarios
Sources: Noland, Robinson, and Moran (2016); author’s calculations.
2026
2040
–8
–6
–4
–2
0
2
2015 2020 2025 2030 2035 2040
percent change from baseline
Figure 7 Change in real GDP under Trump campaign tax plan
Note: Based on medium elasticities scenario. Source: Tax Policy Center; author’s calculations.
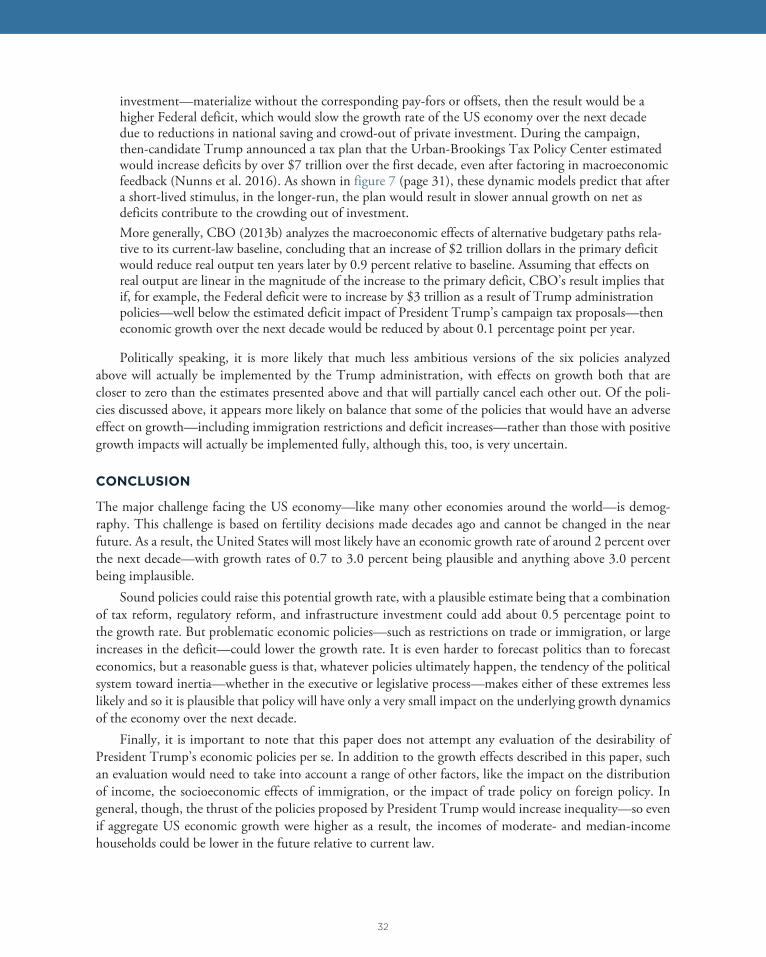
32
investment—materialize without the corresponding pay-fors or offsets, then the result would be a higher Federal deficit, which would slow the growth rate of the US economy over the next decade due to reductions in national saving and crowd-out of private investment. During the campaign, then-candidate Trump announced a tax plan that the Urban-Brookings Tax Policy Center estimated would increase deficits by over $7 trillion over the first decade, even after factoring in macroeconomic feedback (Nunns et al. 2016). As shown in figure 7 (page 31), these dynamic models predict that after a short-lived stimulus, in the longer-run, the plan would result in slower annual growth on net as deficits contribute to the crowding out of investment.More generally, CBO (2013b) analyzes the macroeconomic effects of alternative budgetary paths rela-tive to its current-law baseline, concluding that an increase of $2 trillion dollars in the primary deficit would reduce real output ten years later by 0.9 percent relative to baseline. Assuming that effects on real output are linear in the magnitude of the increase to the primary deficit, CBO’s result implies that if, for example, the Federal deficit were to increase by $3 trillion as a result of Trump administration policies—well below the estimated deficit impact of President Trump’s campaign tax proposals—then economic growth over the next decade would be reduced by about 0.1 percentage point per year.
Politically speaking, it is more likely that much less ambitious versions of the six policies analyzed above will actually be implemented by the Trump administration, with effects on growth both that are closer to zero than the estimates presented above and that will partially cancel each other out. Of the poli-cies discussed above, it appears more likely on balance that some of the policies that would have an adverse effect on growth—including immigration restrictions and deficit increases—rather than those with positive growth impacts will actually be implemented fully, although this, too, is very uncertain.
CONCLUSION
The major challenge facing the US economy—like many other economies around the world—is demog-raphy. This challenge is based on fertility decisions made decades ago and cannot be changed in the near future. As a result, the United States will most likely have an economic growth rate of around 2 percent over the next decade—with growth rates of 0.7 to 3.0 percent being plausible and anything above 3.0 percent being implausible.
Sound policies could raise this potential growth rate, with a plausible estimate being that a combination of tax reform, regulatory reform, and infrastructure investment could add about 0.5 percentage point to the growth rate. But problematic economic policies—such as restrictions on trade or immigration, or large increases in the deficit—could lower the growth rate. It is even harder to forecast politics than to forecast economics, but a reasonable guess is that, whatever policies ultimately happen, the tendency of the political system toward inertia—whether in the executive or legislative process—makes either of these extremes less likely and so it is plausible that policy will have only a very small impact on the underlying growth dynamics of the economy over the next decade.
Finally, it is important to note that this paper does not attempt any evaluation of the desirability of President Trump’s economic policies per se. In addition to the growth effects described in this paper, such an evaluation would need to take into account a range of other factors, like the impact on the distribution of income, the socioeconomic effects of immigration, or the impact of trade policy on foreign policy. In general, though, the thrust of the policies proposed by President Trump would increase inequality—so even if aggregate US economic growth were higher as a result, the incomes of moderate- and median-income households could be lower in the future relative to current law.

33
REFERENCESAltig, David, Alan J. Auerbach, Laurence J. Kotlikoff, Kent A. Smetters, and Jan Walliser. 2001. Simulating Fundamental Tax Reform in the United States. American Economic Review 91, no. 3: 574–95.
CBO (Congressional Budget Office). 2013a. S. 744, Border Security, Economic Opportunity, and Immigration Modernization Act. Washington. Available at www.cbo.gov/publication/44397.
CBO (Congressional Budget Office). 2013b. Macroeconomic Effects of Alternative Budgetary Paths. Washing-ton. Available at www.cbo.gov/publication/43769.
CBO (Congressional Budget Office). 2017. CBO’s Long-Term Projections of Labor Force Participation. Wash-ington. Available at www.cbo.gov/publication/52365.
Council of Economic Advisers. 2016. Chapter 6: The Economic Benefits of Investing in US Infrastructure. Eco-nomic Report of the President. Washington.
Feyrer, James. 2007. Demographics and Productivity. Review of Economics and Statistics 89, no. 1: 100–109.
Gaspar, Vítor, Maurice Obstfeld, and Ratna Sahay. 2016. Macroeconomic Management When Policy Space Is Constrained: A Comprehensive, Consistent, and Coordinated Approach to Economic Policy. SDN/16/09. Wash-ington: International Monetary Fund.
Holtz-Eakin, Douglas. 2015. The Growth Consequences of Dodd-Frank. Washington: American Action Forum. Available at www.americanactionforum.org/research/the-growth-consequences-of-dodd-frank/.
Maestas, Nicole, Kathleen J. Mullen, and David Powell. 2016. The Effect of Population Aging on Economic Growth, the Labor Force, and Productivity. NBER Working Paper No. 22452. Cambridge MA: National Bureau of Economic Research.
Noland, Marcus, Sherman Robinson, and Tyler Moran. 2016. Chapter 2: Impact of Clinton’s and Trump’s Trade Proposals. In Assessing Trade Agendas in the US Presidential Campaign. PIIE Briefing 16-6. Washington: Peter-son Institute for International Economics.
Nunns, Jim et al. 2016. An Analysis of Donald Trump’s Revised Tax Plan. Washington: Urban-Brookings Tax Policy Center.
US Department of Treasury. 2006. A Summary of the Dynamic Analysis of the Tax Reform Options: Prepared for the President’s Advisory Panel on Federal Tax Reform. Washington. Available at www.treasury.gov/resource-center/tax-policy/Documents/Report-Summary-Dynamic-Analysis-2006.pdf (accessed on May 12, 2017).
34
CHAPTER 4
Impact of Trump Administration’s Proposed Policies on the United States and ChinaJiming Ha © China Finance 40 Forum
The Trump administration plans to make major changes in fiscal, trade, regulatory and other economic policies. If implemented, these adjustments could boost US economic growth in the short term, elevating inflationary expectations. In response, the Federal Reserve might seek to offset the policy changes by raising interest rates in a way that could affect financial markets. This paper examines the potential impact of changes in tax, infrastructure, trade, and regulatory policy on the US and Chinese economies.
TAX POLICY
President Trump has proposed tax reforms that would significantly reduce marginal tax rates for individuals and businesses, increase the standard deduction, limit or repeal other tax deductions, and repeal the indi-vidual and corporate alternative minimum taxes and the estate and gift taxes. The leadership of the House of Representatives has proposed a boarder-adjustment tax, but the Trump administration is reportedly resisting the idea. Also under consideration is a proposal to and tax the profits of foreign subsidiaries of US companies in the year they are earned.
In the short run, tax cuts could boost incentives to work, save, and invest.1 But some analysts estimate that the proposal would substantially reduce federal revenue and raise the debt-to-GDP ratio by about 30 percentage points in the next decade, raising interest rates and crowding out private investment, thereby offsetting some or all of the plan’s positive incentive effects. The proposed income tax cuts would also exac-erbate income inequality, because the cuts disproportionately benefit wealthier people. A border-adjustment tax would lead to a stronger dollar, which could dampen the effect of the tax on trade. Moody’s estimates that a 20 percent tax on imports could lead to an appreciation of as much as 25 percent in the dollar.
1. A report by the Tax Foundation provides a quantitative analysis of the tax plan. See “Details and Analysis ofthe Donald Trump Tax Reform Plan, September 2016,” https://taxfoundation.org/details-analysis-donald-trump-tax-plan-2016/.
Jiming Ha is a fellow at China Finance 40 Forum.

35
Implications for the Chinese Economy
US tax reform could have important implications for the Chinese economy. A stronger dollar engendered by a border-adjustment tax would add to the depreciation pressure on yuan, which already fell in value against the dollar by 6.8 percent in 2016. But President Trump in his campaign trail complained about yuan depreciation and even threatened to brand China as a currency manipulator. He has more recently said he would not label China as a currency manipulator. Labeling China as a manipulator would create a dilemma for Chinese policymakers, who have endeavored to maintain the stability of the yuan with respect to a basket of currencies. The yuan would inevitably depreciate alongside other major currencies on the back of a strong dollar.
China’s direct investment in the United States skyrocketed in the recent years. A significant corporate income tax cut would make the United States a more attractive investment destination for Chinese compa-nies, adding to pressures of capital outflow. Although President Trump thinks the corporate tax is too high in the United States, many Chinese entrepreneurs say that effective taxes are much higher in China despite a lower statutory rate (25 percent). Chinese auto-glass tycoon Cao Dewang has recently aroused a heated debate about what he calls the “deadly tax rate” in China. Cao said his decision to invest a manufacturing branch in the U.S. was largely driven by China’s high taxes.
China’s tax and general government revenues accounted for 17.5 and 21.4 percent of GDP, respec-tively, in 2016, which do not appear excessively high when compared with major advanced and developing countries. However, the actual tax burden could be greater. The World Bank’s 2017 Doing Business report estimates that China’s total tax rate for corporates was 68 percent of profits through direct and indirect taxes, compared to 44 percent in the United States. Apart from statutory taxes, the perceived “tax burden” in China also includes nontax expenses, such as social insurance paid for workers, the cost of land, resources and financing, as well as a variety of government surcharges.
More important, structural reforms are needed to revamp China’s tax system, making it more condu-cive to economic transition. First, China’s tax revenue relies on indirect taxes (such as turnover taxes), accounting for 70 percent of total revenue, while revenue from direct taxes is only 30 percent. This is in stark contrast to other countries where direct taxes play a more important role. Indirect taxes, such as the value added tax (VAT), are regressive in nature as low-income households have to bear a disproportionally large proportion of the tax burden. This is not helpful for China’s economic transition toward a consumer-led economy as low-income households tend to have a higher propensity to consume. Reducing turnover taxes would help China to rebalance the economy, in which the share of consumption needs to rise and that of investment needs to fall. A low consumption/high saving rate has made the Chinese economy rely heavily on investment growth, leading to overcapacity problems and surging corporate debt.
Second, China should impose a property tax without further delay. Property prices have skyrocketed in recent years, particularly in large cities. As a result, affordability deteriorated notably, with most of the first-tier cities in China becoming the least affordable in the world. High property prices not only pose financial risks due to the high level of leverage of the industry but also increase social discontent among the low- and middle-income groups. The booming property sector crowded out activity in other industries as well.
Third, intergovernmental fiscal relations need to be streamlined and rationalized. Reforms to resolve the mismatch between expenditure needs and revenue assignments are overdue and should be pressed ahead without further delay. Chinese local governments are responsible for about 70 percent of spending needs but receive only 55 percent of the general government revenues. Despite fiscal transfers from the center, local governments have strong incentives to impose fees and charges in addition to statutory taxes, generate additional revenue through land sales, and create financial vehicles to circumvent the regulations on borrow-
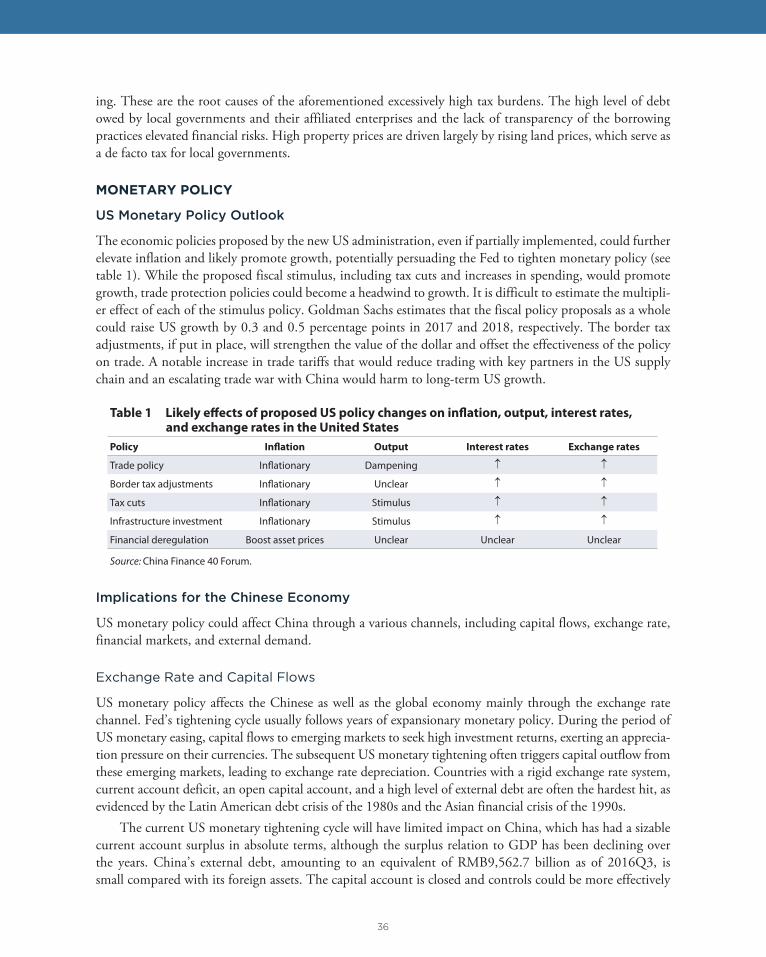
36
ing. These are the root causes of the aforementioned excessively high tax burdens. The high level of debt owed by local governments and their affiliated enterprises and the lack of transparency of the borrowing practices elevated financial risks. High property prices are driven largely by rising land prices, which serve as a de facto tax for local governments.
MONETARY POLICY
US Monetary Policy Outlook
The economic policies proposed by the new US administration, even if partially implemented, could further elevate inflation and likely promote growth, potentially persuading the Fed to tighten monetary policy (see table 1). While the proposed fiscal stimulus, including tax cuts and increases in spending, would promote growth, trade protection policies could become a headwind to growth. It is difficult to estimate the multipli-er effect of each of the stimulus policy. Goldman Sachs estimates that the fiscal policy proposals as a whole could raise US growth by 0.3 and 0.5 percentage points in 2017 and 2018, respectively. The border tax adjustments, if put in place, will strengthen the value of the dollar and offset the effectiveness of the policy on trade. A notable increase in trade tariffs that would reduce trading with key partners in the US supply chain and an escalating trade war with China would harm to long-term US growth.
Implications for the Chinese Economy
US monetary policy could affect China through a various channels, including capital flows, exchange rate, financial markets, and external demand.
Exchange Rate and Capital Flows
US monetary policy affects the Chinese as well as the global economy mainly through the exchange rate channel. Fed’s tightening cycle usually follows years of expansionary monetary policy. During the period of US monetary easing, capital flows to emerging markets to seek high investment returns, exerting an apprecia-tion pressure on their currencies. The subsequent US monetary tightening often triggers capital outflow from these emerging markets, leading to exchange rate depreciation. Countries with a rigid exchange rate system, current account deficit, an open capital account, and a high level of external debt are often the hardest hit, as evidenced by the Latin American debt crisis of the 1980s and the Asian financial crisis of the 1990s.
The current US monetary tightening cycle will have limited impact on China, which has had a sizable current account surplus in absolute terms, although the surplus relation to GDP has been declining over the years. China’s external debt, amounting to an equivalent of RMB9,562.7 billion as of 2016Q3, is small compared with its foreign assets. The capital account is closed and controls could be more effectively
Table 1 Likely effects of proposed US policy changes on inflation, output, interest rates, and exchange rates in the United States
Policy Inflation Output Interest rates Exchange rates
Trade policy Inflationary Dampening
Border tax adjustments Inflationary Unclear
Tax cuts Inflationary Stimulus
Infrastructure investment Inflationary Stimulus
Financial deregulation Boost asset prices Unclear Unclear Unclear
Source: China Finance 40 Forum.
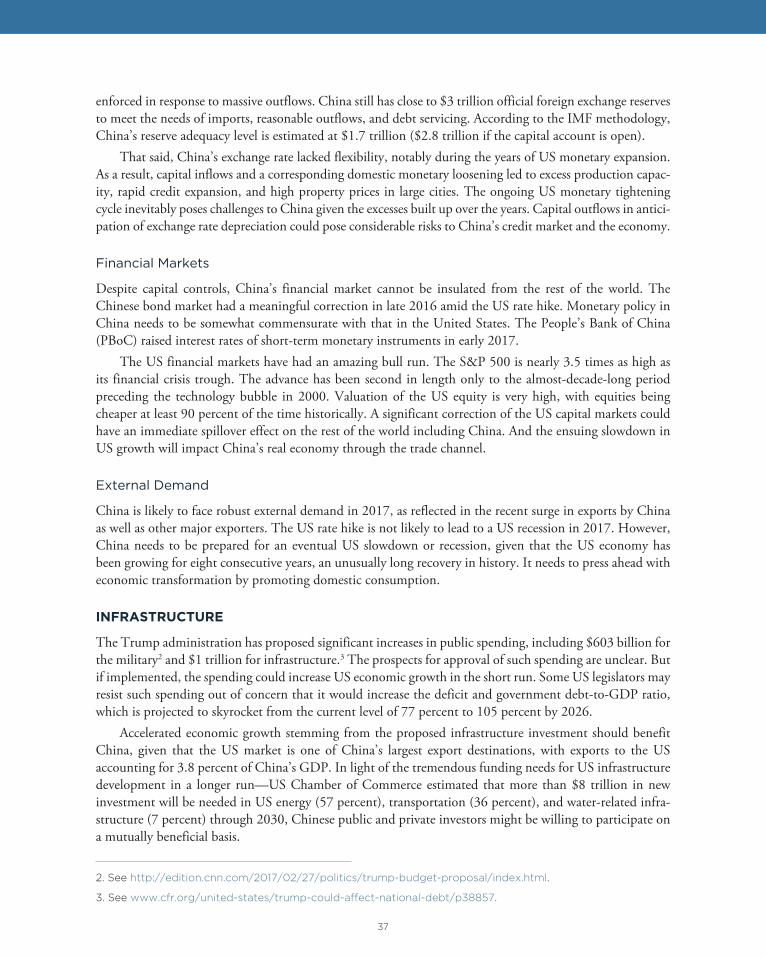
37
enforced in response to massive outflows. China still has close to $3 trillion official foreign exchange reserves to meet the needs of imports, reasonable outflows, and debt servicing. According to the IMF methodology, China’s reserve adequacy level is estimated at $1.7 trillion ($2.8 trillion if the capital account is open).
That said, China’s exchange rate lacked flexibility, notably during the years of US monetary expansion. As a result, capital inflows and a corresponding domestic monetary loosening led to excess production capac-ity, rapid credit expansion, and high property prices in large cities. The ongoing US monetary tightening cycle inevitably poses challenges to China given the excesses built up over the years. Capital outflows in antici-pation of exchange rate depreciation could pose considerable risks to China’s credit market and the economy.
Financial Markets
Despite capital controls, China’s financial market cannot be insulated from the rest of the world. The Chinese bond market had a meaningful correction in late 2016 amid the US rate hike. Monetary policy in China needs to be somewhat commensurate with that in the United States. The People’s Bank of China (PBoC) raised interest rates of short-term monetary instruments in early 2017.
The US financial markets have had an amazing bull run. The S&P 500 is nearly 3.5 times as high as its financial crisis trough. The advance has been second in length only to the almost-decade-long period preceding the technology bubble in 2000. Valuation of the US equity is very high, with equities being cheaper at least 90 percent of the time historically. A significant correction of the US capital markets could have an immediate spillover effect on the rest of the world including China. And the ensuing slowdown in US growth will impact China’s real economy through the trade channel.
External Demand
China is likely to face robust external demand in 2017, as reflected in the recent surge in exports by China as well as other major exporters. The US rate hike is not likely to lead to a US recession in 2017. However, China needs to be prepared for an eventual US slowdown or recession, given that the US economy has been growing for eight consecutive years, an unusually long recovery in history. It needs to press ahead with economic transformation by promoting domestic consumption.
INFRASTRUCTURE
The Trump administration has proposed significant increases in public spending, including $603 billion for the military2 and $1 trillion for infrastructure.3 The prospects for approval of such spending are unclear. But if implemented, the spending could increase US economic growth in the short run. Some US legislators may resist such spending out of concern that it would increase the deficit and government debt-to-GDP ratio, which is projected to skyrocket from the current level of 77 percent to 105 percent by 2026.
Accelerated economic growth stemming from the proposed infrastructure investment should benefit China, given that the US market is one of China’s largest export destinations, with exports to the US accounting for 3.8 percent of China’s GDP. In light of the tremendous funding needs for US infrastructure development in a longer run—US Chamber of Commerce estimated that more than $8 trillion in new investment will be needed in US energy (57 percent), transportation (36 percent), and water-related infra-structure (7 percent) through 2030, Chinese public and private investors might be willing to participate on a mutually beneficial basis.
2. See http://edition.cnn.com/2017/02/27/politics/trump-budget-proposal/index.html.
3. See www.cfr.org/united-states/trump-could-aff ect-national-debt/p38857.

38
China in recent years has undertaken enormous infrastructure projects, which spurred its economic growth. It has accumulated tremendous experience in infrastructure development. Its high-speed rail system will increase to 30,000 kilometers by 2020, connecting more than 80 percent of China’s major cities. Some Chinese companies have gained experience in developing US infrastructure projects. For instance, the joint venture between China’s ENN group and Utah-based CH4 Energy Corporation, the Alexander Hamilton Bridge project and the Pulaski Skyway project both undertaken by China Construction America (CCA). With tremendous savings and rich experience in infrastructure development, China could become a poten-tially important partner for building US infrastructure.
TRADE RELATIONS
China is a very open economy. Exports account for 20.7 percent and imports 15.3 percent of GDP.4 China has a close trade relationship with the United States. It has become the world’s second largest economy and the second largest trade partner of the United States. Nonetheless, trade between China and the US is imbal-anced, as the former runs a significant surplus against the latter in trade of goods. China accounts for about half of the US trade deficit, which exceeds the combined surplus of the next three largest surplus countries (Germany, Japan, and Mexico). When measured in value-added terms, China still contributes to more than one-third of the US trade deficit, and the contribution increased in the recent years. It is therefore not surpris-ing that China-US trade imbalance attracts considerable attention of US administration and researchers alike.
Judging by President Trump’s campaign rhetoric, the US administration intends to promote employ-ment growth, particularly in the manufacturing sector, including by resorting to trade protectionist policy. Among the measures that were being contemplated was a high rate of tariff on imports from China.
Trade protectionism against China would not be a sensible policy option to address the US deficit and employment issues, for several reasons. First, China’s traditional exports to the US are manufactured mainly by labor-intensive industries, in which the US does not have a comparative advantage given the wide wage differential. In the event of a high tariff on Chinese products, other emerging market economies would replace China as major exporters to the United States; employment in the United States would not rise. Second, China’s high-tech exports to the US contain limited value added, as a large part of the gross value reflects intermediate goods imported from other countries including the United States. A high tariff on these products would be harmful to all countries along the supply chain, which could have a backlash on the US economy. In a full-scale trade conflict scenario—in which the United States imposes a 10 percent tariff on all imports from China and China retaliates with the same tariff on US goods—GDP growth could fall by 0.4 to 1 percentage points in China and by 0.1 to 0.25 percentage points in the United States.5
It is in the interest of both China and the United States to work out a solution. The two economies are the largest in the world and so intertwined that harsh policies from one country could impact the other and even the rest of the world. Just to highlight some of the stylized facts, China was the US’s third largest goods export market in 2015. Boeing estimated that Chinese airlines are likely to purchase 6,810 planes worth $1.025 trillion in the next 20 years.6 US services exports to China have been growing rapidly, rising by an annual average rate of 16.7 percent from 2006 to 2014, which made China the fourth largest market of US services exports. Total US services trade surplus with China reached $33 billion in 2015, including travel and education (57.2 percent), royalties (12.3 percent), transportation (10.1 percent), business and professional services (7.7 percent) and financial services (6.3 percent).
4. See http://wits.worldbank.org/CountryProfi le/en/CHN.
5. See www.cf40.org.cn/plus/view.php?aid=11627.
6. See http://fortune.com/2016/09/13/china-buys-planes-boeing.

39
To reduce the trade surplus with the United States, China could increase imports of US products, including aircraft, energy, machinery, and agricultural and cultural products. It could consider further open up the services sector to the United States. Although there are still 122 sections including 15 industries on China’s 2015 Free Trade Zone negative list, we expect the list to be narrowed going forward. China could substantially cut restrictions in some services, including travel, software development, research and design, engineering and logistics. Restrictions on accounting, auditing, architectural design, financial industries could also be loosened.
FINANCIAL DEREGULATION
The far-reaching market failure in 2008 led to the most comprehensive financial regulation reforms since the Glass-Steagall Act of 1933. In July 2010 the Dodd-Frank Wall Street Reform and the Consumer Protec-tion Act were signed into law. In the past six years, the financial sector in the United States recovered steadily under tightened regulations.
On February 3, 2017, President Trump signed an executive order directing the Treasury secretary to review the current financial regulatory framework and stated that the Dodd-Frank Act has severely damaged banks’ ability to extend credit and obstructed economic growth. While it is unlikely the Dodd-Frank Act will be repealed, the president and the Congress could amend some of its provisions.7
Impact of Deregulation
The short-term impact would be as follows:
On small banks: The Dodd-Frank Act forced financial institutions to allocate more resources tocompliance and is particularly hard on small banks. In this regard, an ease on regulatory enforcementmay boost the profitability of smaller banks.
On financial stocks: Scaling back financial regulation in general may boost the return on equity offinancial institutions by reducing the compliance costs. The expectation of an extensive deregulationhas been priced into the market, and fueled the rally of financial stocks.
On the economy: Economic impact is uncertain. Weak demand and the need for deleveraging, notcredit supply, are among the underlying factors behind the slow economic recovery. The corporatesector has piled up tons of cash, and the debt to equity ratio, as a measure of corporate leverage, keepsfalling. The share of private investment in GDP growth, which stood at 16.5 percent as of 2016Q4,was well below its precrisis level of over 18 percent. Irrespective of the historical low levels of interestrates for an extended period, credit demand by the real sector remained lackluster. It is therefore notobvious that relaxed regulations would boost credit demand and economic growth.
The long-term impact would be as follows:
Financial risk: The long-term impact depends on which part of the regulations will be repealed.Judging from what has been emphasized by the Trump team, a major goal is to loosen restrictions onbanks in order to increase credit supply. This could brew systemic risks in the long run. Given that arapid buildup of debt is a key driving force of most financial crises, reckless deregulation could lead toanother financial crisis in future.
7. Reena Agrawal Sahni, Rethinking US Financial Regulation in Light of the 2016 Election, Shearman &Sterling LLP; Dan Ryan, Ten Key Implications of Donald Trump’s Electoral Victory for Financial and SecuritiesRegulation, PricewaterhouseCoopers LLP.

40
International competition and cooperation: US financial deregulation would have a spillover impacton other parts of the world, particularly Europe. Unlike the US banks, banks in Europe and otherregions have not regained their competitiveness after the crisis and many are in a dire situation. Someregulators in the European Union are actually seeking to impose even more strict capital and liquidityrequirements (Basel IV, of which the United States was a strong proponent during the Obama era).With the United States scaling back regulation, Basel IV may never be finalized and internationalefforts to forge a homogeneous regulatory agenda will be undermined. EU regulators generally viewTrump’s deregulation efforts as unleashing financial risks and sowing the seed for another crisis.Moreover, nations in Europe may be pressured to prematurely relax regulation to stay competitive forwhich their banks are not ready yet and will harm them in the long run.
Financial Regulation in China
Despite rising Chinese direct investment in the United States, cross-border portfolio investment remains subject to China’s capital controls, which have been more strictly enforced of late. China therefore does not have to follow the United States in the direction of financial regulatory reforms. In fact, China might be even going in the opposite direction from the United States. After the financial crisis, the US private sector has gone through a deleveraging process and their balance sheets have improved significantly, while the US banking sector turned around fairly quickly. In contrast, China’s financial risks escalated on the back of rapid credit expansion and rising leverage across virtually all segments of the economy.
Rising Debt
According to the Bank for International Settlements (BIS), China’s total credit to nonfinancial corporations amounted to 167 percent of GDP in June 2016, much higher than 72 percent in the United States and 106 percent in emerging markets. The rapid growth of private debt and rising nonperforming loans are cause for great concern. In September 2016, the BIS issued a warning on increasing risk of a banking crisis in China in the next three years.
Housing Bubble
Property prices in China’s 70 major cities rose drastically, causing concerns of asset bubbles. Easy credit is among the factors behind speculative activities in the real estate market. A financial crisis is typically built on fast debt growth and asset price bubbles, both of which are noticeable in China. The government has taken steps to curb the overheated market in tier 1 and tier 2 cities, placing strict restrictions on purchases and mortgages.
Shadow Banks
The shadow banking system has been implicated as a significant contributor to the 2008 US financial crisis. The Dodd-Frank Act therefore includes many provisions relevant to shadow banks. In China, shadow banking has been growing rapidly and is now estimated to be about 58 percent of GDP.8 Off-balance-sheet products in China were not closely monitored by the regulators. Credit growth, part of which is in the guise of wealth management products (WMPs) and investment schemes, reduced the degree of transparency and increased the risk of contagion within the financial system. The PBoC has included off-balance-sheet prod-ucts into the Macro Prudential Assessment Program since 2016, marking an important step in tightening
8. IMF, Resolving China’s Corporate Debt Problem, Working Paper WP/16/203, Washington.

41
regulations on shadow banking. The Chinese leadership attached a top priority to containing financial risks in the Economic Work Conference held in December 2016. Interest rates of short-term policy instruments (standing lending facility and medium-term lending facility) were subsequently raised to rein in excessive speculation.
Regulation to Be Improved
China’s current financial regulatory framework essentially adopts an institutional approach, in which a firm’s legal status (for example, a bank, securities firm, or insurance company) determines which regulator (e.g., CBRC, CSRC, and CIRC) supervises its activities. However, as financial institutions increasingly engage in cross-market, cross-sector businesses, the new business model increasingly poses challenges to regulators. Under the current approach, same or similar products or activities by different institutions are subject to supervision by different regulators, resulting in regulatory arbitrage. In addition, fragmented regulation has proven ineffective for cross-market activities as no single regulator has complete coverage of the entire transaction process and hence is unable to properly identify risks. The lack of information sharing and coordination of supervisory measures during the stock market turmoil in 2015 is a case in point—the securities regulator did not have real-time information of the funds engaging in margin trading, which was supervised by the banking regulator. Discussion has been ongoing about reforming the regulatory frame-work, including reorganizing the financial regulatory bodies. Irrespective of an eventual decision on orga-nizational structure, it is critical to enhance coordination to ensure full coverage of risks and standardized regulatory rules. Currently the four regulators (PBoC, CBRC, CSRC, and CIRC) are working to establish a set of unified rules for asset management products, signaling a higher level of coordination and concerted efforts to strengthen financial regulations.
CONCLUSION
US policy changes could have important implications for China. The expected normalization of US mone-tary policy would have a spillover effect in China, which has indeed already been withdrawing monetary stimulus in light of the short-term growth recovery, rising property prices, and financial risks. The synchro-nization of monetary policy would also help China to prevent yuan depreciation against the dollar, appar-ently consistent with the understanding on the currency issue of the Chinese and US leadership. Tax policy changes in the United States might make the United States a more attractive investment destination for China’s corporates but could prompt Chinese policymakers to initiate their own tax reforms. Trade war is not a solution to the imbalances between China and the United States. China could increase goods imports from and open up certain services sectors to the United States, while the United States could ease restrictions on exports of technological products. The room for policy coordination in infrastructure development is huge given China’s impressive expertise and funding availability. Unlike the United States, China needs to tighten regulations and improve policy coordination among the regulatory bodies to ward off financial risks.
42
CHAPTER 5
Exchange Rates and the International Monetary System: Not a ScapegoatGuan Tao, Lu Zhengwei, and Guo Jiayi© CF40
THE DOLLAR-BASED INTERNATIONAL MONETARY SYSTEM
With the breakdown of the Bretton Woods system, the dollar standard established after World War II has weakened. It, however, still remains unchallenged at the center of the international monetary system (figure 1).
The international mechanism in which the United States purchases goods from other countries and other countries buy US Treasury bonds allows American consumers to import goods at a lower price from all over the world and enjoy a growth dividend from globalization, particularly from the fast-growing emerg-ing economies.
Although the United States has long run a huge current account deficit, dollars flow back to the United States through capital and financial accounts, providing cheap money for the US government and firms and reducing the yields on US Treasury bonds (figure 2). In addition, most foreign debts are quoted in dollars, so debts are completely free of the currency mismatch risk facing emerging economies. The United States is the world’s largest net debtor but has a positive return on international investment (figure 3).
THE UNSOLVED TRIFFIN DILEMMA
As early as the establishment of the Bretton Woods system, the dollar standard has been found to have an insurmountable problem.1 The Triffin dilemma—named after economist Robert Triffin—refers to the fact that if the United States cannot maintain a trade deficit, the global economy will lose dollar liquidity and stall, but if the United States continues to export dollars to maintain global liquidity, the long-term and growing trade deficit will erode the dollar’s credibility as a reserve currency.
1. International Monetary Fund, Money Matters: An IMF Exhibit—The Importance of Global Cooperation,System in Crisis (1959–1971), part 4 of 7, www.imf.org/external/np/exr/center/mm/eng/mm_sc_03.htm.
III. Exchange Rates and Finance
Guan Tao is senior fellow at CF40. Lu Zhengwei is chief economist at the China Industrial Bank. Guo Jiayi is senior analyst at CIB Research. They thank Zhang Juntao, Jiang Dongying and Li Miaoxian from CIB Research for providing important materials for the writing of this paper.
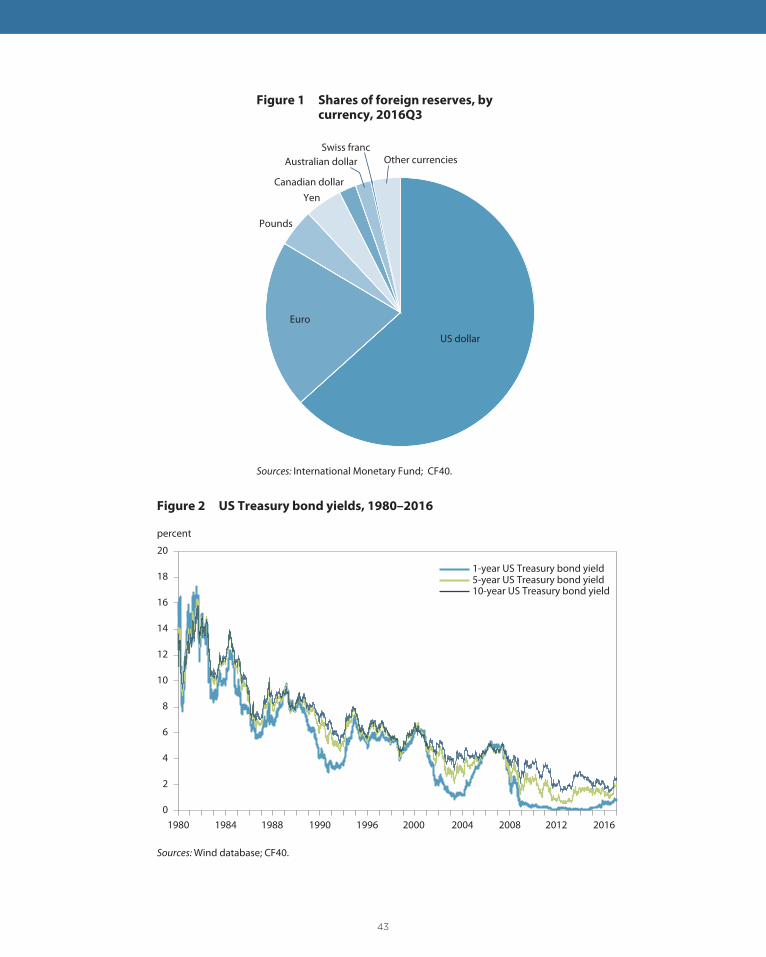
43
US dollar
Euro
Pounds
YenCanadian dollar
Australian dollarSwiss franc
Other currencies
Figure 1 Shares of foreign reserves, by currency, 2016Q3
Sources: International Monetary Fund; CF40.
0
2
4
6
8
10
12
14
16
18
20
1-year US Treasury bond yield5-year US Treasury bond yield10-year US Treasury bond yield
percent
Figure 2 US Treasury bond yields, 1980–2016
Sources: Wind database; CF40.
1980 1984 1988 1990 1996 2000 2004 2008 2012 2016
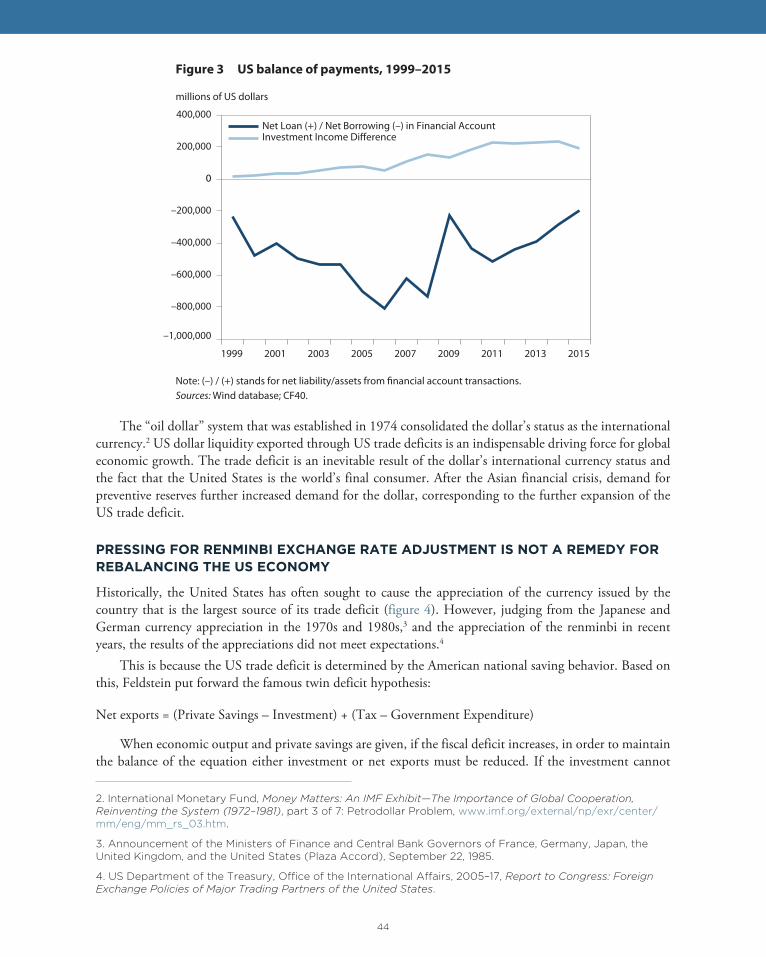
44
The “oil dollar” system that was established in 1974 consolidated the dollar’s status as the international currency.2 US dollar liquidity exported through US trade deficits is an indispensable driving force for global economic growth. The trade deficit is an inevitable result of the dollar’s international currency status and the fact that the United States is the world’s final consumer. After the Asian financial crisis, demand for preventive reserves further increased demand for the dollar, corresponding to the further expansion of the US trade deficit.
PRESSING FOR RENMINBI EXCHANGE RATE ADJUSTMENT IS NOT A REMEDY FOR REBALANCING THE US ECONOMY
Historically, the United States has often sought to cause the appreciation of the currency issued by the country that is the largest source of its trade deficit (figure 4). However, judging from the Japanese and German currency appreciation in the 1970s and 1980s,3 and the appreciation of the renminbi in recent years, the results of the appreciations did not meet expectations.4
This is because the US trade deficit is determined by the American national saving behavior. Based on this, Feldstein put forward the famous twin deficit hypothesis:
Net exports = (Private Savings – Investment) + (Tax – Government Expenditure)
When economic output and private savings are given, if the fiscal deficit increases, in order to maintain the balance of the equation either investment or net exports must be reduced. If the investment cannot
2. International Monetary Fund, Money Matters: An IMF Exhibit—The Importance of Global Cooperation,Reinventing the System (1972–1981), part 3 of 7: Petrodollar Problem, www.imf.org/external/np/exr/center/mm/eng/mm_rs_03.htm.
3. Announcement of the Ministers of Finance and Central Bank Governors of France, Germany, Japan, theUnited Kingdom, and the United States (Plaza Accord), September 22, 1985.
4. US Department of the Treasury, Offi ce of the International Aff airs, 2005–17, Report to Congress: ForeignExchange Policies of Major Trading Partners of the United States.
–1,000,000
–800,000
–600,000
–400,000
–200,000
0
200,000
400,000
1999 2001 2003 2005 2007 2009 2011 2013 2015
Net Loan (+) / Net Borrowing (–) in Financial AccountInvestment Income Difference
millions of US dollars
Figure 3 US balance of payments, 1999–2015
Note: (–) / (+) stands for net liability/assets from financial account transactions.Sources: Wind database; CF40.
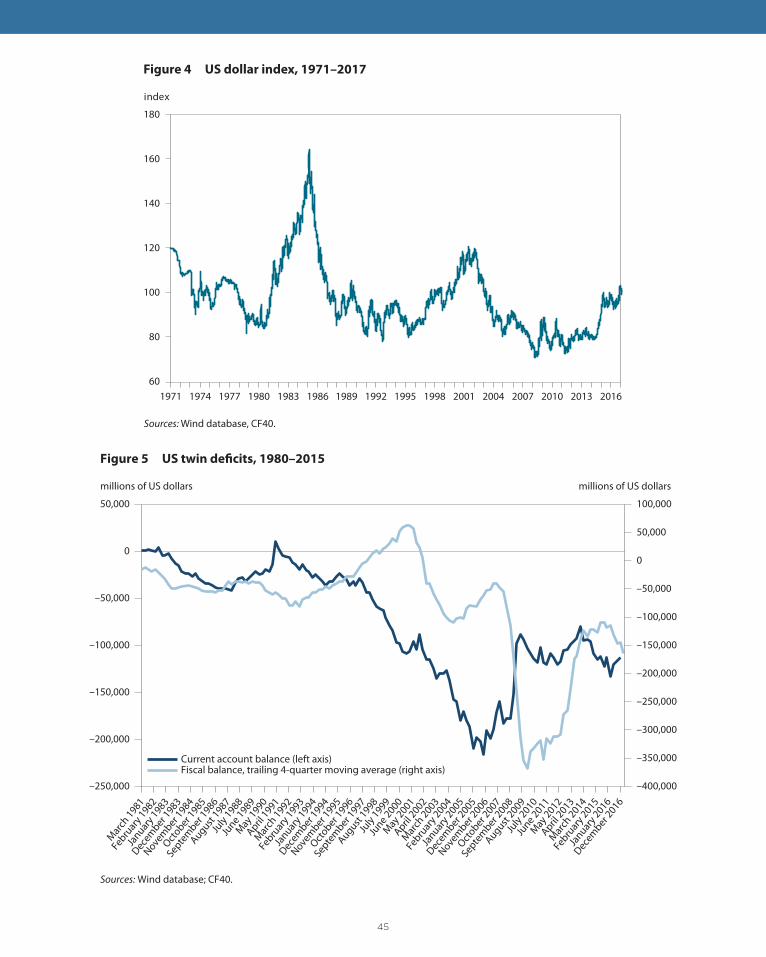
45
60
80
100
120
140
160
180
index
Figure 4 US dollar index, 1971–2017
Sources: Wind database, CF40.
1971 1974 1977 1980 1983 1986 1989 1992 1995 1998 2001 2004 2007 2010 2013 2016
–400,000
–350,000
–300,000
–250,000
–200,000
–150,000
–100,000
–50,000
0
50,000
100,000
–250,000
–200,000
–150,000
–100,000
–50,000
0
50,000
Mar
ch 1981
Febru
ary 1
982
Januar
y 1983
Decem
ber 1983
Novem
ber 1984
October 1
985
Septe
mber 1
986
August 1987
July
1988Ju
ne 1989M
ay 1990
April 1991
Mar
ch 1992
Febru
ary 1
993
Januar
y 1994
Decem
ber 1994
Novem
ber 1995
October 1
996
Septe
mber 1
997
August 1998
July
1999Ju
ne 2000M
ay 2001
April 2002
Mar
ch 2003
Febru
ary 2
004
Januar
y 2005
Decem
ber 2005
Novem
ber 2006
October 2
007
Septe
mber 2
008
August 2009
July
2010Ju
ne 2011M
ay 2012
April 2013
Mar
ch 2014
Febru
ary 2
015
Januar
y 2016
Decem
ber 2016
Current account balance (left axis)Fiscal balance, trailing 4-quarter moving average (right axis)
Figure 5 US twin deficits, 1980–2015
Sources: Wind database; CF40.
millions of US dollars millions of US dollars
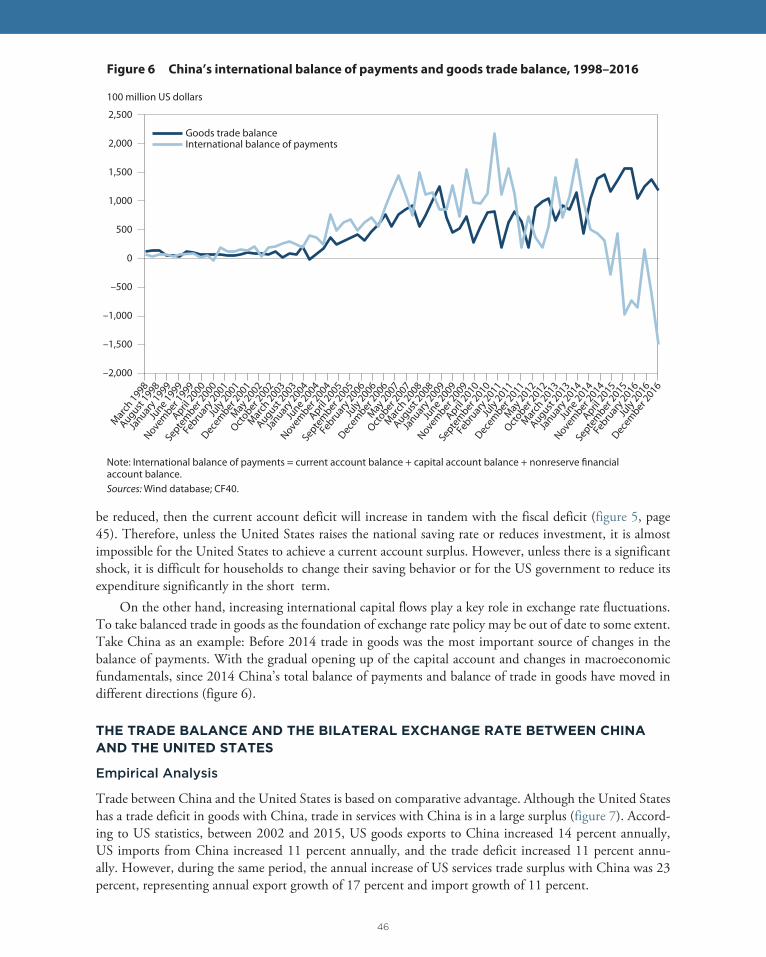
46
be reduced, then the current account deficit will increase in tandem with the fiscal deficit (figure 5, page 45). Therefore, unless the United States raises the national saving rate or reduces investment, it is almost impossible for the United States to achieve a current account surplus. However, unless there is a significant shock, it is difficult for households to change their saving behavior or for the US government to reduce its expenditure significantly in the short term.
On the other hand, increasing international capital flows play a key role in exchange rate fluctuations. To take balanced trade in goods as the foundation of exchange rate policy may be out of date to some extent. Take China as an example: Before 2014 trade in goods was the most important source of changes in the balance of payments. With the gradual opening up of the capital account and changes in macroeconomic fundamentals, since 2014 China’s total balance of payments and balance of trade in goods have moved in different directions (figure 6).
THE TRADE BALANCE AND THE BILATERAL EXCHANGE RATE BETWEEN CHINA AND THE UNITED STATES
Empirical Analysis
Trade between China and the United States is based on comparative advantage. Although the United States has a trade deficit in goods with China, trade in services with China is in a large surplus (figure 7). Accord-ing to US statistics, between 2002 and 2015, US goods exports to China increased 14 percent annually, US imports from China increased 11 percent annually, and the trade deficit increased 11 percent annu-ally. However, during the same period, the annual increase of US services trade surplus with China was 23 percent, representing annual export growth of 17 percent and import growth of 11 percent.
–2,000
–1,500
–1,000
–500
0
500
1,000
1,500
2,000
2,500M
arch
1998
August 1998
Januar
y 1999
June 1999
Novem
ber 1999
April 2000
Septe
mber 2
000
Febru
ary 2
001Ju
ly 2001
Decem
ber 2001
May
2002
October 2
002
Mar
ch 2003
August 2003
Januar
y 2004
June 2004
Novem
ber 2004
April 2005
Septe
mber 2
005
Febru
ary 2
006Ju
ly 2006
Decem
ber 2006
May
2007
October 2
007
Mar
ch 2008
August 2008
Januar
y 2009
June 2009
Novem
ber 2009
April 2010
Septe
mber 2
010
Febru
ary 2
011Ju
ly 2011
Decem
ber 2011
May
2012
October 2
012
Mar
ch 2013
August 2013
Januar
y 2014
June 2014
Novem
ber 2014
April 2015
Septe
mber 2
015
Febru
ary 2
016Ju
ly 2016
Decem
ber 2016
Goods trade balanceInternational balance of payments
Figure 6 China’s international balance of payments and goods trade balance, 1998–2016
Note: International balance of payments = current account balance + capital account balance + nonreserve financial account balance.Sources: Wind database; CF40.
100 million US dollars

47
0
5
10
15
20
25
30
35
40
–400
–350
–300
–250
–200
–150
–100
–50
0
Goods trade balance with China (right axis)Services trade balance with China (left axis)
Figure 7 US trade balance with China, 1992–2016
Sources: Wind database; CF40.
1992 1994 1996 1998 2000 2002 2004 2006 2008 2010 2012 2014 2016
billions of US dollars billions of US dollars
–40
–20
0
20
40
60
80
100
–10
0
10
20
30
40
50
percent percent
Figure 8 Exchange rate of US dollar against the renminbi and US trade balance with China, 1987–2015
Sources: Wind database; CF40.
US dollar appreciation against renminbi (left axis)Year-on-year trade balance growth rate on goods with China (right axis)
1987 1989 1991 1993 1995 1997 1999 2001 2003 2005 2007 2009 2011 2013 2015
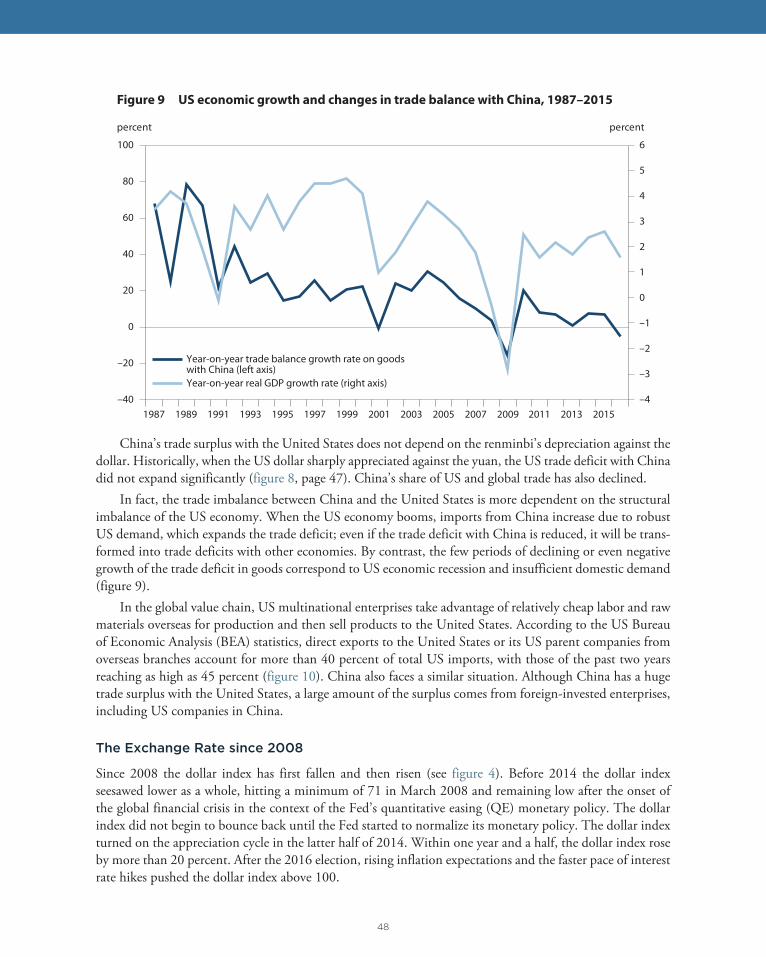
48
China’s trade surplus with the United States does not depend on the renminbi’s depreciation against the dollar. Historically, when the US dollar sharply appreciated against the yuan, the US trade deficit with China did not expand significantly (figure 8, page 47). China’s share of US and global trade has also declined.
In fact, the trade imbalance between China and the United States is more dependent on the structural imbalance of the US economy. When the US economy booms, imports from China increase due to robust US demand, which expands the trade deficit; even if the trade deficit with China is reduced, it will be trans-formed into trade deficits with other economies. By contrast, the few periods of declining or even negative growth of the trade deficit in goods correspond to US economic recession and insufficient domestic demand (figure 9).
In the global value chain, US multinational enterprises take advantage of relatively cheap labor and raw materials overseas for production and then sell products to the United States. According to the US Bureau of Economic Analysis (BEA) statistics, direct exports to the United States or its US parent companies from overseas branches account for more than 40 percent of total US imports, with those of the past two years reaching as high as 45 percent (figure 10). China also faces a similar situation. Although China has a huge trade surplus with the United States, a large amount of the surplus comes from foreign-invested enterprises, including US companies in China.
The Exchange Rate since 2008
Since 2008 the dollar index has first fallen and then risen (see figure 4). Before 2014 the dollar index seesawed lower as a whole, hitting a minimum of 71 in March 2008 and remaining low after the onset of the global financial crisis in the context of the Fed’s quantitative easing (QE) monetary policy. The dollar index did not begin to bounce back until the Fed started to normalize its monetary policy. The dollar index turned on the appreciation cycle in the latter half of 2014. Within one year and a half, the dollar index rose by more than 20 percent. After the 2016 election, rising inflation expectations and the faster pace of interest rate hikes pushed the dollar index above 100.
–4
–3
–2
–1
0
1
2
3
4
5
6
–40
–20
0
20
40
60
80
100
Year-on-year trade balance growth rate on goods with China (left axis)Year-on-year real GDP growth rate (right axis)
percent percent
Figure 9 US economic growth and changes in trade balance with China, 1987–2015
1987 1989 1991 1993 1995 1997 1999 2001 2003 2005 2007 2009 2011 2013 2015
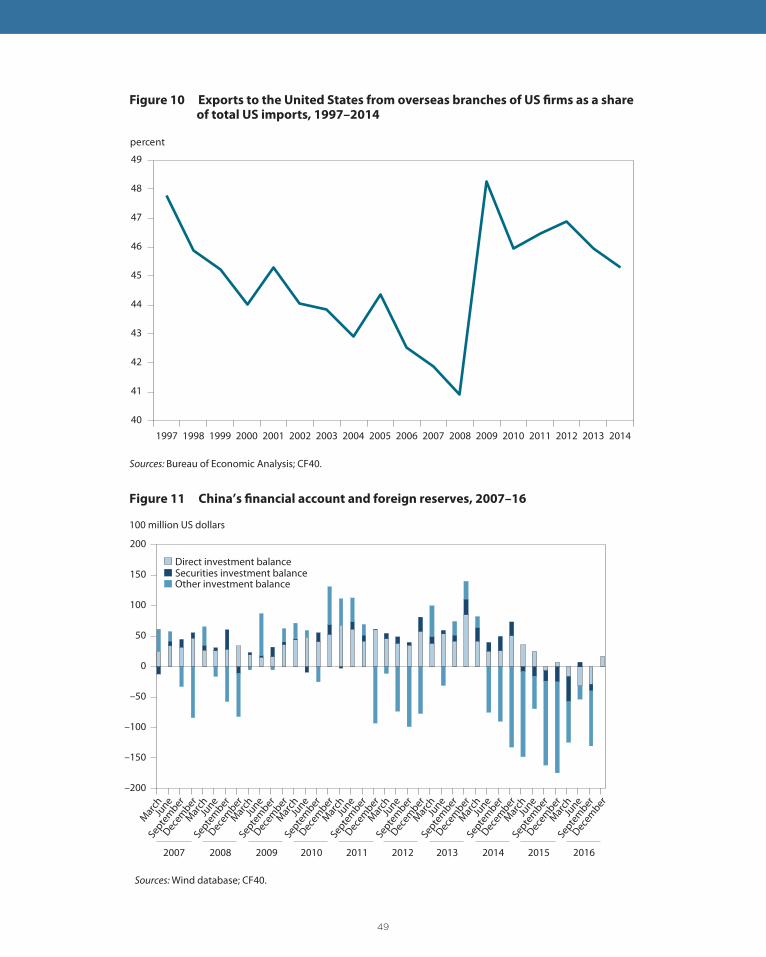
49
40
41
42
43
44
45
46
47
48
49
1997 1998 1999 2000 2001 2002 2003 2004 2005 2006 2007 2008 2009 2010 2011 2012 2013 2014
percent
Figure 10 Exports to the United States from overseas branches of US firms as a share of total US imports, 1997–2014
Sources: Bureau of Economic Analysis; CF40.
–200
–150
–100
–50
0
50
100
150
200
Mar
chJu
ne
Septe
mber
Decem
ber
Direct investment balanceSecurities investment balanceOther investment balance
Figure 11 China’s financial account and foreign reserves, 2007–16
Sources: Wind database; CF40.
100 million US dollars
2007 2008 2009 2010 2011 2012 2013 2014 2015 2016
Mar
chJu
ne
Septe
mber
Decem
berM
arch
June
Septe
mber
Decem
berM
arch
June
Septe
mber
Decem
berM
arch
June
Septe
mber
Decem
berM
arch
June
Septe
mber
Decem
berM
arch
June
Septe
mber
Decem
berM
arch
June
Septe
mber
Decem
berM
arch
June
Septe
mber
Decem
berM
arch
June
Septe
mber
Decem
ber
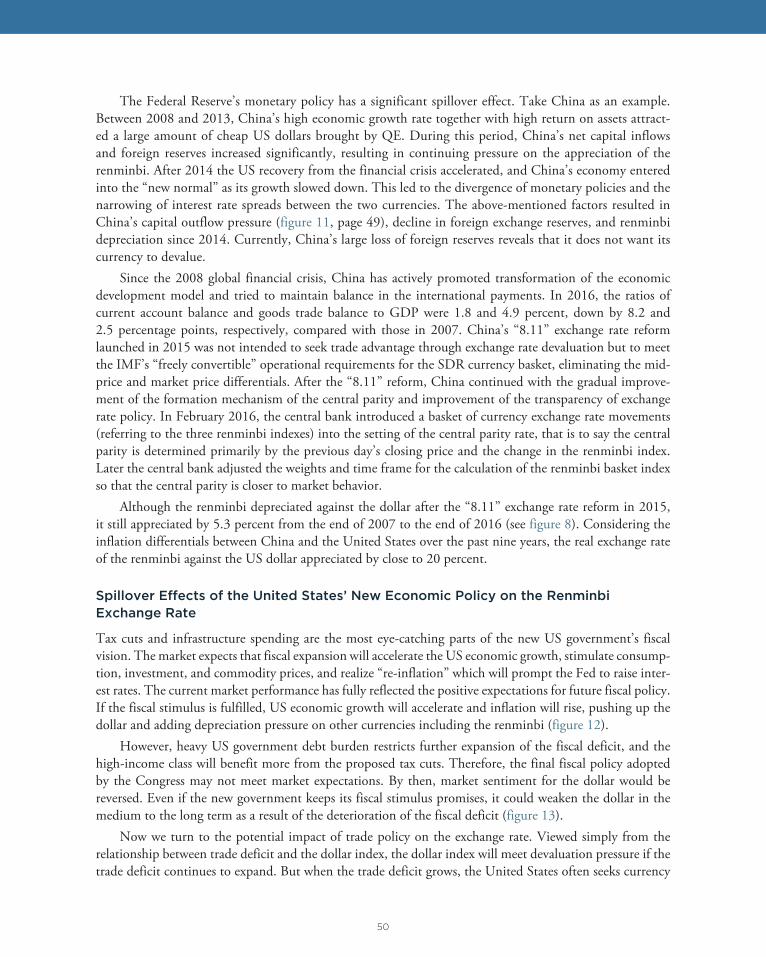
50
The Federal Reserve’s monetary policy has a significant spillover effect. Take China as an example. Between 2008 and 2013, China’s high economic growth rate together with high return on assets attract-ed a large amount of cheap US dollars brought by QE. During this period, China’s net capital inflows and foreign reserves increased significantly, resulting in continuing pressure on the appreciation of the renminbi. After 2014 the US recovery from the financial crisis accelerated, and China’s economy entered into the “new normal” as its growth slowed down. This led to the divergence of monetary policies and the narrowing of interest rate spreads between the two currencies. The above-mentioned factors resulted in China’s capital outflow pressure (figure 11, page 49), decline in foreign exchange reserves, and renminbi depreciation since 2014. Currently, China’s large loss of foreign reserves reveals that it does not want its currency to devalue.
Since the 2008 global financial crisis, China has actively promoted transformation of the economic development model and tried to maintain balance in the international payments. In 2016, the ratios of current account balance and goods trade balance to GDP were 1.8 and 4.9 percent, down by 8.2 and 2.5 percentage points, respectively, compared with those in 2007. China’s “8.11” exchange rate reform launched in 2015 was not intended to seek trade advantage through exchange rate devaluation but to meet the IMF’s “freely convertible” operational requirements for the SDR currency basket, eliminating the mid-price and market price differentials. After the “8.11” reform, China continued with the gradual improve-ment of the formation mechanism of the central parity and improvement of the transparency of exchange rate policy. In February 2016, the central bank introduced a basket of currency exchange rate movements (referring to the three renminbi indexes) into the setting of the central parity rate, that is to say the central parity is determined primarily by the previous day’s closing price and the change in the renminbi index. Later the central bank adjusted the weights and time frame for the calculation of the renminbi basket index so that the central parity is closer to market behavior.
Although the renminbi depreciated against the dollar after the “8.11” exchange rate reform in 2015, it still appreciated by 5.3 percent from the end of 2007 to the end of 2016 (see figure 8). Considering the inflation differentials between China and the United States over the past nine years, the real exchange rate of the renminbi against the US dollar appreciated by close to 20 percent.
Spillover Effects of the United States’ New Economic Policy on the Renminbi Exchange Rate
Tax cuts and infrastructure spending are the most eye-catching parts of the new US government’s fiscal vision. The market expects that fiscal expansion will accelerate the US economic growth, stimulate consump-tion, investment, and commodity prices, and realize “re-inflation” which will prompt the Fed to raise inter-est rates. The current market performance has fully reflected the positive expectations for future fiscal policy. If the fiscal stimulus is fulfilled, US economic growth will accelerate and inflation will rise, pushing up the dollar and adding depreciation pressure on other currencies including the renminbi (figure 12).
However, heavy US government debt burden restricts further expansion of the fiscal deficit, and the high-income class will benefit more from the proposed tax cuts. Therefore, the final fiscal policy adopted by the Congress may not meet market expectations. By then, market sentiment for the dollar would be reversed. Even if the new government keeps its fiscal stimulus promises, it could weaken the dollar in the medium to the long term as a result of the deterioration of the fiscal deficit (figure 13).
Now we turn to the potential impact of trade policy on the exchange rate. Viewed simply from the relationship between trade deficit and the dollar index, the dollar index will meet devaluation pressure if the trade deficit continues to expand. But when the trade deficit grows, the United States often seeks currency

51
–0.2
–0.1
0.0
0.1
0.2
0.3
0.4
0.5
88
90
92
94
96
98
100
102
104
Dollar index (left axis)10-year Treasury real yield (right axis)
index percent
Figure 12 US dollar index and 10-year Treasury real yield, 2015–17
Sources: Federal Reserve Bank of St. Louis; Wind database; CF40.
Januar
yFe
bruar
yM
arch
AprilM
ayJu
neJu
lyAugust
Septe
mber
October
Novem
berDece
mber
Januar
yFe
bruar
yM
arch
AprilM
ayJu
neJu
lyAugust
Septe
mber
October
Novem
berDece
mber
Januar
yFe
bruar
y
2015 2016 2017
70
80
90
100
110
120
130
140
150
160
–5
0
5
10
15
20
1982 1986 1990 1994 1998 2002 2006 2010 2014 2018
Direct effect Indirect effect Deficit ratio Dollar index (right axis)
Figure 13 Effect of Trump administration policies on US fiscal deficit, 1982–2020
Note: Direct effect refers positive correlation between the dollar index and the fiscal deficit; indirect effect refers negative correlation between the dollar index and the fiscal deficit.Sources: Urban-Brookings Tax Policy Center; Wind database; CF40.
percent index
52
appreciation of its major deficit source countries through political means. Since the US government transi-tion, the new government has repeatedly threatened to declare several major trade deficit source economies to be “currency manipulators,” including China, Germany, Japan, and South Korea. Under the current legal framework of international trade, if a country is declared a currency manipulator by the United States, the United States can take unilateral sanctions including imposing punitive tariffs and import quotas on key imports. Recently, the United States announced that it would not label China a currency manipula-tor. However, it is said that the United States is considering substituting the “currency manipulation” approach with the “exchange rate misalignment” approach in assessing whether the currencies of its major trading partners deviate from their normal valuation range, even if they are not undervalued or manipulated. The definition of exchange rate misalignment is clearly broader than currency manipulation. Using this approach may trigger more trade frictions. If a currency is deemed as misaligned, the United States may use anti-dumping and countervailing measures in unilateral trade sanctions.
President Trump favors a weak dollar, which could enhance the competitiveness of US companies and products. Drawing on experience, it is still possible that the United States will force trade deficit source economies to make concessions on exchange rates through political means. If the United States and other economies fail to reach agreement on the exchange rate issue, and comprehensive trade protection measures are implemented, capital will flow back to the United States in the short term and push up the dollar.
NEW THINKING ON THE CHINA–US EXCHANGE RATE RELATIONSHIP
Correctly Interpret the Role of Exchange Rates in the International Monetary System
The adoption of market-based exchange rate regime is a general trend in the world’s major economies. However, the biggest problem with the floating exchange rate remains procyclical exchange rate overshoot-ing, which may lead to resource misallocation and efficiency losses and hinder national macro-control. From the perspective of China and the United States, the current pressure on the renminbi exchange rate is not welcome. The exchange rate relationship among the world’s major currencies requires effective communica-tion and coordination rather than imposition of unilateralism. China is willing to cooperate with the United States to strengthen the coordination of exchange rate policies under the premise of gradual market-based renminbi exchange rate reform. Meanwhile, it should be noted that the exchange rate is a policy tool mainly affecting trade aggregates, it should not be used to solve bilateral trade imbalances.
Strengthen Coordination of National Macroeconomic Policies to Prevent Disorderly Fluctuation of Exchange Rates
A market-based exchange rate is mainly determined by two factors, i.e., the difference in the rate of return on assets among economies and the changes in risk appetite, both of which are closely related to changes in macroeconomic policies. Therefore, only through comprehensive coordination of financial and monetary policy among major economies can the exchange rate fluctuations in the international market be smoothed out. Policy coordination to reduce savings and promote consumption in China while reducing consump-tion and promoting savings in the United States is needed to fundamentally solve the trade imbalance problem. In addition, the disorderly fluctuation of exchange rates reflects huge amount of short-term capital flows driven by market sentiment. This requires coordinated supervision of cross-border capital flows by both outflow and inflow countries.
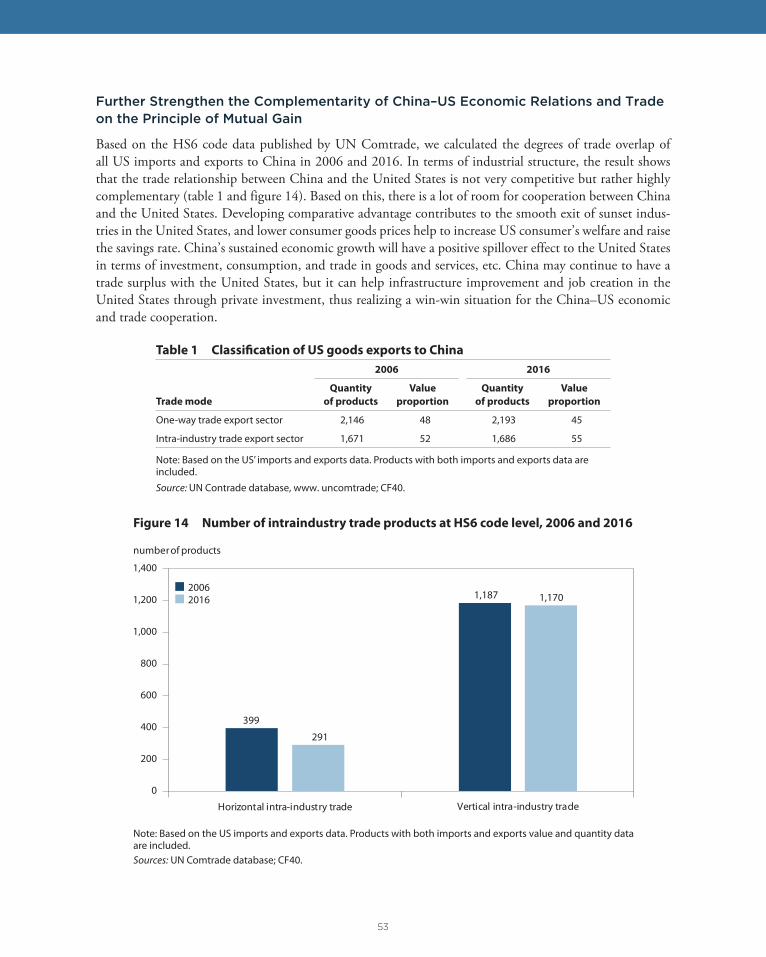
53
Further Strengthen the Complementarity of China–US Economic Relations and Trade on the Principle of Mutual Gain
Based on the HS6 code data published by UN Comtrade, we calculated the degrees of trade overlap of all US imports and exports to China in 2006 and 2016. In terms of industrial structure, the result shows that the trade relationship between China and the United States is not very competitive but rather highly complementary (table 1 and figure 14). Based on this, there is a lot of room for cooperation between China and the United States. Developing comparative advantage contributes to the smooth exit of sunset indus-tries in the United States, and lower consumer goods prices help to increase US consum er’s welfare and raise the savings rate. China’s sustained economic growth will have a positive spillover effect to the United States in terms of investment, consumption, and trade in goods and services, etc. China may continue to have a trade surplus with the United States, but it can help infrastructure improvement and job creation in the United States through private investment, thus realizing a win-win situation for the China–US economic and trade cooperation.
Table 1 Classification of US goods exports to China
Trade mode
2006 2016
Quantity
of products
Value
proportion
Quantity
of products
Value
proportion
One-way trade export sector 2,146 48 2,193 45
Intra-industry trade export sector 1,671 52 1,686 55
Note: Based on the US’ imports and exports data. Products with both imports and exports data are included.Source: UN Contrade database, www. uncomtrade; CF40.
Figure 14 Number of intraindustry trade products at HS6 code level, 2006 and 2016
Note: Based on the US imports and exports data. Products with both imports and exports value and quantity data are included.Sources: UN Comtrade database; CF40.
399
1,187
291
1,170
0
200
400
600
800
1,000
1,200
1,400
Horizontal intra-industry trade Vertical intra-industry trade
20062016
number of products
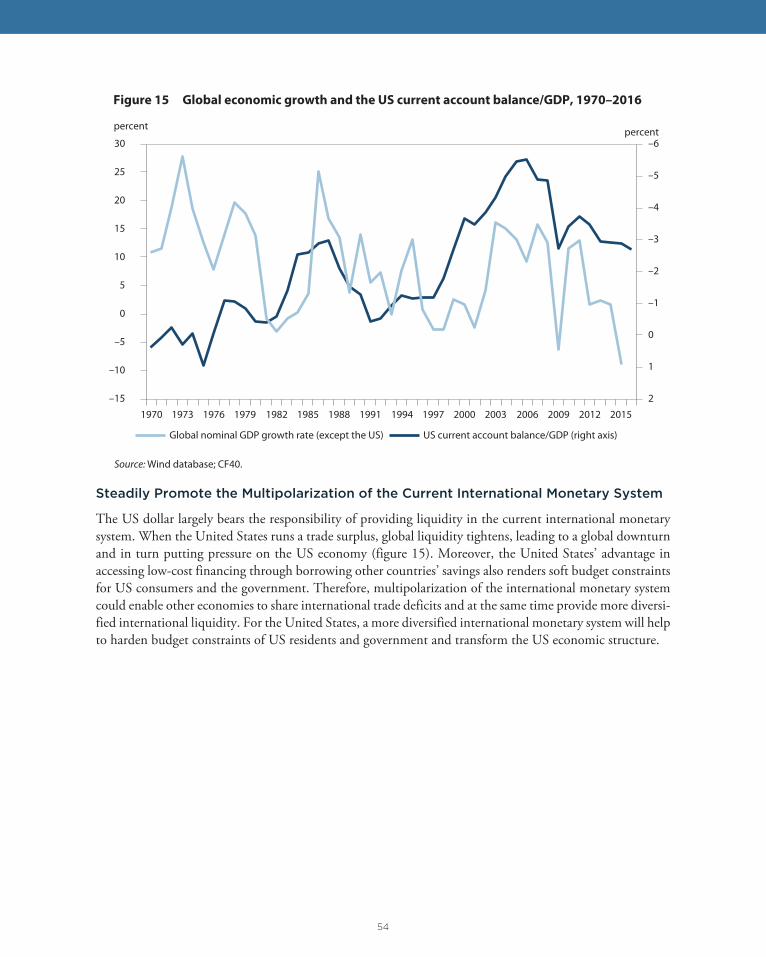
54
Steadily Promote the Multipolarization of the Current International Monetary System
The US dollar largely bears the responsibility of providing liquidity in the current international monetary system. When the United States runs a trade surplus, global liquidity tightens, leading to a global downturn and in turn putting pressure on the US economy (figure 15). Moreover, the United States’ advantage in accessing low-cost financing through borrowing other countries’ savings also renders soft budget constraints for US consumers and the government. Therefore, multipolarization of the international monetary system could enable other economies to share international trade deficits and at the same time provide more diversi-fied international liquidity. For the United States, a more diversified international monetary system will help to harden budget constraints of US residents and government and transform the US economic structure.
–6
–5
–4
–3
–2
–1
0
1
2–15
–10
–5
0
5
10
15
20
25
30
Global nominal GDP growth rate (except the US) US current account balance/GDP (right axis)
percent percent
Figure 15 Global economic growth and the US current account balance/GDP, 1970–2016
Source: Wind database; CF40.
1970 1973 1976 1979 1982 1985 1988 1991 1994 1997 2000 2003 2006 2009 2012 2015
55
CHAPTER 6
A Stability-Oriented Exchange Rate Policy for ChinaJoseph E. Gagnon
From 1995 through 2014, China managed its exchange rate in terms of the US dollar, alternating between periods of extreme stability and periods of controlled but slightly variable appreciation (the solid line in figure 1). Beginning in 2015, China allowed its currency to depreciate against the dollar, which may reflect a new focus on a broader measure of the exchange rate. The JPMorgan real effective exchange rate (REER) for China (the dashed line in figure 1) has depreciated since late 2015, but that may be viewed as reversing upward spike in 2014–15 and returning to the upward trendline that had emerged in 2010–13.1 In terms of the dollar, China has depreciated substantially since 2015, but then so have most other currencies.
The REER is a better measure of the exchange rate for economic policy than the bilateral dollar rate. But it does not follow that stabilizing the REER is the best policy. A better approach for China would be to focus its external policy on the economically more important objective of stabilizing the current account balance while keeping monetary policy focused on stabilizing inflation and employment.
FOCUS ON IMBALANCES: A REFERENCE RATE APPROACH
China’s REER exhibits a clear appreciation trend over the past 20 years. As long as China’s productivity growth is faster than that in the rest of the world, continued appreciation is likely to be required. As China’s productivity growth slows, the trend pace of real appreciation will also likely decline, but it is difficult to estimate this relationship precisely. Also, it is possible that measures to open up the Chinese economy, including by reducing barriers to imports of goods and services, would temporarily reverse the REER appre-ciation trend.2
Rather than focus on the exchange rate per se, the People’s Bank of China should focus on the ultimate goal of exchange rate policy, which is the stability and sustainability of the current account balance. The exchange rate is uniquely salient in the eyes of the public, which is why it is often chosen as a policy target.
1. There are other measures of China’s REER. Use of the JP Morgan REER in this paper in no way implies thatit is the preferred measure.
2. Standard economic theory argues that trade barriers cause a country’s exchange rate to appreciate.
Joseph E. Gagnon is senior fellow at the Peterson Institute for International Economics.
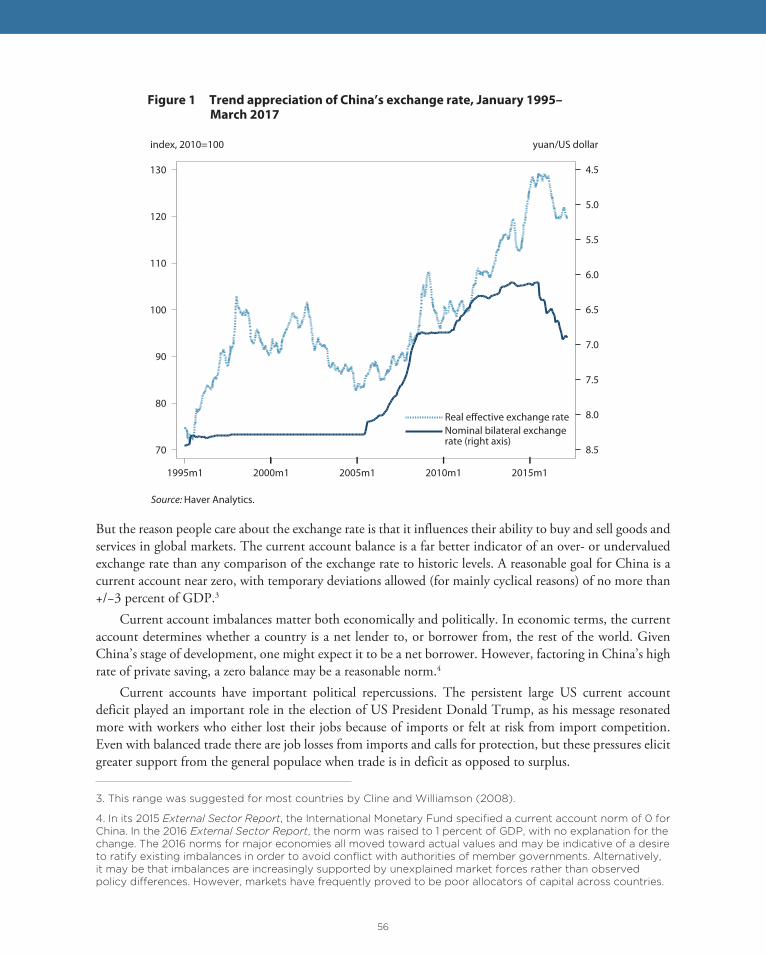
56
But the reason people care about the exchange rate is that it influences their ability to buy and sell goods and services in global markets. The current account balance is a far better indicator of an over- or undervalued exchange rate than any comparison of the exchange rate to historic levels. A reasonable goal for China is a current account near zero, with temporary deviations allowed (for mainly cyclical reasons) of no more than +/−3 percent of GDP.3
Current account imbalances matter both economically and politically. In economic terms, the current account determines whether a country is a net lender to, or borrower from, the rest of the world. Given China’s stage of development, one might expect it to be a net borrower. However, factoring in China’s high rate of private saving, a zero balance may be a reasonable norm.4
Current accounts have important political repercussions. The persistent large US current account deficit played an important role in the election of US President Donald Trump, as his message resonated more with workers who either lost their jobs because of imports or felt at risk from import competition. Even with balanced trade there are job losses from imports and calls for protection, but these pressures elicit greater support from the general populace when trade is in deficit as opposed to surplus.
3. This range was suggested for most countries by Cline and Williamson (2008).
4. In its 2015 External Sector Report, the International Monetary Fund specifi ed a current account norm of 0 forChina. In the 2016 External Sector Report, the norm was raised to 1 percent of GDP, with no explanation for thechange. The 2016 norms for major economies all moved toward actual values and may be indicative of a desireto ratify existing imbalances in order to avoid confl ict with authorities of member governments. Alternatively,it may be that imbalances are increasingly supported by unexplained market forces rather than observedpolicy diff erences. However, markets have frequently proved to be poor allocators of capital across countries.
4.5
5.0
5.5
6.0
6.5
7.0
7.5
8.0
8.5
yuan/US dollar
70
80
90
100
110
120
130
index, 2010=100
1995m1 2000m1 2005m1 2010m1 2015m1
Real effective exchange rateNominal bilateral exchange rate (right axis)
Figure 1 Trend appreciation of China’s exchange rate, January 1995–March 2017
Source: Haver Analytics.

57
Figure 2 shows that current account imbalances of the major economies peaked about 10 years ago and then narrowed sharply during the Great Recession. They were moderately large and stable for a few years, but now appear to be widening again. If it were not for the sharp decline in oil prices, the widening of the US deficit in 2015 and 2016 would be even more apparent, and it is likely to become more apparent over the next two years given the lagged effects of recent dollar appreciation (Cline 2016).5 Despite the fall in commodity prices, which should have boosted its current account, China’s surplus fell in 2016.6 Thus, China is not contributing to the rewidening of global imbalances. The euro area has been a more important factor in recent years.
The effect of the REER on China’s current account is very clear, especially when one allows for the normal two-year lag. A trend rise in the REER from 1995 through 2002 was associated with a small and stable current account, as shown in figure 2 (the red portion of the bars). The decline in the REER from 2002 through 2005 led to record current account surpluses in 2005–07. The appreciation since 2005 has returned the current account surplus to less than 3 percent of GDP, although the absolute dollar amounts shown in figure 2 did not decline as much because the size of China’s GDP has grown so rapidly. Some analysts have argued that increasingly integrated global supply chains, in which China is a key player, reduce the effect of exchange rates on trade imbalances. Recent research at the International Monetary Fund (IMF) finds little evidence of any change in the overall effects of exchange rates (Leigh et al. 2017).
5. In its April 2017 forecast, the IMF projected only a modest widening of the US defi cit, but the IMF histori-cally has failed to project widening imbalances.
6. Brad Setser suggests that recent changes in statistical techniques overstate Chinese tourism imports. Buteven a generous correction would not put China’s 2016 current account above 3 percent of GDP. See “China’sConfusing Trade and Current Account Numbers,” April 4, 2017, http://blogs.cfr.org/setser/2017/04/04/chinas-confusing-trade-and-current-account-numbers/#more-8371 (accessed on May 8, 2017).
−1,000
−500
0
500
1,000
billions of US dollars
1995 2005 2015
United States ChinaJapan Euro Area
Figure 2 Current account imbalances widening again, 1995–2016
Sources: IMF, World Economic Outlook database; Haver Analytics for 2016 observation.

58
As issuer of one of the world’s reserve currencies, China should allow its exchange rate to float freely. However, that does not require accepting unlimited volatility in either the exchange rate or the current account balance. The right approach is the reference rate strategy first proposed by John Williamson (2007, 2016).
Figure 3 displays how reference rates would operate, placed in the context of China’s historical current account balance. The long-run target balance is 0, with cyclical deviations of as much as +/−3 percent of GDP allowed, as shown by the dashed lines. When the current account is above 3 percent of GDP, purchas-es of foreign exchange (FX) are not allowed and sales are encouraged.7 When the current account is between 0 and 3 percent of GDP, purchases would be discouraged but not absolutely prohibited and sales would still be encouraged, albeit less strongly as the current account approaches 0. Symmetrical rules apply when the current account is below 0, as displayed in the figure. For simplicity, these rules have been specified in terms of the contemporaneous current account, but ideally they should be cast in terms of the projection of the current account up to two years ahead.
It is important to stress that a reference rate system implies absolutely no restrictions on the level of the exchange rate. It is merely a set of guideposts for when and in what direction to conduct foreign exchange intervention. The key point is that intervention should always lean against excessive current account imbal-ances. In so doing, intervention helps to minimize imbalances. Recent research documents the important effect of foreign exchange intervention on the current account (Gagnon et al. 2017).
7. Reserve sales would not be encouraged if a country’s reserves were below a minimum adequate level. Aminimum level for China is discussed in the next section.
FX purchases not allowed
FX sales encouraged
FX sales encouraged, purchases discouraged
FX purchases encouraged, sales discouraged
FX sales not allowed
FX purchases encouraged
Current account balance
−6
−3
0
3
6
9
12
percent of GDP
1995 2000 2005 2010 2015
Figure 3 A reference rate strategy for China, 1995–2016
FX = foreign exchangeSources: IMF, World Economic Outlook database; Haver Analytics; and author’s illustration.
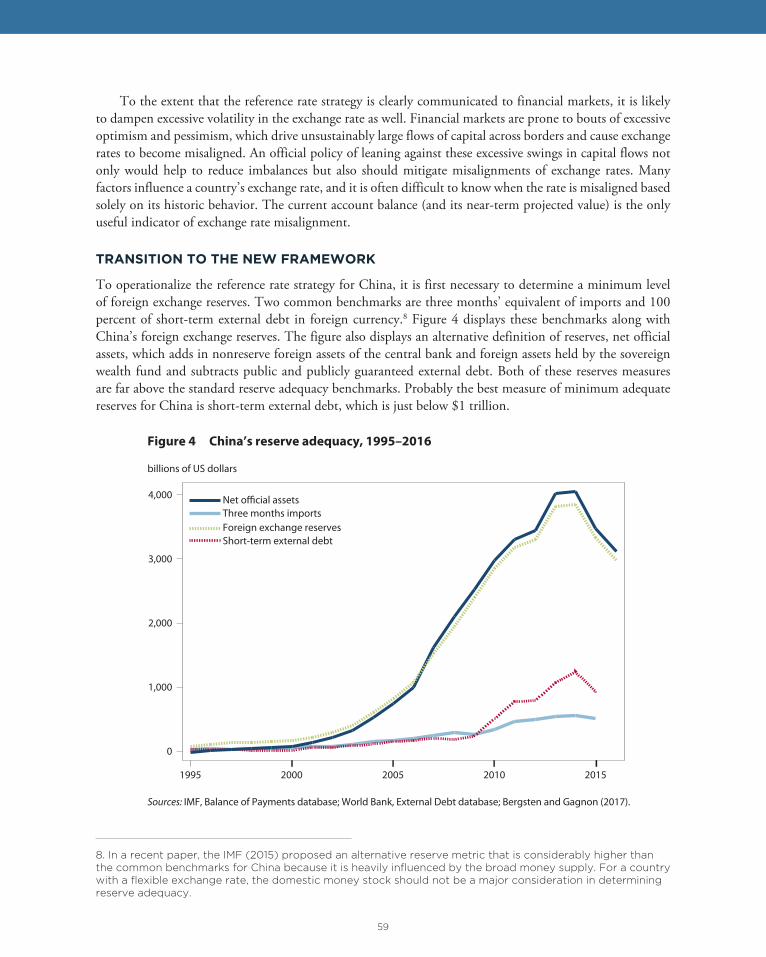
59
To the extent that the reference rate strategy is clearly communicated to financial markets, it is likely to dampen excessive volatility in the exchange rate as well. Financial markets are prone to bouts of excessive optimism and pessimism, which drive unsustainably large flows of capital across borders and cause exchange rates to become misaligned. An official policy of leaning against these excessive swings in capital flows not only would help to reduce imbalances but also should mitigate misalignments of exchange rates. Many factors influence a country’s exchange rate, and it is often difficult to know when the rate is misaligned based solely on its historic behavior. The current account balance (and its near-term projected value) is the only useful indicator of exchange rate misalignment.
TRANSITION TO THE NEW FRAMEWORK
To operationalize the reference rate strategy for China, it is first necessary to determine a minimum level of foreign exchange reserves. Two common benchmarks are three months’ equivalent of imports and 100 percent of short-term external debt in foreign currency.8 Figure 4 displays these benchmarks along with China’s foreign exchange reserves. The figure also displays an alternative definition of reserves, net official assets, which adds in nonreserve foreign assets of the central bank and foreign assets held by the sovereign wealth fund and subtracts public and publicly guaranteed external debt. Both of these reserves measures are far above the standard reserve adequacy benchmarks. Probably the best measure of minimum adequate reserves for China is short-term external debt, which is just below $1 trillion.
8. In a recent paper, the IMF (2015) proposed an alternative reserve metric that is considerably higher thanthe common benchmarks for China because it is heavily infl uenced by the broad money supply. For a countrywith a fl exible exchange rate, the domestic money stock should not be a major consideration in determiningreserve adequacy.
0
1,000
2,000
3,000
4,000
billions of US dollars
1995 2000 2005 2010 2015
Net official assets
Foreign exchange reservesThree months imports
Short-term external debt
Figure 4 China’s reserve adequacy, 1995–2016
Sources: IMF, Balance of Payments database; World Bank, External Debt database; Bergsten and Gagnon (2017).
60
Going forward, China should resist downward pressure on the REER by selling foreign exchange reserves as long as reserves exceed about $1 trillion and the current account is projected to remain in surplus. As reserves approach $1 trillion, some combination of REER depreciation and reserve sales should be employed. Below $1 trillion, the REER should be allowed to depreciate freely. Any upward pressure on the REER should not be resisted, unless the current account is likely to become negative within two years or reserves are below $1 trillion. The trend of the REER is likely to remain upward as long as productivity grows faster in China than elsewhere.
It has been widely reported that Chinese authorities tightened restrictions on capital outflows, or at least enforced existing restrictions more vigorously, after August 2015. In the long run, China should open its capital markets. But it is best to move slowly, with a higher priority placed on improving financial supervi-sion and regulation and liberalizing domestic markets. As long as the renminbi is part of the IMF’s Special Drawing Rights (SDR) basket, reflecting China’s desire to make the renminbi an international reserve currency, one step that should not be reversed is the opening of China’s bond market to foreign investors.
Some might argue that a reference rate strategy cannot work in an economy with independent mone-tary policy and open capital markets. This conclusion holds true in a model with efficient capital markets. In reality, however, financial markets are not efficient. Research shows that sterilized foreign exchange inter-vention is more powerful in the presence of capital account restrictions, but even in economies with no legal restrictions on capital flows, intervention retains an important effect (Gagnon et al. 2017). For example, Switzerland, with a fully open capital account, has intervened massively in foreign exchange markets to retain a large current account surplus over the past eight years (Bergsten and Gagnon 2017).
THE CURRENT SITUATION
In the context of the current global imbalances, China is the only major economy whose currency policy is actively consistent with a reference rate strategy. The euro area, Japan, the United Kingdom, and the United States are not actively intervening and thus are not in conflict with a reference rate strategy. But the surpluses of the euro area and Japan, at 3.4 and 3.9 percent of GDP, respectively, in 2016, are in a range where sales of foreign exchange would be strongly encouraged to support the values of the euro and the yen.9 The United Kingdom and the United States, with current account deficits, would be encouraged to buy foreign exchange to weaken their currencies.10
The very high rates of saving and investment in China pose major risks for China and the global economy. A collapse of investment could cause a recession in China and widen its current account surplus. The spillover to the rest of the world would be even greater if the recession were associated with an abrupt depreciation of the exchange rate. The rebalancing of China’s economy is proceeding too slowly. To reduce excessive and unsustainable saving and investment, consumption should be encouraged to grow even more rapidly than it has over the past few years.
Research shows that public spending on social safety nets (in health and education) has an enormous positive effect on consumption—at least 50 cents and as much as a dollar per dollar spent—even when the spending is fully financed by tax increases (IMF 2012, Gagnon 2013). Expanding household consumption by improving the social safety net would be a win-win policy for the entire world. In China, it would reduce the buildup of risky investment, raise household living standards, and reduce the country’s trade surplus with the rest of the world.
9. Data are from the IMF’s World Economic Outlook database, April 2017.
10. The UK defi cit is greater than −3 percent of GDP, but the depreciation of the pound since June 2016 sug-gests that it may narrow somewhat over the next year or so.

61
CONCLUSION
China’s policymakers clearly value economic stability. However, stability of the exchange rate—whether measured bilaterally against the US dollar or on a trade-weighted basis—will not deliver stability in China’s external balance, which is fundamentally more important. A better approach for China would be to focus its external policy (foreign exchange intervention) on the objective of stabilizing the current account balance, while keeping monetary policy (interest rates and money supply) focused on stabilizing inflation and employment with some help from fiscal policy. Structural reforms to reduce excessive saving are also essen-tial. Liberalization of international capital flows is desirable in the long run, but should not take precedence over domestic financial reforms.
A reference rate strategy with a norm of zero for the current account balance is a good framework. Accordingly, China would not buy foreign exchange reserves when its current account balance exceeds 3 percent of GDP and it would not sell them when its current account falls below −3 percent of GDP. It would be encouraged to sell reserves when its current account balance is above 0 and buy them when the balance is below 0. Although not targeted at exchange rate stabilization per se, a reference rate strategy is likely to deliver a meaningful reduction in exchange rate volatility.
REFERENCESBergsten, C. Fred, and Joseph E. Gagnon. 2017. Currency Conflict and Trade Policy: A New Strategy for the United States. Washington: Peterson Institute for International Economics.
Cline, William R. 2016. Estimates of Fundamental Equilibrium Exchange Rates, November 2016. PIIE Policy Brief 16-22. Washington: Peterson Institute for International Economic.
Cline, William, and John Williamson. 2008. New Estimates of Fundamental Equilibrium Exchange Rates. PIIE Policy Brief 08-7. Washington: Peterson Institute for International Economics.
Gagnon, Joseph E. 2013. The Elephant Hiding in the Room: Currency Intervention and Trade Imbalances. PIIE Working Paper 13-2. Washington: Peterson Institute for International Economics.
Gagnon, Joseph, Tamim Bayoumi, Juan M. Londoño, Christian Saborowski, and Horacio Sapriza. 2017. Direct and Spillover Effects of Unconventional Monetary and Exchange Rate Policies. Open Economies Review 28: 191–232.
IMF (International Monetary Fund). 2012. External Balance Assessment (EBA): Technical Background of the Pilot Methodology (August 3). Washington.
IMF (International Monetary Fund). 2015. Assessing Reserve Adequacy—Specific Proposals (April). Washington.
Leigh, Daniel, Weicheng Lian, Marcos Poplawski-Ribeiro, Rachel Szymanski, Viktor Tsyrennikov, and Hong Yang. 2017. Exchange Rates and Trade: A Disconnect? IMF Working Paper No. WP/17/58. Washington: Inter-national Monetary Fund.
Williamson, John. 2007. Reference Rates and the International Monetary System. Policy Analysis in Interna-tional Economics 82. Washington: Peterson Institute for International Economics.
Williamson, John. 2016. International Monetary Reform: A Specific Set of Proposals. London: Routledge.
62
CHAPTER 7
The United States at a Crossroads: G-20 Cooperation and theInternational Financial ArchitectureNathan Sheets
Previous US administrations, both Republican and Democrat, have held the view that US participation and leadership within the international financial architecture is in the United States’ interest. For example, in some areas, such as financial regulation, international linkages make cooperation imperative. For other challenges, such as combating terrorist financing, collaborative global action provides a clear and desirable moral force. US leadership helps ensure that global resources and international policy initiatives are geared in ways that are beneficial domestically, as well as internationally.
In this context, this essay considers recent US involvement in two important international groups—the Group of Twenty (G-20) and the Financial Stability Board (which itself is a creation of the G-20 leaders). The United States has played a key role in both of these bodies since their inception. These groups have notched important achievements, and benefits have flowed to the US economy as a result.
Through the G-20, the United States has worked to promote dynamic and sustained economic growth around the world. As the global economy has typically fallen short of this objective in the years since the financial crisis, the United States has used the G-20 as a platform to encourage other countries to pursue the strong policies required to support growth. In addition, recent discussions have focused on the need to ensure that the benefits from growth are shared inclusively across society. The United States has also pressed in the G-20 for fair and responsible currency practices in countries around the world, reforms to the international financial institutions (IFIs) to ensure that they remain effective, and an increased role for the emerging market economies within the international architecture, commensurate with their expanding economic significance.
Similarly, the Financial Stability Board (FSB) has provided a framework to encourage other jurisdic-tions—including some that might have otherwise been reluctant to do so—to strengthen their regulatory regimes in line with similar steps taken in the United States. US participants have sought agreement on global regulatory standards that are broadly compatible with those in the United States. The benefits of this
Nathan Sheets is visiting fellow at the Peterson Institute for International Economics.

63
are significant, including reduced scope for regulatory arbitrage across jurisdictions and a more level playing field for global institutions. In addition, the risk of foreign financial turmoil is lower, and the US economy is better protected from such spillovers.
The Trump administration faces important decisions in the months ahead as it defines the nature and extent of US participation within the global economic architecture (see Truman 2017). These decisions can be classified into two categories. First, does the administration support the broad thrust of the policies that have been pursued in these bodies? Such policies have included openness to trade and capital flows, a commitment to supporting and strengthening the IFIs, and a desire to calibrate financial regulation as consistently as possible across jurisdictions. Second, apart from the first question, will the administration continue to devote resources to supporting and participating actively in these bodies?
The administration’s eventual answers to these questions will determine the extent of US economic leadership in the years ahead and also have important implications for the coherence and effectiveness of the international system. Whatever positions the administration eventually adopts, these international bodies can serve as a valuable venue for US policymakers to explain their thinking, describe the stance of their poli-cies, and seek understanding with foreign counterparts.
THE US ROLE IN THE G-20
An established objective of the G-20 is fostering strong, sustainable, balanced, and inclusive global growth. This requires promoting economic resilience, openness, and a level global playing field for workers and firms. Resilience means bolstering the sustainability of growth, the strength of key institutions, and the stability of global financial markets, in order to reduce the frequency of crises while limiting their intensity if they do occur. Openness means that goods and capital are free to flow across borders to their most produc-tive uses. And a level playing field allows companies and workers around the world to compete on equal footing and helps mitigate potentially destabilizing imbalances.
Robust global economic performance requires that all countries play by a common set of rules, includ-ing for trade, exchange rate policies, and financial regulatory standards.
Seeking Strong Global Growth. There is agreement among the G-20 countries, which jointly account for 85 percent of global output, that their collective growth performance has fallen short of reasonable expecta-tions. But countries have differing views as to what policies can most effectively address the ongoing chal-lenges. Such challenges include high unemployment in too many countries, lagging middle-class income growth, and sluggish increases in productivity.
In response, the United States has consistently advocated that countries like Germany, Korea, and Japan, with large amounts of excess saving and current account surpluses, should take steps to support stronger national and global demand—including through carefully calibrated, stimulative fiscal policies. And China should employ consumption‐friendly fiscal stimulus if its growth slows more than expected.
Through the G-20, the United States has worked with counterparts to build consensus on the need for collective action. For example, in advance of the G-20 meeting in Shanghai in February 2016, global markets were jittery due to concerns about China’s economic transition and the prospects for global growth. In the run-up to that meeting, US officials worked with key partners, particularly China (then the G-20 Chair) and Germany, to construct a package of measures that would highlight the G-20’s joint commitment to preserve stability.
In the communique that followed the Shanghai meeting, G‐20 Finance Ministers and Central Bank Governors for the first time committed to use all policy tools—monetary, fiscal, and structural—to energize
64
the global economy.1 This outcome, which was in contrast to the fiscal austerity that some policymakers had advocated in earlier years, supported an improvement in market conditions in the period after the meeting. The G‐20 leaders subsequently endorsed these policy commitments during their Summit in Hangzhou in September 2016.
There was also strong agreement among the leaders in Hangzhou that the case for free trade and economic integration must be made more convincingly and that the resulting benefits from such policies should be more broadly and inclusively shared. This underscores the importance of efforts to strengthen educational systems, build infrastructure, and expand access to financial services.
Finally, G-20 countries have long agreed on the benefits of economic and financial openness and the importance of fighting protectionism in all its forms. Expanding trade and investment relationships have been a key driver of global (and US) growth through the post-war era. Notably, however, at the March 2017 Ministers and Governors meeting—the first attended by the Trump Administration—the United States rejected a longstanding G20 pledge to resist protectionism, and countries agreed instead to work “to strengthen the contribution of trade to our economies.”2
While this is a potentially meaningful shift in US policy, many issues regarding trade are still being deliberated inside the White House. Accordingly, the outcome of the March G-20 meeting may—or may not—be a good signal of the administration’s ultimate policy intentions.
Encouraging Fair Currency Practices. Consistent with the objective of achieving a level global playing field, the G-20 has been an increasingly powerful mechanism for encouraging fair and transparent currency practices among its members.
The United States has long believed that countries should not engage in unfair currency practices to gain competitive advantage in their trading relationships. To this end, US leadership in global discussions has helped engineer important commitments to strong exchange rate policies. G‐7 countries have commit-ted to orient fiscal and monetary policies toward domestic objectives and to not target exchange rates. G‐20 countries have committed to refrain from engaging in competitive devaluation and to not target their exchange rates for competitive purposes. And in Shanghai last year, after delicate negotiations, members of the G‐20 also agreed to “consult closely” on exchange markets—an important component of G‐7 commu-niques in the past, but never before included as a G‐20 commitment.
These outcomes drew particularly on the sustained efforts of the US Treasury, which has taken a lead-ership role in these discussions both domestically and internationally. The Treasury’s analyses of foreign exchange practices are detailed in biannual reports to Congress. Beginning in April 2016, Treasury created a “Monitoring List” of major trading partners that merit close attention based on statutorily specified criteria. In the latest Report, published in April, six major US trading partners were included on the Monitoring List: China, Germany, Japan, Korea, Switzerland, and Taiwan.3
Reforming the International Monetary Fund (IMF). In the aftermath of World War II, the global commu-nity, led by the United States, created new international institutions—the IMF and the World Bank—to reduce economic conflicts, avoid beggar-thy-neighbor policies, provide support for countries in crisis or transition, and advance pro-growth economic reforms and policies. Over the years, the United States also played a leading role in the regional development banks in Latin America, Asia, Africa, and Europe.
1. See http://www.g20.utoronto.ca/2016/160227-fi nance-en.html.
2. See http://www.g20.utoronto.ca/2017/170318-fi nance-en.html.
3. See www.treasury.gov/resource-center/international/exchange-rate-policies/Documents/2017-04-14-Spring-2017-FX-Report-FINAL.PDF.
65
The partnership between the United States and this constellation of IFIs has continued with the support of administrations from both parties, as these institutions have proven their worth by supporting global growth and development.
As a group consisting of the world’s largest advanced and emerging market economies, the G-20 has played a central role in helping to govern the IMF and the other IFIs. In 2010 the G-20 put forward a set of IMF quota and governance reforms. These reforms were designed to strengthen the finances of the IMF and to give a greater voice to dynamic emerging markets, such as Brazil, China, India and Mexico, while preserving the US veto by a comfortable margin. In December 2015, after a prolonged delay, the US Congress approved these reforms.
Given that the United States is the Fund’s largest shareholder and the only member with veto power over major IMF decisions, this extended delay in approving the reforms led our international partners to question the US commitment to the multilateral system. In response, some countries—including China—pursued their interests in other ways, including by creating new institutions, such as the New Development Bank (known as the BRICs bank) and the Asian Infrastructure Investment Bank (AIIB).
The interest in reforming and strengthening the Fund is not based on esoteric notions of global leader-ship or nostalgia for institutions that the United States created. Rather, hard-won experience teaches that a well-resourced and effective IMF is indispensable to achieving economic and national security interests. By stemming crises in other countries and preventing those crises from spreading, the IMF fosters economic growth and trade around the world, with resulting dividends for US growth and employment.4
Expanding the Paris Club. The G-20 has also served as a platform to urge emerging-market economies to take on expanded roles and responsibilities in the international system. One example is the collaborative effort to broaden membership in the Paris Club, the premier forum for official sovereign debt restructuring. Many of the emerging market countries have become important international creditors, and it is appropri-ate for them to move beyond their traditional ad hoc participation in Club deliberations and to become full Paris Club members. These efforts have achieved initial success, with Korea and Brazil joining last year. In addition, China and South Africa have increased their engagement and are considering the possibility of full membership. These steps should help to enhance the resilience of the global economy, as having a broad set of creditors—from both advanced and emerging market economies—participate in Club negotiations should allow sovereign debt issues to be dealt with in a more effective and comprehensive manner.
Key Issues Facing the Trump Administration. The new administration has continued US participation in the G-20 and other international bodies. However, the administration’s position on many international economic policies questions remains uncertain. As noted above, at the March G-20 meeting Secretary Mnuchin declined to endorse a longstanding G-20 commitment to resist protectionism. More generally, it remains to be seen where the policies of the administration will land on trade, currencies, and support for the IFIs.
US PARTICIPATION IN THE FINANCIAL STABILITY BOARD
In response to the global financial crisis, there was broad agreement in the United States and globally that financial regulation needed to be more thorough and vigorous. Measures were needed to strengthen finan-cial institutions—by, for example, raising capital and liquidity requirements and more thoroughly assessing their business strategies and risk management practices.
4. For further discussion see Nathan Sheets, “Remarks,” October 2016, www.treasury.gov/press-center/press-releases/Pages/jl0586.aspx.
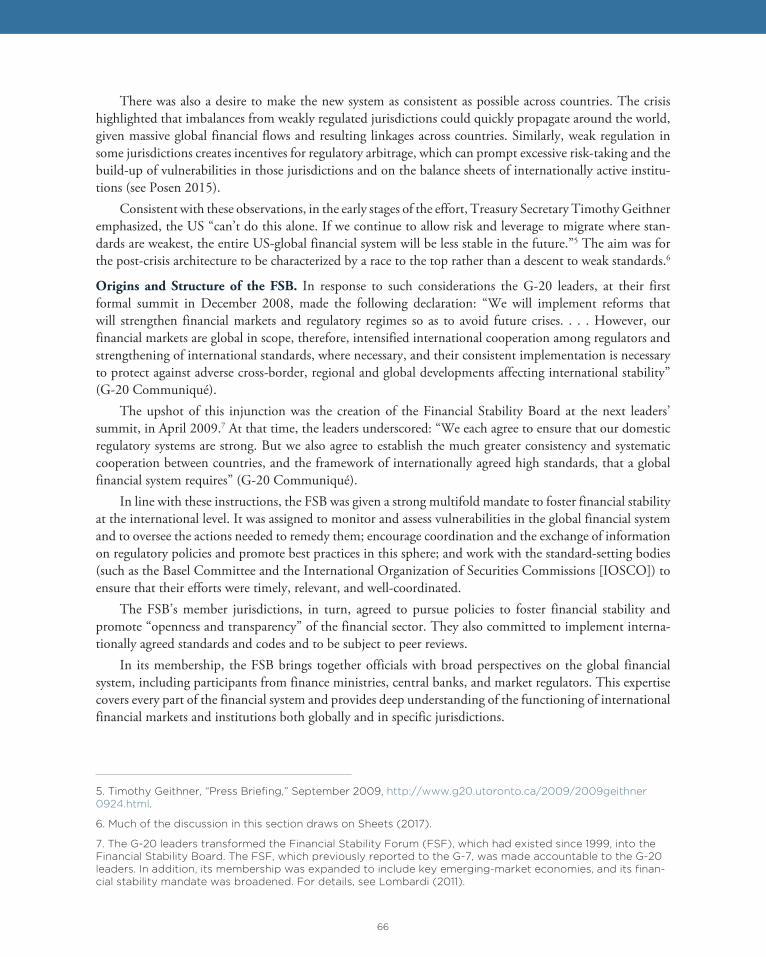
66
There was also a desire to make the new system as consistent as possible across countries. The crisis highlighted that imbalances from weakly regulated jurisdictions could quickly propagate around the world, given massive global financial flows and resulting linkages across countries. Similarly, weak regulation in some jurisdictions creates incentives for regulatory arbitrage, which can prompt excessive risk-taking and the build-up of vulnerabilities in those jurisdictions and on the balance sheets of internationally active institu-tions (see Posen 2015).
Consistent with these observations, in the early stages of the effort, Treasury Secretary Timothy Geithner emphasized, the US “can’t do this alone. If we continue to allow risk and leverage to migrate where stan-dards are weakest, the entire US-global financial system will be less stable in the future.”5 The aim was for the post-crisis architecture to be characterized by a race to the top rather than a descent to weak standards.6
Origins and Structure of the FSB. In response to such considerations the G-20 leaders, at their first formal summit in December 2008, made the following declaration: “We will implement reforms that will strengthen financial markets and regulatory regimes so as to avoid future crises. . . . However, our financial markets are global in scope, therefore, intensified international cooperation among regulators and strengthening of international standards, where necessary, and their consistent implementation is necessary to protect against adverse cross-border, regional and global developments affecting international stability” (G-20 Communiqué).
The upshot of this injunction was the creation of the Financial Stability Board at the next leaders’ summit, in April 2009.7 At that time, the leaders underscored: “We each agree to ensure that our domestic regulatory systems are strong. But we also agree to establish the much greater consistency and systematic cooperation between countries, and the framework of internationally agreed high standards, that a global financial system requires” (G-20 Communiqué).
In line with these instructions, the FSB was given a strong multifold mandate to foster financial stability at the international level. It was assigned to monitor and assess vulnerabilities in the global financial system and to oversee the actions needed to remedy them; encourage coordination and the exchange of information on regulatory policies and promote best practices in this sphere; and work with the standard-setting bodies (such as the Basel Committee and the International Organization of Securities Commissions [IOSCO]) to ensure that their efforts were timely, relevant, and well-coordinated.
The FSB’s member jurisdictions, in turn, agreed to pursue policies to foster financial stability and promote “openness and transparency” of the financial sector. They also committed to implement interna-tionally agreed standards and codes and to be subject to peer reviews.
In its membership, the FSB brings together officials with broad perspectives on the global financial system, including participants from finance ministries, central banks, and market regulators. This expertise covers every part of the financial system and provides deep understanding of the functioning of international financial markets and institutions both globally and in specific jurisdictions.
5. Timothy Geithner, “Press Briefi ng,” September 2009, http://www.g20.utoronto.ca/2009/2009geithner0924.html.
6. Much of the discussion in this section draws on Sheets (2017).
7. The G-20 leaders transformed the Financial Stability Forum (FSF), which had existed since 1999, into theFinancial Stability Board. The FSF, which previously reported to the G-7, was made accountable to the G-20leaders. In addition, its membership was expanded to include key emerging-market economies, and its fi nan-cial stability mandate was broadened. For details, see Lombardi (2011).
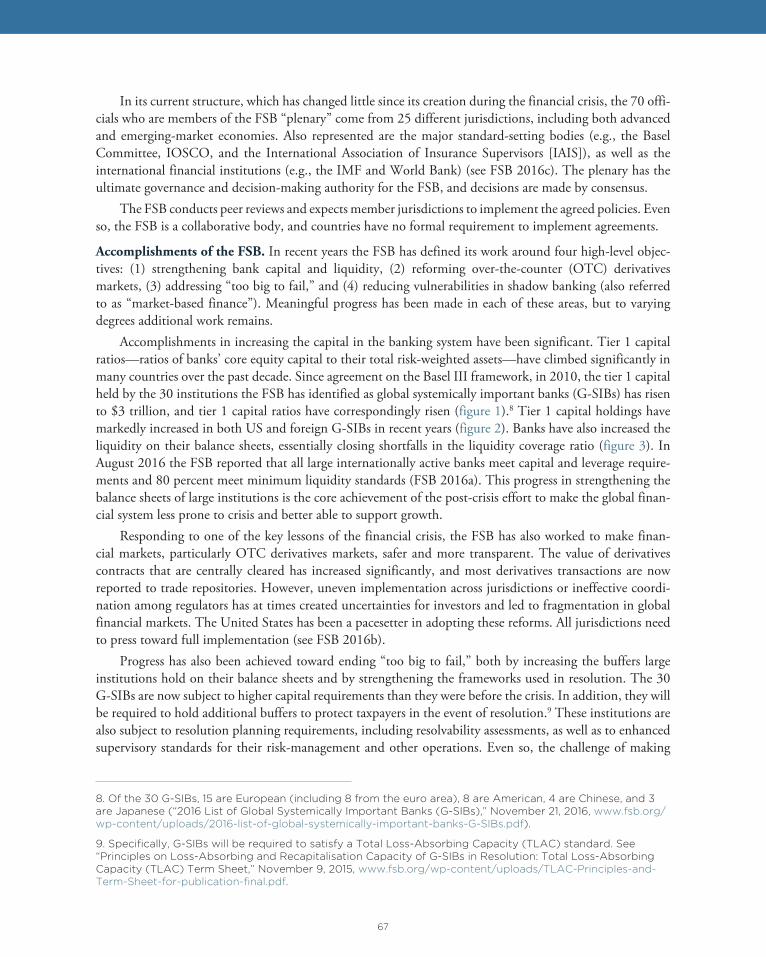
67
In its current structure, which has changed little since its creation during the financial crisis, the 70 offi-cials who are members of the FSB “plenary” come from 25 different jurisdictions, including both advanced and emerging-market economies. Also represented are the major standard-setting bodies (e.g., the Basel Committee, IOSCO, and the International Association of Insurance Supervisors [IAIS]), as well as the international financial institutions (e.g., the IMF and World Bank) (see FSB 2016c). The plenary has the ultimate governance and decision-making authority for the FSB, and decisions are made by consensus.
The FSB conducts peer reviews and expects member jurisdictions to implement the agreed policies. Even so, the FSB is a collaborative body, and countries have no formal requirement to implement agreements.
Accomplishments of the FSB. In recent years the FSB has defined its work around four high-level objec-tives: (1) strengthening bank capital and liquidity, (2) reforming over-the-counter (OTC) derivatives markets, (3) addressing “too big to fail,” and (4) reducing vulnerabilities in shadow banking (also referred to as “market-based finance”). Meaningful progress has been made in each of these areas, but to varying degrees additional work remains.
Accomplishments in increasing the capital in the banking system have been significant. Tier 1 capital ratios—ratios of banks’ core equity capital to their total risk-weighted assets—have climbed significantly in many countries over the past decade. Since agreement on the Basel III framework, in 2010, the tier 1 capital held by the 30 institutions the FSB has identified as global systemically important banks (G-SIBs) has risen to $3 trillion, and tier 1 capital ratios have correspondingly risen (figure 1).8 Tier 1 capital holdings have markedly increased in both US and foreign G-SIBs in recent years (figure 2). Banks have also increased the liquidity on their balance sheets, essentially closing shortfalls in the liquidity coverage ratio (figure 3). In August 2016 the FSB reported that all large internationally active banks meet capital and leverage require-ments and 80 percent meet minimum liquidity standards (FSB 2016a). This progress in strengthening the balance sheets of large institutions is the core achievement of the post-crisis effort to make the global finan-cial system less prone to crisis and better able to support growth.
Responding to one of the key lessons of the financial crisis, the FSB has also worked to make finan-cial markets, particularly OTC derivatives markets, safer and more transparent. The value of derivatives contracts that are centrally cleared has increased significantly, and most derivatives transactions are now reported to trade repositories. However, uneven implementation across jurisdictions or ineffective coordi-nation among regulators has at times created uncertainties for investors and led to fragmentation in global financial markets. The United States has been a pacesetter in adopting these reforms. All jurisdictions need to press toward full implementation (see FSB 2016b).
Progress has also been achieved toward ending “too big to fail,” both by increasing the buffers large institutions hold on their balance sheets and by strengthening the frameworks used in resolution. The 30 G-SIBs are now subject to higher capital requirements than they were before the crisis. In addition, they willbe required to hold additional buffers to protect taxpayers in the event of resolution.9 These institutions arealso subject to resolution planning requirements, including resolvability assessments, as well as to enhancedsupervisory standards for their risk-management and other operations. Even so, the challenge of making
8. Of the 30 G-SIBs, 15 are European (including 8 from the euro area), 8 are American, 4 are Chinese, and 3are Japanese (“2016 List of Global Systemically Important Banks (G-SIBs),” November 21, 2016, www.fsb.org/wp-content/uploads/2016-list-of-global-systemically-important-banks-G-SIBs.pdf).
9. Specifi cally, G-SIBs will be required to satisfy a Total Loss-Absorbing Capacity (TLAC) standard. See“Principles on Loss-Absorbing and Recapitalisation Capacity of G-SIBs in Resolution: Total Loss-AbsorbingCapacity (TLAC) Term Sheet,” November 9, 2015, www.fsb.org/wp-content/uploads/TLAC-Principles-and-Term-Sheet-for-publication-fi nal.pdf.
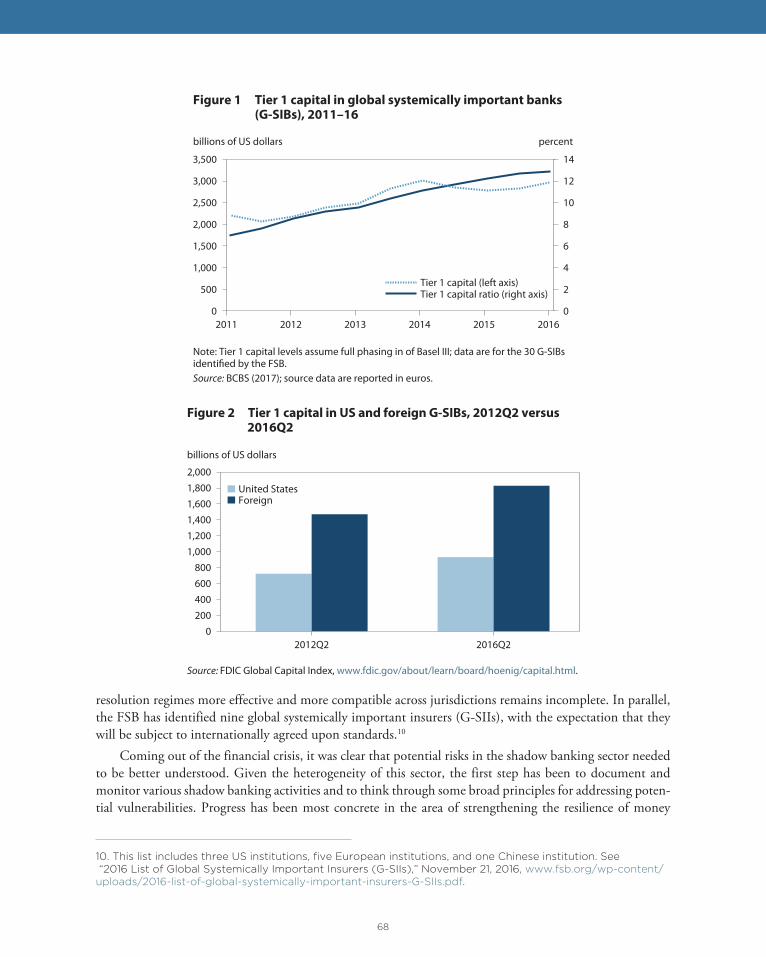
68
resolution regimes more effective and more compatible across jurisdictions remains incomplete. In parallel, the FSB has identified nine global systemically important insurers (G-SIIs), with the expectation that they will be subject to internationally agreed upon standards.10
Coming out of the financial crisis, it was clear that potential risks in the shadow banking sector needed to be better understood. Given the heterogeneity of this sector, the first step has been to document and monitor various shadow banking activities and to think through some broad principles for addressing poten-tial vulnerabilities. Progress has been most concrete in the area of strengthening the resilience of money
10. This list includes three US institutions, fi ve European institutions, and one Chinese institution. See“2016 List of Global Systemically Important Insurers (G-SIIs),” November 21, 2016, www.fsb.org/wp-content/
uploads/2016-list-of-global-systemically-important-insurers-G-SIIs.pdf.
billions of US dollars
0
2
4
6
8
10
12
14
0
500
1,000
1,500
2,000
2,500
3,000
3,500
2011 2012 2013 2014 2015 2016
Tier 1 capital (left axis)Tier 1 capital ratio (right axis)
percent
Figure 1 Tier 1 capital in global systemically important banks (G-SIBs), 2011–16
Note: Tier 1 capital levels assume full phasing in of Basel III; data are for the 30 G-SIBs identified by the FSB.Source: BCBS (2017); source data are reported in euros.
0200400600800
1,0001,2001,4001,6001,8002,000
2012Q2 2016Q2
United StatesForeign
billions of US dollars
Figure 2 Tier 1 capital in US and foreign G-SIBs, 2012Q2 versus 2016Q2
Source: FDIC Global Capital Index, www.fdic.gov/about/learn/board/hoenig/capital.html.
69
market mutual funds. As a related effort, in January 2017 the FSB articulated a set of 14 recommendations designed to address structural vulnerabilities in the asset management sector (FSB 2017).
The FSB continues to face a demanding work agenda. In the year ahead, the FSB is poised to press forward on efforts to complete the final chapter of Basel III (sometimes called “Basel IV”); encourage full implementation of OTC derivatives commitments; and consider ways to further strengthen resolution regimes, including for central counterparties. Work will also continue on potential systemic risks in insur-ance, asset management, and shadow banking, as well as potential new risks to the system, such as from fintech (computer programs and other technology used to support or enable banking and financial services). In sum, the FSB is working mainly on implementing existing initiatives rather than urgently framing new policies. Quite appropriately, there is increased emphasis on evaluating the effects of past and ongoing reforms.
Benefits of FSB Participation. The US Treasury’s read-out of a recent meeting between Secretary Mnuchin and FSB Chair Mark Carney noted that “one of the administration’s core principles for financial regula-tion is to promote American interests in international financial regulatory negotiations and meetings.”11 The evidence at hand indicates that the FSB has satisfied this standard. It has benefited member countries, including the United States, by clearly articulating international best practices and then encouraging FSB members to implement those high standards. The result has been a more transparent and coherent global financial system. In addition, the United States has used the FSB to motivate the rest of the world to adopt stronger standards than would have otherwise been adopted.
Some observers in the United States have argued that the FSB has put US institutions at a disadvantage relative to foreign counterparts.12 But this is not accurate. The work of the FSB has raised standards in the rest of the world, albeit in some instances not as high as those that US regulators have judged necessary to foster financial stability and protect US taxpayers. In those instances, the United States has implemented standards that are “super-equivalent” (i.e., that exceed the minimums articulated by the FSB).
11. See www.treasury.gov/press-center/press-releases/Pages/sm0013.aspx.
12. See, for example, the January 2017 letter from Rep. Patrick McHenry (R-NC) to Federal Reserve ChairJanet Yellen (www.fortune.com/2017/02/03/read-the-full-cease-and-desist-letter-a-senior-congressman-just-sent-to-janet-yellen/).
0
100
200
300
400
500
600
700
800
1.101.121.141.161.181.201.221.241.261.281.30
H22012
H12013
H22013
H12014
H22014
H12015
H22015
H12016
Liquidity coverage ratio shortfall (right axis)Liquidity coverage ratio (left axis)
percent billions of US dollars
Figure 3 Declining liquidity shortfalls in global banks, 2012H2 to 2016H1
Sources: BCBS (2017). Source data are for 82 internationally active banks; reported in euros.

70
More generally, the United States has played a key role in the FSB since its founding in 2009. Secretary Geithner hailed the establishment of the FSB as marking a “fourth pillar” of the international financial architecture along with the IMF, the World Bank, and the World Trade Organization.13 In the years since, US officials have continued to be vigorously engaged in driving the FSB’s agenda.
The FSB, however, does not have a perfect track record. Notwithstanding its strong performance, there is still scope for the group to review the representation of its membership (across both geographic areas and areas of expertise), reflect on its transparency practices, expand its data offerings to the public, and more convincingly document the benefits of the reforms that have been put in place. In addition, the FSB’s work program should remain focused on its core mandate of global financial stability; pressures to stray into other areas should be firmly resisted.
A significant turnover in FSB leadership this year provides an opportunity for a thorough stocktaking, from people inside and outside the FSB. The reforms that are needed are incremental, however. The FSB has served its constituents well.
A CROSSROADS FOR THE UNITED STATES
The Trump administration has brought the United States to a crossroads in terms of its international engagement. Since World War II, administrations of both parties have generally sought to advance global trade and financial integration, nurture the role of the IMF, and work with international counterparts toward making the international system more stable, transparent, and rules-based. Moreover, the advent of the FSB in the years since the global financial crisis has driven a marked strengthening in international financial regulation and regulatory cooperation, and the United States has played a key role in this effort as well. At present, the Trump administration is rethinking the US position on many of these issues. Its eventual policies will have critical implications both for the US role in the world and for the functioning of the overall global system.
The inescapable reality is that the world looks to the United States for leadership. This is true not only because of the size of the US economy and the preeminent role of US financial markets but also because of the quality of ideas, the breadth and intensity of engagement, and the sustained commitment to an economic system that is open, transparent, and resilient. If the United States fails to deliver on these fronts, its capacity to lead will be damaged. The result could very well be that rules and practices in the global economy and financial system move in directions that less effectively serve the interests of the global community, particularly including the interests of the United States.
REFERENCES BCBS (Basel Committee on Banking Supervision). 2017. Basel III Monitoring Report (February). Basel.
FSB (Financial Stability Board). 2016a. Implementation and Effects of the G20 Financial Regulatory Reforms: 2nd Annual Report (August 31). Basel.
FSB (Financial Stability Board). 2016b. OTC Derivatives Market Reforms: Eleventh Progress Report on Imple-mentation (August). Basel.
FSB (Financial Stability Board). 2016c. Third Annual Report: 1 April 2015–31 March 2016. Basel.
FSB (Financial Stability Board). 2017. FSB Publishes Policy Recommendations to Address Structural Vulner-abilities from Asset Management Activities (January). Basel.
13. Timothy Geithner, “Press Briefi ng,” September 2009.

71
Lombardi, Domenico. 2011. The Governance of the Financial Stability Board (September). Washington: Brook-ings Institution.
Posen, Adam. 2015. Testimony Submitted to the Senate Committee on Banking, Housing, and Urban Affairs for Hearing on the Role of the Financial Stability Board in the US Regulatory Framework (July). Washington.
Sheets, Nathan. 2017. Race to the Top: The Case for the Financial Stability Board. PIIE Policy Brief 17-12 (April). Washington: Peterson Institute for International Economics.
Truman, Edwin. 2017. International Financial Cooperation Benefits the United States. PIIE Policy Brief 17-10 (March). Washington: Peterson Institute for International Economics.

72
CHAPTER 8
Thoughts on Overindebtedness from a European PerspectiveNicolas Véron and Jeromin Zettelmeyer
The past decade in Europe provides a treasure trove for observers of overindebtedness and deleveraging. From Iceland to Turkey, from the City of London to the Baltics, and of course in the euro area, there have been numerous episodes of buildup of uncontrolled leverage, official forbearance about unsustainable expo-sures, and painful adjustment. This included the Greek sovereign debt restructuring of March 2012, a credit event according to the International Swaps and Derivatives Association (ISDA) and, as such, the first case of sovereign default in a so-called advanced economy since World War II.
In this paper, we focus on the experience of the euro area crisis, with an emphasis on issues of implicit guarantees, credit risk management, and the connections between banks and governments. In our definition, the euro area crisis includes the whole sequence that starts with turmoil in the financial sector from mid-2007, initially triggered by adverse developments in the US housing markets to which some euro area banks were significantly exposed, then reverberating through various mechanisms to encompass sovereign loss of market access, first in Greece in late 2009–early 2010 and then in other member states as well. While we are aware of the complexity of individual episodes, we view initiatives taken by political leaders and monetary policymak-ers in the summer of 2012 as the key turning point that stopped a dynamic of financial dislocation and started a cycle of stabilization and gradual repair, which is still unfinished at the time of writing.
Accordingly, the paper is structured as follows. Section 1 explores the structural roots of the euro area crisis. Section 2 describes the sequence of financial deterioration from mid-2007 to mid-2012, the summer 2012 turnaround, and the steps taken since toward normalization. Section 3 takes stock of the resulting current policy framework, and assesses the extent to which it addresses the euro area structural vulnerabili-ties exposed by the crisis. Section 4 concludes with a few lessons learned.
1. THE STRUCTURAL ROOTS OF THE EURO AREA CRISIS
The roots of the euro area crisis are to be found in the “great moderation” years that preceded the start of the turmoil, which may be conventionally set in late July–early August 2007 when two real-estate-focused hedge funds backed by Bear Stearns collapsed, the mid-sized German bank IKB was rescued in a hurry,
Nicolas Véron is senior fellow at the Peterson Institute for International Economics and senior fellow at Bruegel. Jeromin Zettelmeyer is senior fellow at the Peterson Institute for International Economics.
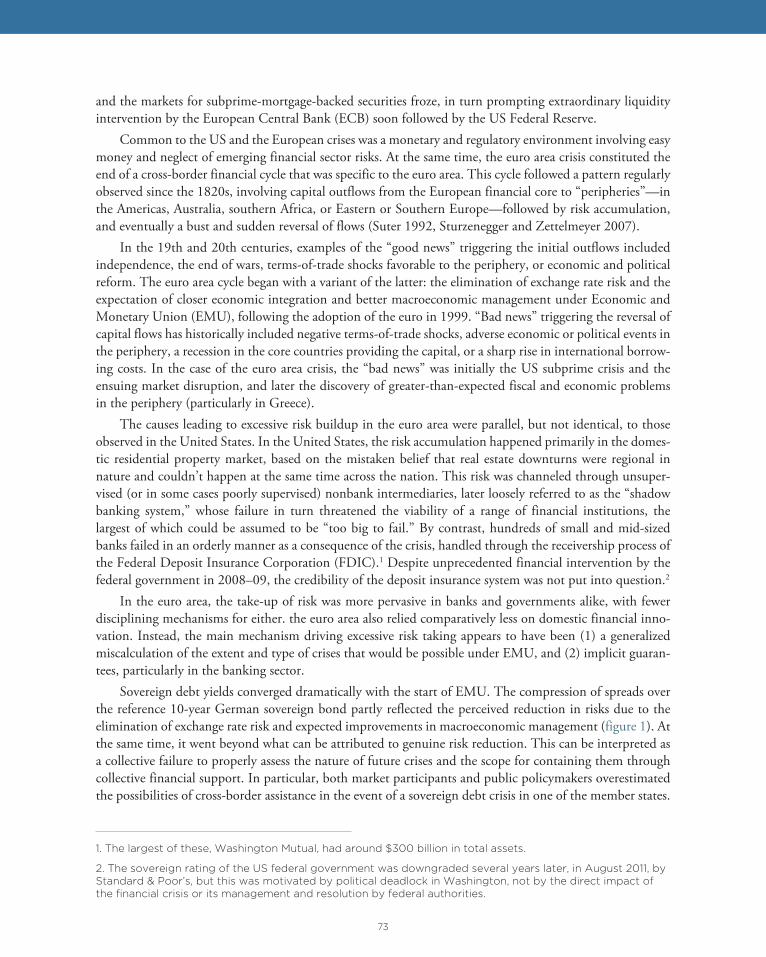
73
and the markets for subprime-mortgage-backed securities froze, in turn prompting extraordinary liquidity intervention by the European Central Bank (ECB) soon followed by the US Federal Reserve.
Common to the US and the European crises was a monetary and regulatory environment involving easy money and neglect of emerging financial sector risks. At the same time, the euro area crisis constituted the end of a cross-border financial cycle that was specific to the euro area. This cycle followed a pattern regularly observed since the 1820s, involving capital outflows from the European financial core to “peripheries”—in the Americas, Australia, southern Africa, or Eastern or Southern Europe—followed by risk accumulation, and eventually a bust and sudden reversal of flows (Suter 1992, Sturzenegger and Zettelmeyer 2007).
In the 19th and 20th centuries, examples of the “good news” triggering the initial outflows included independence, the end of wars, terms-of-trade shocks favorable to the periphery, or economic and political reform. The euro area cycle began with a variant of the latter: the elimination of exchange rate risk and the expectation of closer economic integration and better macroeconomic management under Economic and Monetary Union (EMU), following the adoption of the euro in 1999. “Bad news” triggering the reversal of capital flows has historically included negative terms-of-trade shocks, adverse economic or political events in the periphery, a recession in the core countries providing the capital, or a sharp rise in international borrow-ing costs. In the case of the euro area crisis, the “bad news” was initially the US subprime crisis and the ensuing market disruption, and later the discovery of greater-than-expected fiscal and economic problems in the periphery (particularly in Greece).
The causes leading to excessive risk buildup in the euro area were parallel, but not identical, to those observed in the United States. In the United States, the risk accumulation happened primarily in the domes-tic residential property market, based on the mistaken belief that real estate downturns were regional in nature and couldn’t happen at the same time across the nation. This risk was channeled through unsuper-vised (or in some cases poorly supervised) nonbank intermediaries, later loosely referred to as the “shadow banking system,” whose failure in turn threatened the viability of a range of financial institutions, the largest of which could be assumed to be “too big to fail.” By contrast, hundreds of small and mid-sized banks failed in an orderly manner as a consequence of the crisis, handled through the receivership process of the Federal Deposit Insurance Corporation (FDIC).1 Despite unprecedented financial intervention by the federal government in 2008–09, the credibility of the deposit insurance system was not put into question.2
In the euro area, the take-up of risk was more pervasive in banks and governments alike, with fewer disciplining mechanisms for either. the euro area also relied comparatively less on domestic financial inno-vation. Instead, the main mechanism driving excessive risk taking appears to have been (1) a generalized miscalculation of the extent and type of crises that would be possible under EMU, and (2) implicit guaran-tees, particularly in the banking sector.
Sovereign debt yields converged dramatically with the start of EMU. The compression of spreads over the reference 10-year German sovereign bond partly reflected the perceived reduction in risks due to the elimination of exchange rate risk and expected improvements in macroeconomic management (figure 1). At the same time, it went beyond what can be attributed to genuine risk reduction. This can be interpreted as a collective failure to properly assess the nature of future crises and the scope for containing them through collective financial support. In particular, both market participants and public policymakers overestimated the possibilities of cross-border assistance in the event of a sovereign debt crisis in one of the member states.
1. The largest of these, Washington Mutual, had around $300 billion in total assets.
2. The sovereign rating of the US federal government was downgraded several years later, in August 2011, byStandard & Poor’s, but this was motivated by political deadlock in Washington, not by the direct impact ofthe fi nancial crisis or its management and resolution by federal authorities.
74
A striking suggestion of implicit guarantee was the comment in February 2009 by Peer Steinbrück, then Germany’s federal finance minister, that “if one euro zone [country] gets into trouble, then collectively we will have to be helpful.”3 We interpret this as a signal to provide generous liquidity assistance in the event of a euro area member state losing sovereign market access. This signaling followed consultations between the French and German governments together with EU authorities in the early weeks of 2009, when Greece was already understood to be vulnerable, and Ireland was under intensive observation by the International Monetary Fund (IMF) following its extension of comprehensive guarantees to the domestic banking sector in October 2008 (see Véron 2016). At that time, the market and official consensus of the precrisis years, as revealed by reactions in the early days of the crisis, does not seem to have explored how crises would be managed if a country’s loss of sovereign market access were found to denote insolvency as opposed to illi-quidity.4
3. Christian Reiermann, “A Test for Europe’s Common Currency: Support for Wobbly Euro Economies,”Spiegel Online, February 20, 2009, available at www.spiegel.de/international/europe/a-test-for-europe-s-common-currency-support-for-wobbly-euro-economies-a-608985.html (accessed on May 17, 2017). Thearticle mentions that “Greece, Ireland and Italy, especially, are seen as wobbling.” It also refers to dissentingvoices in the German debate, quoting Jürgen Stark who at the time was a member of the ECB’s ExecutiveBoard.
4. Importantly, we don’t view this collective error of judgment as having been about the euro area memberstates’ fi scal sustainability assessment per se. In particular, the weakness of the Greek sovereign creditworthi-ness, and the egregious unreliability of its government fi nancial statistics, were already well known before2009 and didn’t prevent Greek sovereign spreads over German 10-year debt from being as low as a fewdozen basis points in early 2007.
0
4
8
12
16
20
24
28
32
0
2
4
6
8
10
12199519951996199719981999200020012002200320042005200620062007200820092010201120122013201420152016
percent
FranceItalySpainIreland
Figure 1 Ten-year bond spreads of selected euro area countries, 1995–2016
Note: Bond spreads calculated as difference between 10-year government benchmark bond in country shown and 10-year German government benchmark bond. Data for Greece begin in March 2007.Source: Bloomberg; authors’ calculations.
percent
Greece (right axis)

75
A similar unwillingness to consider what would happen in the event of an insolvency can be observed with respect to banks. The official stance in many euro area countries5 was essentially to pretend that domestic banks would never fail, so instruments of liquidity support would always be sufficient to resolve crises. This official delusion reflected deep and multifaceted links between the national banking sector and domestic political systems. To summarize a complex picture whose details vary considerably across member states, such links responded to two drivers: “financial repression,” understood as the influence of public authorities over banks to direct lending toward preferred borrowers (including privileged enterprises, sectors, and/or themselves as sovereign or subsovereign issuers); and “banking nationalism,” the propensity of public authorities to protect and promote the interests of “national champion” banks headquartered in their jurisdiction. These patterns were echoed in the structure of the banking system in euro area countries, in which publicly listed banks with dispersed ownership are much less dominant than in the United States, Canada, Australia, or the United Kingdom, and most banks are owned by the public sector or cooperatives, or controlled by an influential minority or majority shareholder or shareholder group, making them to varying degrees receptive to direct political intervention (Véron 2017). The flip side of financial repression, banking nationalism, and political influence through governance and ownership structures was a perception of pervasive public guarantees. As the next section illustrates, this perception of banks being guaranteed was largely accurate (unlike that applying to euro area member states) in the first five years of the crisis.
In sum, the buildup of private and public debts in the euro area prior to 2007 can be attributed in part to overestimation of the genuine safety of the system—with a blind eye toward the possibility of solvency crises—and in part to implicit guarantees. The patterns of risk buildup varied greatly across countries and would be too long to describe in detail here. Importantly, not all segments of the economy were subject to such moral hazard. Borrowing by large nonfinancial corporations, for example, or by targets of leveraged private equity investments does not appear to have been excessive even in hindsight. It is particularly striking that private equity and hedge funds were widely viewed in the years immediately before the crisis as major sources of systemic risk but turned out not to be, while banks and governments that had been perceived as safe became the main disrupters.
2. CRISIS SEQUENCE AND POLICY RESPONSES
This section is a selective summary of the course of the euro area crisis, from its inception in mid-2007 to the turning point of mid-2012 to the present.6 As previously mentioned, the initial shock was to the banking system through its high exposure to the US subprime property market, particularly among a number of French, German, and other banks and the funds or other off-balance-sheet vehicles that they implicitly or
5. The exception to this general observation is Finland, which was hit by a severe fi nancial crisis in the early1990s, together with Denmark and Sweden (the latter are EU member states but not in the euro area).Finnish policymakers were thus more realistic about actual options in the event of fi nancial turmoil. It ispresumably not coincidental that forceful supervision saved Finland and Sweden from experiencing almostany bank failure in the last decade (the only exception we identifi ed was Sweden’s small Carnegie InvestmentBank, nationalized in November 2008), and that Denmark was unique among EU countries in managing theorderly closure of a number of small banks (e.g., Amagerbanken and Fjordbank Mors in 2010, AndelskassenJAK Slagelse in 2015) without any recourse to taxpayers’ money. (An earlier rescue, of Roskilde Bank in 2008,had guaranteed senior bonds but imposed losses on shareholders and subordinated debt holders.)
6. In comparison with the United States or even the United Kingdom, there has been a relative scarcity ofpublic in-depth analysis of the euro area crisis. Relevant references include Irwin (2013) and Bastasin (2015)for investigative journalism, Pisani-Ferry (2014) and Sinn (2014) for contrasting scholarly perspectives, andSmart (2017) for an analysis that puts appropriate emphasis on what we view as the central driver of the euroarea crisis, namely the bank-sovereign vicious circle.
76
explicitly guaranteed.7 Subsequent turmoil in segments of wholesale capital markets (such as those for resi-dential asset-based securities) severely disturbed some banks’ funding conditions. The resulting disruption led in particular to the early collapse of German banks IKB and Sachsen LB, both of which were fully guar-anteed and rescued by German public authorities in the summer of 2007, and severe subsequent problems at other German banks such as WestLB and Hypo Real Estate.
After the crisis escalated in September 2008—including, in the United States, the placement into conservatorship of Fannie Mae and Freddie Mac, the bankruptcy of Lehman Brothers, and the rescue of AIG—EU member states were compelled to signal that while the shareholders of weak banks may incur losses, there would be no failure and specifically no imposition of losses on banks’ creditors, no matter how small the bank or how subordinated the creditor.8 In some cases, the relevant government had to take major-ity or full ownership of weak banks, including Allied Irish Banks and Anglo Irish Bank in Ireland; Fortis Bank in Belgium, Luxembourg (almost immediately sold to BNP Paribas), and the Netherlands (renamed ABN AMRO); Dexia (jointly acquired by the French and Belgian governments); and Hypo Real Estate in Germany. In some of these cases, such as Dexia, governments even paid for the bank’s shares at a price that was far from negligible. Furthermore, governments extended guarantees to banks, with those in Ireland being particularly comprehensive.
Nevertheless, it took several more years for analysts, policymakers, and the broader public in the euro area to come to a more realistic consensus assessment of the extent of solvency challenges in the banking system, of the implications for sovereign creditworthiness, and of the actual options available in the event of sovereign insolvency of one of the area’s members. In the meantime, two key mechanisms fueled the general deterioration of financial conditions across an increasing number of euro area countries.
First, the partial and conditional nature of the area’s implicit safety net for government debt was gradu-ally revealed, leading to a sharp increase and differentiation of sovereign bond spreads. The crisis in Greece, triggered by the announcement of much higher than expected fiscal deficits in late 2009, was met by the provision of significant financial assistance in May 2010; but this came with onerous conditions in terms of fiscal and structural adjustment. Furthermore, German and French political leaders soon indicated that future official assistance to sovereigns would need to be accompanied by “arrangements for adequate private sector involvement” to ensure that private sector bondholders would share some of the losses of sovereign insolvency (Weder di Mauro and Zettelmeyer 2017). The intention of this was to ensure that official assistance—and particularly the creation of permanent assistance mechanisms9—did not give rise to addi-tional implicit guarantees. However, it precipitated the loss of sovereign market access of Ireland, and a few months later of Portugal.
Second, it became increasingly apparent that the euro area governments’ approach to banking crisis management, as revealed in 2007 and especially in the second half of 2008, created massive contingent
7. See Bayoumi (2017) for an extensive account.
8. For example, the declaration adopted at the summit of the euro area countries on October 12, 2008, statedthat “Governments remain committed to support the fi nancial system and therefore to avoid the failure ofrelevant fi nancial institutions, through appropriate means including recapitalization. In doing so, we will bewatchful regarding the interests of taxpayers and ensure that existing shareholders and management bear thedue consequences of the intervention.” Note the absence of mention of banks’ creditors among the partiesthat may “bear the consequences.” The same declaration endorsed the extension by each government ofguarantees for newly issued bank debt “for an interim period and on appropriate commercial terms,” as well asa commitment by each member state to “make available to fi nancial institutions Tier 1 capital, e.g., by acquiringpreferred shares or other instruments including non-dilutive ones” (Council of the European Union 2008).
9. After a transitional phase, these took the form of the European Stability Mechanism (ESM), a euro areafund with a potential lending capacity of €500 billion, established in 2012 in Luxembourg.

77
liabilities for the relevant sovereigns; and that conversely, a loss of sovereign creditworthiness had a direct impact on a country’s banking system, both because of the corresponding weakening of public guarantees and the high level of direct exposure of banks to their home country’s sovereign credit. This resulted in a vicious circle (sometimes referred to as the “doom loop”) between banking sector vulnerabilities and sover-eign ones, first identified in the euro area context by IMF staff economists who observed it in Ireland in early 2009 (e.g., Mody 2009), but it took two more years to be widely accepted among analysts, and additional time to be recognized by public policymakers (Véron 2016).
The widespread denial of the depth of banking system problems, largely (though far from exclusively) as a consequence of banking nationalism, contributed to accelerating dislocation. Following the announce-ments of assistance programs for Greece (May 2010), Ireland (November 2010), and Portugal (May 2011), contagion spread rapidly to Italy (which was perceived as lacking fiscal restraint and structural reform will-ingness under then Prime Minister Silvio Berlusconi), Spain (which faced a sharp real estate downturn), and France (where banks were very large and dependent on access to wholesale funding in dollars, a market in which they started to experience serious difficulties in August–September 2011).
By late 2011 it had become obvious that the euro area’s course was unsustainable and would lead to disorderly breakup unless major initiatives were undertaken to break the bank-sovereign vicious circle. Plans for “fiscal union,” or the pooling at the euro area level of at least some instruments of fiscal policy, were mooted but came to nothing substantial. The announcement in December 2011 of a “fiscal compact,” by which member states committed to various mechanisms for fiscal discipline, did not stem the financial deterioration, in part because investors (correctly, as it turned out) doubted that these mechanisms would be enforceable and, even more importantly, because it contained nothing to break the ongoing bank-sovereign vicious circle. In the absence of any more palatable option, member states in late June 2012 adopted an alternative plan for a “banking union” by which banking sector policy would be pooled at the euro area level, starting with the transfer of bank supervisory authority from national supervisors to the ECB. This very strong statement of purpose in turn allowed the ECB to commit in the summer of 2012 to unlimited supplies of sovereign bonds of countries under stress, provided they accepted conditions of adjustment, which eventually reversed the disorderly increase of sovereign spreads and opened a new cycle of gradual stabilization of sovereign market conditions.10
Despite localized turmoil, in Cyprus in 2013 and in Greece again in 2015 (following a change of government) this approach has been broadly successful. Spain received financial assistance in July 2012 to help the recapitalization of its banking system and never lost sovereign market access. Ireland, Portugal, and later Cyprus regained sovereign market access and exited financial assistance in 2013, 2014, and 2016 respectively.11 The ECB assumed its supervisory authority in November 2014 and has been broadly effective at driving the gradual repair of the euro area’s banking system, though pockets of fragility remain, particu-larly in Italy. The adoption of a new framework for banking crisis management and resolution, known as the Bank Recovery and Resolution Directive (BRRD) and broadly based on the US model of FDIC-led receivership, has been accompanied by a growing number of cases of losses imposed to junior creditors in bank rescues.12 However, the extension of this framework of discipline to failing banks’ senior creditors
10. The ECB intervention was memorably signaled in late July 2012 by its president’s commitment to doing“whatever it takes to preserve the euro, within our mandate,” and was formalized as the Outright MonetaryTransactions (OMT) program in September. Ironically, the announcement of OMT was suffi cient to dramati-cally alter market perceptions, and the program has not been triggered until now.
11. Cyprus had to impose capital controls in 2013, but these were fully lifted in April 2015. Greece, however,still has capital controls from its crisis episode of mid-2015.
12. Losses were imposed on subordinated bank creditors in countries that include Ireland (e.g., Allied Irish

78
remains difficult and controversial, and actual cases of senior creditor losses have (with the exception of Denmark–see note 5) been few and messy (see European Parliament 2016, World Bank 2016, Philippon and Salord 2017).13
3. CURRENT EURO AREA POLICY DEBATES, ASSESSMENT AND PROSPECTS
The actions briefly reviewed in the previous section have gone some way to mitigate the linkages between banks and sovereigns in the euro area, and to correspondingly reduce implicit guarantees and the associ-ated moral hazard, but stop well short of eliminating them. To name a few significant items of unfinished business: all deposit insurance remains at the national level, and a proposal made in November 2015 by the European Commission to gradually migrate toward a fully mutualized euro area deposit insurance system by 2024 has made no progress so far toward legislative adoption; the BRRD resolution model remains untested, as not a single bank has been resolved in the euro area since that legislation fully entered into force in early 2016; the establishment of a euro area bank resolution fund to absorb any residual losses remains a work in progress14; and many euro area banks still hold very large portfolios of home-country sovereign debt.
As a result, despite steps in the right direction, the bank-sovereign vicious circle has been mitigated but far from eliminated in the euro area. Many euro area banks remain highly exposed to national sovereigns, and several individual member states may remain exposed to significant fiscal costs in case of banking sector difficulties. A case in point was the announcement by the Italian government, in December 2016, of a new €20 billion fund for banking rescues, the use of which (e.g., for the troubled Banca Monte dei Paschi di Siena) is still under discussion at the time of writing.
More subtle forms of linkages between banks and national public policy have also been exposed by crisis developments. For example, in Germany, several banks’ risky shipping loans have been backed by pension fund investors through tax-preferred “KG funds,” delaying their overdue restructuring15; in Italy, public authorities have tolerated the sale by regional banks of their own risky equity and debt instruments to their retail clients.16 Such idiosyncrasies have the effect of making bank restructuring highly contentious in local political environments, and as a consequence have delayed or deterred proper crisis management and resolution.
Even assuming (perhaps optimistically) continued economic recovery combined with stable, relatively low real interest rates in the euro area, Europe should not miss the opportunity to leverage the recent painful experience to sever the remaining bank-sovereign linkages and make the euro area sovereign and banking framework more resilient to future shocks. Specifically, the aim should be for each member state to be able to weather a sovereign debt crisis (possibly even a sovereign credit event) without triggering a bank run or
Banks), Italy (Banca Etruria, Banca Marche, CariChieti, Carife), the Netherlands (SNS Reaal), Portugal (BANIF), Slovenia (e.g., NKBM, NLB, Abanka), and Spain (e.g., Bankia, Banco Mare Nostrum). All these cases, however, predate the entry into force of the “bail-in” provisions of BRRD in January 2016.
13. These include Anglo Irish Bank in Ireland, Laiki Bank and Bank of Cyprus in Cyprus, Banco Espírito Santo inPortugal, and Hypo Alpe Adria/HETA in Austria.
14. The so-called Single Resolution Fund (SRF) was established in January 2016 and entrusted to the SingleResolution Board, the new euro area resolution authority created as part of the banking union agenda. As itsname does not indicate, however, the SRF is actually a collection of national and euro area funds (known as“compartments”) that are currently scheduled to be fully merged (“mutualized”) by 2024.
15. See, e.g., Bruce Barnard, “Ship Finance on Life Support,” Journal of Commerce, February 28, 2013.
16. See, e.g., Rachel Sanderson, “Once-thriving Veneto becomes heart of Italy’s banking crisis,” FinancialTimes, November 24, 2016.

79
the imposition of capital controls; and conversely, to be able to manage and resolve a systemic banking crisis without losing sovereign debt market access. In our assessment, this aim can be reached within the frame-work of the current EU treaties, and without a full-fledged fiscal union that would entail an autonomous ability to tax, spend, and borrow at the European level. A corresponding policy program might include: Better transparency about government (national and subnational) financial statistics, through a reform
of the EU public sector accounting and auditing framework (currently entrusted to EUROSTAT)and enhanced protection of the independence of national government statisticians.17
A new regulatory regime involving gradually increasing capital charges on banks’ sovereign debt expo-sures (also known as sovereign exposure limits), to reduce the current home bias in banks’ euro areasovereign debt portfolios.
Regulatory incentives to diversify such portfolios into “sovereign-backed securities,” the seniortranches of which could serve as a “European safe asset” that might replace home-country bonds inbanks’ balance sheets (see Brunnermeier et al. 2017).
Enactment of a European Deposit Insurance Scheme (EDIS).18
Modification of the ESM’s intervention guidelines so that it could participate in “precautionaryrecapitalizations” of solvent but fragile banks.19
An explicit backstop (through an open credit line) by the ESM of the euro area’s Single ResolutionFund and of the still-to-be-created European Deposit Insurance Fund as part of the implementationof EDIS.
Further harmonization of the bank supervisory rulebook to phase out all existing options and nationaldiscretions that create distortions in the prudential supervision of euro area banks under the aegis ofthe ECB.
Gradual harmonization of the frameworks for bank insolvencies in the euro area, to eventually reachthe objective of a genuine single resolution mechanism.20
Mandatory use of the International Financial Reporting Standards (IFRS) as accounting requirementsapplicable to all banks in the European Union including small unlisted ones, following internationalbest practice.21
Improvements in bond contracts and/or EU or euro area legal frameworks, to reduce the power of“holdouts” and make sovereign debt restructuring more orderly and predictable.
The creation of an explicit “exceptional access policy” for the ESM, along the lines of the IMF’s, toprevent it from lending to sovereigns with unsustainable debts, unless this is accompanied by a debtrestructuring (Weder di Mauro and Zettelmeyer 2017).
17. The ongoing prosecution of a former head of the Greek national statistical offi ce tragically demonstratesthe inadequacy of the current framework in this respect. See, e.g., Robert Schmidt, “Greece’s Least WantedMan Lives in Maryland: Andreas Georgiou fi xed the country’s fake stats, now he faces criminal charges,”Bloomberg Businessweek, September 30, 2016.
18. The coauthors diff er on whether this should be enacted essentially as proposed by the EuropeanCommission in November 2015, or according to a diff erent design that would conserve a national level ofinsurance.
19. The legal basis for precautionary recapitalization is provided in BRRD article 32(4)(d)(iii).
20. Bank resolution, in Europe as elsewhere, is defi ned in law as a preferable alternative to court-orderedinsolvency. Thus, the aim of a “single resolution mechanism” in the euro area can be fully reached only if bankinsolvency frameworks are identical across member states, which is far from the case now.
21. Currently, IFRS are mandatory for all listed banks and for unlisted banks in some but not all euro areamember states.
80
This list is not meant to be exhaustive, and other initiatives could be envisaged, particularly on the banking sector’s tax and auditing frameworks. Of course, reforms should be phased over time. They also need to be carefully coordinated and communicated to prevent market disruptions, and must include appropriate transitional arrangements. In particular, “discipline-enhancing” reforms, such as tougher regulatory treat-ment of sovereign exposures or a strong ESM commitment not to bail out unambiguously insolvent coun-tries without an accompanying sovereign debt restructuring, need to be balanced by “insurance-enhancing” reforms, such as the creation of a European safe asset, the creation of a European Deposit Insurance Fund, and agreement on the ESM as a backstop.
Even under the most optimistic assumptions, it will take many years to enact and implement all the items mentioned above. Nevertheless, we view this program as realistic and achievable if euro area leaders are willing to be consistent with their stated aim of breaking the vicious circle between banks and sovereigns.
4. CONCLUSION
This paper summarizes and synthesizes multifaceted arguments about the buildup of excessive indebted-ness in the run-up to the euro area crisis, the treatment of that crisis in the past decade of turmoil, and possible reforms to make the euro area framework more resilient in the future. Both the crisis management framework and the broader reform program are still works in progress, and many of their aspects are highly contentious in the euro area. Nevertheless, we reckon that three important policy lessons stand out from this experience, of possible value to jurisdictions outside of Europe.
First, the paramount importance of market discipline and, related to it, the need to minimizeuncertainties about implicit guarantee mechanisms to the maximum practical extent. The fuzziness ofthe framework to support member states in case of loss of sovereign market access has been a centralfeature of the euro area crisis, as has an initially excessive implicit (and in late 2008, explicit) commit-ment by governments to guarantee the liabilities of failing euro area banks. Related to this objective isthe need to dramatically improve the transparency of banks and of national and subnational govern-ments vis-à-vis market investors, an area in which lopsided and altogether insufficient progress hasbeen made since the start of the euro area crisis.
Second, the case for a more diversified financial system and reduction of its overwhelming reli-ance on banks, thus making it easier to weather systemic banking crises while dispersing the burdenof associated losses. The contrast between the United States’ market-based system and the euro area’sbank-based one goes a long way to explain why the United States was able to restore its financialsystem’s core functions in about two years following the initial shock of mid-2007, while the equiva-lent return to normalcy has taken about a decade in the euro area. The current EU reform agendaknown as “capital markets union” illustrates the widespread recognition of this need following thecrisis, but much remains to be done to translate this intent into policy reality.
Third is the challenge of creating an incentive-compatible framework to organize the relationshipbetween structurally interdependent fiscal entities. In the case of the euro area, insolvent countriescould create large problems for each other, not least because of the linkages through the bankingsector. Beyond insufficient market discipline and questionable enforceability, a core reason for thefailure of the euro area Stability and Growth Pact is that it ignored the potential fiscal consequencesof private sector debts. The lesson here is that a construct based on fiscal rules cannot work unless thedirect links between banks and government are fully severed at all levels but the highest (and eventhere, such links should be reduced by involving creditors in loss sharing). Even so, it remains to beseen whether a euro area framework with full banking union (i.e., beyond the current hybrid) but nofiscal union (implying a euro area–level ability to tax, spend, and borrow) can be resilient and sustain-able over the long term.
81
REFERENCES Bastasin, Carlo. 2015. Saving Europe: Anatomy of a Dream. Washington: Brookings Institution.
Bayoumi, Tamim. 2017. Unfinished Business: The Unexplored Causes of the Financial Crisis and the Lessons Yet to Be Learnt. New Haven: Yale University Press, forthcoming (September).
Brunnermeier, Markus K., Sam Langfield, Marco Pagano, Ricardo Reis, Stijn Van Nieuwerburg, and Dimitri Vaya-nos. 2017. ESBies: Safety in the Tranches. Economic Policy, forthcoming.
Council of the European Union. 2008. Summit of the Euro Area Countries: Declaration on a Concerted European Action Plan of the Euro Area Countries. 14239/08. Brussels (October).
European Parliament. 2016. At a Glance: The Implementation of Bail-In in Recent Resolution and State Aid Cases. Brussels: Directorate-General for Internal Policies, Economic Governance Support Unit.
Irwin, Neil. 2013. The Alchemists: Three Central Bankers and a World on Fire. New York: Penguin Press.
Mody, Ashoka. 2009. From Bear Stearns to Anglo Irish: How Eurozone Sovereign Spreads Related to Financial Sector Vulnerability. IMF Working Paper WP/09/108. Washington: International Monetary Fund.
Pisani-Ferry, Jean. 2014. The Euro Crisis and Its Aftermath. Oxford: Oxford University Press.
Philippon, Thomas and Aude Salord. 2017. Bail-ins and Bank Resolution in Europe: A Progress Report. Geneva Reports on the World Economy Special Report 4. Geneva: International Center for Monetary and Banking Stud-ies/Centre for Economic Policy Research.
Sinn, Hans-Werner. 2014. The Euro Trap. Oxford: Oxford University Press.
Smart, Christopher. 2017. The Financial Education of the Eurozone. Mossavar-Rahmani Center for Business and Government Associate Working Paper Series No. 69. Cambridge MA: Harvard Kennedy School.
Sturzenegger, Federico, and Jeromin Zettelmeyer. 2007. Debt Defaults and Lessons from a Decade of Crises. Cambridge MA: MIT Press.
Suter, Christian. 1992. Debt Cycles in the World Economy: Foreign Loans, Financial Crises, and Debt Settle-ments, 1820–1990. San Francisco: Westview Press.
Véron, Nicolas. 2016. The IMF’s Role in the Euro Area Crisis: Financial Sector Aspects. IEO Background Paper BP/16-02/10. Washington: Independent Evaluation Office of the International Monetary Fund.
Véron, Nicolas. 2017. The Governance and Ownership of Significant Euro Area Banks. PIIE Policy Brief 17-18. Peterson Institute for International Economics Policy Brief.
Weder di Mauro, Beatrice, and Jeromin Zettelmeyer. 2017. The New Global Financial Safety Net: Struggling for Coherent Governance in a Multipolar System. CIGI Essays in International Finance 4.
World Bank. 2016. Bank Resolution and “Bail-in” in the EU: Selected Case Studies Pre and Post BRRD. Vienna: Financial Sector Advisory Center.
82
CHAPTER 9
US-China Trade Disputes and the World Trade Organization Chad P. Bown
China’s steel industry, its incomplete transformation to a market economy, and its nonmarket economy (NME) status represent major sources of friction between the United States and China. This paper analyzes these issues and shows how they threaten the stability of the World Trade Organization (WTO). It shows that resolving the conflicts over steel and NME status are necessary but that doing so will not be sufficient if the solution does not also tackle more systemic concerns involving China’s integration into the global trading system.
CHINA’S EXPORTS OF STEEL
Global capacity for crude steel production increased by almost 80 percent between 2005 and 2017 (figure 1). Little of that expansion took place in the Organisation for Economic Co-operation and Development (OECD), where capacity increased by only 13 percent. Significant expansion took place in several non-OECD countries, including India, Brazil, and Russia.
By far the largest source of growth in steel capacity was in China, where capacity expanded by 176 percent over this period. China’s share of global steel production capacity went from less than one-third in 2005 to nearly 50 percent in 2017.
China’s production of crude steel was 1.26 times higher in 2015 than it was in 2005, largely tracking China’s overall growth in capacity during this period (figure 2). Production in the rest of the world was essentially flat during this period. Most recently, crude steel production declined in 2015, as world produc-tion declined by 4.3 percent. China and Japan were the only major steel-exporting countries for which the OECD has estimates in which the ratio of exports to production increased in 2015 (figure 3).
Two pieces of evidence in figure 3 stand out. First, as its economy began to slow down, China substan-tially increased the share of its production it exports, from 4.2 percent in 2009 to 7.5 percent in 2013 to 13.7 percent in 2015. Second, relative to most other major exporters, China still exports a relatively small share of production. Although it the world’s largest exporter of steel products—accounting for 30 percent of world (net of EU-28) exports in 2014, up from 12 percent in 2005—among the major economies, only
Chad P. Bown is a senior fellow at the Peterson Institute for International Economics. Much of the analysis is explained more fully in Bown (2016b). The author thanks Junie Joseph for outstanding research assistance and Caroline Freund, Gary Hufbauer, Nick Lardy, Rory MacFarquhar, and Jeff Schott for useful comments.
IV. Trade and Investment
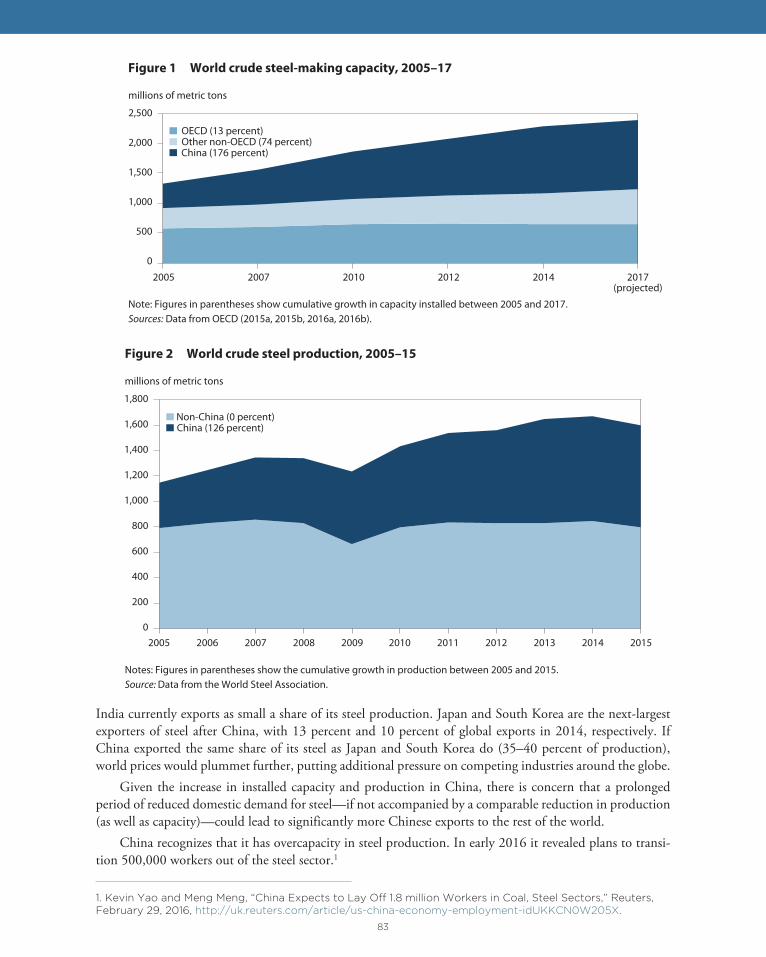
83
India currently exports as small a share of its steel production. Japan and South Korea are the next-largest exporters of steel after China, with 13 percent and 10 percent of global exports in 2014, respectively. If China exported the same share of its steel as Japan and South Korea do (35–40 percent of production), world prices would plummet further, putting additional pressure on competing industries around the globe.
Given the increase in installed capacity and production in China, there is concern that a prolonged period of reduced domestic demand for steel—if not accompanied by a comparable reduction in production (as well as capacity)—could lead to significantly more Chinese exports to the rest of the world.
China recognizes that it has overcapacity in steel production. In early 2016 it revealed plans to transi-tion 500,000 workers out of the steel sector.1
1. Kevin Yao and Meng Meng, “China Expects to Lay Off 1.8 million Workers in Coal, Steel Sectors,” Reuters,February 29, 2016, http://uk.reuters.com/article/us-china-economy-employment-idUKKCN0W205X.
0
500
1,000
1,500
2,000
2,500
2005 2007 2010 2012 2014 2017(projected)
millions of metric tons
OECD (13 percent)Other non-OECD (74 percent)China (176 percent)
Figure 1 World crude steel-making capacity, 2005–17
Note: Figures in parentheses show cumulative growth in capacity installed between 2005 and 2017.Sources: Data from OECD (2015a, 2015b, 2016a, 2016b).
0
200
400
600
800
1,000
1,200
1,400
1,600
1,800
2005 2006 2007 2008 2009 2010 2011 2012 2013 2014 2015
Non-China (0 percent)China (126 percent)
Figure 2 World crude steel production, 2005–15
Notes: Figures in parentheses show the cumulative growth in production between 2005 and 2015.Source: Data from the World Steel Association.
millions of metric tons

84
Figure 3 Exports as a share of steel production in selected countries, 2005–15
Note: Exports of semi-finished and finished steel as a percent of total crude steel production. Export data for 2015 were unavailable from the World Steel Association; where available, estimates of 2015 are based on OECD export growth estimates (OECD 2016b). Figures in parentheses are the 2014 share of each country’s exports of semi-finished and finished steel as a percent of world (net of European Union) exports of semi-finished and finished steel. Source: Data from the World Steel Association.
0
5
10
15
20
25
30
35
40
45
50
2005 2006 2007 2008 2009 2010 2011 2012 2013 2014 2015
percenta. China, India, Japan, and Korea
Korea (10 percent)China (30 percent)
Japan (13 percent)India (13 percent)
0
10
20
30
40
50
60
70
80
90
2005 2006 2007 2008 2009 2010 2011 2012 2013 2014 2015
percentb. Other major exporting countries
Ukraine (7 percent) Turkey (5 percent) Russia (9 percent)Other (12 percent) Brazil (3 percent) North America (8 percent)
85
USE OF IMPORT-RESTRICTING POLICIES
The global overcapacity for steel production has led to a wave of import restrictions around the world. The response is not new, though the impact may be for parts of China’s steel industry. The last global wave of such trade barriers occurred in 2001–03, when most of the major economies (including the United States, the European Union, and China) imposed safeguard import restrictions on steel products in response to global overcapacity (Devereaux, Lawrence, and Watkins 2006; Bown 2013).
But that period was not unique. Steel-importing countries imposed trade restrictions in the aftermath of the 1990s Asian financial crisis and contagion in Brazil and Russia that led domestic demand in those countries to collapse and producers to seek foreign markets for their excess supply. More generally, steel has been frequently targeted by import-restricting policies, such as antidumping duties, countervailing duties, and safeguards. A large body of literature provides evidence that countries tend to implement such import restrictions when their economies slow, unemployment increases, and imports surge, and that they tend to impose them against trading partners with whom the real exchange rate has sharply appreciated and whose own growth has slowed (Bown and Crowley 2013a, 2013b; 2014). Some macroeconomic and industry conditions have thus been ripe for an increase in these types of trade policies being used. Potential Chinese state involvement in its steel sector creates an additional layer of complexity for the policy issue.
DID CHINA’S NONMARKET ECONOMY STATUS EXPIRE?
China formally acceded to the WTO on December 11, 2001. The United States, the European Union, and most of the major economies in the WTO now face the immediate policy question of whether to alter China’s status as an NME and what doing so would mean in terms of how countries apply policies such as antidumping and countervailing duties. The pending legal question is whether the NME provision expired automatically after 15 years—that is, as of December 11, 2016.
Article 15(a)(ii) of China’s accession protocol (WTO 2001) contains the language explicitly permitting other WTO members to treat China as an NME in their antidumping investigations. The controversy arises in part because Article 15(d) indicates that “the provisions of subparagraph (a)(ii) shall expire 15 years after the date of accession.” The unsettled legal question is how to interpret the remaining elements of Article 15 once Article 15(a)(ii) is removed. Are WTO members permitted to continue to treat China as an NME in antidumping investigations, or must they stop?
The legal debate of the issue is not addressed here. Whatever the language in the WTO Accession Protocol, China was led to believe that trading partners like the United States would revoke its NME status in 2016. The focus here is therefore on the implications associated with different potential policy decisions the United States and China might make given the current situation and their fundamental leadership roles under the WTO.
NONMARKET ECONOMY STATUS UNDER US LAW
Determination of Dumping
Under US law, the Department of Commerce must take various factors into consideration in determining whether a trading partner is an NME (table 1). They include how market driven the country’s currency, wages, and prices of other inputs are and how involved the foreign government is in affecting inbound foreign direct investment and implementing price controls and output targets.
Based on its assessment of these factors, the United States currently treats China as an NME. The Commerce Department began a review of China’s NME status on March 29, 2017 (US Department of Commerce 2017).
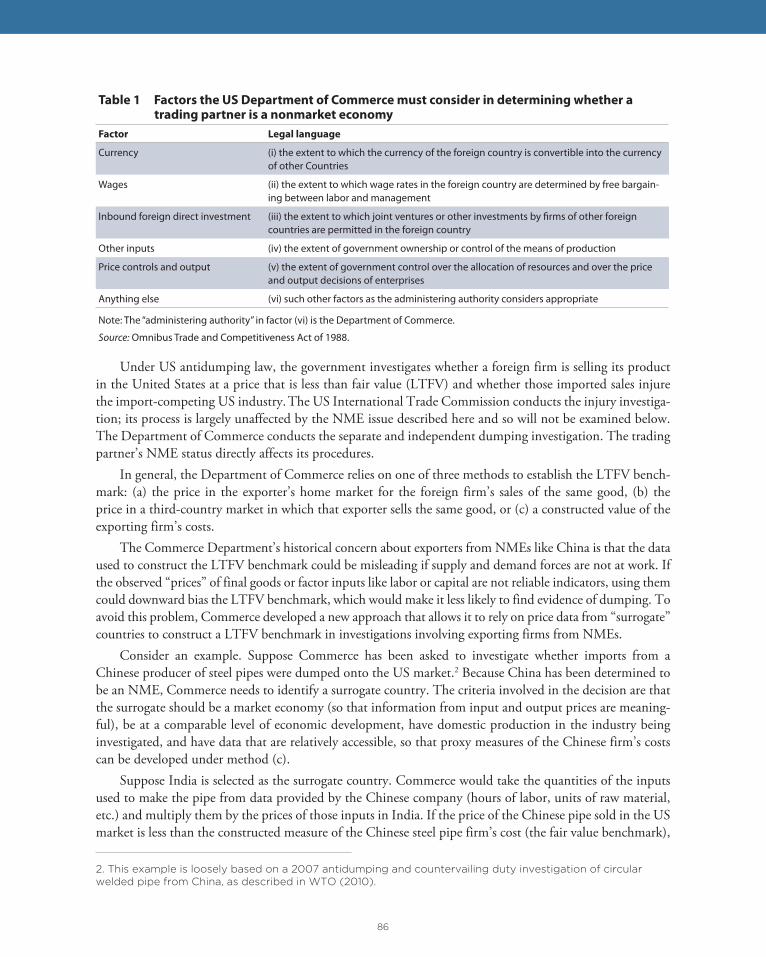
86
Under US antidumping law, the government investigates whether a foreign firm is selling its product in the United States at a price that is less than fair value (LTFV) and whether those imported sales injure the import-competing US industry. The US International Trade Commission conducts the injury investiga-tion; its process is largely unaffected by the NME issue described here and so will not be examined below. The Department of Commerce conducts the separate and independent dumping investigation. The trading partner’s NME status directly affects its procedures.
In general, the Department of Commerce relies on one of three methods to establish the LTFV bench-mark: (a) the price in the exporter’s home market for the foreign firm’s sales of the same good, (b) the price in a third-country market in which that exporter sells the same good, or (c) a constructed value of the exporting firm’s costs.
The Commerce Department’s historical concern about exporters from NMEs like China is that the data used to construct the LTFV benchmark could be misleading if supply and demand forces are not at work. If the observed “prices” of final goods or factor inputs like labor or capital are not reliable indicators, using them could downward bias the LTFV benchmark, which would make it less likely to find evidence of dumping. To avoid this problem, Commerce developed a new approach that allows it to rely on price data from “surrogate” countries to construct a LTFV benchmark in investigations involving exporting firms from NMEs.
Consider an example. Suppose Commerce has been asked to investigate whether imports from a Chinese producer of steel pipes were dumped onto the US market.2 Because China has been determined to be an NME, Commerce needs to identify a surrogate country. The criteria involved in the decision are that the surrogate should be a market economy (so that information from input and output prices are meaning-ful), be at a comparable level of economic development, have domestic production in the industry being investigated, and have data that are relatively accessible, so that proxy measures of the Chinese firm’s costs can be developed under method (c).
Suppose India is selected as the surrogate country. Commerce would take the quantities of the inputs used to make the pipe from data provided by the Chinese company (hours of labor, units of raw material, etc.) and multiply them by the prices of those inputs in India. If the price of the Chinese pipe sold in the US market is less than the constructed measure of the Chinese steel pipe firm’s cost (the fair value benchmark),
2. This example is loosely based on a 2007 antidumping and countervailing duty investigation of circularwelded pipe from China, as described in WTO (2010).
Table 1 Factors the US Department of Commerce must consider in determining whether a trading partner is a nonmarket economy
Factor Legal language
Currency (i) the extent to which the currency of the foreign country is convertible into the currency of other Countries
Wages (ii) the extent to which wage rates in the foreign country are determined by free bargain-ing between labor and management
Inbound foreign direct investment (iii) the extent to which joint ventures or other investments by firms of other foreign countries are permitted in the foreign country
Other inputs (iv) the extent of government ownership or control of the means of production
Price controls and output (v) the extent of government control over the allocation of resources and over the price and output decisions of enterprises
Anything else (vi) such other factors as the administering authority considers appropriate
Note: The “administering authority” in factor (vi) is the Department of Commerce.
Source: Omnibus Trade and Competitiveness Act of 1988.
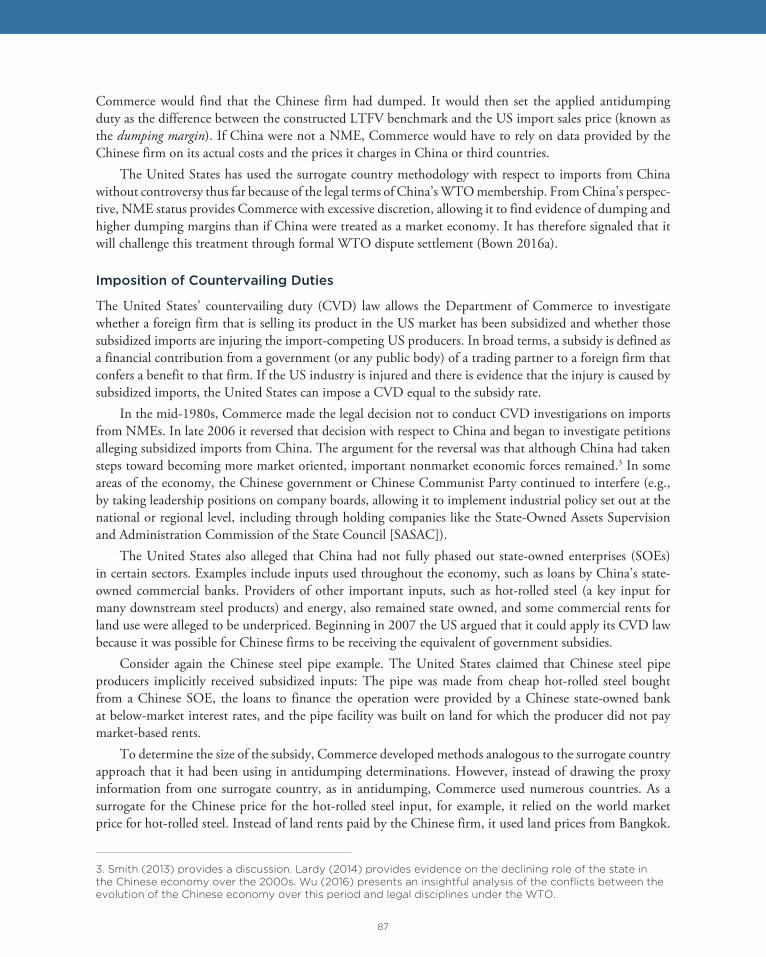
87
Commerce would find that the Chinese firm had dumped. It would then set the applied antidumping duty as the difference between the constructed LTFV benchmark and the US import sales price (known as the dumping margin). If China were not a NME, Commerce would have to rely on data provided by the Chinese firm on its actual costs and the prices it charges in China or third countries.
The United States has used the surrogate country methodology with respect to imports from China without controversy thus far because of the legal terms of China’s WTO membership. From China’s perspec-tive, NME status provides Commerce with excessive discretion, allowing it to find evidence of dumping and higher dumping margins than if China were treated as a market economy. It has therefore signaled that it will challenge this treatment through formal WTO dispute settlement (Bown 2016a).
Imposition of Countervailing Duties
The United States’ countervailing duty (CVD) law allows the Department of Commerce to investigate whether a foreign firm that is selling its product in the US market has been subsidized and whether those subsidized imports are injuring the import-competing US producers. In broad terms, a subsidy is defined as a financial contribution from a government (or any public body) of a trading partner to a foreign firm that confers a benefit to that firm. If the US industry is injured and there is evidence that the injury is caused by subsidized imports, the United States can impose a CVD equal to the subsidy rate.
In the mid-1980s, Commerce made the legal decision not to conduct CVD investigations on imports from NMEs. In late 2006 it reversed that decision with respect to China and began to investigate petitions alleging subsidized imports from China. The argument for the reversal was that although China had taken steps toward becoming more market oriented, important nonmarket economic forces remained.3 In some areas of the economy, the Chinese government or Chinese Communist Party continued to interfere (e.g., by taking leadership positions on company boards, allowing it to implement industrial policy set out at the national or regional level, including through holding companies like the State-Owned Assets Supervision and Administration Commission of the State Council [SASAC]).
The United States also alleged that China had not fully phased out state-owned enterprises (SOEs) in certain sectors. Examples include inputs used throughout the economy, such as loans by China’s state-owned commercial banks. Providers of other important inputs, such as hot-rolled steel (a key input for many downstream steel products) and energy, also remained state owned, and some commercial rents for land use were alleged to be underpriced. Beginning in 2007 the US argued that it could apply its CVD law because it was possible for Chinese firms to be receiving the equivalent of government subsidies.
Consider again the Chinese steel pipe example. The United States claimed that Chinese steel pipe producers implicitly received subsidized inputs: The pipe was made from cheap hot-rolled steel bought from a Chinese SOE, the loans to finance the operation were provided by a Chinese state-owned bank at below-market interest rates, and the pipe facility was built on land for which the producer did not pay market-based rents.
To determine the size of the subsidy, Commerce developed methods analogous to the surrogate country approach that it had been using in antidumping determinations. However, instead of drawing the proxy information from one surrogate country, as in antidumping, Commerce used numerous countries. As a surrogate for the Chinese price for the hot-rolled steel input, for example, it relied on the world market price for hot-rolled steel. Instead of land rents paid by the Chinese firm, it used land prices from Bangkok.
3. Smith (2013) provides a discussion. Lardy (2014) provides evidence on the declining role of the state inthe Chinese economy over the 2000s. Wu (2016) presents an insightful analysis of the confl icts between theevolution of the Chinese economy over this period and legal disciplines under the WTO.

88
For interest rates, it used a regression analysis of inflation-adjusted interest rates in 33 lower-middle-income countries to construct a benchmark interest rate for the firm’s costs of borrowing. This approach allowed Commerce to construct a measure of the Chinese firm’s costs, which it used to estimate the size of the implicit subsidy. Commerce could apply a CVD equal to the per unit subsidy rate if the US International Trade Commission found evidence of injury caused by the subsidy.4
Commerce began to use this approach in CVD investigations of imports from China in 2006; it applied the first CVDs in 2007. China has challenged certain procedural elements of the new US approach through formal WTO dispute settlement, with mixed legal decisions.
Despite the challenges, Commerce continues to use these methods to investigate whether imports from China are unfairly subsidized. It has received more than 50 petitions since 2006. It has imposed CVDs in roughly 75 percent of the investigations completed to date. Investigations have covered many steel products, chemicals, tires, wood products, solar panels, and wind towers. Almost all the CVD investigations involving imports from China have been conducted simultaneously with antidumping investigations.
HOW DO ANTIDUMPING LAWS AND COUNTERVAILING DUTIES AFFECT US IMPORTS FROM CHINA?
China’s exports to the United States stood at roughly $500 billion in 2015. They increased by a factor of nearly four since China joined the WTO (figure 4). At the same time as China’s exports to the United States were growing rapidly, the United States was imposing antidumping import restrictions on an increas-ingly large share of those imports. On a trade-weighted basis, in 2000 less than 1.5 percent of China’s total goods exports to the United States were subject to a US-imposed antidumping import restriction. By 2015 US-imposed antidumping import restrictions affected roughly 7 percent of China’s annual exports to the United States (about $35 billion). The significant uptick, especially after 2007, is consistent with research suggesting that import restrictions tend to increase during macroeconomic slowdowns and periods of appre-ciation of the real exchange rate.
To the extent that China believes that its exports to the United States have been limited because of its treatment under NME status, it is clear why China is concerned about its status. An alternative interpreta-tion is that being labeled an NME was the price to be paid for the overall benefits of WTO accession. Put differently, roughly 93 percent of China’s annual exports of $500 billion to the United States were not subject to antidumping in 2015. In exchange for NME status, China has received nondiscriminatory treat-ment—facing relatively low tariffs and benefiting from secure access—to the US import market.5
Figure 4 shows the simultaneity of the application of antidumping action and CVDs. Not only did the shares of US imports from China subject to both antidumping laws and CVDs increase between 2007 and 2015, there is also evidence of a significant reduction in the difference between the two series. In 2007 there was a 3.6 percentage point gap between the level of US imports from China covered by antidumping and those covered by CVDs. By 2015 the gap had narrowed to 2.4 percent.
4. When both dumping and subsidies are found, the size of the CVD is adjusted to avoid double counting.
5. Compare China’s choice of accepting NME treatment in antidumping in exchange for most favored nation(MFN) tariff treatment with the choice that Japan made when it joined the multilateral trading system, in1955. At the time of Japan’s entry into the General Agreement on Tariff s and Trade (GATT), more than 50countries invoked a general GATT exception, which allowed them not to apply the same MFN import tariff onJapan that they applied on imports from all other GATT members. Many countries continued to discriminateagainst imports from Japan in this manner until the early 1970s. The United States was an exception; it ap-plied MFN tariff s on Japanese imports and addressed its bilateral trade frictions with Japan primarily throughantidumping and negotiated voluntary export restraints.
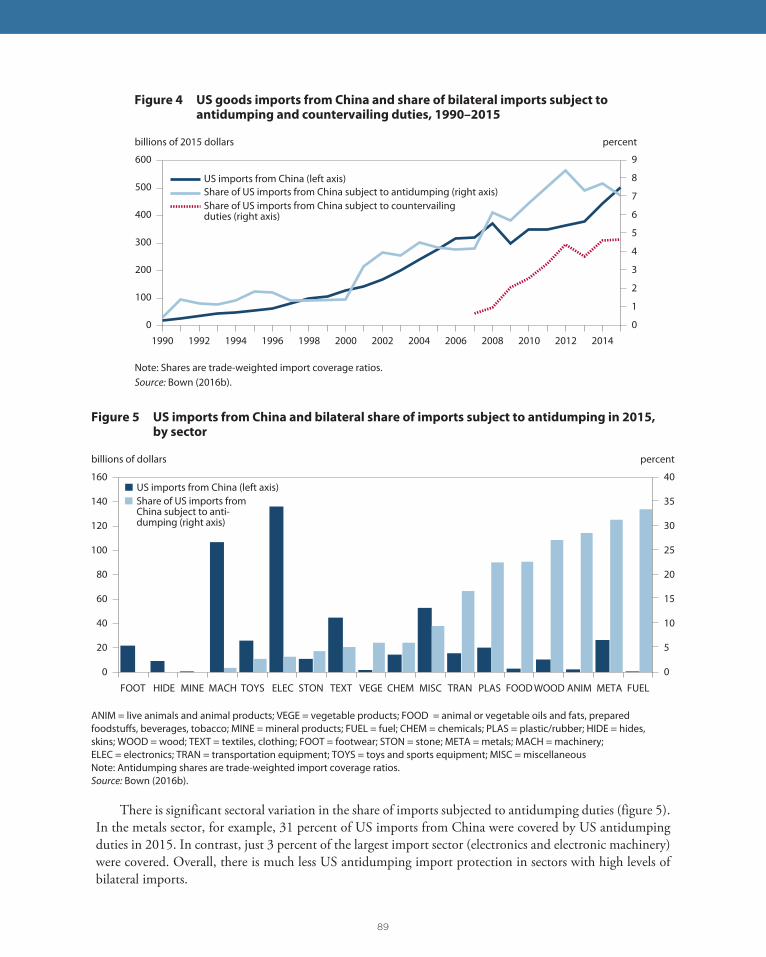
89
Figure 4 US goods imports from China and share of bilateral imports subject to antidumping and countervailing duties, 1990–2015
Note: Shares are trade-weighted import coverage ratios.Source: Bown (2016b).
0
1
2
3
4
5
6
7
8
9
0
100
200
300
400
500
600
1990 1992 1994 1996 1998 2000 2002 2004 2006 2008 2010 2012 2014
billions of 2015 dollars
US imports from China (left axis)Share of US imports from China subject to antidumping (right axis)Share of US imports from China subject to countervailing duties (right axis)
percent
Figure 5 US imports from China and bilateral share of imports subject to antidumping in 2015, by sector
0
5
10
15
20
25
30
35
40
0
20
40
60
80
100
120
140
160
FOOT HIDE MINE MACH TOYS ELEC STON TEXT VEGE CHEM MISC TRAN PLAS FOOD WOOD ANIM META FUEL
ANIM = live animals and animal products; VEGE = vegetable products; FOOD = animal or vegetable oils and fats, prepared foodstuffs, beverages, tobacco; MINE = mineral products; FUEL = fuel; CHEM = chemicals; PLAS = plastic/rubber; HIDE = hides, skins; WOOD = wood; TEXT = textiles, clothing; FOOT = footwear; STON = stone; META = metals; MACH = machinery; ELEC = electronics; TRAN = transportation equipment; TOYS = toys and sports equipment; MISC = miscellaneousNote: Antidumping shares are trade-weighted import coverage ratios. Source: Bown (2016b).
There is significant sectoral variation in the share of imports subjected to antidumping duties (figure 5). In the metals sector, for example, 31 percent of US imports from China were covered by US antidumping duties in 2015. In contrast, just 3 percent of the largest import sector (electronics and electronic machinery) were covered. Overall, there is much less US antidumping import protection in sectors with high levels of bilateral imports.
percentbillions of dollars
US imports from China (left axis)Share of US imports from China subject to anti-dumping (right axis)

90
POLICY RECOMMENDATIONS
The bruising US presidential election brought into sharp relief the fact that, justifiably or not, much of the US population is worried about globalization in general and US-China trade relations in particular.6 The current political climate is therefore not ideal for negotiating a mutually agreeable outcome to either the steel overcapacity or the NME issue.
China has its own struggles to address at home as its growth slows and it attempts to facilitate a major transition toward a more consumer-based and service-oriented economy. This process will involve large-scale adjustment out of sectors that currently employ millions of Chinese workers, including in heavy indus-try such as steel, coal, and aluminum.
Despite the challenging political climate, a negotiated solution to these issues is needed. China is still far from a transparent, market-oriented economy. SOEs continue to play an outsized role in sectors that are politically sensitive in the United States and other countries, such as hot-rolled steel, energy, and banking.
Bilateral engagement over the NME issue is needed so that China and the United States eventually reach a sustainable, long-run solution. The United States has developed a separate policy instrument—through its CVD law—that increasingly appears capable of addressing concerns over unfair imports from China. If the United States and China could come to a more formal agreement about access to this alterna-tive policy, to resolve uncertainty caused by the constant threat of WTO litigation, the United States would have overcome one important hurdle in the effort to maintain bilateral cooperation over the near term.
Over the longer term, questions facing the rules- and market-based trading system remain. Can China become the sort of market-oriented economy that does not require trading partners to apply special policies? During this transition, would China benefit from additional international rules and more explicit external benchmarks regarding transparency and future state involvement in the economy? If China cannot transi-tion, is coexistence with economies that operate under very different rules possible? Answers to these ques-tions are likely to have a significant impact on the path of cooperation in the international trading system.
REFERENCESAutor, David, David Dorn, and Gordon Hanson. 2016. The China Shock: Learning about Labor Market Adjust-ment to Large Changes in Trade. Annual Review of Economics 8: 205–40.
Bown, Chad P. 2013. How Different Are Safeguards from Antidumping? Evidence from US Trade Policies to-ward Steel. Review of Industrial Organization 42, no. 4: 449–81.
Bown, Chad P. 2016a. The Perils of Shifting China’s “Market Economy” Dispute to the WTO. World Politics Review (December 21).
Bown, Chad P. 2016b. Should the United States Recognize China as a Market Economy? PIIE Policy Brief 16-24. Washington: Peterson Institute for International Economics.
Bown, Chad P. and Meredith A. Crowley. 2013a. Import Protection, Business Cycles, and Exchange Rates: Evi-dence from the Great Recession. Journal of International Economics 90, no. 1: 50-64.
Bown, Chad P. and Meredith A. Crowley. 2013b. Self-Enforcing Trade Agreements: Evidence from Time-Varying Trade Policy. American Economic Review 103, no. 2: 1071–90.
Bown, Chad P. and Meredith A. Crowley. 2014. Emerging Economies, Trade Policy, and Macroeconomic Shocks. Journal of Development Economics 111: 261–73.
6. Even the largest estimates suggest that imports from China are responsible for no more than 20 percentof US manufacturing job losses since 2001 (for a survey of the evidence, see Autor, Dorn, and Hanson 2016).But even a relatively modest negative impact of imports from China on US labor market outcomes wouldcontribute to the toxic political climate.
91
Devereaux, Charan, Robert Z. Lawrence, and Michael D. Watkins. 2006. Standing up for Steel. In Case Studies in US Trade Negotiation, vol. 2, Resolving Disputes, ed. Charan Devereaux, Robert Z. Lawrence, and Michael D. Watkins. Washington: Institute for International Economics.
Lardy, Nicholas R. 2014. Markets over Mao: The Rise of Private Business in China. Washington: Peterson Institute for International Economics.
OECD (Organization for Economic Cooperation and Development). 2015a. Excess Capacity in the Global Steel Industry and the Implications of New Investment Projects. OECD Science, Technology and Industry Policy Paper 18. Paris: OECD Publishing. Available at http://dx.doi.org/10.1787/5js65x46nxhj-en.
OECD (Organization for Economic Cooperation and Development). 2015b. World Crude Steel-Making Capac-ity. Paris. Available at www.oecd.org/sti/ind/1.1Worldcrudesteelmakingcapacity.xlsx.
OECD (Organization for Economic Cooperation and Development). 2016a. Capacity Developments in the World Steel Industry. OECD Directorate for Science, Technology and Innovation, Steel Committee, DSTI/SU/SC(2015)8/FINAL. Paris. Available at www.oecd.org/sti/ind/Capacity-Developments-Steel-Industry.pdf.
OECD (Organization for Economic Cooperation and Development). 2016b. Steel Market Developments: Q4 2015. Paris. Available at www.oecd.org/sti/ind/Steel-market-developments-2015Q4.pdf.
Smith, Jane M. 2013. US Trade Remedy Laws and Nonmarket Economies: A Legal Overview. Congressional Research Service Report for Congress RL33976, January 31. Washington.
US Department of Commerce. 2017. Certain Aluminum Foil from the People’s Republic of China: Notice of Initia-tion of Inquiry into the Status of the People’s Republic of China as a Nonmarket Economy Country under the Antidumping and Countervailing Duty Laws. Docket 170328324-7324-01 [A-570-053], March 29. Washington.
WTO (World Trade Organization). 2001. Accession of the People’s Republic of China: Decision of 10 November 2001. Document WT/L/432, November 23. Geneva.
WTO (World Trade Organization). 2010. United States—Definitive Anti-Dumping and Countervailing Duties on Certain Products from China: Report of the Panel. Document WT/DS379/R, October 22. Geneva.
Wu, Mark. 2016. The “China, Inc.” Challenge to Global Trade Governance. Harvard International Law Journal 57, no. 2: 261–324.

92
CHAPTER 10
The Importance of Doing Our BIT: The Economic Potential of a US-China Bilateral Investment TreatyLee G. Branstetter, Britta Glennon, and J. Bradford Jensen
China has made strides toward opening its economy to private entrepreneurship, international trade, and foreign investment. But the process is far from complete. Barriers to foreign direct investment (FDI) in the services sector remain high, reducing productivity, raising prices, constraining choices for Chinese consum-ers and businesses, and holding back growth. A US-China bilateral investment treaty (BIT) could help eliminate barriers to FDI, potentially yielding substantial benefits to both countries.
DEVELOPMENT OF CHINA’S UNDERDEVELOPED SERVICES SECTOR AS A KEY TO GROWTH
China has emerged with unprecedented speed as the world’s leading manufacturer and exporter of goods. The outsized role of manufacturing in China’s economy reflects both the strength of its manufacturing sector and the relative weakness of its services sector. Research reported in Lardy (2012, 2014) shows that the role of services was especially small early in the reform period, reflecting the artificial restrictions on its growth under China’s Maoist economic model. As the Chinese economy opened up to market forces, services grew rapidly, nearly doubling their share of Chinese GDP by 2002. This rapid growth reflected the natural evolution of a market economy toward greater reliance on services. However, the growth of China’s services sector as a share of GDP stagnated in the 2000s, as the interest rate, exchange rate, and energy prices all declined relative to economic fundamentals, effectively subsidizing the creation of an overbuilt manufac-turing sector and restraining the natural growth in services (figure 1).
These price distortions have moderated significantly in recent years, and the share of services in GDP appears to have resumed its growth after 2010. Nevertheless, the cumulative effect of these distortions has
Lee G. Branstetter is a professor of economics and public policy at Carnegie Mellon University and a nonresident fellow at the Peterson Institute for International Economics. Britta Glennon is a PhD student at Carnegie Mellon. J. Bradford Jensen is a professor of international business and economics at the McDonough School of Business at Georgetown University and a nonresident senior fellow at the Peterson Institute for International Economics.

93
G. kept the share of services in GDP and employment below what one would expect given China’s level ofper capita income. Researchers at the Asian Development Bank (Park and Shin 2012) find that China haslagged well behind other developing countries in Asia in terms of development of the services sector.
Business services are particularly important to economic development. They provide key intermediate inputs to a range of other sectors, including manufacturing. Banking, legal services, marketing, research and development, design, engineering, project management, software, and telecommunications are crucial inputs to other activities throughout the economy and have the capacity to improve the quality, efficiency, and competitiveness of firms. These services also establish key links to the global economy. As a result, they are drivers of export growth. The availability of world-class business services at competitive prices will be crucial to China’s ability to move up the value chain in manufacturing—and continue its development in general.
The importance of the business services sector in developed economies is evident in US data. The busi-ness services sector in the United States accounted for 24 percent of the total labor force in 2012. Although the data for China are not as detailed as for the United States, it is possible to make rough comparisons between the sizes of these sectors in the two countries. The services sector accounted for only about 43 percent of China’s labor force in 2015 (figure 2). In the United States, this sector accounted for 86 percent of the labor force in 2012 (figure 3).
In urban areas in China, business services account for only about 13 percent of the labor force (figure 4). In the United States the figure was 24 percent in 2012 (figure 3). Assuming that nonurban services are unlikely to be business services, one would expect China’s overall business services sector to represent an even smaller share of employment than in urban areas.
Beyond being small, China’s services sector has relatively low labor productivity. Noland, Park, and Estrada (2012) document the shockingly low average level of productivity in China’s services sector—less
Figure 1 Shares of agriculture, industry, and services in China’s GDP, 1978–2014
Note: Industry includes manufacturing and construction.Source: Lardy (2012).
Agriculture
Industry
Services
0
10
20
30
40
50
60
share of GDP (percent)
1978 1981 1984 1987 1990 1993 1996 2002 2005 2008 2011 2014

94
Tertiary non-urban, 31%
Tertiary urban, 12%
Secondary non-urban, 19%
Secondary urban, 10%
Primary non-urban, 27%
Primary urban, 1%
Figure 2 Employment in China, by sector and urban/rural location, 2015
Source: National Bureau of Statistics of China, China Statistical Yearbook 2015.
Personal services, 27%
Business services, 24%
Government, 16%
Retail trade, 11%
Manufacturing, 8%
Wholesale trade, 4%
Construction, 4%
Transportation and warehousing, 3%
Agriculture, 2%Mining, 1%Utilities, 0%
Figure 3 Sectoral composition of employment in the United States, 2012
Sources: Economic Census, Census of Agriculture, Economic Report of the President.

95
than one-fifth the average level of OECD member countries and below the level of many other developing countries (figure 5).
Holz (2006) finds a large gap between the high rate of productivity growth in manufacturing and the much lower rate in services in the early reform period. He et al. (2012) find that this much slower growth in productivity persists. Ahuja (2012) claims that manufacturing productivity in the United States is 1.3 to 1.5 times higher than China but that the overall aggregate productivity level in the United States is 13 times higher than China.
China’s low level of exports to value added is another indicator of the lack of competitiveness in its services sector. Park and Shin (2012) find that the only developing Asian country with a lower ratio in services is Pakistan; Indonesia, Malaysia, and the Philippines are all much more successful exporters of services. The relatively small size and low level of productivity of China’s services sector are important impediments to continued economic growth and development.
WEAK HUMAN CAPITAL AS A BARRIER TO THE GROWTH OF BUSINESS SERVICES
Business services are qualitatively different from personal services (education, health, restaurants, and hotels); wholesale and retail trade; and manufacturing in one important dimension: skill intensity. Jensen (2011) finds that business services have a relatively high share of employees with higher education: About 44 percent of workers in the business services sector have a college degree—a much higher figure than the 23 percent in the manufacturing sector. The share of business services workers with an advanced degree (14 percent) is twice the share among manufacturing workers (7 percent).
The skill intensity of business services, in combination with the low levels of educational attainment for China’s older cohorts, helps explain the relatively small size and low productivity of China’s business
Manufacturing, 28%
Personal services, 17%
Construction, 15%
Business services, 13%
Public management andsocial organizations, 9%
Utilities, 8%
Wholesale and retail, 5%
Mining, 3%Agriculture, 2%
Figure 4 Sectoral composition of employment in urban areas in China, 2015
Source: National Bureau of Statistics of China, China Statistical Yearbook 2015.
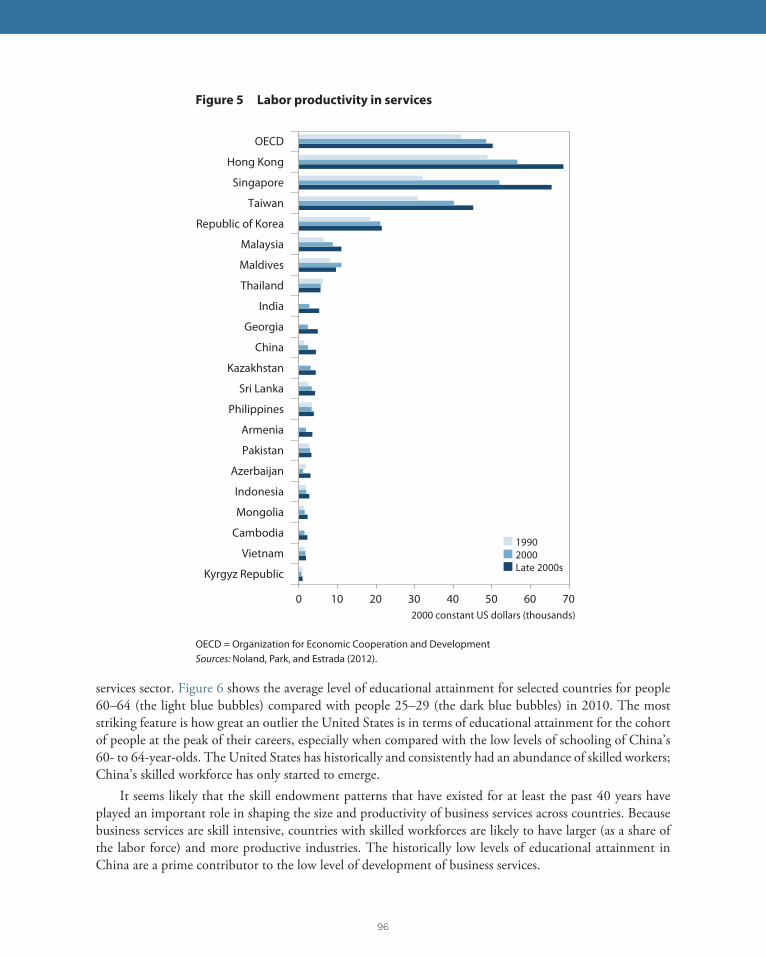
96
services sector. Figure 6 shows the average level of educational attainment for selected countries for people 60–64 (the light blue bubbles) compared with people 25–29 (the dark blue bubbles) in 2010. The most striking feature is how great an outlier the United States is in terms of educational attainment for the cohort of people at the peak of their careers, especially when compared with the low levels of schooling of China’s 60- to 64-year-olds. The United States has historically and consistently had an abundance of skilled workers;China’s skilled workforce has only started to emerge.
It seems likely that the skill endowment patterns that have existed for at least the past 40 years have played an important role in shaping the size and productivity of business services across countries. Because business services are skill intensive, countries with skilled workforces are likely to have larger (as a share of the labor force) and more productive industries. The historically low levels of educational attainment in China are a prime contributor to the low level of development of business services.
Figure 5 Labor productivity in services
OECD = Organization for Economic Cooperation and DevelopmentSources: Noland, Park, and Estrada (2012).
2000 constant US dollars (thousands)0 10 20 30 40 50 60 70
Kyrgyz Republic
Vietnam
Cambodia
Mongolia
Indonesia
Azerbaijan
Pakistan
Armenia
Philippines
Sri Lanka
Kazakhstan
China
Georgia
India
Thailand
Maldives
Malaysia
Republic of Korea
Taiwan
Singapore
Hong Kong
OECD
19902000Late 2000s

97
History is not destiny, however. One of the most striking features of figure 6 is the dramatic increase in average educational attainment across a range of emerging markets. As educational attainment in China converges with that in the United States, the size and productivity of the two countries’ business services will also likely converge. In the long run, increases in educational attainment will likely lead to higher productiv-ity in the services sector and improved access to these important intermediate inputs, which will increase productivity throughout the economy. A key question is whether China’s business services sector will grow large and more productive quickly enough to support economic growth in other important sectors and the economy overall.
THE CATALYTIC ROLE OF FOREIGN DIRECT INVESTMENT AND SERVICES TRADE
The China 2030 Report, coauthored by the World Bank and the Development Research Center of China’s State Council, notes that past price distortions and other policies have led to an overbuilt manufacturing sector and an underdeveloped services sector. The report strongly endorses the need to increase the role of the services sector in China’s GDP, calls for greater innovation in services, and argues that a more vibrant services sector can help Chinese manufacturers move up the value chain. It specifically endorses FDI liber-alization in services as a means of raising productivity in China’s services sector.
Jensen (2011) shows that business services are increasingly tradable and that the United States holds a strong comparative advantage in this sector. Even as the global economy has slowed in recent years, US exports of advanced services and the US trade surplus in services continued to grow (Economic Report of the President, 2015). As global leaders in services, US firms could make a powerful contribution to a more productive, more dynamic Chinese services sector.
IND
IDN
EGYCHN
BRA
TUR
MEX
RUS
KOR
ESP
JPN
ITA
FRA GBR
FINBEL
DEUCAN
AUT
AUSUSA
IND
IDN
EGY
CHN
BRATUR
MEX
RUS KOR
ESP
JPN
ITA
FRA
GBR
FIN BEL
DEU
CAN
AUT
AUS USA
0
2
4
6
8
10
12
14
16
Ages 25–29Ages 60–64
average years of schooling
Figure 6 Average years of schooling in selected countries, by age cohort, 2010
AUS = Australia, AUT = Austria, BEL = Belgium, CAN = Canada, EGY = Egypt, BRA = Brazil, FIN = Finland, FRA = France, GER = Germany, IND = India, IDN = Indonesia, ITA = Italy, JPN = Japan, KOR = South Korea, MEX = Mexico, PRC = China, RUS = Russia, SPA = Spain, TUR = Turkey, UKG = United Kingdom, USA = United States Note: Bubble size indicates the size of the workforce. Countries are ordered on the x-axis by GDP per capita in international dollars. Source: Barro and Lee (2013).
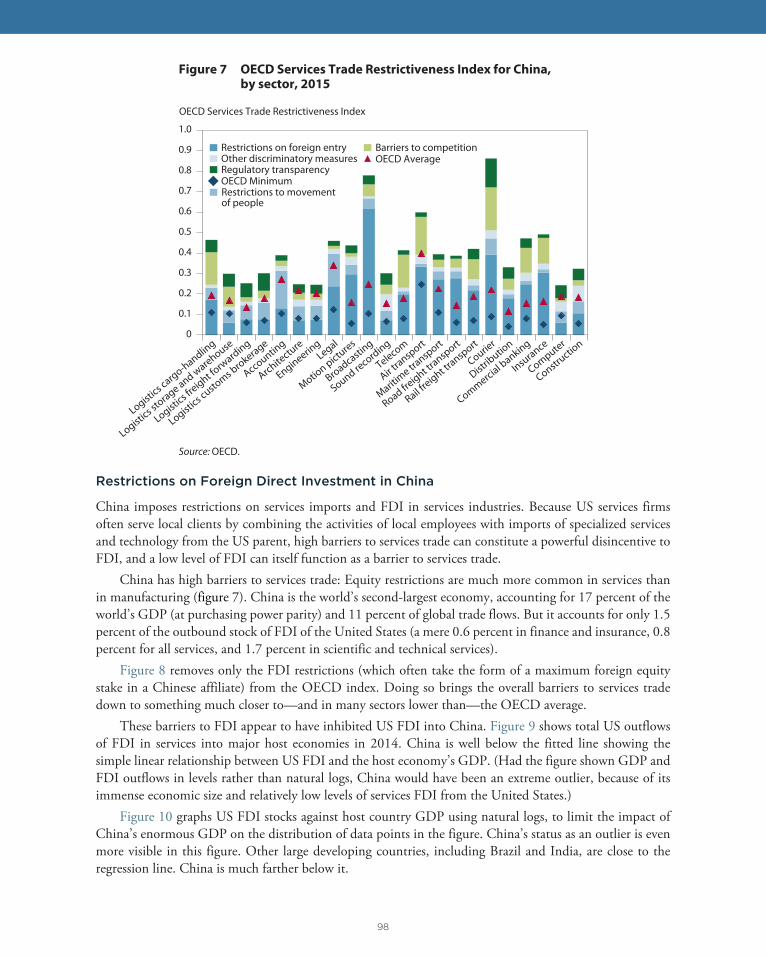
98
Restrictions on Foreign Direct Investment in China
China imposes restrictions on services imports and FDI in services industries. Because US services firms often serve local clients by combining the activities of local employees with imports of specialized services and technology from the US parent, high barriers to services trade can constitute a powerful disincentive to FDI, and a low level of FDI can itself function as a barrier to services trade.
China has high barriers to services trade: Equity restrictions are much more common in services than in manufacturing (figure 7). China is the world’s second-largest economy, accounting for 17 percent of the world’s GDP (at purchasing power parity) and 11 percent of global trade flows. But it accounts for only 1.5 percent of the outbound stock of FDI of the United States (a mere 0.6 percent in finance and insurance, 0.8 percent for all services, and 1.7 percent in scientific and technical services).
Figure 8 removes only the FDI restrictions (which often take the form of a maximum foreign equity stake in a Chinese affiliate) from the OECD index. Doing so brings the overall barriers to services trade down to something much closer to—and in many sectors lower than—the OECD average.
These barriers to FDI appear to have inhibited US FDI into China. Figure 9 shows total US outflows of FDI in services into major host economies in 2014. China is well below the fitted line showing the simple linear relationship between US FDI and the host economy’s GDP. (Had the figure shown GDP and FDI outflows in levels rather than natural logs, China would have been an extreme outlier, because of its immense economic size and relatively low levels of services FDI from the United States.)
Figure 10 graphs US FDI stocks against host country GDP using natural logs, to limit the impact of China’s enormous GDP on the distribution of data points in the figure. China’s status as an outlier is even more visible in this figure. Other large developing countries, including Brazil and India, are close to the regression line. China is much farther below it.
Figure 7 OECD Services Trade Restrictiveness Index for China, by sector, 2015
Source: OECD.
0
0.1
0.2
0.3
0.4
0.5
0.6
0.7
0.8
0.9
1.0
OECD Services Trade Restrictiveness Index
Restrictions on foreign entry
Restrictions to movement of people
Other discriminatory measuresBarriers to competition
Regulatory transparencyOECD Average
OECD Minimum
Logistics c
argo-handling
Logistics s
torage and warehouse
Logistics fr
eight forw
arding
Logistics c
ustoms b
rokerage
Accounting
Architecture
EngineeringLegal
Motion pictures
Broadcasting
Sound recording
Telecom
Air transp
ort
Maritime tra
nsport
Road freight tr
ansport
Courier
Commercial banking
Insurance
Computer
Constructio
n
Rail freight tr
ansport
Distrib
ution
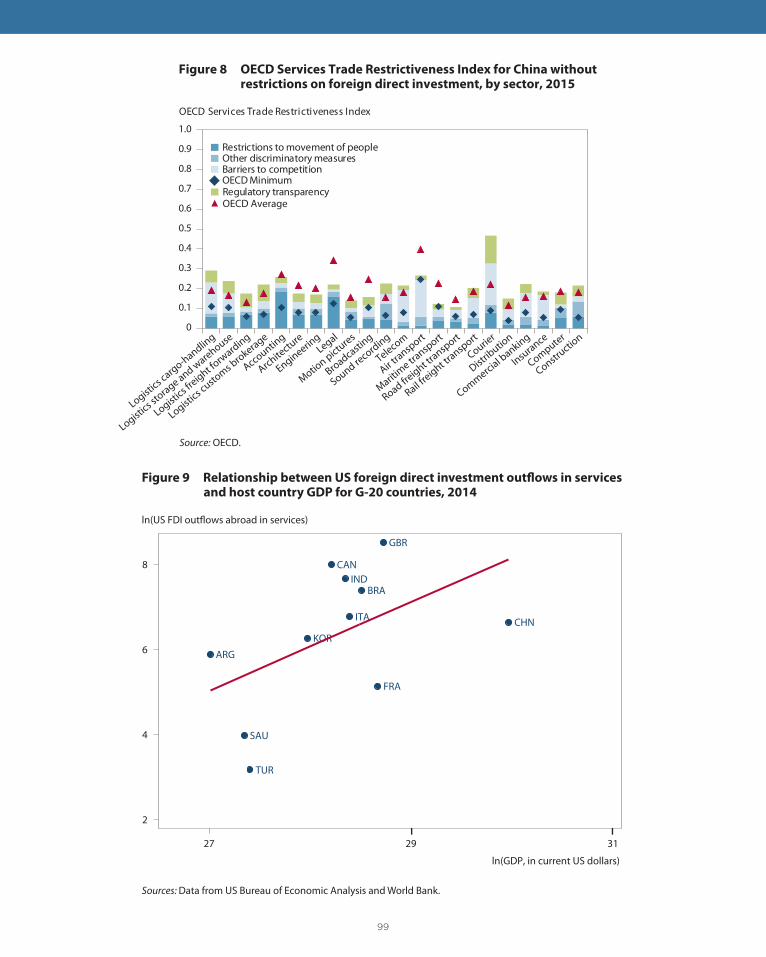
99
Figure 8 OECD Services Trade Restrictiveness Index for China without restrictions on foreign direct investment, by sector, 2015
Source: OECD.
Restrictions to movement of people
Regulatory transparency
Other discriminatory measuresBarriers to competition
OECD Average
OECD Minimum
Logistics c
argo-handling
Logistics s
torage and warehouse
Logistics fr
eight forw
arding
Logistics c
ustoms b
rokerage
Accounting
Architecture
EngineeringLegal
Motion pictures
Broadcasting
Sound recording
Telecom
Air transp
ort
Maritime tra
nsport
Road freight tr
ansport
Courier
Commercial banking
Insurance
Computer
Constructio
n
Rail freight tr
ansport
Distrib
ution
0
0.1
0.2
0.3
0.4
0.5
0.6
0.7
0.8
0.9
1.0
OECD Services Trade Restrictiveness Index
Figure 9 Relationship between US foreign direct investment outflows in services and host country GDP for G-20 countries, 2014
Sources: Data from US Bureau of Economic Analysis and World Bank.
BRA
CAN
CHN
FRA
GBR
IND
ITA
KOR
SAU
TUR
ARG
2
4
6
8
ln(US FDI outflows abroad in services)
27 29 31
ln(GDP, in current US dollars)
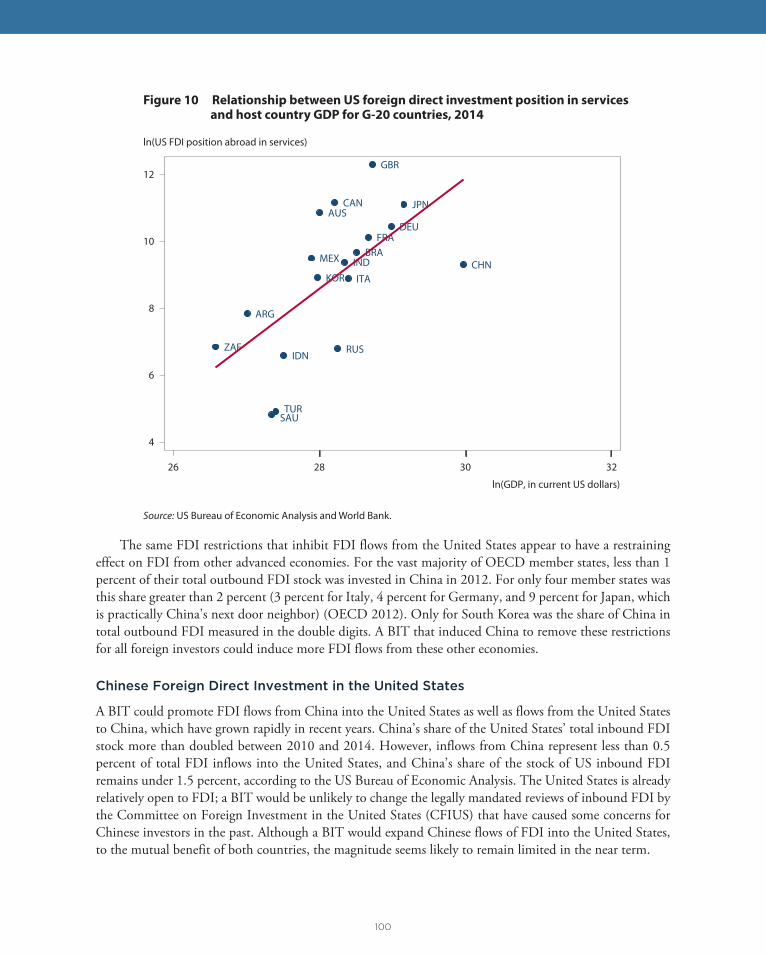
100
The same FDI restrictions that inhibit FDI flows from the United States appear to have a restraining effect on FDI from other advanced economies. For the vast majority of OECD member states, less than 1 percent of their total outbound FDI stock was invested in China in 2012. For only four member states was this share greater than 2 percent (3 percent for Italy, 4 percent for Germany, and 9 percent for Japan, which is practically China’s next door neighbor) (OECD 2012). Only for South Korea was the share of China in total outbound FDI measured in the double digits. A BIT that induced China to remove these restrictions for all foreign investors could induce more FDI flows from these other economies.
Chinese Foreign Direct Investment in the United States
A BIT could promote FDI flows from China into the United States as well as flows from the United States to China, which have grown rapidly in recent years. China’s share of the United States’ total inbound FDI stock more than doubled between 2010 and 2014. However, inflows from China represent less than 0.5 percent of total FDI inflows into the United States, and China’s share of the stock of US inbound FDI remains under 1.5 percent, according to the US Bureau of Economic Analysis. The United States is already relatively open to FDI; a BIT would be unlikely to change the legally mandated reviews of inbound FDI by the Committee on Foreign Investment in the United States (CFIUS) that have caused some concerns for Chinese investors in the past. Although a BIT would expand Chinese flows of FDI into the United States, to the mutual benefit of both countries, the magnitude seems likely to remain limited in the near term.
Figure 10 Relationship between US foreign direct investment position in services and host country GDP for G-20 countries, 2014
Source: US Bureau of Economic Analysis and World Bank.
AUS
BRA
CAN
CHN
DEUFRA
GBR
IND
ITA
JPN
KOR
MEX
SAU
ZAF
TUR
ARG
IDNRUS
4
6
8
10
12
ln(US FDI position abroad in services)
26 28 30 32
ln(GDP, in current US dollars)

101
Effect of Foreign Direct Investment on Productivity
Increased FDI flows raise the productivity of the services sector through a series of well-understood chan-nels. Higher FDI leads to the introduction of new and better services offered, in part, by local subsidiaries of foreign firms.1 These services raise the productivity of the local services sector directly; they also raise the productivity of manufacturing firms that purchase these services. As indigenous Chinese firms contend with the competitive pressures created by high-performing foreign affiliates, they are forced to become more productive, further increasing productivity. One way Chinese services firms might build their capabilities is by acquiring small, specialized providers in the United States. Healthy competition would lower the costs and raise the quality of business services in China and create strong incentives for further innovation.
Mattoo, Rathindran, and Subramanian (2006) find that countries that open up their telecommunica-tions and financial sectors grow up to 1.5 percentage points faster than countries that do not. The IMF (2013) has suggested that China could boost its growth by a full percentage point a year through 2030 if it embraced such openness. A series of World Bank studies summarized by Tarr (2012) finds that significant liberalization in services had far-reaching productivity effects in the transition economies of Eastern Europe and the former Soviet Union. In Ukraine labor productivity in the services sector more than doubled between 2001 and 2007, yielding large gains in the total factor productivity of manufacturing. In India access to management consulting services increased the productivity of Indian manufacturing firms by 17 percent almost immediately, according to Bloom et al. (2013).
Measuring the Potential Benefits of Opening China’s Services Sector to Foreign Competition
Estimating the impact of these various channels is difficult when detailed data are available; it is very diffi-cult when key data are missing. “Back-of-the-envelope” calculations can be made, however, using estimates from the literature (table 1).
Figure 11 shows the sectoral composition of China’s GDP. Although no services sector alone is as large as the manufacturing sector, the services sector as a whole accounts for 48 percent of GDP.2 Because of the large size of the service sector, increases in productivity in the service sector can have important effects on aggregate productivity.
According to the IMF (2013), substantial liberalization in services could raise output growth in China by a full percentage point a year through 2030. If implemented in 2018, it could lead to cumulative expan-sion of China’s real GDP on the order of $3.7 trillion (RMB25.1 trillion) by 2030—an almost 13 percent increase in China’s GDP relative to the baseline.3
1. The studies documented in Tarr (2012) provide striking evidence along these lines.
2. The services sector includes other services, wholesale and retail trade, fi nancial intermediation, real estate,transport, storage and post, and hotels and catering.
3. The arithmetic behind this calculation is straightforward. The baseline level of GDP through 2030 isestimated by multiplying the 2014 offi cial nominal GDP (in dollars) by the offi cial GDP growth rate for 2015to yield an estimate of the level of GDP in 2015 and then using growth projections developed by researchersaffi liated with UBS for China in 2016 and 2017 to calculate GDP for those years. For 2018–30, President XiJinping’s offi cial growth target of 6.5 percent was used. To the extent that the offi cial growth target exceedsChina’s real growth capacity—a likely outcome in the absence of signifi cant reform—using it biases the base-line level of GDP in 2030 ($28.3 trillion) upward. Since research undertaken by the IMF suggests that servicesliberalization could raise GDP growth by a full percentage point, we add one percentage point to each year’sGDP growth in our baseline scenario, yielding a projected GDP level of $32.3 trillion by 2030.
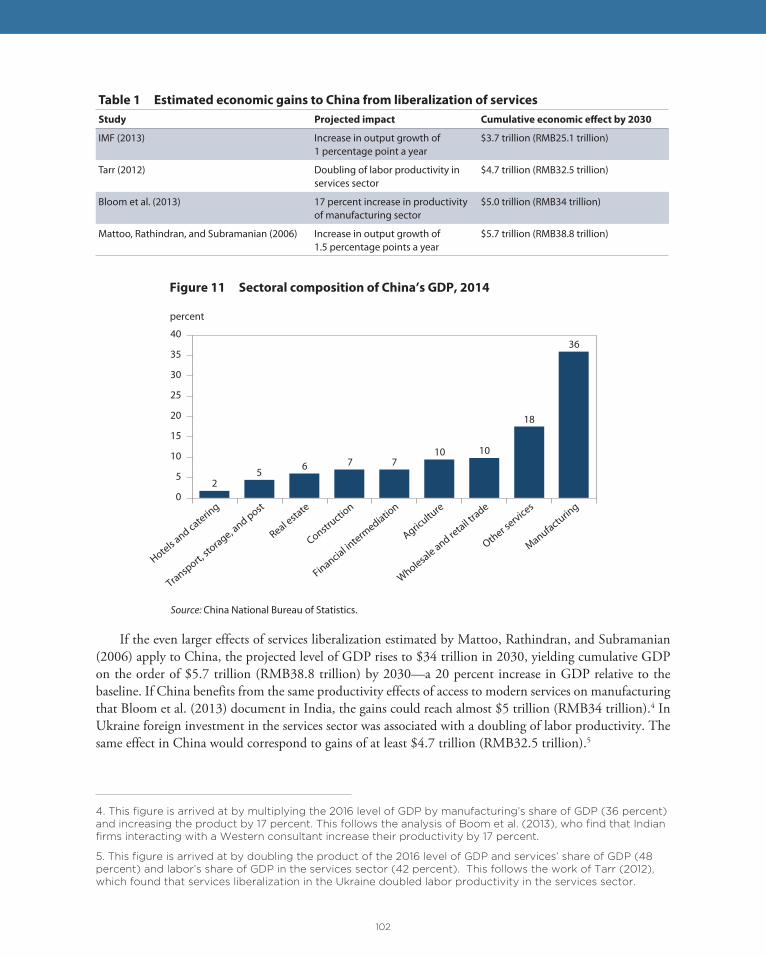
102
If the even larger effects of services liberalization estimated by Mattoo, Rathindran, and Subramanian (2006) apply to China, the projected level of GDP rises to $34 trillion in 2030, yielding cumulative GDP on the order of $5.7 trillion (RMB38.8 trillion) by 2030—a 20 percent increase in GDP relative to the baseline. If China benefits from the same productivity effects of access to modern services on manufacturing that Bloom et al. (2013) document in India, the gains could reach almost $5 trillion (RMB34 trillion).4 In Ukraine foreign investment in the services sector was associated with a doubling of labor productivity. The same effect in China would correspond to gains of at least $4.7 trillion (RMB32.5 trillion).5
4. This fi gure is arrived at by multiplying the 2016 level of GDP by manufacturing’s share of GDP (36 percent)and increasing the product by 17 percent. This follows the analysis of Boom et al. (2013), who fi nd that Indianfi rms interacting with a Western consultant increase their productivity by 17 percent.
5. This fi gure is arrived at by doubling the product of the 2016 level of GDP and services’ share of GDP (48percent) and labor’s share of GDP in the services sector (42 percent). This follows the work of Tarr (2012),which found that services liberalization in the Ukraine doubled labor productivity in the services sector.
Table 1 Estimated economic gains to China from liberalization of services
Study Projected impact Cumulative economic effect by 2030
IMF (2013) Increase in output growth of 1 percentage point a year
$3.7 trillion (RMB25.1 trillion)
Tarr (2012) Doubling of labor productivity in services sector
$4.7 trillion (RMB32.5 trillion)
Bloom et al. (2013) 17 percent increase in productivity of manufacturing sector
$5.0 trillion (RMB34 trillion)
Mattoo, Rathindran, and Subramanian (2006) Increase in output growth of 1.5 percentage points a year
$5.7 trillion (RMB38.8 trillion)
Source: China National Bureau of Statistics.
Figure 11 Sectoral composition of China’s GDP, 2014
25 6 7 7
10 10
18
36
0
5
10
15
20
25
30
35
40
percent
Manufacturing
Hotels and caterin
g
Transport,
storage, and post
Real esta
te
Constructio
n
Financial interm
ediation
Agricultu
re
Wholesale and retail t
rade
Other services

103
While the effects of all of these scenarios seem implausibly large, they rest on two solid economic reali-ties: the relatively low level of services sector productivity in China and the well-documented ability of a thorough opening to foreign investment and trade to significantly accelerate the rate of convergence in the productivity of developing and developed countries. These scenarios generally envision a broad opening of the Chinese services sector to new entry by domestic enterprises as well as foreign firms headquartered in multiple countries. Such a broad opening would, of course, require far more than just a BIT with the United States. While the portion of these gains that could be directly attributable to a US-China BIT would be limited, the impact of a robust US-China BIT could be catalytic to other changes. Indeed, the history of Chinese economic reform points to the importance of agreements with foreign trading and investment partners as a spur and a mechanism for policy changes that open up opportunities for indigenous entrepre-neurs (Lardy 2004). Chinese reformer and former premier Zhu Rongji used the concessions China’s World Trade Organization trading partners required in return for accession as a pathway to pursue market-oriented reforms that would have been politically infeasible without those externally imposed demands. In a similar fashion, a high-standards US-China BIT could become a catalyst for more sweeping policy change that would potentially yield huge increases in output.
Reducing the Scope of China’s Negative List
BITs are complicated agreements; space constraints do not permit a detailed discussion of all the features a best-case BIT would contain. However, the most important attribute of a high-standard BIT is its scope. Political considerations may lead China to push for a “negative list” that excludes many of its services industries from the purview of a BIT. Excluding important sectors from a BIT would undermine the enor-mous potential long-run benefits to China of increased FDI in services. Policymakers may be tempted to think that going halfway toward full liberalization might deliver half of the benefits calculated above. That outcome is extremely unlikely, as the effects of heavy regulation of services sectors are probably multipli-cative, not additive, because the services sector provides key inputs to the manufacturing and agricultural sectors. The influential theoretical work of Kremer (1994) shows how the weaknesses of individual sectors can compromise quality and growth prospects at the aggregate level. The effect on Chinese entrepreneurs of underperforming and inefficient financial, information services, ground transportation, air transportation, energy generation/delivery, and telecommunications sectors is enormous.
Liberalizing can yield potentially large gains in all of these sectors. Reforming only some of them would generate only a small fraction of the gains of complete liberalization. The relative economic success of Australia (which has pursued a very thorough and complete program of services liberalization since the early 1980s) and Japan (which has liberalized services in a far more halfhearted, piecemeal fashion) should serve as a stern warning to Chinese policymakers who would embrace half measures at this critical juncture in China’s economic development.
REFERENCESAhuja, A. 2012. De-Monopolization toward Long-Term Prosperity in China. Working Paper 12/17. Washington: International Monetary Fund.
Barro, Robert and Jong-Wha Lee. 2013. A New Data Set of Educational Attainment in the World, 1950-2010. Journal of Development Economics 104: 184–98.
Bloom, N., B. Eifert, A. Maha jan, D. McKenzie, and J. Roberts. 2013. Does Management Matter? Evidence from India. Quarterly Journal of Economics 128, no. 1: 1–51.
He, D., W. Zhang, G. Hu, and T. Wu. 2012. Productivity Growth of the Nontradable Sectors in China. Working Paper 8. Hong Institute for Monetary Research.
104
Holz, Carsten. 2006. Measuring Chinese Productivity Growth: 1952–2005. Unpublished manuscript.
IMF (International Monetary Fund). 2013. People’s Republic of China: 2013 Article IV Consultation. Country Report 13/211. Washington.
Jensen, J. B. 2011. Global Trade in Services: Fear, Facts, and Offshoring. Washington: Peterson Institute for International Economics.
Kremer, M. 1993. The O-Ring Theory of Economic Development. Quarterly Journal of Economics 108, no. 3: 551–76.
Lardy, N. 2004. Integrating China into the Global Economy. Washington: Brookings Institution.
Lardy, N. 2012. Sustaining China’s Economic Growth after the Global Financial Crisis. Washington: Peterson Institute for International Economics.
Lardy, N. 2014. Markets over Mao: The Rise of Private Business in China. Washington: Peterson Institute for International Economics.
Mattoo, A., R. Rathindran, and A. Subramanian. 2006. Measuring Services Trade Liberalization and its Impact on Economic Growth: An Illustration. Journal of Economic Integration 21, no. 1: 64–98.
Noland, M., Park, D. and Estrada, G. 2012. Developing the Service Sector as Engine of Growth for Asia: an Over-view. ADB Economics Working Paper Series no. 320. Manila: Asian Development Bank.
Park, D., and M. Noland. 2013. Developing the Service Sector as an Engine of Growth for Asia. Manilla: Asian Development Bank.
Park, D., and K. Shin. 2012. The Service Sector in Asia: Is It An Engine of Growth? Working Paper 322. Manilla: Asian Development Bank.
Schott, J., and C. Cimino, eds. 2015. Towards a US-China Investment Treaty. PIIE Breifing 15-1. Washington: Peterson Institute for International Economics.
Tarr, D. 2012. Impact of Services Liberalization on Industry Productivity, Exports, and Development: Six Empiri-cal Studies in Transition Countries. Policy Research Working Paper 6023. Washington: World Bank.
World Bank, and the Development Research Center of the State Council, People’s Republic of China. 2013. China 2030: Building a Modern, Harmonious, Creative Society. Washington and Beijing.
105
CHAPTER 11
China-US Bilateral Investment Guo Kai, Wang Bijun, and Yang Yuanchen© CF40
The complementarity of the Chinese and US economies and the transformation and upgrading of China’s economy are the main driving forces behind bilateral investment between the two countries. A high-stan-dard bilateral investment treaty could help the two countries realize the huge potential of bilateral invest-ment. Crucial to negotiating it is a good understanding of conditions in the two countries, the avoidance of extreme measures, the adoption of different approaches for different industries, and addressing sensitive concerns on both sides.
CHINESE AND US ECONOMIES: HUGE DIFFERENCES, HIGHLY COMPLEMENTARY
The economies of the United States and China are highly complementary in terms of both factors of production (table 1) and industrial structure, creating huge opportunities for mutual benefits.
The United States is more capital intensive, has a better-educated workforce, and is more technologi-cally advanced than China. China’s stock of capital is 42 percent that of the United States (10 percent on a per capita basis).1 In 2014 the share of workers with at least a high school diploma was 36 percent in China and 90 percent in the United States.2 Unlike most Chinese firms, many American companies are at the cutting edge of international technology. The R&D input in 2015 in the United States is twice that of China, and the number of scientific researchers per million people is four times that of China.
Corresponding to these differences are huge differences in industrial structures and labor productivity. Value-added in the primary (natural resources) sector is 8 percent in China and 1 percent in the United States. The secondary (manufacturing) sector accounts for 20 percent of GDP in China and 12 percent in the United States. The tertiary (services) industry accounts for 53 percent of GDP in China and 79 percent
1. In 2015 the US capital stock was $59.32 trillion (RMB382 trillion, or RMB1.19 million per capita), accordingto the US Bureau of Economic Analysis. China’s capital stock was about RMB160 trillion (RMB120,000 percapita), according to various estimates (Zhang and Zhang 2003, Shan 2008, Lei and Zhang 2014).
2. Central University of Finance and Economics, 2016, China Human Capital Report.
Guo Kai is deputy director-general of the International Department, People’s Bank of China. Wang Bijun is assistant research fellow at the Chinese Academy of Social Sciences. Yang Yuanchen is a PhD candidate at the People’s Bank of China School of Finance, Tsinghua University.

106
in the United States. Agriculture and manufacturing thus dominate China’s economy, whereas services dominate the US economy. Labor productivity in the United States is higher than in China in all three sectors, with average labor productivity five times that of China.
The volume of bilateral trade between China and the United States was $519.6 billion in 2016—more than 200 times the 1979 level of $2.5 billion.3 China imports chips, airplanes, and other high value-added, capital- and technology-intensive products from the United States. It exports textile products, plastic products, and other low value-added, labor-intensive products to the United States. The volume of services trade between China and the United States exceeded $100 billion in 2016, with the United States running a suplus against China.
CURRENT SITUATION AND DRIVING FORCES
China’s Overseas Direct Investment in the United States
For the first time in history, China’s overseas direct investment (ODI) ranked second in the world in 2016, after that of the United States. Nonfinancial ODI hit a record high of $170.11 billion, a 40 percent increase over 2015. China’s nonfinancial ODI flows have risen every year since 2003, growing at an average annual rate of 38 percent (MOFCOM et al. 2016).
ODI in manufacturing increased 109 percent in 2015, with ODI in external equipment manufacturing rising 158 percent to top $10 billion (this sector accounted for half of all investment in manufacturing). Investment in cultural/sports and entertainment, accommodation and catering, water/environment and public facilities management, information transmission/software and information technology, and scientific research and technical services grew at 100.6 to 236.6 percent in 2015 (MOFCOM et al. 2016). ODI in mining continued to plummet, falling 32 percent in 2015 to $11.16 billion) which was only 45 percent that of 2013.
In 2015 the United States became China’s fifth-largest destination for ODI (MOFCOM et al. 2016). Cumulative Chinese investment in the United States reached $40.8 billion, 3.7 percent of total Chinese ODI. Between 2004 and 2015, the average growth rate of China’s investment in the United States was 58 percent, 14 percentage points higher than the overall increase in China’s ODI (44 percent).
These official Chinese data may underestimate the scale of ODI in the United States, because some investment was reinvestment by platform companies set up by Chinese firms in Hong Kong, the Cayman
3. Ministry of Commerce press conference, January 19, 2017.
Table 1 Factors of production in China and the United States, 2015
Factor China United States
Capital stock (trillions of renminbi) 160 382
Capital stock per capita (10,000 renminbi) 12 119
Workforce (100 million) 8 1.6
Average years of schooling 7.5 12.9
Scientific research funds (trillions of renminbi) 1.4 3
Number of researchers (per million people) 1,000 4,000
Sources: Bureau of Economic Analysis; National Bureau of Statistics; World Bank; United Nations Development Program.

107
Islands, and other regions. According to the US Bureau of Economic Analysis, the average annual increase in China’s ODI in the United States between 2004 and 2015 was 34 percent.
China’s ODI in the United States is concentrated in the manufacturing and financial industries, which account for 26.3 and 25.3 percent of China’s ODI stock in the United States, respectively, according to official Chinese sources (table 2). In recent years China’s direct investment in advanced manufacturing, consumption, and high-tech industries increased significantly. In 2015 China’s ODI in US manufacturing increased 122 percent and accounted for half of its total investment flows in the United States. The leasing and business service sector ranked the second. Investment in scientific research and technical services ranked the third (accounting for 15 percent of total investment), with a year-on-year growth rate of 447 percent. Investment in cultural and sports, information transmission, computer services, and the software industry also grew rapidly.
The United States also provides data on China’s ODI in the United States (table 3). Although US and Chinese industry classifications differ, both sets of data show similar distributions. According to US data, the financial industry accounted for 22.6 percent of total Chinese ODI in the United States, and manufac-turing accounted for 21.8 percent, followed by high-tech industry (such as electronics and information 4.2 percent), which grew rapidly.
Table 2 Distribution of China’s direct investment in the United States, by industry (in 10,000 US dollars)
Industry Flow Percent share Stock Percent share
Manufacturing 400,845 49.9 1,071,882 26.3
Leasing and Business Services 223,931 27.9 371,605 9.1
Scientific Research and Technical Services 122,763 15.3 182,094 4.5
Wholesale and Retail Trade 89,439 11.1 341,005 8.4
Construction 40,002 5 95,747 2.3
Culture, Sports and Entertainment 37,514 4.7 53,253 1.3
Information Transmission, Software and Information Technology
31,031 3.9 54,596 1.3
Real Estate 18,352 2.3 340,602 8.3
Agriculture, Forestry, Animal Husbandry and Fishery 8,651 1.1 22,122 0.5
Hotels and Catering Services 7,999 1 31,505 0.8
Services to Households, Repair and Other Services 6,891 0.9 36,491 0.9
Management of Water, Conservancy, Environment and Public Facilities
6,372 0.8 40,614 1
Education 4,341 0.5 7,609 0.2
Production and Supply of Electricity, Heat, Gas and Water
3,063 0.4 39,630 1
Transport, Storage and Post 1,874 0.2 67,201 1.6
Other Industries 113 0.1 2,498 0.1
Financial Intermediation –44,700 –5.6 1,031,535 25.3
Mining –155,614 –19.4 290,206 7.1
Total 802,867 100 4,080,195 100
Source: MOFCOM et al. (2016).
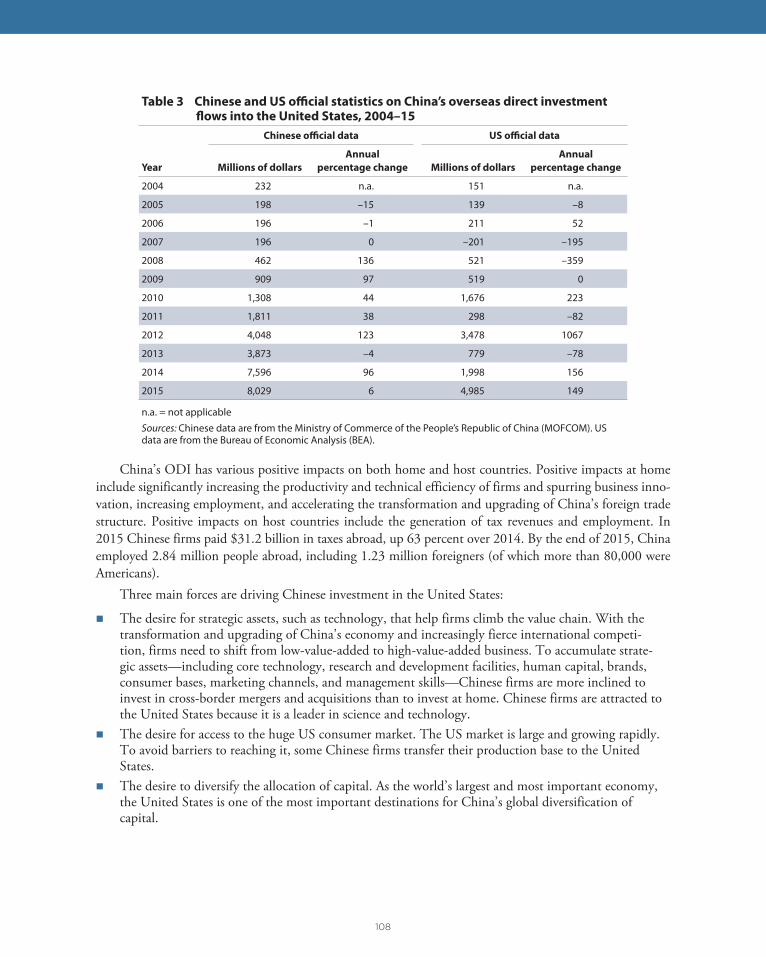
108
China’s ODI has various positive impacts on both home and host countries. Positive impacts at home include significantly increasing the productivity and technical efficiency of firms and spurring business inno-vation, increasing employment, and accelerating the transformation and upgrading of China’s foreign trade structure. Positive impacts on host countries include the generation of tax revenues and employment. In 2015 Chinese firms paid $31.2 billion in taxes abroad, up 63 percent over 2014. By the end of 2015, China employed 2.84 million people abroad, including 1.23 million foreigners (of which more than 80,000 were Americans).
Three main forces are driving Chinese investment in the United States:
The desire for strategic assets, such as technology, that help firms climb the value chain. With thetransformation and upgrading of China’s economy and increasingly fierce international competi-tion, firms need to shift from low-value-added to high-value-added business. To accumulate strate-gic assets—including core technology, research and development facilities, human capital, brands,consumer bases, marketing channels, and management skills—Chinese firms are more inclined toinvest in cross-border mergers and acquisitions than to invest at home. Chinese firms are attracted tothe United States because it is a leader in science and technology.
The desire for access to the huge US consumer market. The US market is large and growing rapidly.To avoid barriers to reaching it, some Chinese firms transfer their production base to the UnitedStates.
The desire to diversify the allocation of capital. As the world’s largest and most important economy,the United States is one of the most important destinations for China’s global diversification ofcapital.
Table 3 Chinese and US official statistics on China’s overseas direct investment flows into the United States, 2004–15
Chinese official data US official data
Year Millions of dollars
Annual
percentage change Millions of dollars
Annual
percentage change
2004 232 n.a. 151 n.a.
2005 198 –15 139 –8
2006 196 –1 211 52
2007 196 0 –201 –195
2008 462 136 521 –359
2009 909 97 519 0
2010 1,308 44 1,676 223
2011 1,811 38 298 –82
2012 4,048 123 3,478 1067
2013 3,873 –4 779 –78
2014 7,596 96 1,998 156
2015 8,029 6 4,985 149
n.a. = not applicableSources: Chinese data are from the Ministry of Commerce of the People’s Republic of China (MOFCOM). US data are from the Bureau of Economic Analysis (BEA).

109
US Foreign Direct Investment in China
According to data from the Ministry of Commerce of the People’s Republic of China (MOFCOM), US direct investment in China totaled $3.82 billion in 2016, up 83 percent over 2015, a record high. Although there are huge discrepancies between official data from China and the United States, the US data also show a rising trend.
Early on, the electronics and computer industries were important recipients of US foreign direct invest-ment (FDI). Their shares have declined in recent years, while the shares of transportation, finance, food, and some other industries have increased. In 2015, the manufacturing sector accounted for nearly 60 percent of US FDI in China; the proportion of low-value-added mining fell sharply; while the proportion of transpor-tation and transportation equipment industry rose. The proportion of investment in industries that provide direct services to consumers have also risen steadily (figure 1). The importance of the financial sector has fluctuated. During the 2008–10 financial crisis, FDI in the sector contracted sharply. It accounted for less than 1 percent in 2009 but stabilized at about 10 percent in 2011.
US multinational companies operating in China had assets of $575 billion in 2014, up 41 percent over the previous year, according to a survey conducted by the Bureau of Economic Analysis. Nearly 40 percent of the assets were in manufacturing; 30 percent were in the financial industry; and 30 percent were in whole-sale and retail sales, information technology, and other industries. The average annual return on assets was 7 percent (8 percent in manufacturing industry). These returns were higher than the average return on FDI by US multinationals.
Several features drive US FDI in China. They include the low cost of production, the ability to integrate into global industrial chains, and China’s huge consumer market. Consumer retail sales in China reached RMB3.32 trillion in 2016, a 10.4 percent increase over 2015.
PROSPECTS FOR CHINA-US INVESTMENT
The potential for increasing US-China bilateral investment is huge, because China accounted for just 2 percent of US as of the end 2015 (suggesting vast room to grow) and the basic factors that drive bilateral investment—the complementarities between two economies—are likely to remain for many years. The search for technology and markets and the demand for globally diversified capital allocation will continue to drive China’s ODI. If the United States can expand its activities in China in the context of China’s stimula-tion of its domestic demand, the two sides can help one another achieve long-term sustainable development.
Better trade relations between the world’s largest economies requires attention to some areas of mutual concern. They include the business environment, fair competition, access restrictions, data flow and infor-mation technology, national security reviews, intellectual property protection, and related fields.
Business Environment
With the phasing out of preferential policies for foreign investors and the stricter review of foreign busi-nesses, some firms operating in China believe that the business environment has deteriorated. In a survey by the American Chamber of Commerce in early 2017, 81 percent of surveyed companies reported feeling “more unpopular” in China, up from 77 percent in 2016. A study by the Asia Society reported that opening up had slowed and reforms were stagnant.4
4. American Chamber of Commerce in China, 2017, China Business Climate Survey Report.
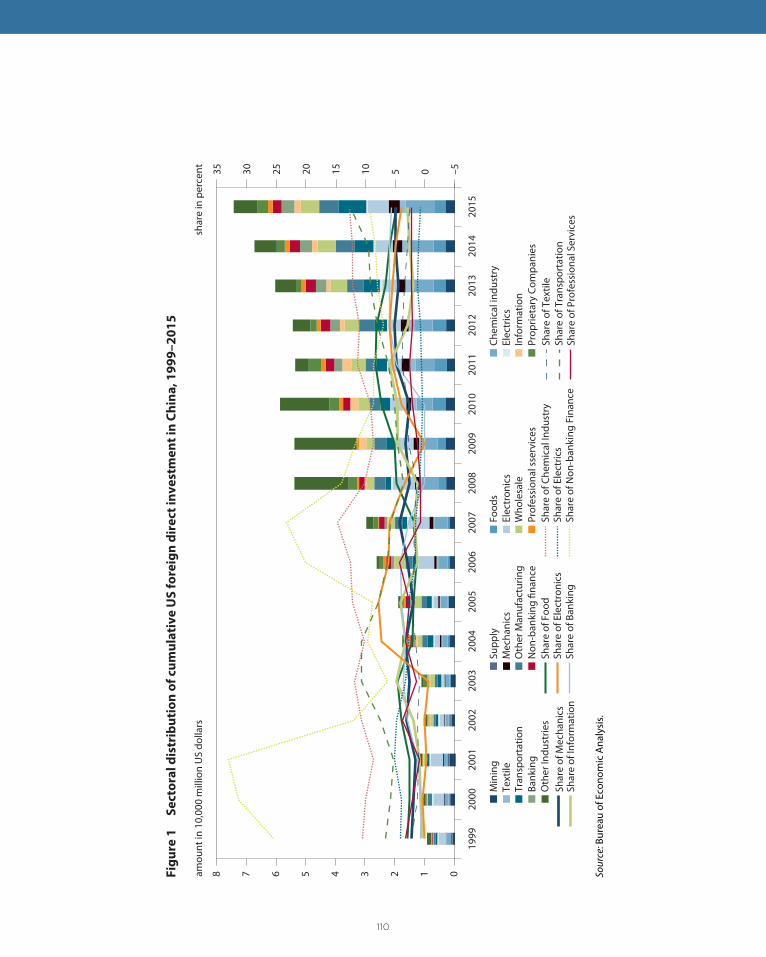
110
–505101520253035
012345678
1999
2000
2001
2002
2003
2004
2005
2006
2007
2008
2009
2010
2011
2012
2013
2014
2015
Min
ing
Supp
lyFo
ods
Chem
ical
indu
stry
Text
ileM
echa
nics
Elec
tron
ics
Elec
tric
sTr
ansp
orta
tion
Oth
er M
anuf
actu
ring
Who
lesa
leIn
form
atio
nBa
nkin
gN
on-b
anki
ng fi
nanc
ePr
ofes
sion
al s
serv
ices
Prop
rieta
ry C
ompa
nies
Oth
er In
dust
ries
Shar
e of
Foo
dSh
are
of C
hem
ical
Indu
stry
Shar
e of
Tex
tile
Shar
e of
Mec
hani
csSh
are
of E
lect
roni
csSh
are
of E
lect
rics
Shar
e of
Tra
nspo
rtat
ion
Shar
e of
Info
rmat
ion
Shar
e of
Ban
king
Shar
e of
Non
-ban
king
Fin
ance
Shar
e of
Pro
fess
iona
l Ser
vice
s
amou
nt in
10,
000
mill
ion
US
dolla
rssh
are
in p
erce
nt
Sour
ce: B
urea
u of
Eco
nom
ic A
naly
sis.
Fig
ure
1
Se
cto
ral
dis
trib
uti
on
of
cu
mu
lati
ve
US
fo
reig
n d
ire
ct
inv
est
me
nt
in C
hin
a,
19
99
–2
01
5
111
The World Bank’s Doing Business Report, which measures the ease of doing business in almost 200 countries, ranked China ranked 90th in 2015, 84th in 2016, and 78th in 2017. These figures indicate that although still in the middle reaches, China’s business environment is improving. The data thus do not support US companies’ sense that the business environment is deteriorating.
Firms’ negative impressions may reflect several factors. First, with the Chinese market becoming increas-ingly important, more US companies are willing to enter China. High expectations and the gap between expectations and reality may cause them to believe that China no longer welcomes foreign investment.
Second, more foreign firms have entered enter industries with relatively low levels of openness. With China’s economic transformation and upgrading, more and more US firms in financial services, culture, communications, and education would like to enter the Chinese market. These companies face a more difficult environment than manufacturers.
Third, in the context of China’s economic transformation and upgrading, firms face a more complex business environment. GDP in China rose by an average annual rate of 10.4 percent between 2000 and 2008; it fell to “just” 6.7 percent in 2016. Meanwhile, the return on investment of Chinese firms fell from 8 to 10 percent in 2000–08 to 2 to 3 percent.5 Rising labor costs, changes in industrial policy, and other factors have increased competition, putting more pressure on both Chinese and foreign firms to survive.
Fourth, US companies in China once benefited from special treatment from local governments. Recently, the central government has prohibited local governments from adopting preferential policies, emphasizing that all firms be treated equally. Some foreign firms have interpreted the end of special treat-ment as discrimination.
Fifth, the competitiveness of domestic firms in China is growing, putting pressure on foreign firms. Tencent, Alibaba, and other Chinese firms are in the vanguard of the mobile payment innovation. They have increased competitive pressure on foreign companies operating in China.
Fair Competition
The Asia Society reports in 2017 that the Chinese government has introduced a series of policies that heavily favor state-owned and local Chinese enterprises.6 These measures include supporting state-owned enterprises (SOEs) through credit, subsidies, and other policy instruments; encouraging SOEs to gain market share; setting mandatory technology transfer requirements of for foreign companies that want to enter the Chinese market; and engaging in discriminatory law enforcement with respect to foreign firms and investors. These policies have exacerbated distortions in the market, putting US companies at a competitive disadvantage. The United States would like China to promote reform, reduce subsidies and policy support to SOEs, and promote fair competition.
Access Restrictions
China still restricts (in full or in part) foreign investment in food processing, finance, culture and publishing, communications, education, and energy. For example, the revised Establishment of Securities Companies with Foreign Equity Participation Rules, issued in October 2012, stipulates that foreign shareholders shall not hold more than 49 percent of total shares. The United States would like China to relax foreign invest-
5. Return on Investment Experiences Ten Consecutive Years of Decline, Shanghai Securities News, June 7,2016.
6. Asia Society, 2017, US Policy Toward China: Recommendations for a New Administration.
112
ment access, including by raising the ratio that a foreign financial institution can invest in securities and fund management companies.
The United States is more open to foreign investment and has fewer access restrictions than China does. Chinese concerns reflect past cases in which Chinese investors were discriminated against or confronted political resistance (examples include CNOOC’s acquisition of Unocal and Bain and Huawei’s acquisition of 3Com).
Data Flow and Information Technology
China’s network security law stipulates that personal information and important data that operators of criti-cal information infrastructure collect and generate in China must be stored in China. Implementation of its network security review system aimed at information and communication products calls for the use of “secure and controllable” technology and requires the banking sector to use domestic password algorithms.
The United States would like China to relax the restrictions on data flow and the relevant requirements for local data storage and modify the unnecessary security review system and data security licensing system to ensure that the definition of “secure and controllable” technology is nondiscriminatory and will not damage the protection of intellectual property rights of relevant firms and that all technical safety measures should be consistent with the WTO rules and international best practice.
National Security Reviews
National security reviews can be obstacles to bilateral investment. Chinese firms believe that the Committee on Foreign Investment in the United States (CFIUS), which is responsible for reviewing foreign investment, is limiting their investment in US cultural, media, communications, and semiconductor and other high-tech companies for national security reasons. Some US senators have called for the expansion of CFIUS authority to strengthen the national security review of China’s investment in the United States. China would like the United States to increase the transparency and fairness of its national security review and oppose all kinds of investment protection and discriminatory behaviors based on national security review.
Some of these concerns may be valid. But Chinese firms may also be confusing other obstacles, such as difficulty communicating or dealing with legal and political risks in the United States, with security review issues.
China’s draft Foreign Investment Law stipulates its national security review. The regulation is still under development. The United States remains concerned about the scope and procedures of the review and worries that it will become a new barrier to investment.
Intellectual Property Protection
Despite improvements in China’s intellectual property protection laws and regulations, foreign companies’ patents, copyrights, trademarks, and drug data cannot be effectively protected in China. Security checks and the “secure and controllable” requirement in the information technology sector have a negative impact on intellectual property protection.
POLICY RECOMMENDATIONS
Trade negotiators and policymakers can take various actions to increase bilateral investment between the United States and China.
113
Avoid Invoking the Reciprocity Principle
Recently, some US experts have suggested that tough measures could force China to open its markets. They advocate adoption of the reciprocity principle: If China fails to meet US requirements for openness and investment, the United States raises the thresholds for Chinese SOEs that seek to invest in the United States or imposes stricter national security reviews.
The reciprocity principle ignores the fact that China and the United States are at different stages stages of development. Invoking it could hurt both sides.
Bilateral investment by China and the United States reflects the economic complementariness and comparative advantages of each economy; it benefits both countries. Chinese investment in the United States creates jobs for Americans and provides American consumers with cheap goods and services. Invoking reciprocity would eliminate these benefits—to the detriment of both sides.
Negotiate a Realistic, High-Standard Bilateral Investment Agreement
A realistic, high-standard bilateral investment agreement is the best way to fully realize the bilateral investment potential of China and the United States. Such an agreement could push the Chinese to open up and accelerate the transition to a market economy and upgrade relevant domestic industries.
The United States would like China to completely open up its economy in the short run. That expecta-tion is unrealistic. Instead of pushing for the unachievable, the United States should lower its expectations, focusing on opening up sectors such as finance, medical care, and manufacturing and remaining patient with respect to more sensitive industries, such as industries that may have ideological significance or other-wise deemed strategic in China. China and the United States should strengthen communication, look for relatively easy wins, and avoid the pursuit of perfection, which may stall the negotiations.
Policymakers should avoid protectionism. They should focus on ways of sharing a bigger pie rather than taking actions that would make the pie smaller. Specific recommendations include the following:
1. Narrow the focus of national security reviews. National security concerns must be respected andunderstood. However, closing the door to all foreign-owned firms in the name of national securityshould be prevented. National security review mechanisms should narrowly define the fields and tech-nologies that are off bounds for national security reasons. The review process and standards shouldbe clear, and foreign firms that are not allowed to operate should be given the opportunity to appealdecisions made on national security grounds, provide supplemental documents, and request explana-tions.
2. Adopt industry-specific standards for data mobility. The significance and sensitivity of data mobil-ity differ across industries. Negotiating a single standard for data mobility is probably not feasible.Instead, the United States and China should set different standards for different industries.
3. Protect intellectual property rights. China is accelerating implementation of its innovation-drivendevelopment strategy—a strategy that requires intellectual property right protection. ImprovingChina’s intellectual property rights protection could thus serve the interests of both China and theUnited States.
4. Ensure that independent controllability and innovation do not hamper fair competition.Independent controllability aims at technology and standards. Countries should have the right todevelop technology and standards that are consistent with national conditions and needs. Technicalstandards should integrate national security and other concerns. Once a standard is set, it shouldapply to domestic and foreign firms equally, to ensure fair competition.
114
5. Discuss the reform of state-owned enterprises in a nonideological manner. The communiqué ofthe Third Plenary Session of the 18th Central Committee of the Communist Party of China statesthat markets should play the decisive role in China’s economy. Realization of this goal can settleconcerns about subsidies to SOEs and fair competition from the United States. In this sense, fromthe perspective of economy, the two sides do not have serious disagreements about SOE reform.However, if the discussion of SOE reform is closely related to ideology, there is a limited space for thetwo sides to reach a consensus.
REFERENCESLei, H., and J. Zhang. 2014, Re-estimation and Comparative Analysis of China’s Capital. Inquiry into Economic Issues, no. 7: 16-21.
MOFCOM (Ministry of Commerce of the Government of China), NBS (National Bureau of Statistics of China), and SAFE (State Administration of Foreign Exchange). 2016. 2015 Statistical Bulletin of China’s Outward For-eign Direct Investment. Beijing: China Statistics Press.
Shan, H. J. 2008. Recalculating China’s Capital Stock of China, 1952–2006. Journal of Quantitative & Technical Economics, no. 10: 17-31.
Zhang, J., and Y. Zhang. 2003. Recalculating the Capital of China. Economic Research Journal, no. 7: 35–43.
115
CHAPTER 12
Foreign Direct Investment in ChinaZixuan Huang
GROWTH OF CHINESE FOREIGN DIRECT INVESTMENT
China first opened its doors to foreign direct investment (FDI) in the late 1970s. The liberalization of FDI regimes accelerated dramatically in the late 1990s (Branstetter and Lardy 2006). China’s FDI inflows held up well even during the financial crisis, and they have recovered strongly since then (Davies 2013). In 2016 Chinese FDI reached $126 billion—a 100-fold increase over the $1.26 billion in 1984 (figure 1).
China’s expanding FDI accounts for a rising share of global FDI. That share peaked at 5 percent in 2015, up from virtually zero in 1980 (figure 2).
According to the Ministry of Commerce, China’s FDI grew by 4.1 percent in 2016, in terms of renmin-bi. People who are bearish on China point to the slow FDI growth rate as evidence of cooling domestic demand and an economic slowdown in China. However, global FDI declined 13 percent in 2016, accord-ing to the United Nations Conference on Trade and Development (UNCTAD). China’s inbound FDI ranked third in the world, after the United States and the United Kingdom, and China was the largest developing-country recipient of global FDI. Chinese FDI thus stood out in 2016, even if the pace of growth slowed. China’s surging share of FDI since 2008, as shown in figure 2, indicates that Chinese FDI is growing faster than global FDI.
STRUCTURE OF FOREIGN DIRECT INVESTMENT IN CHINA
Manufacturing dominated China’s FDI for a few decades. The manufacturing domination was essentially due to the limited access to services sectors a nd was facilitated by the exports-driven economic growth pattern during this period.
Along with the gradual openness to services and the rapid growth of services in China in recent years, the structure of FDI has been moving from manufacturing to services. In 2004 services accounted for 23 percent of FDI and manufacturing accounted for 71 percent. By 2016 the shares were 67 and 28 percent, respectively (figure 3).
Zixuan Huang is a research analyst at the Peterson Institute for International Economics.
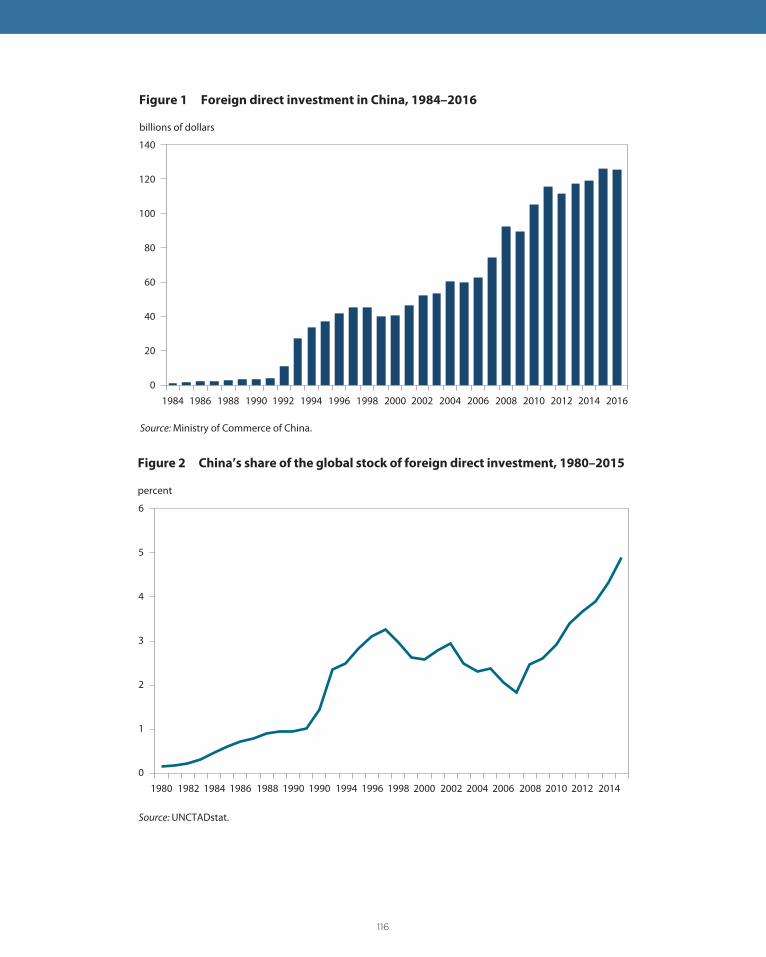
116
0
20
40
60
80
100
120
140
Figure 1 Foreign direct investment in China, 1984–2016
billions of dollars
Source: Ministry of Commerce of China.
1984 1986 1988 1990 1992 1994 1996 1998 2000 2002 2004 2006 2008 2010 2012 2014 2016
0
1
2
3
4
5
6
1980 1982
Figure 2 China’s share of the global stock of foreign direct investment, 1980–2015
percent
Source: UNCTADstat.
1984 1986 1988 1990 1990 1994 1996 1998 2000 2002 2004 2006 2008 2010 2012 2014

117
DISAPPEARING AND EMERGING ADVANTAGES OF FOREIGN DIRECT INVESTMENT
With economic development, some of the advantages of FDI in China have disappeared or are disappear-ing. The main advantage used to be inexpensive labor. But demographic changes are reducing the supply of labor, making it more expensive to produce in China (Das and N’Diaye 2013). The size of the working-age population crested in 2013 and has remained roughly constant since then (figure 4). The average monthly nominal wage of migrant rural workers—the main source of cheap labor—rose from RMB1,340 in 2008 to RMB3,275 in 2016, according to the National Bureau of Statistics and Wind Database.
In addition to cheap labor, China benefitted from policies that give preferential treatment—includ-ing special tax regimes, subsidies, and discounted land—to foreign investors (Branstetter and Lardy 2006). Foreign-invested enterprises located in the special economic zones in Shenzhen, Zhuhai, Shantou, Xiamen, and Hainan enjoyed an income tax rate of just 15 percent in the 1990s—a much lower rate than the more than 30 percent imposed on domestically funded enterprises (Li 2008). Foreign investors were also eligible for tax refunds. For instance, 40 percent of income tax on reinvestment could be refunded to foreign inves-tors who reinvested their share of profits in the same foreign-invested enterprise. Domestically funded and foreign-invested enterprises did not share the same corporate income tax rate (25 percent) until 2008, when China revised its income tax law. Some other types of preferential treatment, such as preferential land poli-cies on foreign investment, were also abolished that year. Foreign investments still benefit from some incen-tives, but they are not as strong as they were in the past.
While these changes make FDI in China less attractive, other changes make it more attractive. One emerging advantage is the quality of labor. The number of university graduates more than doubled in 10 years, reaching 3.6 million in 2015. The number of postgraduates increased from 150,777 in 2004 to 551,522 in 2015, according to the National Bureau of Statistics of China. Vocational training provides China with skilled workers. According to Apple’s chief executive officer, Tim Cook, skilled workers, not cost, lured Apple to China. The enhanced quality of labor fosters labor productivity in China, possibly encouraging FDI inflows.
0
10
20
30
40
50
60
70
80
2004 2005 2006 2007 2008 2009 2010 2011 2012 2013 2014 2015 2016
Share of FDI in servicesShare of FDI in manufacturing
Figure 3 Share of foreign direct investment in manufacturing and services in China, 2004–16
percent
Source: National Bureau of Statistics of China.

118
Being the factory of the world in the past decades brought China another advantage over other coun-tries, especially developing countries: the gradually established and improved supply chain. China moved from pure assembly into more advanced stages of production (Freund 2016). Thanks to globalization, particularly international trade, China produces not only for domestic consumers but also for foreign customers. It therefore produces more product varieties, uses more complicated management services, and has developed more mature organizations and institutions. Foreign investors are able to take advantage of China’s deep engagement in the global supply chain to promote their business not only in China but also around the world.
The higher labor cost driven by demographics is structural and irreversible, and the preferential treat-ment offered in previous decades is unlikely to return. But emerging advantages—the higher quality of the labor force and the more complete supply chain—will attract foreign investors.
FUTURE OF FOREIGN DIRECT INVESTMENT IN CHINA
Inbound FDI has been lower than outbound direct investment (ODI) in China since 2014, and the gap has been widening, according to the Ministry of Commerce.1 If it wants to maintain its high level of foreign exchange reserves despite selling much of them in the past two years to prevent the yuan from depreciating, China could either increase yuan-denominated ODI or attract more FDI. Increasing ODI largely depends on the internationalization of the yuan, which will not be achieved in the near future. In contrast, increasing FDI could occur in the relatively short term. How could it be achieved?
1. More complicated statistics by the State Administration of Foreign Exchange (SAFE) show that the assetsof direct investment were not larger than the liabilities in China’s fi nancial accounts until 2016.
880
900
920
940
960
980
1,000
1,020
Figure 4 Size of working-age population in China, 2002–16
millions of people
Source: National Bureau of Statistics of China.
2004 2005 2006 2007 2008 2009 2010 2011 2012 2013 2014 2015 201620032002

119
Increasing the openness of the services sectors is an efficient way to attract FDI, given that Chinese manufacturing sectors are already almost fully open to foreign investors. Although the share of FDI in services has been rising, the absolute amount is still low. Many services, such as telecommunications and financial intermediation, remain off bounds to foreign investors (in many cases, even domestic private firms have limited access, as state-owned enterprises still dominate many areas).
Liberalizing services would increase FDI for two main reasons. First, the Chinese economy has been in the process of transition in which services have been playing a more crucial role. This trend will likely continue. In addition, consumption has been the driver of economic growth. From both the supply and demand sides, then, the services sectors have enormous potential to develop. For example, China invested an enormous amount of capital in services infrastructure, but these investments are dominantly conducted by the state. If restrictions on foreign investors in some of these sectors are lifted, China would be able to attract more FDI inflows for building roads, railways, and other major infrastructure services.
Second, China is leading the world in some emerging services sectors, such as internet finance, online to offline services, and other internet combined industries (the so-called Internet Plus). These up and coming industries increase consumption demand and thus enlarge the size of the market. Mobile payment, for example, has become pervasive in China: When they go to a restaurant, buy a cup of coffee, or purchase even a $1 item, many Chinese simply scan the code of the sellers’ payment account and pay via their smartphones. These services sectors create new demand and offer new investment opportunities for foreign investors.
The liberalization of services to foreign investment is on its way. The Catalogue for the Guidance of Industries for Foreign Investment, revised and released in 2015, deleted some categories that limited or prohibited foreign investment. If China does not want to give up its tremendous foreign exchange reserves, it needs to attract more FDI. The services sectors should be further liberalized to achieve that goal.
REFERENCESBranstetter, Lee, and Nicholas Lardy. 2006. China’s Embrace of Globalization. NBER Working Paper 12373. Cambridge, MA: National Bureau of Economic Research.
Das, Mitali, and Papa M. N’Diaye. 2013. Chronicle of a Decline Foretold: Has China Reached the Lewis Turning Point? Working Paper 13-26. Washington: International Monetary Fund.
Davies, Ken. 2013. China Investment Policy: An Update. OECD Working Paper on International Investment 1. Paris: Organization for Economic Cooperation and Development.
Li, Qun. 2008. Tax Incentive Policies for Foreign-Invested Enterprises in China and Their Influence on Foreign Investment. Revenue Law Journal 18, no. 1: 1–41.
Freund, Caroline. 2016. Global Trade Growth: Slow but Steady. In Reality Check for the Global Economy. PIIE Briefing 16-3. Washington: Peterson Institute for International Economics.
UNCTAD (United Nations Conference on Trade and Development). 2017. Global Investment Trends Monitor 2017 (February 1). Available at http://unctad.org/en/PublicationsLibrary/webdiaeia2017d1_en.pdf.
National Bureau of Statistics. 2016. China Statistical Yearbook 2016. Beijing: China Statistics Press.
National Bureau of Statistics. n.d. Online database. Available at http://data.stats.gov.cn/easyquery.htm?cn=C01.
120
CHAPTER 13
State Resurgence in China?Nicholas R. Lardy
The expanding scope of markets and the growing role of private firms in them have been the major source of China’s economic growth in the reform era.1 The role of markets has expanded as, starting in the early 1980s, China moved from a system in which almost all important prices were set administratively, with scant attention to underlying supply and demand, to one in which markets determine the prices of virtually all goods and services and, more recently, most factors of production as well. In this increasingly marketized environment, private firms became the dominant source of the growth of output, employment, and exports (Lardy 2014).
POLICY CHANGES SINCE 2013
The wide-ranging economic reform program endorsed by the Chinese Communist Party at the Third Plenum of the 18th Party Congress in November 2013 seemed to ensure that the market would continue to play a dominant role in the Xi Jinping era (Chinese Communist Party Central Committee 2013). The key document stated that “we must ensure that the market has a decisive role in the allocation of resources.” Earlier Party documents had allowed that the market could play a “supplementary” role to the plan in guiding the economy; later the Party endorsed the concept that the market and the plan would both play important, perhaps coequal, roles. Never had a Party document endorsed the concept that market forces should dominate over the role of the plan. By stating that “we must substantially reduce the direct alloca-tion of resources by the government and promote resource allocation based on market principles, market prices, and market competition,” the document made it clear that the role of the government in price formation would be all but eliminated and that monopoly power in sectors where a few large state firms dominated would be eroded (except perhaps for natural monopolies), presumably by liberalizing entry conditions for domestic private and perhaps even foreign firms. The document also stated that “the func-tions of the government are mainly to maintain macroeconomic stability, strengthen and optimize public services, guarantee fair competition, strengthen market supervision and management, safeguard market
Nicholas R. Lardy is the Anthony M. Solomon Senior Fellow at the Peterson Institute for International Economics.
1. References to Chinese private fi rms are to indigenous private fi rms, not foreign-funded private fi rms.
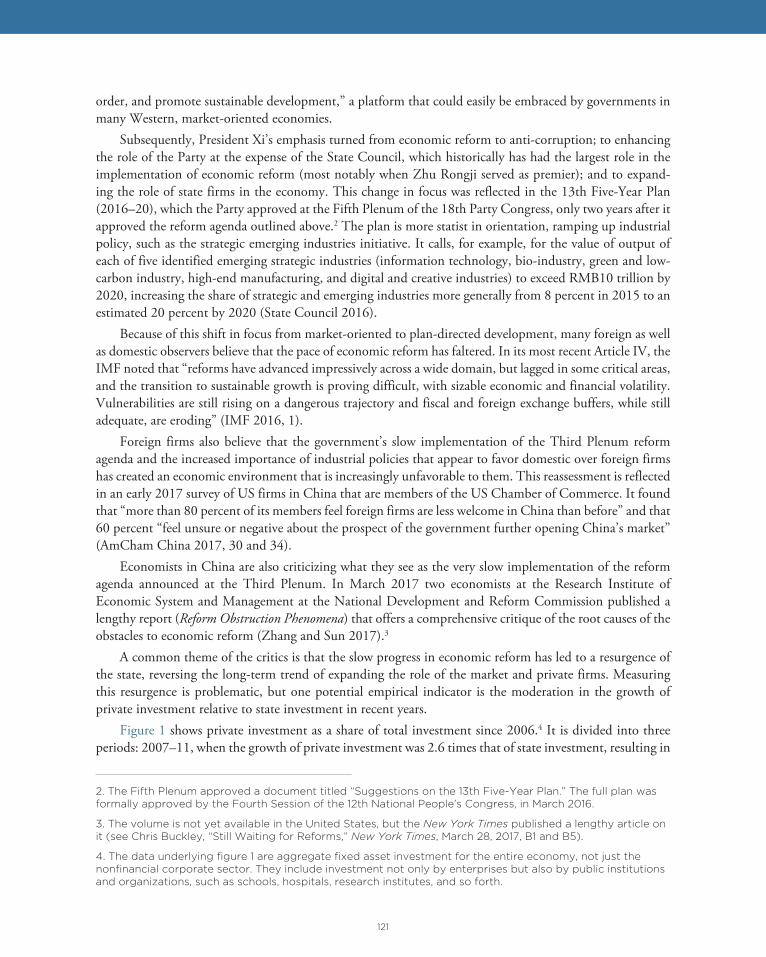
121
order, and promote sustainable development,” a platform that could easily be embraced by governments in many Western, market-oriented economies.
Subsequently, President Xi’s emphasis turned from economic reform to anti-corruption; to enhancing the role of the Party at the expense of the State Council, which historically has had the largest role in the implementation of economic reform (most notably when Zhu Rongji served as premier); and to expand-ing the role of state firms in the economy. This change in focus was reflected in the 13th Five-Year Plan (2016–20), which the Party approved at the Fifth Plenum of the 18th Party Congress, only two years after it approved the reform agenda outlined above.2 The plan is more statist in orientation, ramping up industrial policy, such as the strategic emerging industries initiative. It calls, for example, for the value of output of each of five identified emerging strategic industries (information technology, bio-industry, green and low-carbon industry, high-end manufacturing, and digital and creative industries) to exceed RMB10 trillion by 2020, increasing the share of strategic and emerging industries more generally from 8 percent in 2015 to an estimated 20 percent by 2020 (State Council 2016).
Because of this shift in focus from market-oriented to plan-directed development, many foreign as well as domestic observers believe that the pace of economic reform has faltered. In its most recent Article IV, the IMF noted that “reforms have advanced impressively across a wide domain, but lagged in some critical areas, and the transition to sustainable growth is proving difficult, with sizable economic and financial volatility. Vulnerabilities are still rising on a dangerous trajectory and fiscal and foreign exchange buffers, while still adequate, are eroding” (IMF 2016, 1).
Foreign firms also believe that the government’s slow implementation of the Third Plenum reform agenda and the increased importance of industrial policies that appear to favor domestic over foreign firms has created an economic environment that is increasingly unfavorable to them. This reassessment is reflected in an early 2017 survey of US firms in China that are members of the US Chamber of Commerce. It found that “more than 80 percent of its members feel foreign firms are less welcome in China than before” and that 60 percent “feel unsure or negative about the prospect of the government further opening China’s market” (AmCham China 2017, 30 and 34).
Economists in China are also criticizing what they see as the very slow implementation of the reform agenda announced at the Third Plenum. In March 2017 two economists at the Research Institute of Economic System and Management at the National Development and Reform Commission published a lengthy report (Reform Obstruction Phenomena) that offers a comprehensive critique of the root causes of the obstacles to economic reform (Zhang and Sun 2017).3
A common theme of the critics is that the slow progress in economic reform has led to a resurgence of the state, reversing the long-term trend of expanding the role of the market and private firms. Measuring this resurgence is problematic, but one potential empirical indicator is the moderation in the growth of private investment relative to state investment in recent years.
Figure 1 shows private investment as a share of total investment since 2006.4 It is divided into three periods: 2007–11, when the growth of private investment was 2.6 times that of state investment, resulting in
2. The Fifth Plenum approved a document titled “Suggestions on the 13th Five-Year Plan.” The full plan wasformally approved by the Fourth Session of the 12th National People’s Congress, in March 2016.
3. The volume is not yet available in the United States, but the New York Times published a lengthy article onit (see Chris Buckley, “Still Waiting for Reforms,” New York Times, March 28, 2017, B1 and B5).
4. The data underlying fi gure 1 are aggregate fi xed asset investment for the entire economy, not just thenonfi nancial corporate sector. They include investment not only by enterprises but also by public institutionsand organizations, such as schools, hospitals, research institutes, and so forth.
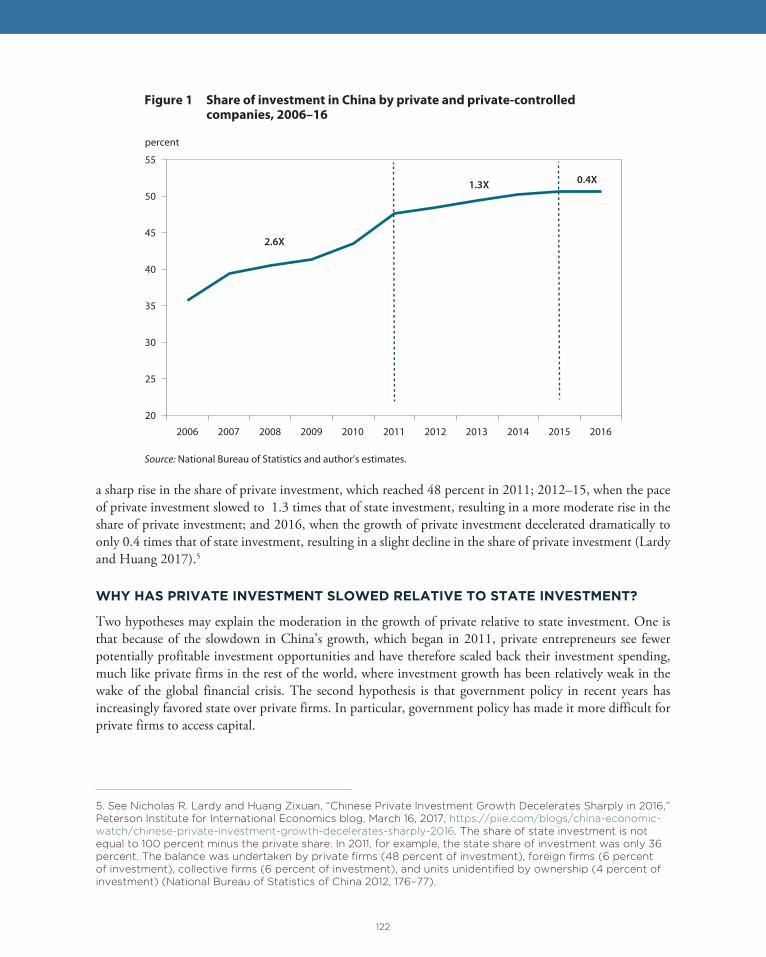
122
a sharp rise in the share of private investment, which reached 48 percent in 2011; 2012–15, when the pace of private investment slowed to 1.3 times that of state investment, resulting in a more moderate rise in the share of private investment; and 2016, when the growth of private investment decelerated dramatically to only 0.4 times that of state investment, resulting in a slight decline in the share of private investment (Lardy and Huang 2017).5
WHY HAS PRIVATE INVESTMENT SLOWED RELATIVE TO STATE INVESTMENT?
Two hypotheses may explain the moderation in the growth of private relative to state investment. One is that because of the slowdown in China’s growth, which began in 2011, private entrepreneurs see fewer potentially profitable investment opportunities and have therefore scaled back their investment spending, much like private firms in the rest of the world, where investment growth has been relatively weak in the wake of the global financial crisis. The second hypothesis is that government policy in recent years has increasingly favored state over private firms. In particular, government policy has made it more difficult for private firms to access capital.
5. See Nicholas R. Lardy and Huang Zixuan, “Chinese Private Investment Growth Decelerates Sharply in 2016,”Peterson Institute for International Economics blog, March 16, 2017, https://piie.com/blogs/china-economic-watch/chinese-private-investment-growth-decelerates-sharply-2016. The share of state investment is notequal to 100 percent minus the private share. In 2011, for example, the state share of investment was only 36percent. The balance was undertaken by private fi rms (48 percent of investment), foreign fi rms (6 percentof investment), collective fi rms (6 percent of investment), and units unidentifi ed by ownership (4 percent ofinvestment) (National Bureau of Statistics of China 2012, 176–77).
2.6X
1.3X0.4X
20
25
30
35
40
45
50
55
2006 2007 2008 2009 2010 2011 2012 2013 2014 2015 2016
Figure 1 Share of investment in China by private and private-controlled companies, 2006–16
Source: National Bureau of Statistics and author’s estimates.
percent

123
Two observations support the first hypothesis. First, private firms face the fewest entry barriers in manufacturing. As a result, by 2012 their share of manufacturing investment had risen to more than 70 percent, compared with only 10 percent by state companies (Lardy 2014).
Second, China’s recent economic slowdown is concentrated in industry and construction, which is mostly manufacturing. GDP growth slowed from 10.6 percent in 2010 to 6.7 percent in 2016, primarily because the expansion of industry and construction fell by more than half, from 12.6 percent to 6.1 percent. The growth of the services sector slowed as well, but by proportionately far less, from 9.7 percent in 2010 to 7.8 percent in 2016 (National Bureau of Statistics 2016b, 2017).
Outside of a few relatively liberalized areas, such as personal services, retail, and restaurants, however, state firms continue to dominate investment in services, primarily because of barriers that make entry by private firms especially difficult in important domains such as finance, telecommunications, and transporta-tion. Indeed, the state share of investment in services is more than five times its share in the more open manu-facturing sector, and the share of private investment in services has been essentially flat since 2011 (figure 2).
The first hypothesis is that given the entry barriers faced by private firms in what has become the most dynamic portion of the Chinese economy, it should not be a surprise that the expansion of private invest-ment has moderated substantially as the economy slowed after 2010.
The second hypothesis is that state investment had crowded out private investment. Between 2011 and 2015, annual state investment increased by RMB1.8 trillion while profits of state-owned enterprises were flat (figure 3). Where is the additional funding for state investment coming from? Has it been at the expense of the private sector?
The most important source of funding external to firms is bank loans. The share of new corporate loans flowing to state firms gradually declined from the high level of the mid-1990s to a low of 28 percent in 2011 (Lardy 2014). Data on the annual flow of corporate loans for 2010–14 show that the state share of corporate loans more than doubled between 2011 and 2014, however, while the private share fell by more than two-fifths (figure 4). This pattern is roughly consistent with the moderation in the growth of private relative to state investment that began in 2012.
44
37
30
35
40
45
50
55
60
2006 2007 2008 2009 2010 2011 2012 2013 2014 2015
StatePrivate
Figure 2 State and private shares of investment in services in China, 2006–15
percent of total investment
Source: National Bureau of Statistics.
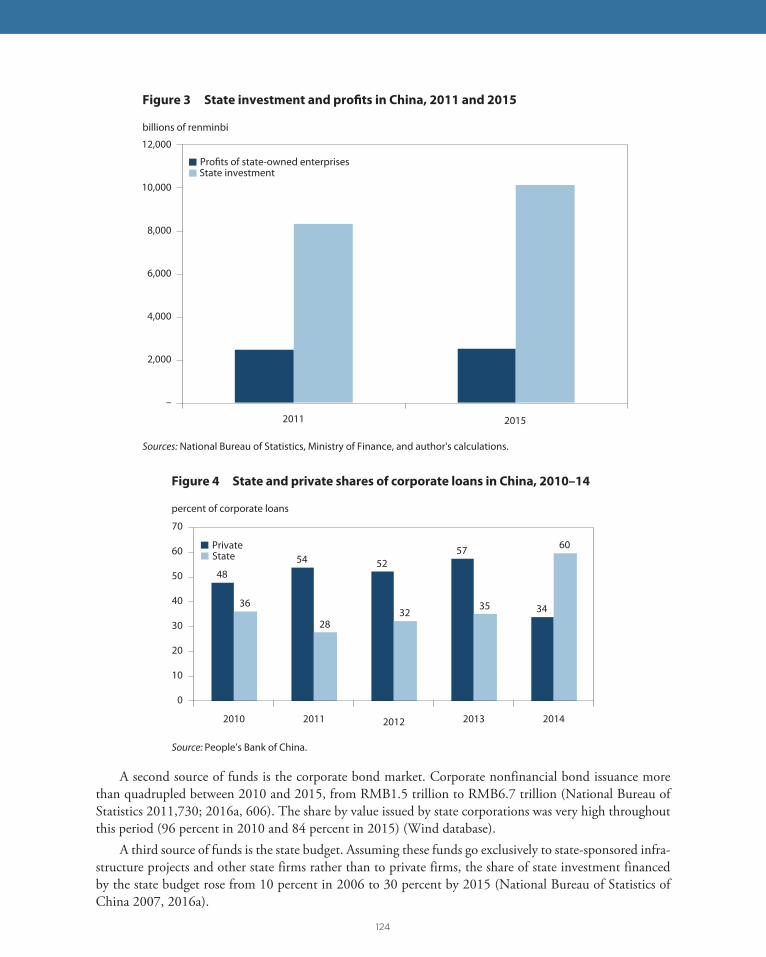
124
A second source of funds is the corporate bond market. Corporate nonfinancial bond issuance more than quadrupled between 2010 and 2015, from RMB1.5 trillion to RMB6.7 trillion (National Bureau of Statistics 2011,730; 2016a, 606). The share by value issued by state corporations was very high throughout this period (96 percent in 2010 and 84 percent in 2015) (Wind database).
A third source of funds is the state budget. Assuming these funds go exclusively to state-sponsored infra-structure projects and other state firms rather than to private firms, the share of state investment financed by the state budget rose from 10 percent in 2006 to 30 percent by 2015 (National Bureau of Statistics of China 2007, 2016a).
–
2,000
4,000
6,000
8,000
10,000
12,000
2011 2015
Profits of state-owned enterprisesState investment
Figure 3 State investment and profits in China, 2011 and 2015
billions of renminbi
Sources: National Bureau of Statistics, Ministry of Finance, and author's calculations.
48 54 52
57
34 36
28 32
35
60
0
10
20
30
40
50
60
70
2010 2011 2012 2013 2014
PrivateState
Figure 4 State and private shares of corporate loans in China, 2010–14
percent of corporate loans
Source: People’s Bank of China.

125
In short, there is some support for both hypotheses. The relative importance of the two explanations cannot be determined from the aggregate data analyzed in this paper.
SUMMARY AND IMPLICATIONS
Given the more than 3:1 ratio between the return on private and state industrial assets in China (figure 5), the continued resurgence of state relative to private investment would be unfavorable for China’s economy in two respects. First, eventually it almost certainly would lead to slower growth. Second, it almost certainly would lead to a further deterioration of asset quality in Chinese financial institutions. One of the reasons for the rapid buildup of credit in China in recent years has been the increased share of lending going to state-owned companies, including many loss-making enterprises that are being kept afloat by access to increasing amounts of credit.
The slowing of private investment in China reflects some combination of entry restrictions in services and the crowding out of private firms. The appropriate policy response is to liberalize entry conditions in the services sector for private firms and create a more competitive financial sector, which would lead to a sharp decline in lending to state firms.
0
2
4
6
8
10
12
14
16
1998 2000 2002 2004 2006 2008 2010 2012 2014 2016
StatePrivate
Figure 5 Return on assets of state and private industrial firms in China, 1998–2016
return on assets (percent)
Source: National Bureau of Statistics and author’s estimates.

126
REFERENCESAmCham China. 2017. China Business Climate Survey Report (January). Available at www.amchamchina.org (accessed March 30, 2017).
Chinese Communist Party Central Committee. 2013. Decision on Major Issues Concerning Comprehensively Deepening Reforms (November 15). Available at www.gov.cn (accessed on December 17, 2013).
IMF (International Monetary Fund). 2016. People’s Republic of China: 2016 Article IV Consultation (August). Washington. Available at www.imf.org (accessed on September 5, 2016).
Lardy, Nicholas R. 2014. Markets over Mao: The Rise of Private Business in China. Washington: Peterson Institute for International Economics.
Ministry of Finance 2016. Finance Yearbook of China 2016. Beijing: China Finance Publishing House.
National Bureau of Statistics. 2007. Chinese Statistical Yearbook 2007. Beijing: Statistics Press.
National Bureau of Statistics. 2011. Chinese Statistical Yearbook 2011. Beijing: Statistics Press.
National Bureau of Statistics. 2016a. China Statistical Abstract 2016. Beijing: China Statistics Press.
National Bureau of Statistics. 2016b. Chinese Statistical Yearbook 2016. Beijing: Statistics Press.
National Bureau of Statistics. 2017. Statistical Report on National Economic and Social Development in 2016. February 28. Available at www.stats.gov.cn (accessed on February 28, 2017).
People’s Bank of China. 2011. Almanac of China’s Finance and Banking 2011. Beijing: China Financial Publishing House.
People’s Bank of China. 2012. Almanac of China’s Finance and Banking 2012. Beijing: China Financial Publishing House.
People’s Bank of China. 2013. Almanac of China’s Finance and Banking 2013. Beijing: China Financial Publishing House.
People’s Bank of China. 2014. Almanac of China’s Finance and Banking 2014. Beijing: China Financial Publishing House.
People’s Bank of China. 2015. Almanac of China’s Finance and Banking 2015. Beijing: China Financial Publishing House.
State Council. 2016. Notice Concerning the Development Program for State Strategic and Emerging Industries (November 29). Available at www.gov.cn/zhengce/content2016-12/19_5150090.htm (accessed on March 31, 2017).
Zhang Linshan, and Sun Fengyi. 2017. Reform Obstruction Phenomenon. Beijing: Social Sciences Academic Press.

127
CHAPTER 14
The Risks and Costs of Trade Wars Marcus Noland
Since the 1930s, when a global drive to raise trade barriers deepened the Great Depression, US specialists and the public at large have shared the belief that a liberal US-led rules-based international trade regime is in the US national interest. Trade policy has thus seldom, if ever, risen to a top-tier issue in US electoral politics. But the 2016 elections underscored depths of public dissatisfaction with the status quo, and the United States is on the cusp of a potential turning point where the new administration and Congress could reverse course on 80 years of movement toward freer trade and enhanced multilateral cooperation. State-ments by the eventual winner of the presidential campaign, Donald Trump, have raised the specter of trade wars, including with China.
THE PRESIDENT’S INTERNATIONAL TRADE CONCERNS
During the campaign, Trump emphasized three recurring themes in the area of trade policy. The first was the importance of trade balances, including bilateral trade balances. In his view, a major challenge facing the United States is its $500 billion trade deficit in goods and services, more than half of which is with China.
From Trump’s perspective, the second and third themes of his campaign—currency manipulation to gain unfair advantage in trade and “disastrous” trade agreements—provide both the explanation for the deficit problem and the starting points for a solution. He lambasted the Trans-Pacific Partnership (TPP), called the North American Free Trade Agreement (NAFTA) “the worst trade agreement in history,” and repeatedly called the Korea-US Free Trade Agreement (KORUS) a “job killer.” He expressed hostility toward outward foreign direct investment, and this attitude presumably disinclines him toward concluding the bilateral investment treaty with China currently under negotiation.
Since coming into office, President Trump’s record on fulfilling campaign pledges has been mixed. Although he did not follow through on his pledge to declare China a currency manipulator his first day in office and impose a tariff to offset the advantage of currency undervaluation, he did withdraw US support for the TPP and has indicated that he does indeed want to renegotiate the NAFTA. Under US pressure, the Group of 20 (G-20) deleted its pledge to abjure trade protection from its March Finance Ministers communiqué.
Marcus Noland is Executive Vice President and Director of Studies at the Peterson Institute for International Economics.
128
While the signals have been negative, there has also been a lack of concrete action. It is unclear whether the relative inaction reflects the distinction between governing and the political theater of the campaign trail, the biding of time, the slowness of American governments with their thousands of political appointments to get organized, intragovernment policy disagreements, or sheer disorganization. The administration has paid more attention to Mexico than China, perhaps reflecting an assessment of greater Mexican pliability.
With regard to NAFTA renegotiation, the agreement is 25 years old and, like an old house, it arguably needs renovation. The simplest approach would be to examine the TPP text and see what innovations, such as provisions relating to e-commerce, could be incorporated into a NAFTA 2.0. But press reports indicate that the Trump administration is focused on rewriting rules of origin, perhaps even demanding special rules of origin for sales in the US market, a demand that Mexico and Canada would find hard to accept. Although the NAFTA renegotiation may be unpleasant, it is unlikely to spark a trade war: Mexico is reliant on the US market, and in the end will acquiesce without major retaliation. The same cannot confidently be said about China, however.
With regard to the central claim that China is a currency manipulator, US law establishes criteria for that designation: (1) a significant bilateral trade surplus with the United States, (2) a material current account surplus, and (3) persistent one-sided intervention in the foreign exchange market. Under the US Treasury’s definitional thresholds, no economy currently satisfies all three criteria. Five major trading part-ners of the United States (China, Japan, Korea, Taiwan, and Germany) meet two of the three criteria for enhanced analysis, however, and have been placed on a “Monitoring List.” If China were formally declared a currency manipulator under the existing law, the president would have a number of possible remedies; the most drastic would be to bar Chinese enterprises from the US government procurement market.
If the administration wanted to take more aggressive action, it could either instruct Treasury to relax its definitions (to affirmatively identify more manipulators) and/or go back to Congress to authorize additional penalties. New legislative provisions might include requiring currency manipulation provisions in future trade agreements or authorizing countervailing currency intervention in the foreign exchange market. The former suggestion would likely be rejected by other countries; the latter might not be feasible in all cases.
Another big issue is China’s market economy status (MES) in the World Trade Organization (WTO). When China joined the WTO it was classified as a nonmarket economy (NME), which allows the Depart-ment of Commerce to use very elastic procedures in antidumping investigations. China understandably wants to constrain this discretion, and under its WTO accession agreement NME status was to end in December 2016. If the Trump administration continues to treat China as an NME in antidumping investi-gations, China could probably take the US to the WTO on the MES issue and win, and indeed it has already initiated a complaint. But going the WTO route would take a couple of years and might erode US support for the whole WTO system, which has benefitted China greatly, especially in light of President Trump’s periodic threats to ignore the WTO or withdraw the United States entirely. Moreover, the rise of counter-vailing duty cases in recent years means that the real degree of deprotection if China were granted MES is probably less than either proponents or opponents expect—regardless of China’s status, US trade law retains significant tools to penalize unfair trade practices (Bown 2016). It might be preferable to enter into nego-tiations to strike a balance between China’s desires for improved US market access and US concerns about market access in China. Sectoral MES might be one component of an overall accommodation.
Another component might be improved protection for US intellectual property rights (IPR). The Office of the Director of National Intelligence estimated that IPR theft costs the US economy $400 billion a year, and a reassessment based on recent evidence, led by former US Director of National Intelligence Dennis Blair and former US Ambassador to China Jon Huntsman, concluded that the $400 billion estimate remained plausible (Blair and Huntsman 2017). Not all of this loss is due to Chinese actions, but China looms large in American concerns in this area.
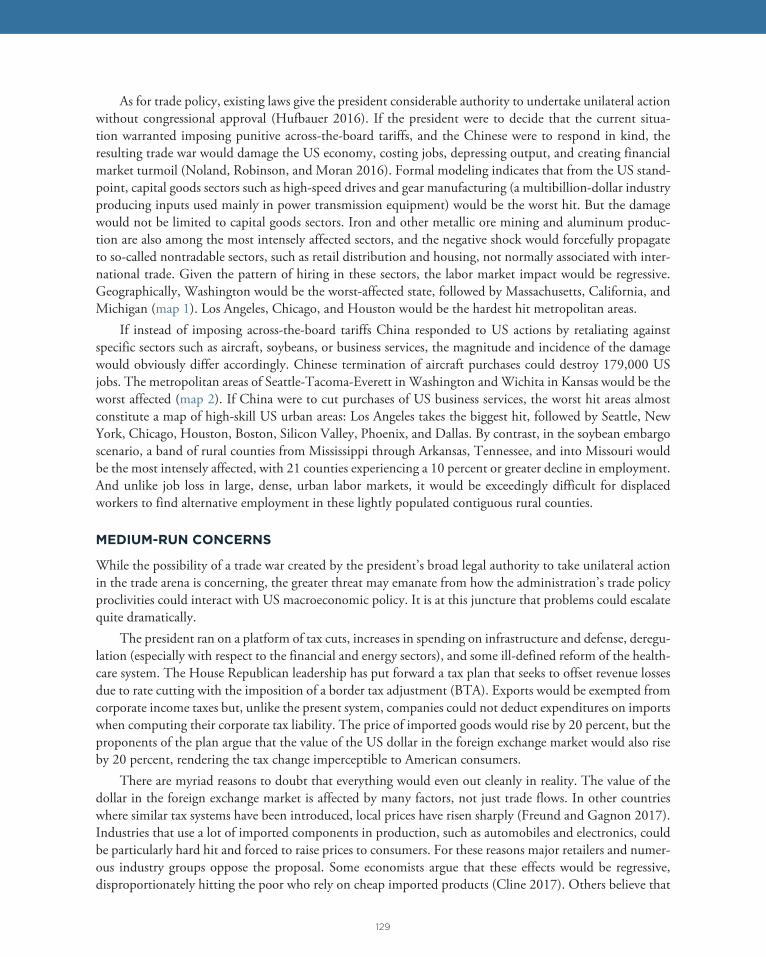
129
As for trade policy, existing laws give the president considerable authority to undertake unilateral action without congressional approval (Hufbauer 2016). If the president were to decide that the current situa-tion warranted imposing punitive across-the-board tariffs, and the Chinese were to respond in kind, the resulting trade war would damage the US economy, costing jobs, depressing output, and creating financial market turmoil (Noland, Robinson, and Moran 2016). Formal modeling indicates that from the US stand-point, capital goods sectors such as high-speed drives and gear manufacturing (a multibillion-dollar industry producing inputs used mainly in power transmission equipment) would be the worst hit. But the damage would not be limited to capital goods sectors. Iron and other metallic ore mining and aluminum produc-tion are also among the most intensely affected sectors, and the negative shock would forcefully propagate to so-called nontradable sectors, such as retail distribution and housing, not normally associated with inter-national trade. Given the pattern of hiring in these sectors, the labor market impact would be regressive. Geographically, Washington would be the worst-affected state, followed by Massachusetts, California, and Michigan (map 1). Los Angeles, Chicago, and Houston would be the hardest hit metropolitan areas.
If instead of imposing across-the-board tariffs China responded to US actions by retaliating against specific sectors such as aircraft, soybeans, or business services, the magnitude and incidence of the damage would obviously differ accordingly. Chinese termination of aircraft purchases could destroy 179,000 US jobs. The metropolitan areas of Seattle-Tacoma-Everett in Washington and Wichita in Kansas would be the worst affected (map 2). If China were to cut purchases of US business services, the worst hit areas almost constitute a map of high-skill US urban areas: Los Angeles takes the biggest hit, followed by Seattle, New York, Chicago, Houston, Boston, Silicon Valley, Phoenix, and Dallas. By contrast, in the soybean embargo scenario, a band of rural counties from Mississippi through Arkansas, Tennessee, and into Missouri would be the most intensely affected, with 21 counties experiencing a 10 percent or greater decline in employment. And unlike job loss in large, dense, urban labor markets, it would be exceedingly difficult for displaced workers to find alternative employment in these lightly populated contiguous rural counties.
MEDIUM-RUN CONCERNS
While the possibility of a trade war created by the president’s broad legal authority to take unilateral action in the trade arena is concerning, the greater threat may emanate from how the administration’s trade policy proclivities could interact with US macroeconomic policy. It is at this juncture that problems could escalate quite dramatically.
The president ran on a platform of tax cuts, increases in spending on infrastructure and defense, deregu-lation (especially with respect to the financial and energy sectors), and some ill-defined reform of the health-care system. The House Republican leadership has put forward a tax plan that seeks to offset revenue losses due to rate cutting with the imposition of a border tax adjustment (BTA). Exports would be exempted from corporate income taxes but, unlike the present system, companies could not deduct expenditures on imports when computing their corporate tax liability. The price of imported goods would rise by 20 percent, but the proponents of the plan argue that the value of the US dollar in the foreign exchange market would also rise by 20 percent, rendering the tax change imperceptible to American consumers.
There are myriad reasons to doubt that everything would even out cleanly in reality. The value of the dollar in the foreign exchange market is affected by many factors, not just trade flows. In other countries where similar tax systems have been introduced, local prices have risen sharply (Freund and Gagnon 2017). Industries that use a lot of imported components in production, such as automobiles and electronics, could be particularly hard hit and forced to raise prices to consumers. For these reasons major retailers and numer-ous industry groups oppose the proposal. Some economists argue that these effects would be regressive, disproportionately hitting the poor who rely on cheap imported products (Cline 2017). Others believe that

130
Ma
p 1
P
erc
en
tag
e p
riv
ate
se
cto
r jo
b l
oss
by
US
sta
te u
nd
er
full
tra
de
wa
r sc
en
ari
o
<3.
5%
3.5
–3.9
%
4.0
–4.4
9%
4.5
–4.9
%
5.0
%>
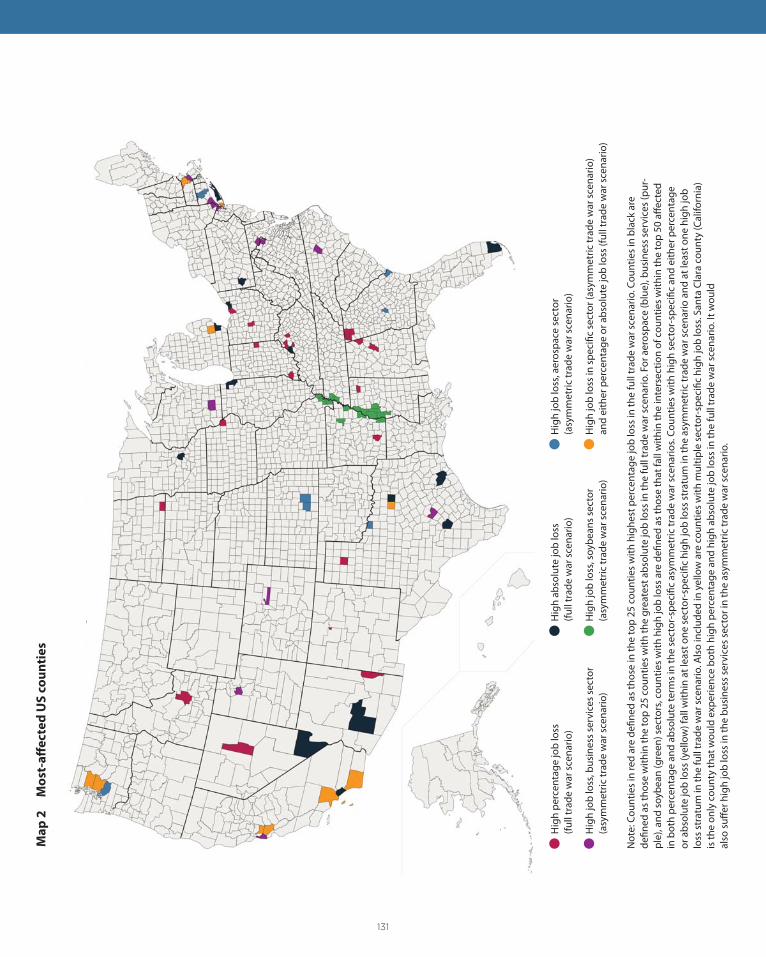
131
Ma
p 2
M
ost
-aff
ec
ted
US
co
un
tie
s
Hig
h pe
rcen
tage
job
loss
(fu
ll tr
ade
war
sce
nario
)
Hig
h jo
b lo
ss, b
usin
ess
serv
ices
sec
tor
(asy
mm
etric
trad
e w
ar s
cena
rio)
Hig
h ab
solu
te jo
b lo
ss
(full
trad
e w
ar s
cena
rio)
Hig
h jo
b lo
ss, s
oybe
ans
sect
or
(asy
mm
etric
trad
e w
ar s
cena
rio)
Not
e: C
ount
ies
in re
d ar
e de
fined
as
thos
e in
the
top
25 c
ount
ies
with
hig
hest
per
cent
age
job
loss
in th
e fu
ll tr
ade
war
sce
nario
. Cou
ntie
s in
bla
ck a
re
defin
ed a
s th
ose
with
in th
e to
p 25
cou
ntie
s w
ith th
e gr
eate
st a
bsol
ute
job
loss
in th
e fu
ll tr
ade
war
sce
nario
. For
aer
ospa
ce (b
lue)
, bus
ines
s se
rvic
es (p
ur-
ple)
, and
soy
bean
(gre
en) s
ecto
rs, c
ount
ies
with
hig
h jo
b lo
ss a
re d
efine
d as
thos
e th
at fa
ll w
ithin
the
inte
rsec
tion
of c
ount
ies
with
in th
e to
p 50
affe
cted
in
bot
h pe
rcen
tage
and
abs
olut
e te
rms
in th
e se
ctor
-spe
cific
asy
mm
etric
trad
e w
ar s
cena
rios.
Coun
ties
with
hig
h se
ctor
-spe
cific
and
eith
er p
erce
ntag
e or
abs
olut
e jo
b lo
ss (y
ello
w) f
all w
ithin
at l
east
one
sec
tor-
spec
ific
high
job
loss
str
atum
in th
e as
ymm
etric
trad
e w
ar s
cena
rio a
nd a
t lea
st o
ne h
igh
job
loss
str
atum
in th
e fu
ll tr
ade
war
sce
nario
. Als
o in
clud
ed in
yel
low
are
cou
ntie
s w
ith m
ultip
le s
ecto
r-sp
ecifi
c hi
gh jo
b lo
ss. S
anta
Cla
ra c
ount
y (C
alifo
rnia
) is
the
only
cou
nty
that
wou
ld e
xper
ienc
e bo
th h
igh
perc
enta
ge a
nd h
igh
abso
lute
job
loss
in th
e fu
ll tr
ade
war
sce
nario
. It w
ould
al
so s
uffer
hig
h jo
b lo
ss in
the
busi
ness
ser
vice
s se
ctor
in th
e as
ymm
etric
trad
e w
ar s
cena
rio. H
igh
job
loss
, aer
ospa
ce s
ecto
r (a
sym
met
ric tr
ade
war
sce
nario
)
Hig
h jo
b lo
ss in
spe
cific
sec
tor (
asym
met
ric tr
ade
war
sce
nario
) an
d ei
ther
per
cent
age
or a
bsol
ute
job
loss
(ful
l tra
de w
ar s
cena
rio)
132
the plan would run afoul of US commitments to the World Trade Organization and in principle could even lead to massive trade retaliation against the United States, far in excess of any retaliation that the WTO has authorized in the past (Bown 2017). There are many grounds for skepticism and the administration contin-ues to hedge its support for the House proposal. The proposal may never be enacted, but if it were it could constitute yet another trigger for trade war.
The United States was already on track for some additional fiscal stimulus that would likely generate a short-term growth spurt, budget deficits, rising interest rates, and an appreciated dollar—even with the additional revenues generated by the BTA. If the House proposal fails, the United States could end up adopting increased spending—but with markedly lower tax revenues, further reinforcing the fiscal expan-sion. One can debate how close the country is to full employment and therefore how much stimulus the economy could take before overheating and how aggressively the Federal Reserve might raise interest rates. The US current account deficit was on a widening trajectory before the election, and the Trump macroeco-nomic policy could reinforce this tendency (Cline 2016).
What could transpire is a very nasty version of the first Reagan administration: Growing trade deficits led Reagan to impose trade protection, indeed “more trade protection than any president since Herbert Hoover” in the infamous words of then-Treasury Secretary James Baker. And President Ronald Reagan was an ideological free trader, who had to at least feign reluctance to impose protection. That ideology was one reason that protection in the Reagan administration took the form of “voluntary export restraints” under-taken by America’s trade partners, particularly Japan, rather than self-imposed tariff protection.
Trump administration officials have pointed approvingly to the first Reagan administration’s policies toward Japan as a model, at times even claiming that Reagan merely threatened protection and the Japanese complied. But the United States was Japan’s political and military guarantor in the context of the Cold War. Ultimately, Japan would comply with US demands in the trade sphere, however grudgingly. The US-China relationship today is very dissimilar. The rivalry between the two countries could not be more different from the US-Japan rapport of the 1980s.
The real issue for China and the rest of the world may be less in the Trump administration’s first 100 days than in 2018 or 2019, when the Trump fiscal stimulus kicks in and the administration is tempted to reach for trade protection in a quixotic attempt to deal with growing trade deficits. A nation’s trade deficit fundamentally reflects the difference between saving and investment—if a nation consumes more than it produces, it runs a deficit; if it produces more than it consumes, it runs a surplus. Trade policy can affect the sectoral and geographic composition of the deficit, but in the long run the trade balance is determined by the savings-investment balance. The most direct way to lower a nation’s trade deficit is to increase its saving rate, most obviously by reducing public dissaving. Unfortunately, US fiscal policy appears to be moving in the opposite direction.
CONCLUSION
The United States benefits from international trade, and China and the United States have had a mutu-ally beneficial and deepening economic relationship. A byproduct of that deepening economic integration, however, is a tendency toward increased income and wealth inequality in the United States. The appropri-ate response is not to adopt trade protection but rather to implement a package of improved adjustment measures and longer-term policies to enhance competitiveness.
The issues of currency manipulation, NME status, IPR protection, and market access are all potential flashpoints in the US-China trade relationship. Mismanagement of these issues and the resulting trade conflict could harm both the US and Chinese economies and create collateral damage worldwide. There would be no winners in such a trade war.

133
REFERENCESBlair, Dennis, and Jon Huntsman Jr. 2017. Update to the IP Commission Report (May). Washington: Bureau of Asian Research. Available at http://ipcommission.org/report/IP_Commission_Report_Update_2017.pdf.
Bown, Chad. 2016. Should the United States Recognize China as a Market Economy? PIIE Policy Brief 16-24. December. Washington: Peterson Institute for International Economics. Available at https://piie.com/publica-tions/policy-briefs/should-united-states-recognize-china-market-economy.
Bown, Chad. 2017. Will the Proposed US Border Tax Provoke WTO Retaliation from Trading Partners? PIIE Policy Brief 17-11. Washington: Peterson Institute for International Economics. Available at https://piie.com/publications/policy-briefs/will-proposed-us-border-tax-provoke-wto-retaliation-trading-partners.
Cline, William. 2016. Estimates of Fundamental Equilibrium Exchange Rates, November 2016. PIIE Policy Brief 16-22. Washington: Peterson Institute for International Economics. Available at piie.com/publications/policy-briefs/estimates-fundamental-equilibrium-exchange-rates-november-2016.
Cline, William. 2017. The Ryan-Brady Cash Flow Tax: Disguised Protection, Exaggerated Revenue, and In-creased Inequality. PIIE Policy Brief 17-4. Washington: Peterson Institute for International Economics. Available at https://piie.com/publications/policy-briefs/ryan-brady-cash-flow-tax-disguised-protection-exaggerated-revenue-and.
Freund, Caroline, and Joseph Gagnon. 2017. Effects of Consumption Taxes on Real Exchange Rates and Trade Balances. PIIE Working Paper 17-5. Washington: Peterson Institute for International Economics.
Hufbauer, Gary Clyde. 2016. Could a President Trump Shackle Imports? In Assessing Trade Agendas in the US Presidential Campaign. PIIE Briefing 16-6: 5–16. Washington: Peterson Institute for International Economics. Available at https://piie.com/publications/piie-briefings/assessing-trade-agendas-us-presidential-campaign.
Noland, Marcus, Sherman Robinson, and Tyler Moran. 2016. Impact of Clinton’s and Trump’s Trade Proposals. In Assessing Trade Agendas in the US Presidential Campaign. PIIE Briefing 16-6: 17–39. Washington: Peterson In-stitute for International Economics. Available at https://piie.com/publications/piie-briefings/assessing-trade-agendas-us-presidential-campaign.
134
Jeffrey J. Schott is senior fellow at the Peterson Institute for International Economics. Zhiyao (Lucy) Lu is research analyst at the Peterson Institute for International Economics.
CHAPTER 15
Asia-Pacific Regionalism after the TPPJeff rey J. Schott and Zhiyao (Lucy) Lu
President Donald Trump has withdrawn the United States from the Trans-Pacific Partnership (TPP), the comprehensive accord signed in February 2016 by 12 countries representing almost 40 percent of global GDP.1 The TPP was modeled on the comprehensive US free trade agreements (FTAs) negotiated over the past two decades (Allee and Lugg 2016); the US action essentially dismissed a deal designed, drafted, and delivered by US negotiators. The decision to pull the United States out of the TPP means that the deal, as signed, is basically dead, since its entry into force provisions require the participation of the United States.
The radical shift in US policy also has implications for the broader Asia-Pacific region. The TPP was considered the gold standard for 21st century trade accords and one of the primary pathways toward a Free Trade Area of the Asia-Pacific (FTAAP). Members of the Asia Pacific Economic Cooperation forum (APEC) have been discussing various scenarios for constructing an FTAAP, drawing on the ample prec-edents of trade agreements among APEC countries. Trump’s action has obstructed one of the main options going forward; progress toward an FTAAP has suffered a substantial setback.
The new US policy has disrupted trade relations among countries in the Asia-Pacific region and raised questions about the US commitment to a comprehensive regional trade and investment agreement. Instead of a TPP-12, US policy now will pursue bilateral FTAs with key partners, starting with Mexico and Canada with the objective to modernize the North American FTA (NAFTA) and then use that experience to frame new pacts with Japan or reframe existing FTAs with South Korea and others. However, this bilateral strategy likely will have limited results. US officials are likely to demand more concessions from their counterparts than they got in the TPP and offer less in return. Other countries already have good access to the US market, so without new US reforms, the negotiated outcome is likely to be hollow (see Schott 2017).
In an odd way, the US withdrawal from the TPP has refocused attention in the region on how much was achieved in the TPP talks and the benefits that would accrue to each country from pursuing the reforms
1. See “Trans-Pacifi c Partnership (TPP),” Offi ce of the United States Trade Representative, https://ustr.gov/trade-agreements/free-trade-agreements/trans-pacifi c-partnership (accessed on April 14, 2017).

135
required by TPP obligations. As broadly discussed in this short paper, efforts are now under way to sustain, in whole or in part, the TPP results through other bilateral and regional initiatives. China has an important stake in these talks, which complement its current efforts to bolster domestic economic reforms and deepen trade and investment ties with countries in the Asia-Pacific region.
REVIVING AN ASIA-PACIFIC PACT
The US withdrawal has devalued the TPP but the other 11 signatories still find great value in it. These coun-tries recognize that the agreement is in their self-interest and therefore have continued to pursue regional integration options, including possibly adopting the TPP without the United States. Why?
First, the limited concessions opening the US market to other TPP members were only part of the deal’s benefits. Another large objective of these countries was to bolster their own domestic economic reform to become more efficient, productive, and competitive in global markets. Thus, several of the countries (e.g., Japan, New Zealand) have continued to pursue and finalize their own ratification of the agreement, even after the United States was clearly going to leave.2
Second, all 11 of the other TPP countries would like the United States to reconsider and participate in a new Asia-Pacific economic integration arrangement. Whether that arrangement is exactly like the TPP or somewhat revised would, we think, be open to negotiation. In the past, countries were not willing to consider reopening the agreement because they felt that doing so would unravel the very delicate balance of concessions that had been reached before the agreement was signed. Now, the situation is completely differ-ent because the agreement already has unraveled.
Third, the TPP countries are interested in deepening their economic relations with the major trading powers in the Asia-Pacific region. For most of them, China is their biggest trading partner. So, many TPP countries have sought to either open new bilateral talks with China or update and augment the agreements they already have with China. One example is Canada, which is now in an extensive consultative phase at home and working on a joint feasibility study with China in preparation for a future launch of bilateral trade negotiations.3
These considerations led Chile to organize an ad hoc High-Level Dialogue on Integration Initiatives for the Asia Pacific on the sidelines of a meeting of the Pacific Alliance countries (Chile, Colombia, Mexico, and Peru plus many observer nations) in Viña del Mar, Chile, in mid-March 2017.4 Attending were all 11 current TPP signatories (the TPP-11) plus China, Colombia, South Korea, and the United States. In addition, the TPP-11 met separately and “exchanged views on their respective domestic processes regarding the TPP and canvassed views on a way forward that would advance economic integration in the Asia Pacific.”5 They also agreed to follow-up talks to continue their joint planning with senior officials meeting in Canada in early
2. The New Zealand Parliament passed the Trans-Pacifi c Partnership Agreement Amendment Bill onNovember 15, 2016. See “Trans-Pacifi c Partnership,” New Zealand Foreign Aff airs & Trade, www.tpp.mfat.govt.nz/ (accessed on April 14, 2017). Japan’s parliament ratifi ed the TPP on December 9, 2016. See “JapanRatifi es Trans-Pacifi c Partnership, Which Trump Has Promised to Leave,” Wall Street Journal, December9, 2016, www.wsj.com/articles/japan-ratifi es-trans-pacifi c-partnership-which-trump-has-promised-to-leave-1481273551 (accessed on April 14, 2017).
3. See “Feasible Study and Exploratory Discussion on China-Canada FTA Held in Beijing,” FTA News Release,China FTA Network, Ministry of Commerce, People’s Republic of China, February 27, 2017, http://fta.mofcom.gov.cn/enarticle/enrelease/201703/34437_1.html (accessed on April 14, 2017).
4. See Joint Statement by TPP Partners, Dirección General de Relaciones Económicas Internacionales, Gobiernode Chile, March 15, 2017, www.direcon.gob.cl/en/minisitio/dialogoasiapacifi co/ (accessed on April 14, 2017).
5. Ibid.

136
May and with ministers getting together during the APEC trade meeting in Hanoi on May 20–21, 2017. The TPP-11 still highly value the TPP, regarding “its principles and high standards as a way to promote regional economic integration” and agreed in Hanoi to assess by November 2017 options to bring the pact into force expeditiously and “to include other economies that can accept the high standards of the TPP.”6
Importantly, the high-level dialogue in Chile and the follow-up meetings include the United States. The TPP-11 have not closed the door to future US participation in a comprehensive regional arrangement that builds on the TPP framework, perhaps with some amendments and new participants.
To be sure, the Trump administration is not now considering a return to regional negotiations akin to the TPP process. However, senior administration officials do not want to “throw the baby out with the bathwater” and thus have argued to draw on TPP precedents in the construction of new bilateral trade pacts in the region. It is not a large step in the same direction to launch a broader regional negotiation. But there are several reasons why the Trump administration may well consider a new trade deal in the Pacific Basin: (1) many Republicans in Congress and most business and farm groups want a TPP-style deal; (2) thereare justifiable concerns that US competitiveness will be adversely affected as others implement domesticeconomic reforms and US farm and other interests face increasing discrimination from trade deals in whichthe United States is not a participant; and (3) the pact will reinforce US strategic interests in the region at atime of mounting tension with North Korea. In other words, there could be “life after the TPP” and it couldbe a bigger and better trade deal than the one Trump dismissed (see Schott 2017).
LIFE AFTER THE TPP: IMPLICATIONS FOR AN FTAAP
The TPP-11 clearly aim to move forward with regional initiatives that achieve results comparable to the TPP, and they hope to involve additional participants beyond the original TPP countries. These goals complement their longstanding and continuing commitment to construct an FTAAP. Indeed, restructuring the TPP would reestablish a major pathway toward an FTAAP—a leading Chinese policy objective in APEC.
China made progress on the FTAAP one of its priority objectives during its tenure as chair of APEC in 2014. At the Hangzhou summit in November 2014, APEC leaders approved the “Beijing Roadmap” toward an FTAAP, directing that the FTAAP “should be high quality and comprehensive, and incorporate and address ‘next generation’ trade and investment issues,” build on “ongoing regional undertakings” and be pursued “outside of APEC, parallel with the APEC process.”7 To that end, they commissioned a collective strategic study (CSS), cochaired by China and the United States, on issues related to the realization of the FTAAP. The finished CSS was presented to APEC leaders in Lima in November 2016, and they—in typical APEC fashion—advanced the FTAAP process by mandating follow-up studies on CSS recommendations in three main areas: a gap analysis of differing FTA practices in the region, stocktaking of how next-generation issues are handled in existing FTAs, and assessment of capacity building and other initiatives needed “to close the gaps between different treatment of these issues” in participating economies.8
The ultimate objective of the Lima Declaration on FTAAP was to analyze what countries are doing
6. See “Annex A: Joint Statement by TPP Partners, 21 May 2017, Ha Noi, Vietnam,” www.gov.sg/~/sgpcmedia/media_releases/mti/press_release/P-20170521-1/attachment/Statement%20on%20the%20Trans-Pacifi c%20Partnership_21%20May%202017.pdf (accessed on May 30, 2017).
7. See “Appendix 8: Recommendations Accompanying the Collective Strategic Study on Issues Related to theRealization of the FTAAP” in the 2016 CTI Report to Ministers, Asia-Pacifi c Economic Cooperation, November2016, http://publications.apec.org/publication-detail.php?pub_id=1788 (accessed on April 14, 2017).
8. See “Annex A: Lima Declaration on FTAAP,” Asia-Pacifi c Economic Cooperation, November 20,2016, http://ec2-54-169-153-24.ap-southeast-1.compute.amazonaws.com/Meeting-Papers/Leaders-Declarations/2016/2016_aelm/2016_Annex%20A.aspx (accessed on April 14, 2017).
137
to advance regional economic integration and to clarify possible pathways to an FTAAP, including the TPP and Regional Comprehensive Economic Partnership (RCEP)—which has yet to conclude. Those two megaregional initiatives have been complementary but not comparable: RCEP is more limited in content and will be slow to generate reforms. RCEP members that want to use trade accords to change existing poli-cies also participated in the TPP; indeed, 7 of the 16 RCEP countries signed the TPP and several others had been strongly considering TPP accession once the pact had been implemented.
The Lima Declaration was issued while Barack Obama was still the US president but after the elec-tion of Donald Trump to succeed him. Trump has sidelined the TPP, leaving RCEP as seemingly the only megaregional trade arrangement in the Asia-Pacific.
To date, however, RCEP negotiations have yielded very limited impetus to broader regional economic reforms. Part of this is because the RCEP countries are even more diverse than the TPP countries, containing rich and poor countries alike. RCEP talks are progressing slowly, beset by challenges arising from its diverse membership and a proclivity for postponing decisions on difficult issues. RCEP leaders issue annual commit-ments that talks will conclude in the current year; eventually they will agree on a basic deal with limited economic impact that presages further negotiations on investment, services, and other issues going forward.
There are three key reasons for this pessimistic outlook. First, RCEP is Association of Southeast Asian Nations (ASEAN)-centric and primarily serves two ASEAN objectives: to propel closer intra-ASEAN inte-gration and the deepening of the ASEAN Economic Community, and to harmonize policies among the 10-member ASEAN and its FTA partners. The ASEAN way posits incremental and incomplete liberaliza-tion and injects a significant drag on progress toward economic reform. Second, India is a party to theRCEP negotiations and has been a substantial foot dragger on any efforts at significant trade reform.
Third, RCEP has 16 participants but its economic heft is dominated by the three Northeast Asian coun-tries: China, Japan, and South Korea account for more than 70 percent of the combined GDP of the RCEP participants. Economic competition and political frictions between the three countries constrain what can be achieved in RCEP. A few years ago, East Asian officials hoped that the results of the China–South Korea FTA could inspire RCEP negotiators to achieve broader and deeper reforms. Unfortunately, the bilateral deal closed quickly for political reasons and left out many important reforms, so it has had minimal impact. This experience provides an important lesson for RCEP countries: finish the deal before you close the talks!
Put another way, in the absence of a restructured Asia-Pacific pact, RCEP seems to be the only megare-gional trade arrangement left standing that has been considered a pathway toward an FTAAP. In our view, it is not a viable pathway in its current form. Compared to the TPP, RCEP probably will fall short in terms of both trade liberalization commitments and rule-making obligations. The key differences involve the depth of reforms; the scope of new disciplines on state-owned enterprises (SOEs), labor, and environmental poli-cies; the large number of RCEP exemptions for sensitive products and special preferences and flexibility for poorer, developing-country members; and consultative versus binding dispute settlement procedures. The new high-level dialogue organized by Chile could produce a new pathway to an FTAAP; at the very least, it should encourage RCEP countries to improve their emerging deal, drawing on TPP precedents as much as possible. To that end, China should continue to pursue a multipronged approach to regional trade initia-tives, including continuing and improving RCEP rather than closing a minimalist deal.
WHY ASIA-PACIFIC INTEGRATION IS IMPORTANT FOR CHINA
While China has been actively engaged in intra-Asia trade initiatives, it has pursued more limited pacts across the Pacific. China was not involved in the TPP, though Chinese officials closely tracked progress in those talks and carefully studied the final text. TPP signatories, including the United States, kept the door open for future Chinese accession. The fact that China was invited to the Asia-Pacific dialogue in Chile clearly signals
138
interest by many TPP countries in continuing to expand economic relations with China both bilaterally and in some succeeding regional arrangements. Chinese participation in the new Asia-Pacific dialogue comple-ments and reinforces Chinese bilateral economic relations with Asia-Pacific countries. It is a pragmatic and constructive response to the recent setback in the TPP, the region’s most comprehensive trade initiative.
As a major trading partner of most countries in the region, it is not a surprise that China already has extensive FTA networks. Among the 14 other economies (TPP12+2) that participated in the “High-Level Dialogue on Integration Initiatives for the Asia Pacific” in Chile in March 2017, China already has FTAs with nine of them (table 1). Negotiations on a China-Japan-Korea FTA started in 2013 and the 11th round of talks was held in Beijing in January 2017.9 FTAs with Canada10 and Colombia11 are under consideration.
The extensive FTA networks have facilitated China’s trade with countries in the region. In 2015, China exported $504.5 billion of goods to and imported $560.8 billion of goods from 12 existing and potential FTA partners in the Asia-Pacific region, running a modest goods deficit of $56.4 billion. Total two-way merchandise trade with the 12 countries reached $1,065.3 billion in 2015, accounting for 27 percent of China’s global two-way trade in goods. Adding China’s trade with the United States and Mexico, roughly 42 percent of China’s global merchandise trade is conducted with the TPP12+2 countries that took part in the Asia-Pacific dialogue.
Individually, the United States, Japan, and Korea are China’s top trading partners in the region. They are both China’s largest export markets and the largest suppliers of Chinese imports. Of these three econo-mies, China ran a modest bilateral goods deficit with Korea ($73.1 billion), a slight deficit with Japan ($7.2 billion), but a large trade surplus with the United States ($260.3 billion) in 2015.12
Similar to its extensive FTA networks, China also has close investment ties with the TPP12+2 coun-tries (table 2). It has bilateral investment treaties (BITs) in force with almost all 14 countries, except Brunei (signed but not in force) and the United States (negotiations are ongoing). According to official Chinese FDI data reported by the Ministry of Commerce (MOFCOM), foreign direct investment (FDI) inflows from and outflows to the TPP12+2 countries were $17.3 billion and $26.2 billion in 2015, respectively (table 3). China’s global outward FDI stock reached $1.1 trillion by the end of 2015, of which $125.3 billion, or 11.4 percent, was to the TPP12+2 countries. The United States, Singapore, and Australia are major destinations for Chinese investors in the Asia-Pacific region.
Statistics on regions other than the TPP12+2 indicate that a strikingly large amount—70.2 percent—of China’s global outward FDI stock went to Hong Kong, the Cayman Islands, and the British Virgin Islands (BVI). Hong Kong held a share of 59.8 percent, and both the Cayman Islands and BVI attracted more FDI from China than the United States.
9. See “Eleventh Round of Negotiations (Chief Delegates and DG/DDG Meetings) on a Free Trade Agreementamong Japan, China and the ROK,” Ministry of Foreign Aff airs of Japan, January 11, 2017, www.mofa.go.jp/ecm/ep/page23e_000337.html (accessed on April 3, 2017).
10. See “2016 Business Review XVI: Actively Propose and Resolutely Lead International Trade and EconomicCooperation,” Ministry of Commerce, People’s Republic of China. January 20, 2017, http://english.mofcom.gov.cn/article/newsrelease/signifi cantnews/201701/20170102506844.shtml (accessed on April 3, 2017).
11. See “China FTA Network,” Ministry of Commerce, People’s Republic of China, http://fta.mofcom.gov.cn/topic/chinaasean.shtml (accessed on April 3, 2017).
12. Statistics are based on data reported by China. Data reported by partner countries may be diff erent. For ex-ample, the United States reported a goods defi cit of $367.2 billion with China in 2015. See “Trade in Goods withChina,” US Census Bureau, www.census.gov/foreign-trade/balance/c5700.html (accessed on April 4, 2017).

139
Table 1 Merchandise trade with 14 Asia-Pacific countries plus Hong Kong and the European Union (28), China as the reporter, 2015 (billions of US dollars, current value)
Partner Trade Exports Imports Balance
Two-way
total
FTA partners
Australia China-Australia FTA 40.38 73.87 –33.49 114.25
Brunei China-ASEAN FTA 1.41 0.10 1.31 1.51
Chile China-Chile FTA 13.30 18.68 –5.38 31.98
Korea China-Korea FTA 101.47 174.56 –73.09 276.04
Malaysia China-ASEAN FTA 44.19 53.26 –9.07 97.45
New Zealand China-New Zealand FTA 4.92 6.58 –1.66 11.51
Peru China-Peru FTA 6.35 8.18 –1.83 14.54
Singapore China-Singapore FTA 53.14 27.56 25.58 80.70
Vietnam China-ASEAN FTA 66.38 25.13 41.25 91.51
FTA under negotiation
Japan China-Japan-Korea FTA 135.90 143.09 –7.20 278.99
FTA under consideration
Canada — 29.43 26.28 3.15 55.71
Colombia — 7.59 3.54 4.05 11.13
FTA-12 subtotal 504.46 560.83 –56.37 1,065.29
Mexico — 33.81 10.08 23.73 43.89
United States — 410.80 150.54 260.26 561.35
Total—14 countries 949.08 721.46 227.62 1670.54
Hong Kong — 334.29 12.77 321.52 347.06
European Union (28) — 356.61 209.32 147.29 565.94
Subtotal 1,639.98 943.56 696.42 2,583.54
Global total — 2,281.86 1,681.67 600.19 3,963.53
ASEAN = Association of Southeast Asian Nations; FTA = free trade agreement Note: Two-way trade defined as exports plus imports. Free on board (FOB) for exports; cost, insurance, and freight (CIF) for imports. Source: Trade statistics for international business development available at trademap.org.
Daniel Rosen and Thilo Hanemann (2009) discuss the limitations of MOFCOM statistics by point-ing out elements that tend to both underestimate and overestimate actual Chinese FDI flows.13 Among all distorting factors, “round-tripping” and the use of offshore centers to make third-country investments are closely related to the three previously mentioned regions (see box 1). These and other distorting factors are known, but it is hard to weight them and estimate actual FDI statistics. Given the substantial amount of Chinese FDI in Hong Kong, the Cayman Islands, and BVI, the share that Asia-Pacific economies account for in China’s global outward FDI stock is highly likely to be underestimated significantly.14
13. Several other studies also investigate the data accuracy issue of Chinese FDI. See, for example, Xiao(2004), Buckley et al. (2013), Sutherland and Anderson (2014), and García-Herrero, Xia, and Casanova (2015).
14. Our preliminary estimates on adjusted Chinese FDI indicate that by the end of 2015, about 27 percent,instead of the previously calculated 11.4 percent based on MOFCOM offi cial statistics, of China’s outward FDIstock went to Asia-Pacifi c countries.

140
Table 2 China’s investment treaties with 14 Asia-Pacific countries
Country
Bilateral investment treaties (BITs)
Status Date of signature Date of entry into force
BIT partners
Australia In force 7/11/1988 7/11/1988
Brunei Signed (not in force) 11/17/2000 —
Canada In force 9/9/2012 10/1/2014
Chile In force 3/23/1994 8/1/1995
Colombia In force 11/22/2008 7/2/2013
Japan In force 8/27/1988 5/14/1989
Korea In force 9/7/2007 12/1/2007
Malaysia In force 11/21/1988 3/31/1990
Mexico In force 7/11/2008 6/6/2009
New Zealand In force 11/22/1988 3/25/1989
Peru In force 6/9/1994 2/1/1995
Singapore In force 11/21/1985 2/7/1986
Vietnam In force 12/2/1992 9/1/1993
BIT under negotiation
United States Under negotiation — —
Treaties with investment provisions
Treaty Date of signature Date of entry into force
BIT partners
Australia Australia-China FTA 6/17/2015 12/20/2015
Brunei ASEAN-China Invest-ment Agreement
8/15/2009 1/1/2010
Canada — — —
Chile Chile-China FTA 11/18/2005 10/1/2006
Colombia — — —
Japan China-Japan-Korea trilateral investment
agreement
5/13/2012 5/17/2014
Korea China-Republic of Korea FTA
6/1/2015 12/20/2015
Malaysia ASEAN-China Invest-ment Agreement
8/15/2009 1/1/2010
Mexico — — —
New Zealand China-New Zealand FTA 4/7/2008 10/1/2008
Peru China-Peru FTA 4/28/2009 3/1/2010
Singapore China-Singapore FTA 10/23/2008 1/1/2009
Vietnam ASEAN-China Invest-ment Agreement
8/15/2009 1/1/2010
BIT under negotiation
United States — — —
Source: UNCTAD, International Investment Agreements Navigator.

141
Table 3 Foreign direct investment flow and stock, China as the reporter, 2015 (millions of US dollars, current value)
Partner
Inward Outward
Flow Stock Flow Stock
BIT partners
Australia 306.89 — 3,401.31 28,373.85
Brunei* 72.58 — 3.92 73.52
Canada 223.92 — 1,562.83 8,516.25
Chile 5.26 — 6.85 204.64
Colombia 0.12 — 3.70 554.43
Japan 3,194.96 — 240.42 3,038.20
Korea 4,034.01 — 1,324.55 3,698.04
Malaysia 480.48 — 488.91 2,231.37
Mexico 7.31 — (6.28) 524.76
New Zealand 22.47 — 348.09 1,208.72
Peru 0.28 — (177.76) 705.49
Singapore 6,904.07 — 10,452.48 31,984.91
Vietnam 0.07 — 560.17 3,373.56
BIT-13 subtotal 15,252.42 — 18,209.19 84,487.74
BIT under negotiation
United States 2,088.89 — 8,028.67 40,801.95
Total—14 countries 17,341.31 — 26,237.86 125,289.69
Hong Kong 86,386.72 — 89,789.78 656,855.24
Cayman Islands 1,444.46 — 10,213.03 62,404.08
British Virgin Islands 7,387.78 — 1,849.00 51,672.14
Subtotal 112,560.27 — 128,089.67 896,221.15
Global total 126,265.55 — 145,667.15 1,097,864.59
* = BIT with Brunei is signed but not in force.Note: Inward FDI flow data for Vietnam are for 2014. Data on inward FDI stock are not available.Source: Ministry of Commerce via Wind database.
As integration with the Asia-Pacific region has strengthened China’s economic relations with the TPP12+2 countries, growing trade and investment have also prompted China to deepen and expand coop-eration.
To further facilitate trade with Asia-Pacific countries, in 2013 Chinese Premier Li Keqiang called for an upgraded version of the China-ASEAN FTA,15 and the protocol to update the China-ASEAN FTA entered into force in 2016.16 In November 2016, China launched negotiations on upgrading bilateral FTAs
15. See “China, ASEAN to upgrade economic cooperation: Premier Li,” Xinhua News Agency, September 3,2013, http://news.xinhuanet.com/english/china/2013-09/03/c_132687476.htm (accessed on April 4, 2017).
16. See “2016 Business Review XVI: Actively Propose and Resolutely Lead International Trade and EconomicCooperation,” Ministry of Commerce, People’s Republic of China, January 20, 2017, http://english.mofcom.gov.cn/article/newsrelease/signifi cantnews/201701/20170102506844.shtml (accessed on April 3, 2017).

142
Box 1 Chinese FDI: Data limitations
The primary source for data on Chinese FDI is the Ministry of Commerce (MOFCOM). However, the official data are vul-nerable to distortions for various reasons (Rosen and Hanemann 2009).
On the aggregate level, “round-tripping,” defined as “the channeling abroad by direct investors of local funds and the subsequent return of these funds to the local economy in the form of direct investment” by the Organization for Economic Cooperation and Development (OECD),1 may overestimate statistics on FDI. Geng Xiao (2004) discusses in-centives for and different types of China’s round-tripping FDI in more detail. Hong Kong and other tax havens (the Cay-man Islands and the British Virgin Islands, for example) are popular destinations for round-tripping investment because when the investment is brought back to China, it enjoys preferential FDI treatment and other advantages (Rosen and Hanemann 2009, Shen 2011).2 Xiao (2004) estimates that 30 to 50 percent of FDI inflows to China were round-tripping investments.
On the disaggregate level, MOFCOM statistics on outward FDI by destination country are based on information sub-mitted by Chinese firms during the registration and approval process. Firms tend to report their first but not final invest-ment destinations. Therefore, stopover regions such as Hong Kong and tax havens such as the Cayman Islands and the British Virgin Islands (BVI) make up a significant share of China’s outward FDI (Rosen and Hanemann 2009). As a result, in addition to being round-tripped back to China, it is likely that some Chinese outward FDI to these stopover and tax haven regions is directed to other places. Hence, actual Chinese FDI outflows to Hong Kong, the Cayman Islands, and BVI may be overestimated, while direct investment flows to countries in the Asia-Pacific region may be underreported. For example, according to MOFCOM, Chinese outward FDI stock to the United States was $40.8 billion by the end of 2015. However, alternative transaction-based data reported by the Rhodium Group was $63.9 billion, or 57 percent higher than the amount reported by the Chinese government.3
1. Glossary of Foreign Direct Investment Terms and Definitions, OECD. Available at www.oecd.org/daf/inv/investment-policy/2487495.pdf(accessed on April 4, 2017).
2. Rosen and Hanemann (2009) pointed out that favorable tax treatment and other financial advantages enjoyed by foreign investors in China have gradually phased out in recent years. However, advantages remain in many cases either formally or informally.
3. See “China Investment Monitor” available at http://rhg.com/interactive/china-investment-monitor.
with Chile17 and New Zealand,18 and launched a joint study on upgrading the China-Peru FTA.19 The first meeting of the feasibility study on the China-Canada FTA was held in Beijing in February 2017.20
Meanwhile, over the past three decades, China has signed new BITs and improved investment provi-sions in FTAs with Asia-Pacific economies (table 2). Kate Hadley (2013) conducted a comparative analysis of China’s BIT provisions and concluded that BITs with developed economies have improved foreign investors’ rights in China and made the country’s legal system more transparent and consistent. The China-Canada BIT, China-Japan-Korea trilateral investment agreement, China-Korea FTA, and China-Australia FTA all made incremental progresses toward higher standards (see Schott and Cimino-Isaacs 2015; Schott,
17. See “Upgrading Negotiation of China-Chile FTA Offi cially Launched,” China FTA Network, Ministry ofCommerce, People’s Republic of China, November 24, 2016, http://fta.mofcom.gov.cn/enarticle/enchile/enchilenews/201611/33701_1.html (accessed on April 4, 2017).
18. See “China and New Zealand Announce to Start Upgrading Negotiation of FTA”, China FTA Network,Ministry of Commerce, People’s Republic of China, November 23, 2016, http://fta.mofcom.gov.cn/enarticle/ennewzealand/ennewzealandnews/201612/33763_1.html (accessed on April 4, 2017).
19. See China and Peru Announce to Launch Joint Study on Upgrading Free Trade Agreement”, China FTANetwork, Ministry of Commerce, People’s Republic of China, November 24, 2016, http://fta.mofcom.gov.cn/enarticle/enrelease/201611/33685_1.html (accessed on April 4, 2017).
20. See “Feasible Study and Exploratory Discussion on China-Canada FTA Held in Beijing”, China FTANetwork, Ministry of Commerce, People’s Republic of China, November 24, 2016, http://fta.mofcom.gov.cn/enarticle/enrelease/201703/34437_1.html (accessed on April 4, 2017).
143
Jung, and Cimino-Isaacs 2015). China is gradually narrowing the gap between its standards in FTAs and BITs and international best practice.
Perhaps more importantly, Asia-Pacific integration provides impetus to Chinese domestic reforms. One argument for binding international trade commitments is to push the domestic reform agenda, lock in prog-ress, and prevent backsliding through external commitments (Chauffour and Maur 2010). A recent example is Peru’s use of the FTA with the United States to lock in economic reforms, strengthen its judicial system, create a better legal environment, and attract more investment (Levy 2009). Similarly, binding commit-ments in a high-standard Asia-Pacific pact would complement and reinforce China’s ambitious domestic reform strategy to open up sensitive sectors and make meaningful regulatory commitments. Sectors where SOEs dominate, such as telecommunications and information technology, would have to compete with domestic and foreign private firms, which operate more efficiently and are more profitable than SOEs. New trade obligations could facilitate the ongoing SOE reforms at home and make the economy more market oriented. Strong investment provisions and investor protections in regional initiatives also would make China a more attractive country for both domestic and foreign investors.
In addition to reinforcing domestic reforms, a high-standard Asia-Pacific pact provides a more practi-cal and politically viable framework for US-China trade and investment relations. To be sure, the Trump administration prefers bilateral deals. However, the bilateral strategy is unlikely to bear much fruit moving forward with new Asia-Pacific initiatives, particularly in the US-China context where both sides challenge the other’s basic policies and trade disputes have a high political profile (see Schott 2017).
CONCLUDING REMARKS
US withdrawal from the TPP in January 2017 derails the most comprehensive trade and investment pact since the creation of the World Trade Organization, and blocks a viable pathway toward an FTAAP. It also sends a clear message of a shift in US trade policy toward a bilateral approach under the Trump administra-tion.
Despite US retreat from regional initiatives, the remaining TPP countries are still interested in continu-ing the process of broad regional economic integration. RCEP in its current form is not a viable pathway toward building the FTAAP, unless future talks raise the standard of the deal. The remaining TPP signa-tories are looking for a way forward that sustains the accomplishments of the TPP, which could accrue substantial benefits to them from economic reforms promised by the TPP, through restructured bilateral and regional initiatives that may include more participants in the Asia-Pacific region.
As an essential trading partner with most countries in the region, China has a big stake in participating in regional talks. Regional economic integration provides China an opportunity to expand and upgrade its trade and investment relations with Asia-Pacific economies. More importantly, Asia-Pacific economic inte-gration complements and reinforces China’s domestic economic reform to become a more market oriented economy and a more attractive investment destination. Finally, regional initiatives provide a more politi-cally viable platform for US-China bilateral economic relations and may ultimately lead to an FTAAP that includes both economies.
REFERENCESAllee, Todd, and Andrew Lugg. 2016. Who Wrote the Rules for the Trans-Pacific Partnership? Research and Politics. SAGE Journals. Available at http://journals.sagepub.com/doi/pdf/10.1177/2053168016658919.
Buckley, Peter J., Dylan Sutherland, Hinrich Voss, and Ahmad El-Gohari. 2013. The Economic Geography of Offshore Incorporation in Tax Havens and Offshore Financial Centers: The Case of Chinese MNEs. Journal of Economic Geography 12: 103–28.

144
Chauffour, Jean-Pierre, and Jean-Christophe Maur. 2010. Beyond Market Access: The New Normal of Pref-erential Trade Agreements. Policy Research Working Paper WPS 5454. Washington: World Bank. Available at http://documents.worldbank.org/curated/en/638891468326209179/Beyond-market-access-the-new-nor-mal-of-preferential-trade-agreements (accessed on April 5, 2017).
García-Herrero, Alicia, Le Xia, and Carlos Casanova. 2015. Chinese Outbound Foreign Direct Investment: How Much Goes Where after Round-Tripping and Offshoring? Working Paper No. 15/17. Bilbao: Banco Bilbao Viz-caya Argentina (BBVA) Research.
Hadley, Kate. 2013. Do China’s BITs Matter? Assessing the Effect of China’s Investment Agreements on Foreign Direct Investment Flows, Investors’ Rights, and the Rule of Law. Georgetown Journal of International Law 45, no. 1: 255–321.
Levy, Philip I. 2009. The United States–Peru Free Trade Agreement: What Did You Expect? American Enterprise Institute Working Paper Series on Development Policy No. 1. Washington: American Enterprise Institute. Avail-able at www.aei.org/wp-content/uploads/2011/10/The%20United%20States%20Peru%20Trade%20Promo-tion%20Agreement.pdf (accessed on April 5, 2017).
Rosen, Daniel H., and Thilo Hanemann. 2009. China’s Changing Outbound Foreign Direct Investment Profile: Drivers and Policy Implications. PIIE Policy Brief 09-14. Washington: Peterson Institute for International Eco-nomics.
Schott, Jeffrey J., and Cathleen Cimino-Isaacs. 2015. The China-Japan-Korea Trilateral Investment Agreement: Implications for US Policy and the US-China Bilateral Investment Treaty. In Toward a US-China Investment Treaty. PIIE Briefing 15-1. Washington: Peterson Institute for International Economics.
Schott, Jeffrey J., Euijin Jung, and Cathleen Cimino-Isaacs. 2015. An Assessment of the Korea-China Free Trade Agreement. PIIE Policy Brief 15-24. Washington: Peterson Institute for International Economics.
Schott, Jeffrey J. 2017. US Trade Policy Options in the Pacific Basin: Bigger Is Better. PIIE Policy Brief 17-7. Washington: Peterson Institute for International Economics.
Shen, Wei. 2011. National Reports: China. In Mergers and Acquisitions in North America, Latin America, Asia and the Pacific: Selected Issues and Jurisdictions (Comparative Law Yearbook of International Business, v. 32b). Alphen aan den Rijn, The Netherlands: Kluwer Law International.
Sutherland, Dylan, and John Anderson. 2014. The Pitfalls of Using Foreign Direct Investment Data to Measure Chinese Multinational Enterprise Activity. China Quarterly 221: 21–48.
Xiao, Geng. 2004. People’s Republic of China’s Round-Tripping FDI: Scale, Causes and Implications. ADB Insti-tute Discussion Paper No. 7. Tokyo: Asian Development Bank.
145
Fan Zhai is visiting fellow at China Finance 40 Forum. He has held various positions at the China Investment Corporation (CIC), as managing director and deputy head of asset allocation and strategic research department, as head of that department, and most recently as chief representative of CIC’s New York office.
CHAPTER 16
Trade Cooperation and Conflicts between the United States and China: Risks and RealitiesFan Zhai© CF40
After five years of sluggish growth, global trade showed signs of picking up in the last quarter of 2016, thanks to an upturn in global manufacturing and the stabilization of commodity prices. Despite this nascent recovery, the outlook for world trade is clouded by increasing fears of protectionism, which jeopardizes trade linkages and weakens economic expansion across the world.
The election of Donald Trump, which partly reflected an antiglobalization backlash, will likely have far-reaching impacts on global trade and economic relations. Trump has consistently expressed his opposi-tion to the large and persistent US trade deficits and blamed China’s “unfair” trade practices as a source of its trade surplus with the United States.
Reducing the bilateral trade deficit with China is an important priority for the new administration. Although it is unclear how it will do so, more protectionist measures and trade tensions between China and the United States are widely expected. During his election campaign, Trump promised to apply a 45 percent tariff on Chinese imports. If these threats materialize, a trade war seems unavoidable.
The Xi-Trump summit held April 6–7, 2017, raised hopes for a compromise between the two sides. During the summit the United States and China agreed to work out a “100-day plan” to address the bilateral trade imbalance and investment disputes. As the objective of this plan is not to limit Chinese exports to the United States but to boost US exports to China, it increases the chance of achieving a deal that would help expand and improve bilateral economic and trade relations. Agreement to work on the 100-day plan signifi-cantly reduced the risk of a trade war in the near term. However, trade tensions between the two countries may erupt again, given how questionable it is that the 100-day plan will greatly reduce the bilateral trade imbalance.
The US–China trade relationship is at a crossroads. Escalation of trade frictions and a full-blown trade war between the world’s largest and second-largest economies would jeopardize world econom ic growth

146
and prosperity; a cooperative, constructive way to confront their trade conflicts would help prevent the global economy falling off the protectionist cliff. How the relationship evolves depends on the choices of policymakers on both sides.
THE US-CHINA TRADE RELATIONSHIP AND TRADE IMBALANCE
Trade between the United States and China expanded significantly in the past 30 years. According to the US Department of Commerce, China accounted for 7.7 percent of the United States’ goods and services exports and 17.7 percent of its goods and services imports in 2016 (figure 1). According to Chinese customs statistics, the United States is China’s second-largest trade partners (after the European Union) and the largest market for its exports, accounting for 18 percent of China’s goods exports and 8 percent of its goods imports in 2016.
The large shares of China and the United States in their bilateral trade reflects the economic size of the two countries and the complementarity of their economic structures. As a land-scarce country with an enor-mous population and labor force, China has a strong comparative advantage in producing labor-intensive manufactured goods and a comparative disadvantage in agriculture. The United States is endowed with abundant land and capital and has a large pool of high-tech talent and companies, giving it a comparative advantage in agriculture and high-tech products.
The differences in and complementarities between the two countries’ endowments have supported the expansion of and largely determined the sectoral structure of their bilateral trade. Among the largest US exports to China are transport equipment, food, electronics, and services (figure 2). China has traditionally exported labor-intensive manufactured goods, such as textiles, garments, furniture, and toys, to the United States. But more sophisticated manufacturing products, such as electrical goods and machinery and some capital-intensive products, have also accounted for important shares of China’s exports to the United States in recent years, reflecting China’s ascent along the global value-added chain and massive capital accumula-tion driven by high investment rates (figure 3). Partly because of US restriction on high-tech exports to
0
2
4
6
8
10
12
14
16
18
20
1999 2001 2003 2005 2007 2009 2011 2013 2015
Goods and services exportsGoods and services imports
percent
Figure 1 China’s share of US trade, 1999–2016
Source: US Department of Commerce.

147
China, high-tech products account for only a small portion of its exports to China (about 7 percent in 2010), despite the United States’ strong comparative advantage in such goods.
Persistent large bilateral trade imbalances have caused concerns in the United States. Its merchandise trade deficit with China surged from $83 billion in 2001 to $347 billion in 2016, when it accounted for 46 percent of the total US trade deficit in goods.1 Taking into account the United States’ surplus in services trade reduces the 2016 bilateral trade deficit to $310 billion (figure 4).
Two structural factors underpin the consistent rise in the bilateral trade imbalance between China and the United States. The first is the sharp increase in US imports from China, which largely reflects the rise of regional production chains in East Asia since the late 1990s, through which many multinational firms have shifted their export-oriented manufacturing facilities from other Asian countries to China. In the current
1. According to Chinese customs statistics, the 2016 bilateral balance in merchandise trade was $250.7 billion, about 30 percent smaller than the trade balance reported by the US Bureau of Economic Analysis. The dis-crepancy refl ects both technical and nontechnical diff erences, such as diff erent prices used in trade statistics, diff erent declarations of country of origin, diff erent exchange rate factors, and underinvoicing. A 2004 joint US–China study of the discrepancies concluded that a large portion can be attributed to the re-export of China’s products from third countries to the United States. See Martin (2016) for a survey of the literature.
0
5
10
15
20
25
30
Figure 2 Major US exports to China, 2015
Source: Oxford Economics (2017).
Finance and in
surance
Other b
usiness
service
s
Light manufactu
ring
Transport
(service
s)
Fuels, metals,
and minerals
Machinery
Chemicals a
nd pharmace
uticals
Miscella
neous
Electronics
Food and live anim
als
Travel (service
s)
Transport
equipment
billions of US dollars

148
era of globalized production, in which 80 percent of world trade is conducted via global supply chains (UNCTAD 2013), the export of a single good from one country to another could represent exporting of value-added from several countries, with each specializing in a particular production stage or components of the final product. Consequently, traditional trade statistics based on flows tend to inflate the export values for China, which is often involved in the final stages of international production chains. Measuring the 2011 trade deficit in value-added, based on global input-output data, reduced it by a third, according to a 2015 study by the Organization for Economic Cooperation and Development and the World Trade Organization (WTO). An updated version of the study finds that China accounted for 33.4 percent of the US value-added trade deficit in 2015, rather than the headline number of 49.6 percent based on trade flows (Ha 2017).
The second structural factor is China’s high savings rate over the past decade, which led to huge pres-sures for capital outflows. Because of the role of the US dollar as a global reserve currency and the attractive-ness of US financial markets to global investors, China’s massive net capital outflows have been associated with net purchases of dollar-denominated assets. China’s capital inflows into the United States helped drive up the value of the dollar and increase the size of the current account deficit. This factor accounts for the increase in China’s current account surplus in the 2000s and the corresponding increase in the current account deficit in the United States (figure 5). Savings-investment balances in both countries have deter-mined their trade balances. The unique role of the dollar gives the United States the ability to run trade deficits over the long term.
0
10
20
30
40
50
60
70
80
90
Iron and st
eel
Optical in
strument, e
tc.
Footwear a
nd gaiters
Plastic a
rticle
s
Transport
equipment
Toys, games, a
nd sports
equipment
Furnitu
re, bedding, la
mps, etc.
Apparel and cl
othing
Machinery and co
mputers
billions of US dollars
Figure 3 Major Chinese exports to the United States, 2016
Source: China Customs statistics.
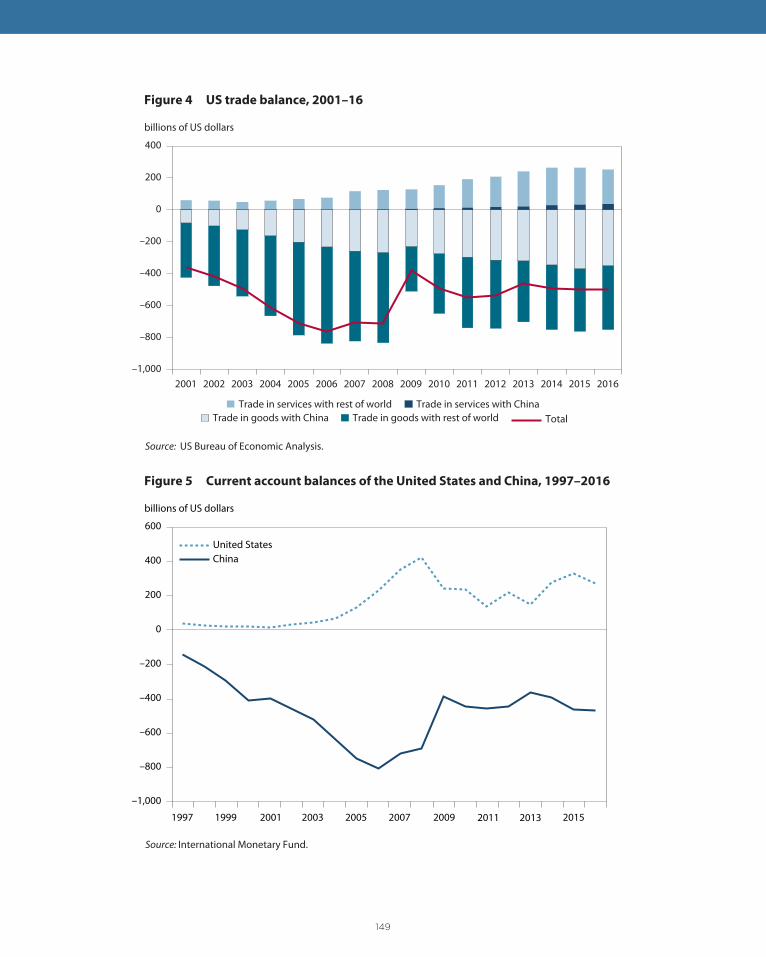
149
–1,000
–800
–600
–400
–200
0
200
400
2001 2002 2003 2004 2005 2006 2007 2008 2009 2010 2011 2012 2013 2014 2015 2016
Trade in services with rest of world Trade in services with ChinaTrade in goods with China Trade in goods with rest of world Total
billions of US dollars
Figure 4 US trade balance, 2001–16
Source: US Bureau of Economic Analysis.
–1,000
–800
–600
–400
–200
0
200
400
600
1997 1999 2001 2003 2005 2007 2009 2011 2013 2015
United StatesChina
billions of US dollars
Figure 5 Current account balances of the United States and China, 1997–2016
Source: International Monetary Fund.
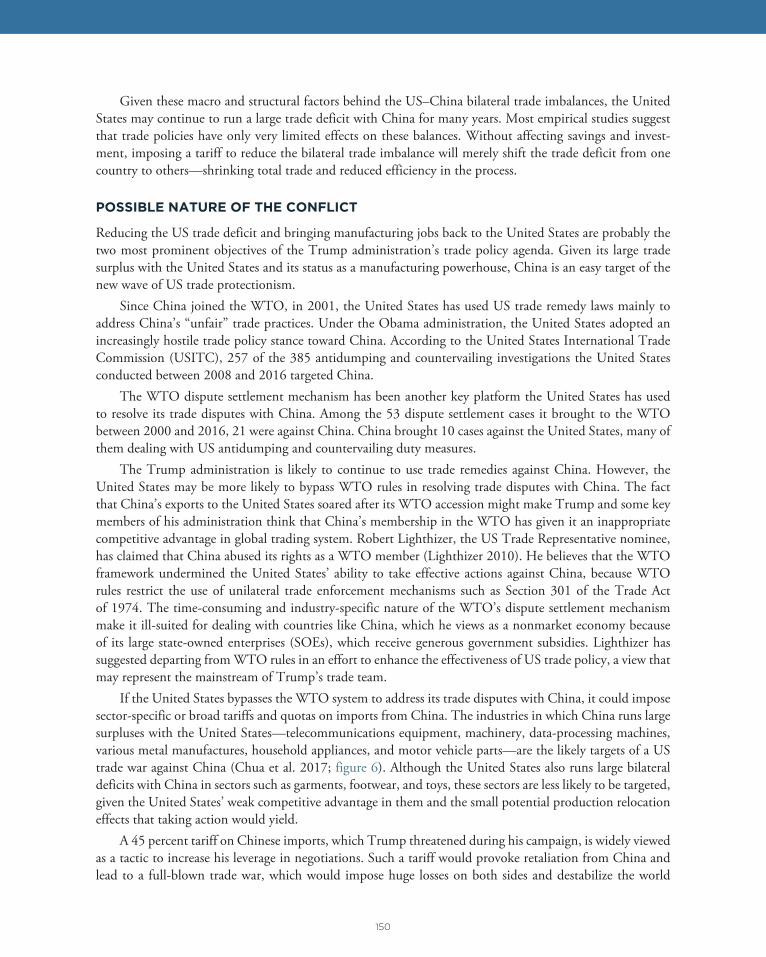
150
Given these macro and structural factors behind the US–China bilateral trade imbalances, the United States may continue to run a large trade deficit with China for many years. Most empirical studies suggest that trade policies have only very limited effects on these balances. Without affecting savings and invest-ment, imposing a tariff to reduce the bilateral trade imbalance will merely shift the trade deficit from one country to others—shrinking total trade and reduced efficiency in the process.
POSSIBLE NATURE OF THE CONFLICT
Reducing the US trade deficit and bringing manufacturing jobs back to the United States are probably the two most prominent objectives of the Trump administration’s trade policy agenda. Given its large trade surplus with the United States and its status as a manufacturing powerhous e, China is an easy target of the new wave of US trade protectionism.
Since China joined the WTO, in 2001, the United States has used US trade remedy laws mainly to address China’s “unfair” trade practices. Under the Obama administration, the United States adopted an increasingly hostile trade policy stance toward China. According to the United States International Trade Commission (USITC), 257 of the 385 antidumping and countervailing investigations the United States conducted between 2008 and 2016 targeted China.
The WTO dispute settlement mechanism has been another key platform the United States has used to resolve its trade disputes with China. Among the 53 dispute settlement cases it brought to the WTO between 2000 and 2016, 21 were against Chin a. China brought 10 cases against the United States, many of them dealing with US antidumping and countervailing duty measures.
The Trump administration is likely to continue to use trade remedies against China. However, the United States may be more likely to bypass WTO rules in resolving trade disputes with China. The fact that China’s exports to the United States soared after its WTO accession might make Trump and some key members of his administration think that China’s membership in the WTO has given it an inappropriate competitive advantage in global trading system. Robert Lighthizer, the US Trade Representative nominee, has claimed that China abused its rights as a WTO member (Lighthizer 2010). He believes that the WTO framework undermined the United States’ ability to take effective actions against China, because WTO rules restrict the use of unilateral trade enforcement mechanisms such as Section 301 of the Trade Act of 1974. The time-consuming and industry-specific nature of the WTO’s dispute settlement mechanism make it ill-suited for dealing with countries like China, which he views as a nonmarket economy because of its large state-owned enterprises (SOEs), which receive generous government subsidies. Lighthizer has suggested departing from WTO rules in an effort to enhance the effectiveness of US trade policy, a view that may represent the mainstream of Trump’s trade team.
If the United States bypasses the WTO system to address its trade disputes with China, it could impose sector-specific or broad tariffs and quotas on imports from China. The industries in which China runs large surpluses with the United States—telecommunications equipment, machinery, data-processing machines, various metal manufactures, household appliances, and motor vehicle parts—are the likely targets of a US trade war against China (Chua et al. 2017; figure 6). Although the United States also runs large bilateral deficits with China in sectors such as garments, footwear, and toys, these sectors are less likely to be targeted, given the United States’ weak competitive advantage in them and the small potential production relocation effects that taking action would yield.
A 45 percent tariff on Chinese imports, which Trump threatened during his campaign, is widely viewed as a tactic to increase his leverage in negotiations. Such a tariff would provoke retaliation from China and lead to a full-blown trade war, which would impose huge losses on both sides and destabilize the world

151
economy. Protectionist action in the 1930s, in the form of the Smoot-Hawley Act in the United States and retaliation in European countries, turned a recession into a deep global depression. This historic lesson is a sobering reminder for contemporary policymakers. Given the devastating consequences of a US–China trade war, Trump is very unlikely to impose a 45 percent tariff at the initial stage. However, a threat is cred-ible only when people believe it could be executed. The tactical considerations of all players in this game may increase uncertainties about how the trade conflict between the United States and China will evolve.
If the United States started a trade war with China, how would China respond? China might have to take a passive approach, partly because it needs time to identify the bottom line of the Trump administra-tion and partly because of the critical importance of the United States as its largest export market. The Chinese government may have a strong desire to negotiate a grand bargain deal through a compromise.
If the United States imposed punitive trade measures on China, China would certainly retaliate, but it would likely confine its retaliation to trade in order to avoid endangering the overall bilateral relationship. In a trade-confined tit-for-tat approach, China could impose same duties or quotas on US exports in sectors in which China runs large deficits with the United States, such as aircraft, oilseeds, soybeans, pulp and wood products, and passenger motor vehicles. It could also extend trade restrictions to services, such as tourism and education, in which the United States has run a growing bilateral surplus. China’s government and SOEs could stop purchasing US products and services.
If the Trump administration imposed a 45 percent tariff, China would likely to impose a similar tariff on imports from the United States, leading to a full-blown trade war. China might also ban the export of some strategic goods, such as rare earth metals, as it did for Japan in 2010. This threat might not be effective, because China has monopoly power in international markets over only a small number of strategic goods. Even the threat of banning rare earth exports is limited, because although China produces and refines nearly 90 percent of the world’s rare earth metal supply, it possesses only about one-third of global reserves. There is no shortage of rare earth deposits outside China. The fact that stiff price competition, rather than resource availability, has been the key driver behind China’s monopoly position suggests that its monopoly power is largely temporary and illusive.
–100 –80 –60 –40 –20 0 20
Electrical machinery and parts, telecommunications equipmentMachinery and mechanical appliances, computers
Apparel and clothingFurniture, bedding, lamps, etc.
Toys, games, and sports equipmentFootwear and gaiters
Iron and steelMade-up textile articles
Plastic articlesLeather and travel goods
CerealsMiscellaneous chemical goods
Pulp of wood, waste of paperAircraft
Oilseeds
billions of US dollars
Figure 6 US bilateral trade balances with China in selected sectors, 2016
Source: China Customs statistics.

152
Market analysts frequently suggest that China could let the renminbi weaken significantly in response to a hostile trade move by the United States. However, unless the United States labeled China a currency manipulator and followed up with countervailing duties, it is unlikely that China would play the renminbi card. A sharp depreciation of the renminbi would exacerbate already heavy pressures of capital outflows, depress domestic asset markets, and undermine the financial stability. China’s policymakers therefore have a strong preference to maintain a stable exchange rate before they plug the loopholes in China’s managed capital account or defuse its potential debt bombs. At least in the near future, a stable renminbi exchange rate is in the best interest of both the Chinese and the world economy. Moreover, a sharply devalued currency would effectively multilateralize the US–China bilateral conflict, turning a bilateral trade war into a global currency war. That said, the possibility that China depreciates, or even engages in a one-time massive devaluation, cannot be excluded.
TOWARD A GRAND BARGAIN
A trade war between the United States and China would hurt both countries, imposing GDP and welfare losses on both in the near and long term. Given its relatively weak trade dependence and strong market power, the United States could enjoy a terms of trade gain if it imposed higher tariffs on China, as optimal tariff theory in academic trade literature suggests. Doing so could put the United States in a more advanta-geous position in possible US–China trade conflicts. From this perspective, a tit-for-tat confrontation with the United States on the bilateral trade front may not be a good choice for China. China may need to think about weapons beyond merchandise trade to address Trump’s trade threats.
Alternatively, showing a certain level of accommodation in order to negotiate a deal may make sense. Although the United States may be able to withstand the long-term impacts of a trade war with China, the short-term shocks would be large (Noland, Robinson, and Moran 2016). The fact that some industries, such as aircraft, and certain agricultural sectors would be heavily adversely affected puts political pressures on the Trump administration to reach a deal with China.
Compromises need to be made. Two issues—the bilateral trade deficit and state capitalism—are likely to be prominent in the bargaining.
Bilateral Trade Deficit
The overall trade balance is determined by the overall savings-investment balance; bilateral trade balances are determined by differences in production structures and comparative advantage. Bilateral trade balances have no meaning in terms of bilateral competitiveness. However, given the weight the Trump administra-tion has assigned to the US–China trade imbalance in it trade policy agenda, some reduction in it may have to be made in order to avoid a trade confrontation between the United States and China.
In the near term, China could send a procurement delegation to the United States and ink a mega-import deal there, as it has done in the past. It could also redirect some import demand from other countries to the United States through SOEs. These measures would have immediate effects on the bilateral trade balance.
China could also offer to reduce import barriers on agricultural products and services (such as tourism, finance, software, and some cultural products) in which the United States has strong comparative advantage and large penetration in the Chinese market. Given its rapidly growing economy and middle class, China has huge potential to become an important market for US services exports. It is already the United States’ third-largest services export market, with $53.5 billion in 2016 (7.1 percent of the United States’ total services exports). Reducing barriers to services imports would not only help increase imports from the United States, it would also help meet the demand for services by Chinese households, increasing their welfare.
153
Relaxation of the US ban on high-tech exports to China could also be included in the grand bargain deal. Sundaram (2014) estimates that the value of such exports could increase by 25–50 percent if the United States treated China like Germany or the United Kingdom in terms of its export controls.
In the longer term, China may rethink its manufacturing offshoring strategy. Although Western multi-national corporations still play leading roles in regional production chains, more and more Chinese manu-facturing firms have climbed up the value-added chain, gaining controlling power in whole production networks. By relocating part of the low-end final stage production in neighboring countries, these firms may be able to improve their competitive position amid rising domestic labor and land costs. Doing so would be in line with China’s Belt and Road Strategy, which seeks to enhance manufacturing cooperation among Belt and Road countries.
State Capitalism
The concern over state capitalism (i.e., the very large role the state plays in China’s commercial, economic, and trade activities) is another important factor undermining its trade relationship with the United States (Morrison 2017). Although the share of state sectors in economic activities declined significantly in the past four decades of reform and opening-up, SOEs still play dominant roles in some import sectors, such as finance, energy, transportation, and telecommunications. Central and local governments influence the economy tax breaks, subsidies, preferential loans, market entry restrictions, discriminatory regulations, and other measures. Sometimes these measures are carried out in an opaque way, raising suspicions that state intervention gives unfair competitive advantage to exporting firms.
In recent years the state’s role in the economy has indeed expanded to the detriment of private sector and market forces, spurring the debate over guo jin min tui (“the state advances, the private sector retreats”). Because the market mechanism has not played a decisive role in the economy, some firms may have privileged positions in conducting economic activities. If these firms exert influence in the making of public policy, further reform may be stymied, leading to the risk of state capture. To speed up the reforms in the area of SOEs, finance and macroeconomic management can provide new momentum for China’s economic growth and assuage US concerns over bilateral trade issues.
RISK OF CATASTROPHIC ESCALATION
Recent developments have increased the possibility of the United States and China reaching a grand bargain to avoid a trade conflict, but the risk that trade conflict escalates to a broad economic and political confron-tation should not be underestimated. Given the relatively advantageous position of the United States in a bilateral trade confrontation, the Trump administration may play hardball in trade negotiations, forcing China to respond in kind and consider using weapons beyond merchandise trade.
China could have some leverage in the services sector and investment. A massive one-time nominal devaluation of the renminbi could also serve as a credible threat. Depreciation would be in line with the real depreciation pressure caused by US trade protectionism and partially divert the burden to other parts of the world. The result would be higher inflation and financial instability, but as a last resort to deal with the extreme environment of a trade war, its benefits may outweigh its harm.
China could also respond in the field of diplomatic and security cooperation. Indeed, to deter the United States from starting a trade war, it needs to prepare for a broad war with a wide set of policy weapons.
The evolution of this policy game will be complicated, and the risk of policy mistakes could be high. A US-initiated trade war could escalate to a full-scale confrontation between the world’s largest and second-
154
largest economies, engulfing other countries in the beggar-thy-neighbor trap. The consequence for the world economy would be catastrophic. Raising awareness of the consequences among policymakers in both countries, especially the Trump administration, is crucial to avoid the worst.
CONCLUSIONS
Close economic and trade ties between the world’s two largest economies benefit not only both countries but also the global economy. The different economic development stages of the United States and China, as well as the strong complementarity between their economic structures, lay a solid foundation for cooperation.
The difficulties and problems in bilateral trade relations are largely the result of macro and structural imbalances in both economies, which require longer-term and broader views to address. Protectionism cannot solve the problems of trade imbalances or diminished manufacturing employment in the United States. It would reduce economic efficiency and consumer welfare. There would be no winners in a trade war, and escalation beyond economic and trade dimensions would endanger the whole world.
China is on the way toward rebalancing its domestic economy and pushing forward market-oriented reform. These changes will eventually help reduce US–China trade gaps and alleviate US concerns over “unfair” trade practices. If pressure from President Trump spurs China to speed its structural reform to remove domestic distortions, his protectionist threats will actually have been a boon for China.
Amid the new wave of antiglobalization and threat of rising US trade protectionism, China may also think beyond retaliation to deal with the challenges. Making more bold moves in unilateral trade and invest-ment liberalization and taking on larger roles in prompting regional integration arrangements would not only help China gain the moral high ground in the international community, it would also benefit China’s long-term reform and development. With these efforts China could usher in a new age of globalization with its Asian neighbors and save the world economy from the proliferation of protectionism.
REFERENCESChua, Johanna, et al. 2017. Asia Economics View: Trump’s Trade and Tax Policy. Impact on Asia (January 17) . CITI Research.
Ha, Jiming. 2017. The Impact of US Policy Adjustment. Background paper prepared for the 2017 CF40-PIIE Joint Report. Washington: Peterson Institute for International Economics.
Lighthizer, Robert. 2010. Evaluating China’s Role in the World Trade Organization over the Past Decade. Testi-mony before the US–China Economic and Security Review Commission.
Martin, Michael F. 2016. What’s the Difference? Comparing US and Chinese Trade Data. RS22640. Washington: Congressional Research Service.
Morrison, Wayne M. 2017. China–US Trade Issues. RS33536. Washington: Congressional Research Service.
Noland, M, S. Robinson, and T. Moran. 2016. Impact of Clinton’s and Trump’s Trade Proposals. In Assessing Trade Agendas in the US Presidential Campaign. PIIE Briefing 16-6. Washington: Peterson Institute for Interna-tional Economics.
OECD (Organization for Economic Cooperation and Development) and WTO (World Trade Organization). 2015. Trade in Value-Added: China. Paris.
Oxford Economics. 2017. Understanding the US–China Trade Relationship. Report prepared for the US-China Business Council (January). Oxford, UK
Sundaram, Asha. 2014. Export Controls. In Bridging the Pacific: Toward Free Trade and Investment Between China and the United States, ed. C. Fred Bergsten, Gary Clyde Hufbauer, and Sean Miner. Washington: Peterson Institute for International Economics.
UNCTAD (United Nations Conference on Trade and Development). 2013. Global Value Chains and Develop-ment: Investment and Value Added Trade in the Global Economy. Geneva.

© 2017 Peterson Institute for International Economics.© 2017 CF40, chapters 4, 5, 11, and 16. CF40 is solely responsible for the content and data in these chapters.All rights reserved.
The Peterson Institute for International Economics is a private nonpartisan, nonprofit institution for rigorous, intellectually open, and indepth study and discussion of international economic policy. Its purpose is to identify and analyze important issues to make globalization beneficial and sustainable for the people of the United States and the world, and then to develop and communicate practical new approaches for dealing with them. Its work is funded by a highly diverse group of philanthropic foundations, private corporations, and interested individuals, as well as income on its capital fund. About 35 percent of the Institute’s resources in its latest fiscal year were provided by contributors from outside the United States. A list of all financial supporters is posted at https://piie.com/sites/default/files/supporters.pdf.

PETERSON INSTITUTE FOR INTERNATIONAL ECONOMICS1750 MASSACHUSETTS AVENUE, NW WASHINGTON, DC 20036-1903 USA
202.328.9000 Tel202.328.5432 Fax
www.piie.com