pile foundation: west seattle freeway bridge...
TRANSCRIPT

Transportation Research Record 884 29
Pile Foundation: West Seattle Freeway Bridge Replacement
GEORGE YAMANE AND MING-JI UN WU
The planning and methods used in assessing an economically optimal and technically appropriate pile foundation for the construction of the West Seattle Freeway Bridge are described. The site and subsurface conditions also are described. Of special interest is the process of foundation selection and the consequent test procedures and equipment used. A test pile program was initiated at five selected locations along the proposed alignment to determine and evaluate the driveability and vertical load-carrying capacity of the concrete and steel piles. This testing program was accomplished during the initial design stage. The program included hammer selection, test pile driving, pile loading tests, load transfer, and dynamic measurements. The results of these operations are presented. The pile test program provided the information necessary for development of pile installation specifications. Test pile-driving records are believed to have assisted the contractors in preparing their bids. Overall project costs were below the engineer's estimate.
The City of Seattle is constructing a replacement bridge and related roadway system where a ship collision left the north bascule bridge across the west waterway inoperable at the Southwest Spokane Street corridor of the West Seattle Freeway. The corridor is one of the busiest in the State of Washington; a daily traffic count of 80 000 vehicles/day is projected for this corridor by year 2000. The bridge replacement consists of elevated structures and interchanqes located at the east and west ends of the project, as shown on Fiqure 1.
The project is divided into four major parts for design and contract award purposes: (a) main span structure, (b) Harbor Island structure, (cl east interchange structures, and (d) west interchange structures. Construction began on the main span structure in November 1980, and the total project is scheduled to be completed by 1984. Because of thick deposits of alluvial sands and silts along the project alignment, heavy structural loads, and the potential of soil liquefaction during a strong earthquake, deep pile foundations were selected for support.
Figure 1. Site plan and generalized subsurface profile.
tow w u.
WEST INTERCHANGE
WEST WATERWAY~
WEST
This paper describes the selection process for the piles and capacities, verification by the pile load test program, and the incorporation of the pile test results into the contract specifications.
SITE DESCRIFrION AND GEOLOGY
The site of the bridge replacement is near the mouth of the Duwamish River where it empties into Puget Sound on the south shore of Elliot Bay. A mile before the Duwamish reaches Elliot Bay, it divides into two channels that flow on either side of Harbor Island. Both waterways are about 350 ft wide. The west waterway is used as a navigation channel for large vessels.
The Duwamish Valley is situated in the central part of the Puget Lowland, which is a structural and topographic trough. It is underlain chiefly by thick deposits of Quaternary sediments that overlie interbedded Tertiary volcanic and sedimentary bedrock. Most of the major topographic features of the lowlands are the results of glacial deposition or erosion.
The original valley floodplain about 10-15 ft by hydraulic fill.
has been raised The alluvial de-
posits are as much as 270 ft thick and consist of loose to dense sand with scattered layers of silt that have some plasticity. A generalized subsurface profile is shown in Figure 1.
FOUNDATION SELECTION AND TESTING
Timber, steel pipe of various diameters and wall thicknesses, and prestressed concrete piles of various diameters were considered during the preliminary design stage in order to select a cost-effective pile foundation for this project. In selecting the pile type and capacity, foundation settlement, lat-
MAIN SPAN HARBOR ISLAND EAST
SUBSTRUCTURE ' STRUCTURE INTERCHANGE
SITE PLAN
EAST
WEST EAST WATERWAY WATERWAY
CHARBOR ISLAND El I I
z 0 ;: < > w ...J w
GLACIAL
LOOSE ;SAND I
ALLUVIUM I
DEPOSITS I 1
GENERALIZED SUBSURFACE PROFILE
30
Table 1. Concrete pile load testing program. Item
Load test pile diameter (in) Anchor piles (concrete)
Tests performed Dynamic measurements Compression load
Table 2. Steel·pipe pile load testing program. Item
Load test pile (open-ended) Anchor piles (steel pipe)
Tests performed Dynamic measurements Compression load Tension load
eral resistance, and bending of piles (with and without soil liquefaction under the earthquake design) were considered among other structural factors.
The preliminary pile lengths and capacities were estimated by using several static-capacity analysis methods and results of pile load tests per formed near the project site. l!ased on the studies, structural requirements, and economic considerations, the following piles were selected for design:
Structure Main span
Main line structure
Pile Type
36-in-diameter, 0.75-in-wall steel pipe pile, driven open-endedi 600-ton design capacity
24-in octagonal prestressed concrete piles with 15-indiameter hole in the center and the bottom end pluggedi 200-ton design capacity
The estimated pile lengths were about 140-220 ft for the steel pipe piles and about 70-120 ft for the concrete piles.
Field explorations consisted of test borings, Dutch cone probes, and in situ pressuremeter tests. Laboratory shear tests were performed to evaluate the frictional resistance between concrete or steel and soil. Triaxial compression and consolidation tests were also performed.
TEST PILE PROG~
During the initial design stage, a pile-driving and pile-loading test program was initiated at five selected locations (as shown in Figure 1) along the proposed alignment to determine and evaluate the drivability and vertical load-carrying capacities of the concrete and steel piles. Driving test piles consisted of 16 .5- and 24-in octagonal pres tressed concrete piles and 24- and 36-in-diameter steel pipe piles. The wall thickness of steel piles varied from O. 75 to l. 25 in and were driven either closed-ended [fitted with an Associated Pile and Fitting Corp. (AP&F) conical tip] or open-ended (tip reinforced). Dynamic measurements were made by Goble & Associates on selected piles during test pile driving. The load test piles were instrumented to determine the load distribution along the pile.
Pile load tests were made on 24-in prestressed hollow concrete piles at three locations that were designated sites A, B, and E. Pile load tests on 24-in-diameter by 1.25-in-wall steel pipe piles were
Transportation Research Record 884
Site A Site B Site E
24 24 24 Two at 16.S in and
two at 24 in Four at 24 in Four at 16.5 in
2 I
4 I
Site C Site D
24xl.25 in 24xl.25 in 36x0. 75 in; open-ended 24xl.25 in; closed-end 24x0.75 in; open-ended
36x0.75 in; open-ended 24xl.25 in ; open-ended 24x0.75 in; closed-end
3 I I
3 I I
made at each of the two main pier locations designated as sites C and D. The locations of these five load tests are indicated in Figure l. A brief summary of the pile load testing program in given in Tables l and 2.
CONCRETE PILES: GITES A, D, AND E
Pile load test results and interpretations at sites A and B are presented separately from site E because of differences in subsurface conditions. The soil conditions encountered at sites A, B, and E are shown in Figures 2, 3, and 4, respectively.
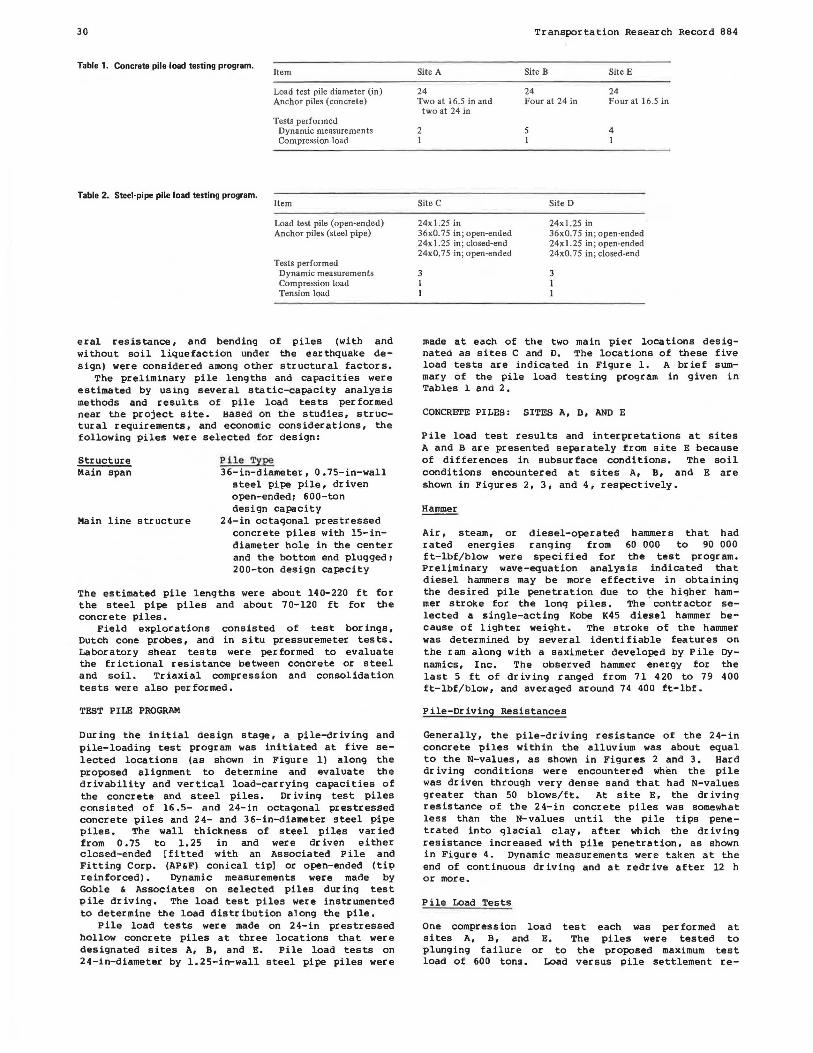
Air, steam, or diesel-operated hammers that had rated energies ranging from 60 000 to 90 000 ft-lbf/blow were specified for the test program. Preliminary wave-equat i on analysis indicated that diesel hammers may be more effective in obtaining the desired pile penetration due to the higher hammer stroke for the long piles. The , contractor selected a single-acting Kobe K45 diesel hammer because of lighter weight. The stroke of the hammer was determined by several identifiable features on the ram along with a saximeter developed by Pile Dynamics, Inc. The observed hammer energy for the last 5 ft of driving ranged from 71 420 to 79 400 ft-lbf/blow, and averaged around 74 400 ft-lbf.
Pile-Driving Resistances
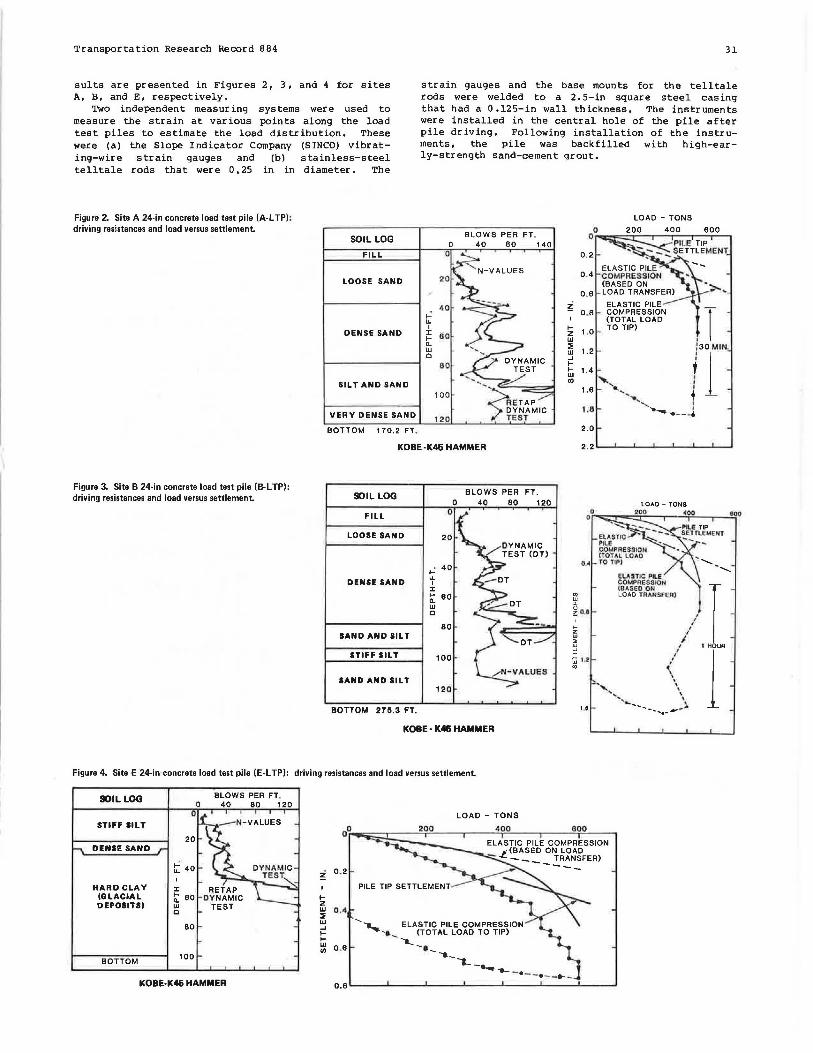
Generally, the pile-driving resistance of the 24- i n concrete piles within the alluvium was about equal to the N-values, as shown in Figures 2 and 3. Hard driving conditions were encountered when the pile was driven through very dense sand that had N-values greater than 50 blows/ft. At site E, the driving resistance of the 24-in concrete piles was somewhat less than the N-values until the pile tips penetrated into glacial clay, after which the driving resistance increased with pile penetration, as shown in Figure 4, Dynamic meas urements were taken at the end of continuous driving and at redr ive after 12 h or more.
Pile Load Tests
One compression load sites A, B, and E. plunging failure or load of 600 tons.
test each was performed at The piles were tested to
to the proposed maximum test Load versus pile settlement re-
Transportation Research Record 884
sults are presented in Figures 2, 3, and 4 for sites A, B, and E, respectively.
Two independent measuring systems were used to measure the strain at various points along the load test piles to estimate the load distribution. These were (a) the Slope Indicator Company (SINCO) vibrating-wire strain gauges and (bl stainless-steel telltale rods that were 0. 25 in in diameter. The
Figure 2. Site A 24-in concrete load test pile (A·L TP) : driving resostances and load versus settlement.
SOIL LOG
FILL
LOOSE SAND
DENSE SAND
SILT AND SAND
VERY DENSE SAND
BOTTOM 170.2 FT.
31
strain gauges and the base mounts for the telltale rods were welded to a 2.5-in square steel casing that had a 0.125-in wall thickness. The instruments were installed in the central hole of the pile after pile driving. Following installation of the instruments, the pile was backfilled with high-early-strength sand-cement qrout.
~ IL I
I IQ. w 0
100
120
BLOWS PER 40 80
FT. 140
z I
t-z w ::; w ..J I-I-w
"'
0 0
0.2
0 .4
0.6
0 .8
1.0
1.2
1.4
1.8
1.8
2.0
LOAD - TONS
200 400 800
.T / 30MIN. I
' '- I ,, I
', + ... , '-._ ... __ j
KOBE·K46 HAMMER 2.2
Figure 3. Site B 24-in concrete load test pile (B-L TP): driving resistances and load versus settlement. SOIL LOG
FILL
LOOSE SAND 20
DENSE SAND
SAND AND SILT
STIFF SILT
IAND AND SILT
BOTTOM 275.3 FT.
~ 40 IL I
I :;: 80 w 0
80
100
120
BLOWS PER FT. 120
KOBE· K46 HAMMER
Figure 4. Site E 24-in concrete load test pile (E·L TP): driving resistances and load versus settlement.
SOIL LOG
STIFF llLT
DENSE SAND
HARD CLAY (GLACIAL DEPOllTSI
BOTTOM
20
t 40 I
I :;: 60 w 0
80
100
BLOWS PER FT. 40 80 120
KOBE·K46 HAMMER
z 0 . 2
I
1-z ~ 0.'I w ..J II-w
"' 0 .6
'....... ELASTIC PILE COMPRESSION •• (TOTAL LOAD TO TIP) --._ -·- -._ ,_ ___
..._ _______ ... _
32
Load Transfer Measurements
Loads at the strain gauge level were computed by using the following formula:
where
P applied load, Ee composite elastic modulus, ~ cross-sectional a rea of pile, and qe = change in strain of pile between zero load
and applied load.
The deflection between the top of the telltale rod and the top of the pile was measured with a linear potentiometer. The average load between two telltale tips was determined by the following equation:
P =Ee *Ap *.:l.L/L (2)
where L is the distance between the two telltale tips and AL is the measured deflection difference of the two telltales. The possible residual strain of the backfilled grout was not measured. The composite elastic modulus of concrete was computed by assuming that the load at the top-level instruments was equal to the applied load on top of the pile by using the above equations.
Transportation Research Record 884
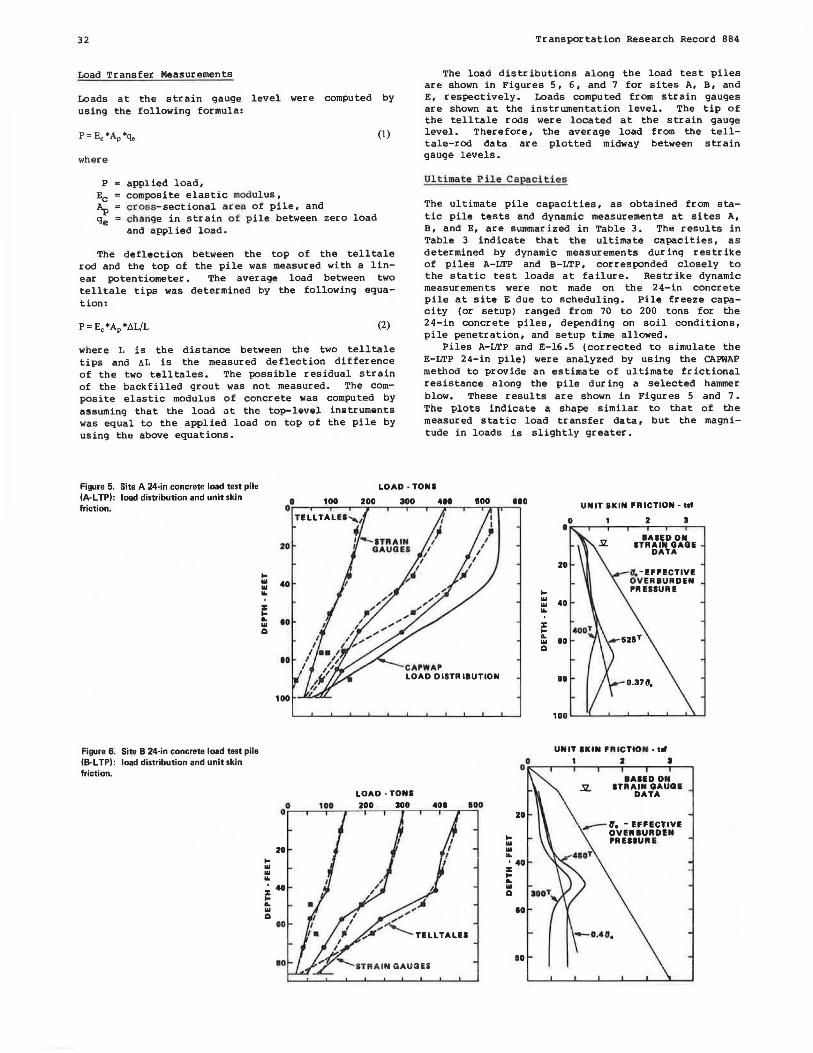
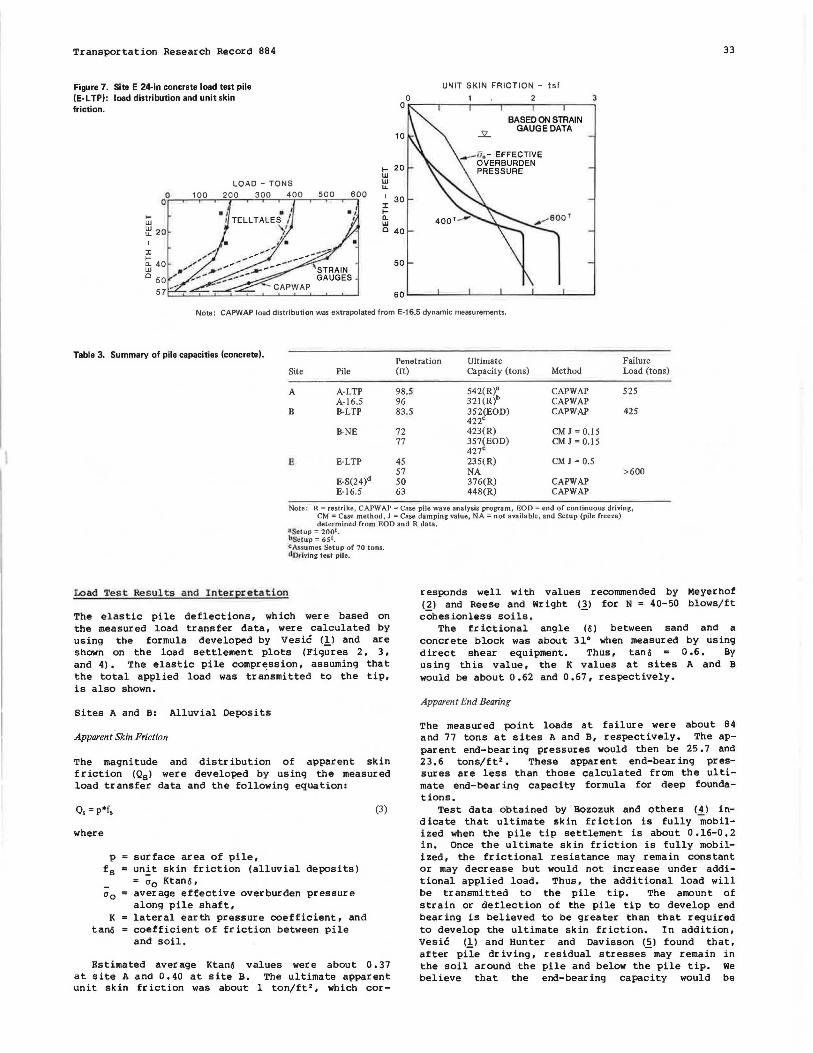
The load distributions along the load test piles are shown in Figures 5, 6, and 7 for sites A, B, and E, respectively. Loads computed from strain gauges are shown at the instrumentation level. The tip of the telltale rods were located at the strain gauge level. Therefore, the average load from the telltale-rod data are plotted midway between strain gauge levels.
Ult i mate Pile Capac ities
The ultimate pile capacities, as obtained from static pile tests and dynamic measurements at sites A, B, and E, are summarized in Table 3. The results in Table 3 indicate that the ultimate capacities, as determined by dynamic measurements dur inq res trike of piles A-LTP and B-LTP, corresponded closely to the static test loads at failure. Restrike dynamic measurements were not made on the 24-in concrete pile at site E due to scheduling. Pile freeze capacity (or setup) ranged from 70 to 200 tons for the 24-in concrete piles, depending on soil conditions, pile penetration, and setup time allowed.
Piles A-LTP and E-16.5 (corrected to simulate the E-LTP 24-in pile) were analyzed by using the CAPWAP method to provide an estimate of ultimate frictional resistance along the pile during a selected hammer blow. These results are shown in Figures 5 and 7 . The plots indicate a shape similar to that of the measured static load transfer data, but the magnitude in loads is slightly greater.
Figure 5. Site A 24-in concrete load test pile LOAD ·TONI (A·LTP): load distribution and unit skin 200 IOO friction. UNIT SKIN FRICTION· tlf
0 2 3 0
IAIED ON ITllAIN GAGE
DATA
20 ... a_- EFFECTIVE ... OVERBURDEN ... PRESSURE ... ...
"' 40 z ... ... ... .. ... :c Q ...
L 80 ...
Q
BO
100
Figures; Site B 24-in concrete load test pile UNIT SKIN FR ICTIO N · tof
(B-LTP): load distribution and unit skin 00 1 z I
friction. IAIED ON
1 ITllAIN GAUGI DATA
0 1500 0 20
__ II. - EFFECTIVE
... OVElllUllDIN ... PREllUll l 20 ... ... ... ... '40 ... :c ... ... ..
~ 40 ... Q ...
....::a .. ... 80 Q ,, ....
IO ,.1tt"......_ TELLTALEI
'°
Transportation Research Record 884
Figure 7. Site E 24-in concrete load test pile (E-L TP): load distribution and unit skin friction.
fw ~ 20
LOAD - TONS
f-w w LL
500 600 :c f-c.. w c
0 0
10
20
30
40
50
UNIT SKIN FRICTION - tsf
BASED ON smAIN GAUGE DATA
33
3
Note: CAPWAP load distribution was extrapolated from E-16.5 dynamic measurements.
Table 3. Summary of pile capacities (concrete I.
Site
A
B
Pile
A-LTP A-16.5 B-LTP
B-NE
E-LTP
E-S(24)d E-16.5
Penetration (ft)
98.5 96 83.5
72 77
45 57 50 63
Ultimate Capacity (tons)
542(R)3
32l(R)b 352(EOD) 422° 423(R) 357(EOD) 427c 235(R) NA 376(R) 448(R)
Method
CAPWAP CAPWAP CAPWAP
CMJ:0.15 CMJ:0.15
CM J: 0.5
CAPWAP CAPWAP
Failure Load (tons)
525
425
>600
Note: R = restrike, CAPWAP =Case pile wave analysis program, EOD =end or continuous driving, CM= Case method, J =Case damping value, NA= not available, and Setup (pile freeie) determined from EOD and R data .
•Setup= 2oot. bS.tup = 6st. CAssumes Setup of 70 tons. dorlving test pile.
Load Test Results and I n ter preta t ion
The elastic pile deflections, which were based on the measured load transfer data, were calculated by using the formula developed by Vesic !.!.I and are shown on the load settlement plots (Figures 2, 3, and 4). The elastic pile compression, assuming that the total applied load was transmitted to the tip, is also shown.
Sites A and B: Alluvial Deposits
Apparent Skin Friction
The magnitude and distribution of apparent skin friction (Qsl were developed by using the measured load transfer data and the following equation:
Q,: p*f,
where
p = surface area of pile, fs a un~t skin friction (alluvial deposits)
s "o Ktano, cr 0 average effective overburden pressure
along pile shaft, K • lateral earth pressure coefficient, and
tano coefficient of friction between pile and soil.
(3)
Estimated aver age Ktano values were about 0. 37 at site A and 0.40 at site B. The ultimate apparent unit skin friction was about l ton/ft', which car-
responds well with values recommended by Meyerhof (~) and Reese and Wright <ll for N = 40-50 blows/ft cohesionless soils.
The frictional angle (o) between sand and a concrete block was about 31° when measured by using direct shear equipment. Thus, tano 0.6. By using this value, the K values at sites A and B would be about 0.62 and 0.67, respectively.
Apparent End Bearing
The measured point loads at failure were about 84 and 77 tons at sites A and B, respectively. The apparent end-bear inq pressures would then be 25. 7 and 23.6 tons/ft 2 • These apparent end-bearing pressures are less than those calculated from the ultimate end-bearing capacity formula for deep foundations.
Test data obtained by Bozozuk and others (41 indicate that ultimate skin friction is fully mobilized when the pile tip settlement is about 0 .16-0. 2 in. Once the ultimate skin friction is fully mobilized, the frictional resistance may remain constant or may decrease but would not increase under additional applied load. Thus, the additional load will be transmitted to the pile tip. The amount of strain or deflection of the pile tip to develop end bearing is believed to be greater than that required to develop the ultimate skin friction. In addition, Vesic (l} and Hunter and Davisson (5) found that, after pile driving, residual stresses- may remain in the soil around the pile and below the pile tip. We believe that the end-bearing capacity would be

34
greater than that measured if residual stresses are considered.
Site E: Glacial Deposits
A plot of measured pile top and tip settlement versus applied load for a 24-in concrete pile driven into glacially overridden clay at site E is presented in Figure 4. Under the maximum test load of 600 tons, the net settlement (after reboundl was 0.44 in. The ultimate load is estimated to be about 650 tons.
Apparent Skin Friction
The apparent skin friction between a pile and clay was determined by the following equation:
Q, = p*f,
where
Os shaft friction load, p surface area of pile,
fs unit skin friction (clay) = c*a, c = undrained shear strength, and a reduction factor.
(4)
The ilpparent unit akin friotion was about 2,43 tons/ft 2 at an applied load 'Of 600 tons below a depth of 40 ft, as shown in Figure 7. The apparent skin friction appears to be relatively uniform. The N-values were generally greater than 50 blows/ft in this zone.
The undrained shear strength of the glacially consolidated clays was determined in tr iaxial compression by first consolidating undisturbed specimens under an effective confining pressure of 400 psi, which is the estimated preconsolidation pressure. The confining pressures were then reduced to three selected pressures and each specimen allowed to swell. The specimens were then sheared in an undrained condition. These tests resulted in an undrained shear strength of 6 .5 tons/ft 2 at an overburden pressure of 3 tons/ft 2 •
The apparent unit skin friction (fsl under the maximum test load of 600 tons is about 2.43 tons/ft2 • Assuming c = 6.5 tons/ft 2 , the reduction factor (al is 0.38. Considering that the skin friction was almost fully mobilized under a test load of 650 tons, the reduction factor (al would be 0.4,
Apparent End Bearing
As shown on the load transfer plot (Figure 7), the point bearing load (Qpl increased from 22 to 73 to 178 tons at a pplied l oads of 200, 400, and 600 tons, respectively. These correspond to end-bearing pressures of 6.6, 22, and 54 tons/ft 2 , respectively. The pile tip settlements were about 0 .06, 0 .15, and 0,49 in, respectively, which indicate that the rate of pile tip settlement increased after the 400-ton load.
The ultimate end bearing of driven piles in clay may be determined from the f o l l owing equation:
QP = 9*c*A
where
c A
end bearing, = bearing capacity factor for deep
foundations in clay, undrained shear strength, and area of pile tip.
(5)
Transportation Research Record 884
At an estimated load of 650 tons, the end-bearing pressure from the load transfer plot is about 60 tons/ft 2 • By using the above equation, the calculated c would be about 6.7 tons/ft 2 , which is near the ultimate c-value of 6 .5 tons/ft 2 that was obtained from the high-pressure triaxial compression test.
STEEL PIPE PILES: SITES C AND D
The main span substructure piers are to be supported by 36-in-diameter by 0. 75-in-wall steel pipe piles, which are to be driven open-ended. These piles are designed for a 600-ton static dead plus live load, plus an additional 600-ton seismic load. It was not considered feasible to conduct a pile load test on a 36-in-diameter pipe pile. Therefore, a 24-in-diameter by 1. 25-in-wall steel pipe pile driven open-ended was tested and the results used to analyze the 36-in pile. The ultimate capacity of the 36-in steel pipe pile was also estimated by dynamic measurements.
As shown in Figures 8 and 9, sites C and D are underlain by fill and alluvial deposits consisting of sand, silt, and clay and then by the glacially overridden deposits of interbedded hard clay and very dense sand and silt.
Hammer
Several hammers, including a steam-powered Vulcan 060 (rated energy 180 000 ft-lb/blow), a Conmaco 300/5 (rated energy = 150 000 ft-lb/blow), and a Delmag 062-12 diesel hammer were initially considered for driving the steel pipe piles. wave-equation analyses that used a revised wave-equation analysis for pile driving (WEAP) program for the three hammers along with pile and subsoil combinations were performed by Goble & Associates. The results revealed that, under the same rated energy, the hammer with a longer stroke would drive the long steel piles (>150 ft) more efficiently, Thus, a single-acting Delmag 062-12 diesel hammer was selected. Based on the hammer strokes measured from a saximeter, the range of average hammer energy for the last 5 ft of penetration was 112 000 to 156 300 ft-lb/blow.
Driving Penetrations and Res istances
All steel pipe piles were driven into the glacially overridden deposits. At site C, the piles penetrated 30-34 ft into the glacial bearing layer, while at site D the piles penetrated 52-63 ft (excluding closed-end piles) into the glacial bearing layer. The 24-in closed-end pile at site D penetrated only 31 ft into the glacial bearing layer.
The driving resistances above the glacial deposits were on the order of 10-40 blows/ft at site C (Figure 8) and about 10 blows/ft at site D (Figure 9). These resistances increased with depth to more than 120 blows/ft when the piles were penetrating into the glacially overridden deposits. At sites C and D, the driving resistances of the 24-in open-ended and closed-end piles were about the same magnitude above the glacially overridden deposits, but the closed-end piles drove harder in the glacially overridden deposits.
Pile Load Tes ts
Pile load tests were performed on 24-in-diameter open-ended steel pipe piles to form the design criteria for the open-ended 3 6- in steel pipe piles. The instrumentation system for steel pipe piles was the same as for the concrete piles. The instruments

Transportation Research Record 884 35
were installed after removing the soils inside the pile with a churn drill.
At site C, the compression test was terminated at an applied load of 750 tons when a shop weld on the 3 6-in-diameter anchor pile (pile C-N) failed. The pile was then tested in tension to the proposed maximum test load of 800 tons.
At site D, the pile was loaded in 100-ton increments to 9 4 O tons, which was held for 12 h. After unloading, the pile was reloaded to 1050 tons.
presented in Figure 9 for site D. The measured pile deflections were less than the elastic pile compression, assuming that the total load is transmitted to the pile tip. Therefore, applied loads are probably resisted in skin friction, and end bearing has probably not been mobilized under the maximum applied loads of 750 and 1050 tons at sites C and D, respectively.
Ultimate Pile Capacities
The results of the vertical pile load tests are The ultimate pile capacities, as predicted from dy-
Figure 8. Site C pile-driving resistances.
Figure 9. Site D pile-driving resistances and load versus settlement.
SOIL LOG
SAND
CLAY AND SILT
SAND
SILT
BLOWS PEA FT. il!IO 120
DENSE SAND 100
HARD, GRAVELLY CLAY
(GLACIAL DEPOSITS)
190
200
BOTTOM 220
DELMAG D62-12 HAMMER
24-IN. DIA. STEEL PIPE PILES (C-L TP & C-24)
SOIL LOG
SAND
SILT AND
CLAY
HARD CLAY, SILT AND SAND
(GLACIAL DEPOSITS)
DELMAG D62 -12 HAMMER
24-IN. DIA. STEEL PIPE PILES (D-L TP & D-24)
LOAD - TONS 400 ooo aoo 1000
! 0.2 I
.... z w :I w
~ w .,
24-IN. DIA. x 1.25-IN. STEEL PIPE
LOAD vs. SETTLEMENT IN COMPRESSION
SOIL LOG
SAND
CLAY AND SILT SAND
SILT
DENSE SAND
HARD, GRAVELLY CLAY
(GLACIAL DEPOSITS)
BOTTOM
DELMAG 062-12 HAMMER
36-IN. DIA. x 0.75-IN. OPEN END STEEL PIPE PILE (C-36)
BLOWS PEA FT. •o ea 120
OELMAG D62-12 HAMMER
36-IN. DIA. x 0.75-IN. OPEN-END STEEL PIPE PILE
(D-36)
36
namic measurements and as determined from pile load tests, are given in Table 4.
The piles at sites C and D did not fail under the maximum test loads. Pile D-LTP was loaded to 10 50 tons in compression, and the predicted ultimate capacity, which was based on the dynamic measurements, was 1125 tons, which we believe is reasonable. For pile C-LTP, the predicted ultimate capacity of 826 tons may be low. Because the 24-in load test pile and the 36-in pile were driven to about the same depth, and because the surface area of a 36-in-diameter pile is 1.5 times that of a 24-in-diameter pile, the capacity of a 36-in-diameter pile should also be about 1.5 times that of a 24-in-diameter
Table 4. Summary of pile capacities (steel pipel.
Predicted Ca-pacity Dynamic Measurements
Site Pile (tons)
c C-LTPa 826 C-Nb 1150
D D-LTPa 1125 D-Eb 1200
a24-in diameter. b:)6-in diameter.
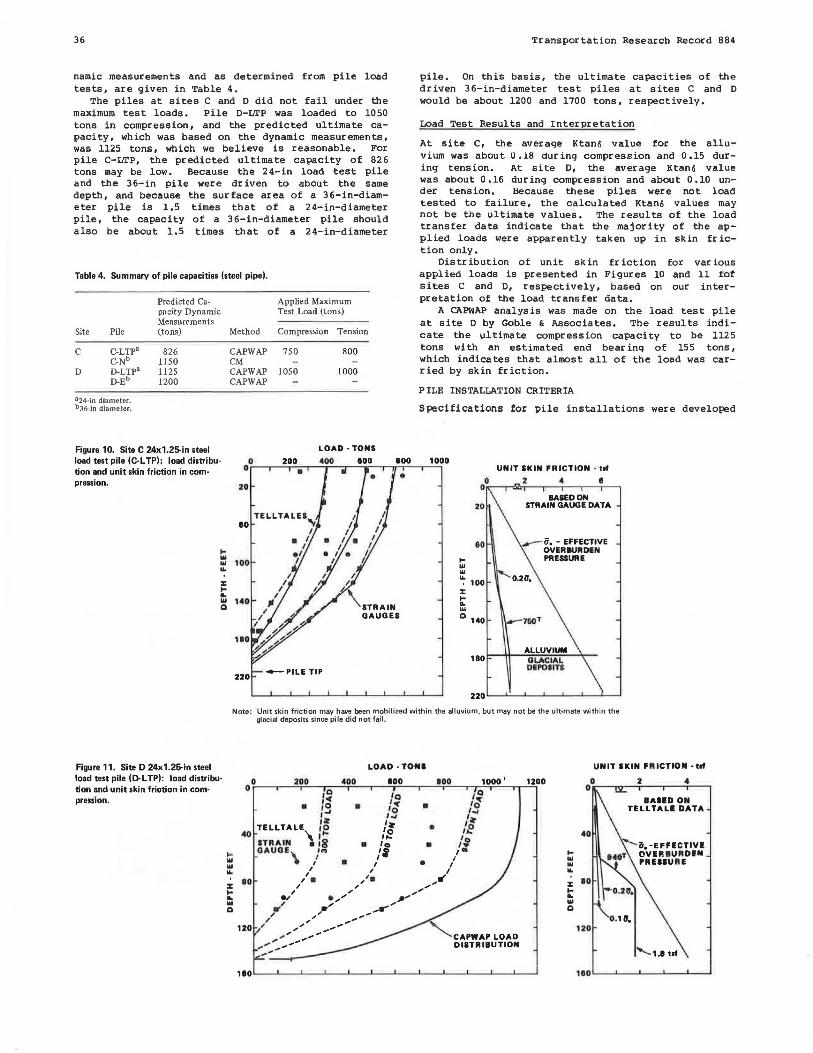
Figure 10. Site C 24x1.2!>-in steel load test pile (C-L TPI: load distribution and unit skin friction in compression.
.... ... ... ... :i: .... &. ... 1:11
Method
CAPWAP CM CAPWAP CAPWAP
Applied Maximum Test Load (tons)
Compression Tension
750
1050
800
1000
LOAD-TONS
coo 100
220 -PILE TIP
100
•
Transportation Research Record 884
pile. On this basis, the ultimate capacities of the driven 36-in-diameter test piles at sites c and D would be about 1200 and 1700 tons, respectively.
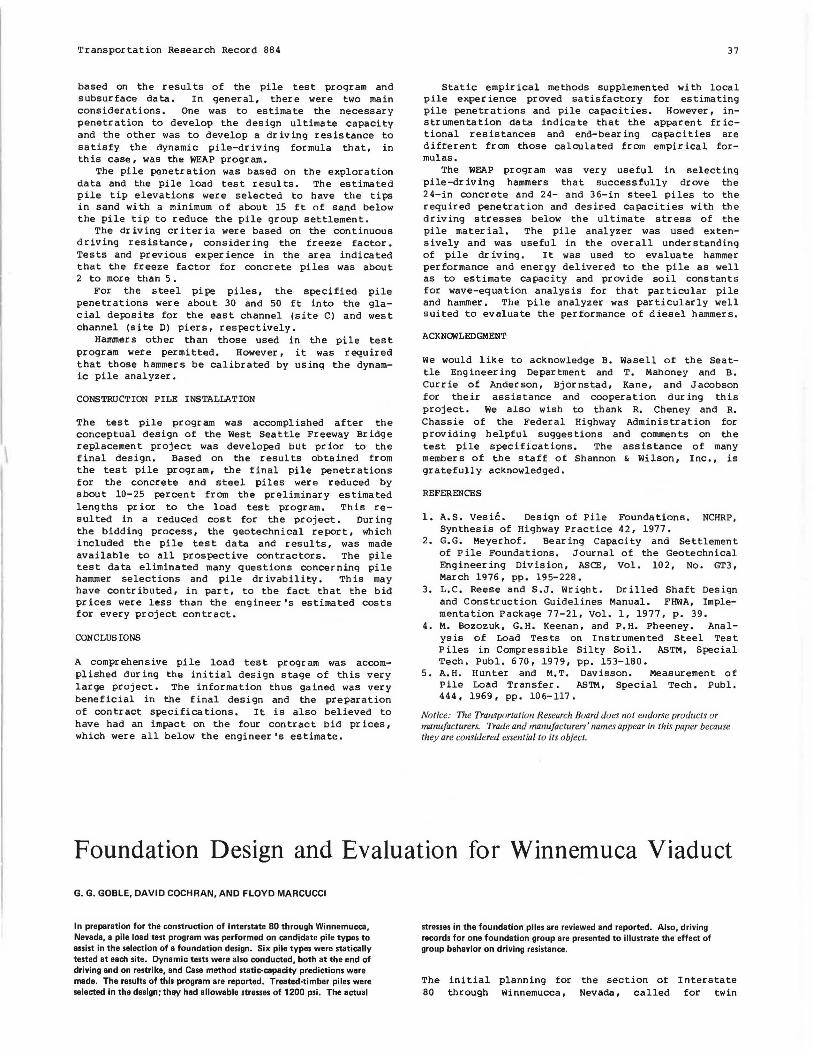
Load Test Results and Interpretation
At site c, the average KtaM value for the alluviwn was about 0.18 during compression and 0.15 during tension. At site D, the average Ktan6 value was about 0.16 during compression and about 0.10 under tension. Because these piles were not load tested to failure, the calculated Ktan6 values may not be the ultimate values. The results of the load transfer data indicate that the majority of the applied loads were apparently taken up in skin fr iction only.
Distribution of unit skin friction for various applied loads is presented in Figures 10 and 11 fot sites C and D, respectively, based on our interpretation of the load transfer data.
A CAPWAP analysis was made on the load test pile at site D by Goble & Associates. The results indicate the ultimate compression capacity to be 1125 tons with an estimated end bearing of 155 tons, which indicates that almost all of the load was carried by skin friction.
PILE INSTALLATION CRITERIA
Specifications for pile installations were developed
1000
.... ... ... ...
20
80
. 100 :i: .... .. ... 1:11 1'0
180
UNIT SKIN FRICTION · uf
2 4 I
BASED ON STRAIN GAUGE DATA
ALLUVIUM GLACIAL DEPOSITS
Note : Unit skin friction may have been mobilized within the alluvium , but may not be th e ultimate with in the glacial deposits since pile did not fail.
Figure 11. Site D 24x1.25-in steel LOAD -TON'I UNIT IKIN FRICTION ·tlf
load test pile (O.L TPI: load distribu-00 200 400 IOO 800 1000 l 1200 2 4
tion and unit skin friction in com- ,1:11 ,ci pression. 'ci I<( 141: I~ aAIED ON • ,o • 'o • ,., TELLTALE DATA , .. ,_,
,'ll 1lt ''2 TELLTALE\ /0 'o • 1/: .. 0 ,,.. ,,.. 'o 40 STRAIN 18 • lo • , .
.... OAUOE\ /"' /I 1"' .... ... • I ... ... I • I ... ... I I I ... I
80 I • /• ,,'It' :i: I " ,.-" :i: .... , ,,, ; .... .. ., •; ,,, .. ... ,
•"' ,,,. ...
Q J' ,,.,.,. 1:11
" " ,,,. .... ,
" , ...
120 ; ,, ,, ,.,. 120 ,,.-"
,. ,. ,.,. ,, ,.,, "' .-"" '-1.1 tof
110 190
\
Transportation Research Record 884
based on the results of the pile test program and subsurface data. In general, there were two main considerations. One was to estimate the necessar y penetration to develop the design ultimate capacity and the other was to develop a driving resistance to satisfy the dynamic pile-driving formula that, in this case, was the WEAP program.
The pile penetration was based on the exploration data and the pile load test results. The estimated pile tip elevations were selected to have the tips in sand with a minimum of about 15 ft of sand below the pile tip to reduce the pile group settlement.
The driving criteria were based on the continuous driving resistance, considering the freeze factor. Tests and previous experience in the area indicated that the freeze factor for concrete piles was about 2 to more than 5 •
For the steel pipe piles, the specified pile penetrations were about 30 and 50 ft into the glacial deposits for the east channel (site C) and west channel (site D) piers, respectively.
Hammers other than those used in the pile test program were permitted. However, it was required that those hammers be calibrated by using the dynamic pile analyzer.
CONSTRUCTION PILE INSTALLATION
The test pile program was accomplished after the conceptual design of the West Seattle Freeway Bridge replacement project was developed but prior to the final design. Based on the results obtained from the test pile program, the final pile penetrations for the concrete and steel piles were reduced by about 10-25 percent from the preliminary estimated lengths prior to the load test program. This resulted in a reduced cost for the project. During the bidding process, the geotechnical report, which included the pile test data and results, was made available to all prospective contractors. The pile test data eliminated many questions concerning pile hammer selections and pile dr ivability. This may have contributed, in part, to the fact that the bid prices were less than the engineer's estimated costs for every project contract.
CONCLUSIONS
A comprehensive pile load test program was accomplished during the initial design stage of this very large project. The information thus gained was very beneficial in the final design and the preparation of contract specifications. It is also believed to have had an impact on the four contract bid prices, which were all below the engineer's estimate.
37
Static empirical methods supplemented with local pile experience proved satisfactory for estimating pile penetrations and pile capacities. However, instrumentation data indicate that the apparent frictional resistances and end-bearing capacities are different from those calculated from empirical formulas.
The WEAP program was very useful in selecting pile-driving hammers that successfully drove the 24-in concrete and 24- and 36-in steel piles to the required penetration and desir·ed capacities with the driving stresses below the ultimate stress of the pile material. The pile analyzer was used extensively and was useful in the overall understanding of pile driving. It was used to evaluate hammer performance and energy delivered to the pile as well as to estimate capacity and provide soil constants for wave-equation analysis for that particular pile and hammer. The pile analyzer was particularly well suited to evaluate the performance of diesel hammers.
ACKNa<iLEDGMENT
we would like to acknowledge B. wasell of the Seattle Engineering Department and T. Mahoney and B. Currie of Anderson, Bjornstad, Kane, and Jacobson for their assistance and cooperation during this project. We also wish to thank R. Cheney and R. Chassie of the Federal Highway Administration for providing helpful suggestions and comments on the test pile specifications. The assistance of many members of the staff of Shannon & Wilson, Inc., is gratefully acknowledged.
REFERENCES
1. A.S. Vesic. Design of Pile Foundations. NCHRP, Synthesis of Highway Practice 42, 1977.
2. G.G. Meyerhof. Bearing Capacity and Settlement of Pile Foundations. Journal of the Geotechnical Engineering Division , ASCE, Vol. 102, No. GT3, March 1976, pp. 195-228.
3. L.C. Reese and S.J. Wright. Drilled Shaft Design and Construction Guidelines Manual. FHWA, Implementation Package 77-21, Vol. l, 1977, p. 39.
4. M. Bozozuk, G.H. Keenan, and P.H. Pheeney. Analysis of Load Tests on Instrumented Steel Test Piles in Compressible Silty Soil. ASTM, Special Tech. Publ. 670, 1979, pp. 153-180.
5. A.H. Hunter and M.T . Davisson. Measurement of Pile Load Transfer. ASTM, Special Tech. Publ. 444, 1969, pp. 106-117.
Notice: The Transportation R esearch Board does not endorse products or manufacturers. Trade and manufacturers ' names appear in this paper because they are considered essential to its object.
Foundation Design and Evaluation for Winnemuca Viaduct
G. G. GOBLE, DAVID COCHRAN, AND FLOYD MARCUCCI
In preparation for the construction of Interstate 80 through Winnemucca , Nevada, a pile load test program was performed on candidate pile types to assist in the selection of a foundation design. Six pile types were statically tested at each site. Dynamic tests were also conducted, both at the end of driving and on restrike, and Casa method static-capacity predictions were made. The results of this program are reported. Treated-timber piles were selected in the design; they had allowable stresses of 1200 psi. The actual
stresses in the foundation piles are reviewed and reported. Also, driving records for one foundation group are presented to illustrate the effect of group behavior on driving resistance.
The initial planning for the section of Interstate 80 through Winnemucca, Nevada, called for twin