piling in layered ground: risks to groundwater and archaeology · science report sc020074/sr piling...
TRANSCRIPT

Piling in layered ground: risks to groundwater and archaeology
Science Report SC020074/SR
SCHO0906BLLT-E-E/P

Science Report SC020074/SR Piling in layered ground: risks to groundwater and archaeology 2
The Environment Agency is the leading public body protecting and improving the environment in England and Wales. It’s our job to make sure that air, land and water are looked after by everyone in today’s society, so that tomorrow’s generations inherit a cleaner, healthier world. Our work includes tackling flooding and pollution incidents, reducing industry’s impacts on the environment, cleaning up rivers, coastal waters and contaminated land, and improving wildlife habitats. English Heritage is the Government’s statutory adviser on the historic environment. Our role is to champion and care for the historic environment which we do by: − Improving understanding of the past through research and study − Providing conservation grants, advisory and education services − Identifying and helping to protect buildings and archaeological sites of national importance − Maintaining over 400 historic properties and making them accessible to the broadest
possible public audience − Maintaining the National Monuments Record as the central publicly accessible archive for
the historic environment in England. This report is the result of research jointly funded by the Environment Agency’s Science Programme, and the English Heritage Historic Environment Enabling Programme (HEEP).
.
Published by: Environment Agency, Rio House, Waterside Drive, Aztec West, Almondsbury, Bristol, BS32 4UD Tel: 01454 624400 Fax: 01454 624409 www.environment-agency.gov.uk ISBN: 1844325962 © Environment Agency October 2006 All rights reserved. This document may be reproduced with prior permission of the Environment Agency. The views expressed in this document are not necessarily those of the Environment Agency. This report is printed on Cyclus Print, a 100% recycled stock, which is 100% post consumer waste and is totally chlorine free. Water used is treated and in most cases returned to source in better condition than removed. Further copies of this report are available from: The Environment Agency’s National Customer Contact Centre by emailing [email protected] or by telephoning 08708 506506.
Authors: C.C. Hird, K.B.Emmett and G. Davies Dissemination Status: Publicly available Keywords: Piles; soil displacements; groundwater flow; model tests. Research Contractor: Department of Civil and Structural Engineering, University of Sheffield, Mappin Street, Sheffield, S1 3JD. Environment Agency’s Project Manager: Jonathan Smith English Heritage Project Manager (PNUM3000MAIN): Jim Williams Science Project reference: SC020074/SR SCHO0906BLLT-E-P

Science Report SC020074/SR Piling in layered ground: risks to groundwater and archaeology 3
Science at the Environment Agency Science underpins the work of the Environment Agency, by providing an up to date understanding of the world about us, and helping us to develop monitoring tools and techniques to manage our environment as efficiently as possible. The work of the Science Group is a key ingredient in the partnership between research, policy and operations that enables the Agency to protect and restore our environment. The Environment Agency’s Science Group focuses on five main areas of activity: • Setting the agenda: To identify the strategic science needs of the Agency to inform its advisory and regulatory roles. • Sponsoring science: To fund people and projects in response to the needs identified by the agenda setting. • Managing science: To ensure that each project we fund is fit for purpose and that it is executed according to international scientific standards. • Carrying out science: To undertake the research itself, by those best placed to do it - either by in-house Agency scientists, or by contracting it out to universities, research institutes or consultancies. • Providing advice: To ensure that the knowledge, tools and techniques generated by the science programme are taken up by relevant decision-makers, policy makers and operational staff. Steve Killeen, Head of Science Research at English Heritage Research is the key to understanding the historic environment: its scope, value and condition, and the threats and opportunities that confront it. Research underpins the sustainable management of the historic environment. English Heritage's research encompasses these principles and contributes towards providing public access to, and appreciation and enjoyment of, the historic environment for this and future generations. By delivering practical high-quality research results, we will contribute to knowledge, inform and direct policy decisions, advice, guidance and other forms of action and assistance. Our strategy identifies seven themes which our research agenda is designed to support:
− Discovering, studying and defining historic assets and their significance − Studying and establishing the socio-economic and other values and needs of the historic
environment and those concerned with it − Engaging and developing diverse audiences − Studying and assessing the risks to historic assets and devising responses − Studying historic assets and improving their presentation and interpretation − Studying and developing information management − Studying and devising ways of making English Heritage and the sector more effective
Dr Edward Impey, Director of Research and Standards

Science Report SC020074/SR Piling in layered ground: risks to groundwater and archaeology 4
Executive Summary In redeveloping urban areas there is a need to provide adequate foundations for new buildings and structures, while at the same time preserving, as far as possible, sub-surface archaeological remains. It is also necessary to preserve groundwater resources. If new deep foundations are required and driven piles are installed, there is inevitably some disturbance to the ground whose effects must be evaluated. These include, firstly, the detrimental effect of deformations on the buried archaeology and, secondly, the effect of deformations on the groundwater flow regime and the possible spreading of contamination, where this is present. Although the potential risks have been recognised for some time, the assessment of the degree of risk has remained difficult because of a lack of hard evidence and knowledge. For this reason, continuous flight auger (CFA) piles have often been seen as preferable to driven piles.
This report describes a physical modelling investigation, aimed at providing practical guidance for Environment Agency (EA) and English Heritage (EH) staff, other archaeological curators, and foundation designers on the impact of piling in layered ground. Most redeveloped urban sites are underlain by layered ground, where layers of soil of greatly differing character can lie above one another. The report also includes some field observations of deformations near driven and augered piles collated by ARCUS (Archaeological Research & Consultancy at the University of Sheffield). The research was commissioned following previous reviews by EA and EH of the potential effects of piling on groundwater and archaeology.
The physical models were formed in a 250 mm diameter test chamber with control of vertical and horizontal stresses to simulate in-situ stress levels. Cylindrical piles, 25 mm in diameter, and H-section piles of similar size were driven on the centreline through an upper sand layer, through a clay layer and into an underlying sand layer. The sand layers were at least 100 mm thick, while the clay layer varied in thickness between 25 and 200 mm. Measurements of vertical permeability were made both before and after the piles were driven so that the change due to pile driving could be quantified. A few tests were also conducted with simulation of CFA pile construction. After the tests, the models were dissected and the final deformations of the soil layers were recorded. In order to better understand the deformation mechanisms for driven piles, separate tests were conducted in a half-section (semi-circular) test cell and successive photographs were taken through a viewing window as the piles advanced. In this second series of tests, square piles were also studied. For simplicity, the half-section models were not subjected to confining pressures or tested for permeability.
The most damaging displacements, in terms of archaeology, are likely to be downward vertical displacements near a driven pile surface. Their development, as observed in the model tests, depended on the relative strengths of the sand and clay layers but it is concluded that, in a deposit made up predominantly of clay layers, significant vertical displacements are unlikely to extend beyond 1.5 pile diameters from the centreline of a cylindrical pile and most of the ground disturbance is concentrated within a distance of about 1 pile diameter from the centreline. H-section piles displace smaller amounts of soil and hence cause smaller displacements than cylindrical piles of comparable width; the opposite is true for square piles, which displace more soil. The models confirmed that well-constructed CFA piles cause much smaller deformations of the surrounding soil than driven piles.
In the models, solid cylindrical piles effectively sealed when driven through a clay layer with a thickness of 2 or more pile diameters. In the field, this sealing ability would preserve the integrity of such a layer acting as an aquitard. However, a thinner layer would be seriously breached. The H-section piles sealed less well than the cylindrical piles due to partial plugging with overlying soil and significant leakage was observed through a clay layer as thick as 8 pile widths. In contrast, good seals were obtained with the model CFA piles. The effect of pile driving may be visualised as equivalent to the creation of an additional seepage pathway in a column of overlying soil passing through the clay, although the amounts of overlying soil pushed down through a clay layer are relatively small.
The observed deformations of the clay in the models were ductile in nature. Different conclusions might apply for brittle clays such as heavily overconsolidated, fissured clays.

Science Report SC020074/SR Piling in layered ground: risks to groundwater and archaeology 5
Contents Executive Summary 4 Contents 5 1 Introduction 7 1.1 Background 7 1.2 Objectives 7 1.3 Report structure 8 2 Review of existing knowledge 9 2.1 Deformations around driven piles 9 2.2 Deformations around CFA piles 9 2.3 Flow adjacent to driven piles 11 2.4 Overview 12 3 Physical modelling methods 13 3.1 Axisymmetric models 13 3.1.1 Equipment 13 3.1.2 Test procedure 17 3.2 Half-section models 18 3.2.1 Equipment 18 3.2.2 Test procedure 20 4 Physical modelling results 21 4.1 Deformations 21 4.1.1 Final deformations in axisymmetric models 21 4.1.2 Final deformations in half-section models 25 4.1.3 Development of deformations in half-section models 30 4.1.4 Comparison of results from axisymmetric and half-section models 34 4.2 Groundwater flow 36 4.2.1 Permeabilities of model soils 36
4.2.1.1 Sand layers 36 4.2.1.2 Clay layers 39
4.2.2 Specimen test results 39 4.2.3 Interpretation of test results 41 4.3 Discussion and conclusions 43 4.3.1 Deformations 43 4.3.2 Groundwater flow 45 5 Observations in archaeological excavations 47 5.1 Methods 47 5.2 Case studies 48 5.2.1 Plymouth 48

Science Report SC020074/SR Piling in layered ground: risks to groundwater and archaeology 6
5.2.2 Wisbech, Cambridgeshire 48 5.2.3 Northampton 48 5.2.4 London 49 5.2.5 Worcester 51 5.2.6 Lincoln 51 5.2.7 Boston 52 5.3 Summary and conclusions 54 6 Conclusions and recommendations 56 References 58

Science Report SC020074/SR Piling in layered ground: risks to groundwater and archaeology 7
1 Introduction
1.1 Background The British government encourages the redevelopment of contaminated and brownfield sites, and has set an objective to build 60 per cent of required new housing on brownfield sites. With appropriate remediation and the use of suitable construction techniques, many of these sites can be safely and beneficially re-used. Many redevelopment schemes require ground improvement works and/or the construction of piles to bear the load of new buildings. However, previous work by the Environment Agency (Environment Agency, 2001; Westcott et al., 2003) has shown that the construction of piles can increase the risk of near-surface pollutants migrating to underlying aquifers if the new piles breach previously competent low-permeability strata. In a similar vein, archaeologists have warned that soil displacements associated with piling can damage subsurface archaeological deposits (Davis et al., 2004). At the time of preparing the above publications, there were virtually no data on the likely magnitude of effects caused by piling in layered ground, where layers of soil of greatly differing character can lie above one another. This report describes a project jointly funded by the Environment Agency and English Heritage to investigate the effects of different piling techniques on the vertical permeability of layered ground, and on the displacement of soil (and hence the archaeological record) around the piles. The work was carried out at the Department of Civil and Structural Engineering at the University of Sheffield.
1.2 Objectives The installation of piles to support buildings and large structures inevitably causes some disturbance to the ground. Deformations caused by piling have primarily been of interest to engineers in the past because of their influence on pile behaviour in terms of load carrying capacity. However, with the present need to redevelop urban and brownfield sites, other aspects of the behaviour of the pile-ground system have become important. These include, firstly, the effect of deformations on groundwater flow and the possible spreading of contamination where this is present; and secondly, the detrimental effect of deformations on buried archaeological remains. The latter may be direct, through physical damage to deposits, structures or artefacts, or indirect, through changes in the groundwater regime (Davis et al., 2004). In general, driven piles are expected to generate larger ground deformations than bored piles, where ground is removed to compensate for the volume of the pile. The latter pile type includes continuous flight auger (CFA) piles. In this project physical models of driven and CFA piles were created in the laboratory, with the following objectives. • to investigate the deformations of layered soil caused by piling; • to quantify the change in overall vertical permeability of layered soil (acting as an aquitard) in
the vicinity of a pile; • to establish the extent of down-dragging of contaminated soil arising from pile construction; • to establish the radius of influence of a pile on archaeology. This report’s findings will help Environment Agency, English Heritage and local authority archaeological staff to assess more reliably the risks to groundwater and archaeological records from piling in contaminated and layered ground. It will also be of use to local authority planners

Science Report SC020074/SR Piling in layered ground: risks to groundwater and archaeology 8
and site developers who wish to minimise the environmental impacts of their redevelopment schemes.
1.3 Report structure The report starts with a brief review of previous relevant knowledge (Section 2), but the bulk of the report describes the physical modelling methods (Section 3) and results (Section 4). Occasionally, opportunities arise to observe excavations around existing piles, in the context of preserving or investigating urban archaeology. Observations collected or made by Archaeological Research & Consultancy at the University of Sheffield (ARCUS), as part of the research, are also presented (Section 5). Finally, the findings of the research are summarised (Section 6).

Science Report SC020074/SR Piling in layered ground: risks to groundwater and archaeology 9
2 Review of existing knowledge
2.1 Deformations around driven piles The pattern of displacements around cylindrical piles driven into relatively uniform clays has been well studied, mainly in model tests (for example, Randolph et al., 1979; Francescon, 1983; Gue, 1984; Lehane and Gill, 2004) but sometimes in the field (for example, Cooke and Price, 1973; Cooke et al., 1979). Figure 2.1 shows normalised vertical and horizontal displacements from a number of these studies. Vertical displacement (down-dragging) occurs consistently within a radius (measured before penetration of the pile) of about 1.5 pile diameters. Horizontal outward movement extends further and can be predicted relatively simply using undrained cavity expansion theory (for example, Pestana et al., 2002). Outward radial displacements from the creation of an infinitely long cylindrical cavity with the same radius as the pile are calculated by assuming that no volume change occurs in the soil. A more comprehensive theory for predicting deformations exists, known as the ‘strain path method’ (Baligh, 1985; Sagaseta and Whittle, 2001), but it does not always perform well for vertical displacements near the pile. In the strain path method, the soil is assumed to flow around the penetrating pile in the same way that a fluid with no viscosity would flow. Displacements in layered soils have been studied much less frequently. Moseley (1997) conducted model tests in clay with thin layers of silt or sand and recorded vertical movements which were essentially the same as those for homogeneous clay. An average curve based on several tests by Moseley is shown in Figure 2.1a. Van den Berg (1994) tested two-layer models comprising sand and clay using a penetrometer with a conical tip. He showed that overlying sand could be pushed down into a weaker clay layer to a depth of about three ‘pile’ diameters regularly, and more than this irregularly. Deformations within the sand layers extended further from the penetrometer than those in the clay, especially below the penetrometer tip. Vertical displacements in the sand extended to a radial distance of around 2.5 ‘pile’ diameters, as compared with 1.5 ‘pile’ diameters in the clay (consistent with Figure 2.1a). In the field, vertical displacements of soil layers have sometimes been observed when excavations have taken place adjacent to driven piles. These observations are reviewed in Section 5 but the amount of reliable quantitative information from the field is limited. Houlsby et al. (1988) observed failure mechanisms of driven piles in models of carbonate sands containing cemented layers. While brittle mechanisms similar to punching shear failure developed in strong cemented layers at low stress levels, entirely ductile failures were observed in weak layers at high stress levels. However, displacements were not reported in detail. Detailed displacements in homogeneous sands have recently been measured by White and Bolton (2004). This research, conducted using plane strain models, has revealed a complex pattern of behaviour with significant crushing of sand particles beneath the pile. Vertical displacements visibly extended much further from the pile than indicated in Figure 2.1a, roughly up to a radius of four pile diameters, although the displacements would not have extended as far if the tests had been axially symmetric.
2.2 Deformations around CFA piles During the boring operation for a CFA pile, the displacements of the surrounding ground are governed by the speed of rotation of the auger relative to the speed of vertical penetration (for example, Vigiani, 1998). Theoretically, it is possible to adjust the speeds so that the volume of soil removed is equal to the volume of concrete placed. If this is achieved, displacements of the surrounding ground should be negligible. However, this relies critically on good control and

Science Report SC020074/SR Piling in layered ground: risks to groundwater and archaeology 10
workmanship. If the auger is over- or under-rotated, soil will be displaced either towards the pile or away from it. There have been instances of severe ground loss due to over-rotation and the risk is larger in soil deposits containing erodable silt or sand layers below the water table (for example, Thorburn et al., 1998). Generally, though, the risks are understood and controlled.
Figure 2.1. Displacements adjacent to driven piles in clay: (a) vertical and (b) horizontal (after Lehane and Gill, 2004)
-1
-0.8
-0.6
-0.4
-0.2
0
0.20 2 4 6 8 10 12
Initial radius / pile radius
Ver
tical
dis
plac
emen
t / p
ile r
adiu
s
Francescon
Cooke et al.
Gue
Lehane and Gill
Moseley
0
0.2
0.4
0.6
0.8
0 2 4 6 8 10 12
Initial radius / pile radius
Rad
ial d
ispl
acem
ent /
pile
rad
ius
Francescon
Cooke and Price
Gue
Lehane and Gill
Randolph et al.
(a)
(b)

Science Report SC020074/SR Piling in layered ground: risks to groundwater and archaeology 11
2.3 Flow adjacent to driven piles The effect of driving piles through a clay aquitard would be extremely hard to isolate and quantify reliably in the field and it is not surprising that no such field data are available. Furthermore, only three previous model studies of this effect have been found in the literature. Figure 2.2 shows the test cell employed by Hayman et al. (1993). The upper sand layer was saturated with contaminants (a mixture of two DNAPLs) while the lower sand was saturated with clean water. A 12.7 mm diameter cylindrical steel pile was then driven through the soil into the lower sand. The fluid in the lower sand was flushed out at intervals and its composition monitored. It was concluded that no leakage of contaminant along the pile-clay interface took place. However, some contaminant reached the lower sand initially as it was driven down in soil trapped beneath the pile tip. A similar test was conducted on a wooden pile in which wicking resulted in some downward migration of contaminant through the pile.
Figure 2.2. Test configuration used by Hayman et al. (1993) (after Hayman et al. 1993)

Science Report SC020074/SR Piling in layered ground: risks to groundwater and archaeology 12
Boutwell et al. (2000) carried out similar tests on a wider range of pile types, including a steel H-section pile. Brine was used as a contaminant and permeability was measured by applying a head difference between the upper and lower sands. The earlier results of Hayman et al. were confirmed but a preferential flow path was created through the clay by driving the H-section pile. This was attributed to a reduction in lateral pressure on the sides of the pile as compared with a solid cylindrical pile. Further tests of the same type, and similar conclusions, were reported by Achleitner et al. (2004). It has been contended that pile driving in normally consolidated clay soils can cause hydraulic fractures or cracks to form in a plastic zone next to the pile (Massarch and Broms, 1977). Such cracks are predicted to be radially orientated in vertical planes and have been reportedly observed around driven sand drains in Sweden (Massarch, 1978). If present, they would clearly provide preferential flow paths. However, there was no evidence of hydraulic fracturing in the model tests mentioned above or in model tests of driven vertical drains reported by Hird and Moseley (2000), some of which were conducted in normally consolidated clay.
2.4 Overview There are considerable gaps in our knowledge of deformations around piles in the ground, especially for driven piles in layered ground where there is some evidence that the deformations depend on the relative shear strengths of the layers. The deformation behaviour and shear strength of coarse-grained soil will depend on the effective stress level (which is a function of depth) and on the density. The degree of soil saturation might also have some influence and, for certain coarse-grained soils, deformations could depend on the extent of particle breakage or crushing. There is an even greater lack of published information on the effect of constructing piles through clay layers acting as aquitards. Very limited research suggests that, for driven piles, solid cylindrical piles have a greater ability than H-section piles to form a seal and prevent increases of groundwater flow next to the pile. However, the reason for this has not been clearly established and several potentially influential parameters remain to be investigated, including the thickness of the clay layer relative to the pile diameter or width. There appears to be no previous experimental evidence on the sealing abilities of CFA piles.

Science Report SC020074/SR Piling in layered ground: risks to groundwater and archaeology 13
3 Physical modelling methods
3.1 Axisymmetric models An axisymmetric model, in which a model pile is surrounded by a cylindrical soil body, is the natural choice for investigating the behaviour of cylindrical piles in the laboratory. However, the limitations of such modelling include the difficulty of recording displacements within the soil resulting from pile formation and the effect of the finite volume of soil, or boundary conditions. In this project, deformations were investigated by dissecting the models after testing. It was impractical to construct a model large enough to eliminate boundary effects; for dense coarse-grained materials the diameter of a rigidly contained model would have to be of the order of 60 times that of the pile (for example, Ahmadi and Robertson, 2004). Instead, it was intended that tests would be carried out with both rigid and flexible lateral boundaries in order to bracket the behaviour that would be observed in an infinite soil mass. Models were designed at a nominal geometrical scale of 1:10 and were subjected to a vertical stress equivalent to between about five and ten metres of overburden, depending on the assumed groundwater conditions. However, the tests can be interpreted for a variety of assumed model scales (for example, by expressing results in a dimensionless form).
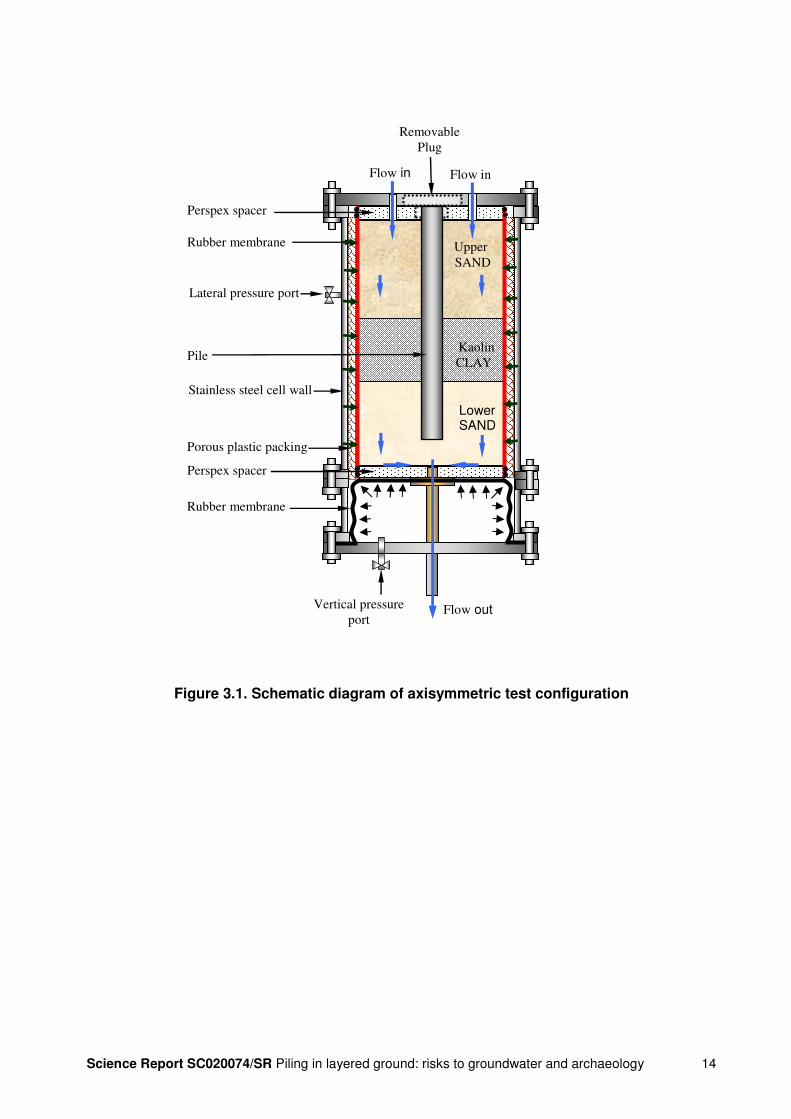
3.1.1 Equipment Figure 3.1 gives a schematic diagram of the axisymmetric model test configuration. While this shows similarities to the tests conducted by Boutwell et al. (2000) and Hayman et al. (1993) (Section 2.3), there are important differences. These include provision to control the lateral pressure acting on the soil, within certain limits, by containing the soil within a membrane and application of a back-pressure (elevated pore water pressure) to ensure full saturation of the model. Three cell bodies of 250mm internal diameter with different heights were designed to accommodate soil models with different clay layer thicknesses. Each cell could be mounted in a frame equipped with a hydraulic driving system so that a pile could be driven into the soil through an access hole, (see Figure 3.2a). CFA piles were constructed by mounting a motor on the hydraulic ram to provide rotation of the auger during vertical penetration. Figure 3.2b shows a pile being driven into a model, while Figure 3.3 shows the augering equipment. Two straight-sided model piles were made: a 25 mm circular stainless steel pile and an H-section aluminium alloy pile with 26mm wide flanges and a 26 mm deep web. With the H-section piles, it is no longer strictly correct to refer to the tests as axisymmetric, but this will be overlooked for the purposes of this report. A 25 mm diameter stainless steel auger with a hollow 12 mm diameter stem and a pitch of 14mm was also made. The internal diameter of the stem was about 8 mm and a sacrificial plug, which could be blown off by internal pressure, was placed at the base of the auger.
Science Report SC020074/SR Piling in layered ground: risks to groundwater and archaeology 14
Figure 3.1. Schematic diagram of axisymmetric test configuration
Upper
SAND
Kaolin
CLAY
Lower
SAND
Lateral pressure port
Porous plastic packing
Pile
Rubber membrane
Stainless steel cell wall
Removable Plug
Flow in
Flow out
Rubber membrane
Flow in
Vertical pressure port
Perspex spacer
Perspex spacer

Science Report SC020074/SR Piling in layered ground: risks to groundwater and archaeology 15
Figure 3.2. Model pile driving equipment: (a) schematic diagram and (b) photograph
Hydraulic ram
Pile
Test frame
Test Cell
Pivot points
3 way operation switch
Drive and pull velocity controls
Hydraulic pump
(a)
(b)

Science Report SC020074/SR Piling in layered ground: risks to groundwater and archaeology 16
Figure 3.3. Model CFA piling equipment Two systems for measuring permeability were created: a low flow rate system utilising a Geotechnical Digital Systems (GDS) flow pump and a high flow rate system utilising a header tank mounted on vertical racking on the adjacent laboratory wall. The layout of these systems is shown in Figure 3.4. Finally, a pair of 250 mm diameter preconsolidation cells were used to consolidate clay layers with a known stress history prior to being incorporated in a model.
Auger rotation motor
Auger
Bearing housing
Grout storage chamber
Ram – auger connector
Wiring for motor
Rotation drive belt

Science Report SC020074/SR Piling in layered ground: risks to groundwater and archaeology 17
Figure 3.4. Hydraulic circuits for permeability testing
3.1.2 Test procedure The soil model was created with the model container (or test cell) inverted so that the upper sand layer (Figure 3.1) was placed first, followed by the clay layer and then the lower sand layer. The sands used were coarse and medium quartz sands known as Leighton Buzzard Sand, Fractions B and C respectively (see Figure 4.14 for grading curves). A cylindrical membrane was fitted to the cell and kept in contact with the cell walls by applying a vacuum. The upper sand was deposited through water in the cell and compacted in three layers using a vibrating hammer. A layer of kaolin clay, preconsolidated from a slurry under a vertical stress of 200 kPa, was extruded from the preconsolidation cell, cut off with a wire and transferred to the model container using a suction pad to minimise disturbance. The lower sand was then deposited through water on top of the clay, but not compacted. The membrane was sealed to an end plate placed on top of the soil and the rest of the test cell was assembled. An effective vertical confining pressure and a back pressure were incrementally applied to the soil with final values of 100 kPa and 200 kPa respectively. The cell was inverted again so that the vertical loading was applied from below. A vertical permeability test was then carried out to provide a baseline for judging the effect of installing a pile. However, in order to eliminate leakage at the periphery of the model, it was necessary to apply an effective lateral stress of 80 kPa. This caused the membrane surrounding the model to move away slightly from
RV: Pressure reducing valve A/W: Air/water DT: Differential pressure transducer T: Ordinary pressure transducer : Ordinary valve
Note: pore pressure measurement system not shown.
RV
Reversible volume change unit
T
T
T
M O D E L
GDS unit
Reversible volume change unit
High A/W interface
Low A/W interface
A/W cylinder
A/W cylinder
Vertical cell pressure
Lateral cell pressure
Back pressure
DT
Air pressure supply (0 - 7Bar)
Air pressure supply (0 - 7Bar)
Air pressure supply (0 - 7Bar)
RV

Science Report SC020074/SR Piling in layered ground: risks to groundwater and archaeology 18
the cell wall and some pore water to be expelled from the soil. Thus, the strategy of conducting experiments with both rigid and flexible lateral boundaries could not be implemented and the lateral boundary was almost certainly flexible in all cases. The back pressure was released while the effective stresses were maintained and either a straight-sided pile was driven into the model, at a rate of 5 mm/s, or a CFA pile was formed. To form a CFA pile, the auger was first rotated and advanced into the model so that its own volume of soil was extracted. A chamber mounted above the auger and connected to it (see Figure 3.3) was then charged with a bentonite-cement grout serving as a substitute for concrete. The chamber was pressurised to blow off the sacrificial plug at the base of the auger and force the grout into the model, while at the same time the auger was slowly withdrawn. In attempts to perfect the technique of model CFA pile formation, grouting pressures and rates of auger advance and withdrawal were varied. After closure of the pile access hole and restoration of the back pressure, a second vertical permeability test was carried out. The confining stresses were then removed and the cell dismantled, giving access to the soil plus the embedded pile. A 100 mm diameter thin-walled metal tube was pushed down around the pile as the surrounding soil was simultaneously excavated. The soil inside this tube, being the most seriously affected by the pile, was carefully dissected and photographed. Moisture content measurements were also made in the clay layer.
3.2 Half-section models Half-section models have been used by some investigators to view deformations during penetration of a pile or penetrometer (for example, Randolph et al., 1979; Van den Berg, 1994). They have the major advantage that ‘axisymmetric’ deformations can be recorded at all stages of penetration. This is done by photography through a transparent viewing window placed on the model diameter. However, the effect of friction on the viewing window (absent in axial symmetry) is a fundamental limitation. It is also difficult to apply confining pressures to the soil and to conduct reliable permeability tests; in this study neither of these was attempted. For models involving coarse-grained soils, the influence of confining pressure, along with the finite volume of soil and boundary conditions, is potentially very significant. The relative density1 of the soil may be equally influential. The experimental design allowed these influences on deformations to be evaluated, firstly by comparing final displacement patterns with those in corresponding axisymmetric experiments and, secondly, by conducting tests with both loose and dense upper sand layers. As for the axisymmetric models, the nominal model scale here was 1:10.
3.2.1 Equipment A half-section cell body 250 mm in diameter and 310 mm high was made from high density polyethylene and fitted with an 18 mm thick Perspex viewing window, Figure 3.5. This cell could be mounted on the pile driving frame so that the hydraulic system mentioned above could be used to install piles in the models. A set of half-section straight-sided piles was made representing cylindrical and H-section piles, as used in the axisymmetric tests. In addition, a 25 mm square steel pile was represented. 1 Relative density expresses the soil density relative to so-called minimum and maximum soil densities, established by laboratory tests. If the soil density equals the minimum density, the relative density is 0%; when it equals the maximum density, the relative density is 100%.

Science Report SC020074/SR Piling in layered ground: risks to groundwater and archaeology 19
Figure 3.5. Schematic diagrams of half-section test configuration: (a) plan and (b) section
(a)
Aluminium lid bolts
Pile guide hole
Internal boundary of cell body
Aluminium lid Inner boundary of Perspex window
Lower SAND
Kaolin CLAY
Upper SAND
Perspex viewing window
Cell stiffening fins
Aluminium lid
Pile
Plastic
HDPE Cell
Pile guide hole
(b)

Science Report SC020074/SR Piling in layered ground: risks to groundwater and archaeology 20
3.2.2 Test procedure To simplify model construction, sand layers were deposited in the cell in a dry condition. Leighton Buzzard Sand, Fraction B, was used throughout. Loose layers were gently poured with a minimum drop height using a tube attached to a funnel, thereby achieving a relative density of under 50 per cent. Denser layers were compacted by hand using a wooden tamper to achieve a relative density of around 85 per cent. Clay layers were formed by preparing samples of preconsolidated kaolin, as for the axisymmetric models, and compacting this material in the cell. Remoulding of the clay meant that the undrained shear strength was lower than that in the axisymmetric models. In order to achieve a higher strength, in some tests kaolin clay powder was mixed with cement powder and then with water, before being compacted in the cell; in this way, relatively strong yet almost saturated clay layers could be formed. Some models consisted entirely of compacted clay. For these models, either kaolin clay was preconsolidated from a slurry, as for the single clay layers, or powdered kaolin was mixed with a quantity of water to give the required strength. In two tests, sand was mixed with the wet clay before it was compacted and in one test, cement powder was again mixed with the clay powder before water was added. With the cell containing the model mounted in the driving frame, the pile was driven in at a rate of about 0.3 mm/s. This rate was slower than that used in the axisymmetric tests in order to allow digital photographs to be taken at suitable intervals (about every 20 mm of penetration) and to check that the pile was in sufficiently intimate contact with the viewing window. In some tests, it proved difficult to maintain the alignment of the pile perfectly and the pile drifted away from the window slightly (by not more than 1 mm) towards the end of the test. However, although some of the pile could not then be seen, its location was still known and the deformation pattern could still be interpreted. After the test, moisture contents and shear strengths were measured in the clay layers as the model was dismantled. Shear strengths were typically measured using a hand-held laboratory vane apparatus, but occasionally using unconfined compression tests (for stiffer materials).

Science Report SC020074/SR Piling in layered ground: risks to groundwater and archaeology 21
4 Physical modelling results
4.1 Deformations
4.1.1 Final deformations in axisymmetric models As summarised in Table 4.1, a total of 12 axisymmetric model tests were carried out1. The table does not include three preliminary tests in which the experimental technique was being refined and one test which was curtailed because of an unacceptable leak.
Table 4.1. Summary of axisymmetric model tests
Layer thickness
Clay properties
Upper sand properties Test
no.
Pile
type*
Upper
sand
(mm)
Clay
(mm)
Lower
sand
(mm)
Void
ratio
Estimated
permeability
(m/s)
Void
ratio
Relative
density
(%)
Estimated
permeability
(m/s)
A4 C 109 50 168 1.36 1.41 x 10⁻⁹ 0.49 92 2.50 x 10⁻³
A5 C 112 25 190 1.34 1.33 x 10⁻⁹ 0.52 84 2.93 x 10⁻³
A6 H 113 50 164 1.36 1.40 x 10⁻⁹ 0.56 74 3.57 x 10⁻³
A7 H 116 100 161 1.39 1.51 x 10⁻⁹ 0.54 78 3.24 x 10⁻³
A8 C 110 100 167 1.33 1.31 x 10⁻⁹ 0.52 84 2.93 x 10⁻³
A9 H 111 200 166 1.33 1.31 x 10⁻⁹ 0.54 78 3.24 x 10⁻³
A10 H 116 50 161 1.41 1.58 x 10⁻⁹ 0.53 82 8.47 x 10⁻⁴
A11 C 117 25 185 1.42 1.62 x 10⁻⁹ 0.55 79 9.34 x 10⁻⁴
A13 CFA 116 25 186 1.46 1.75 x 10⁻⁹ 0.53 83 3.08 x 10⁻³
A14 CFA 118 50 159 1.40 1.54 x 10⁻⁹ 0.55 76 3.40 x 10⁻³
A15 CFA 119 50 158 1.34 1.33 x 10⁻⁹ 0.57 70 3.74 x 10⁻³
A16 H 117 50 160 1.34 1.33 x 10⁻⁹ 0.54 78 3.24 x 10⁻³
*C = cylindrical, H = H-section, CFA = continuous flight auger Photographs of central sections of the dissected models are shown in Figures 4.1, 4.2 and 4.3 for the cylindrical, H-section and CFA piles respectively. For the cylindrical piles, the key features are the down-dragged sand at the top of the clay layer, the down-dragged sand shed along the sides of the pile within the clay, and the small amount of sand carried down beneath the pile tip through the clay and into the lower stratum. For the H-section piles, a smaller amount of down-dragging is seen at the top of the clay and only slight shedding of down-dragged material along the sides of the pile occurs, close to the base of the clay. Very significantly, however, sand partially plugs the pile and is carried well down into, and perhaps through, the clay layer. The 1 In Table 4.1, the void ratio expresses the closeness of particle packing in the soil and equals the ratio of the volume of voids to the volume of solid material. Porosity equals void ratio divided by (1+ void ratio).

Science Report SC020074/SR Piling in layered ground: risks to groundwater and archaeology 22
CFA piles show modelling defects such as variation of diameter and excessive penetration of the sand layers by grout. Nevertheless, the photographs clearly show that deformations in the clay around the pile are relatively small compared to those with the other pile types. Despite the care taken in extracting and dissecting the samples photographed in Figures 4.1 – 4.3, inevitably some disturbance occurred, especially near the outer edges of the samples. Smearing of the clay on the photographed surface also occurred. These factors affected the accuracy with which measurements of displacements (Section 4.1.4) could be made.
(a) (b) Test A5 Test A4
(c) (d)
Test A8 Test A11
Figure 4.1. Photographs of dissected axisymmetric models: cylindrical piles

Science Report SC020074/SR Piling in layered ground: risks to groundwater and archaeology 23
(a) (b)
Test A6 Test A7
(c) (d)
Test A9 Test A10
Figure 4.2. Photographs of dissected axisymmetric models: H-section piles

Science Report SC020074/SR Piling in layered ground: risks to groundwater and archaeology 24
(a) (b)
Test A13 Test A14
(c)
Test A15
Figure 4.3. Photographs of dissected axisymmetric models: CFA piles

Science Report SC020074/SR Piling in layered ground: risks to groundwater and archaeology 25
4.1.2 Final deformations in half-section models The half-section model tests are summarised in Table 4.2 and fall into four groups.
Table 4.2. Summary of half-section model tests
Layer thickness
Clay properties Upper sand properties Test
no.
Pile
type*
Upper
sand
(mm)
Clay
(mm)
Lower
sand
(mm)
Void
ratio
Degree of saturation
(%)
Shear strength
(kPa)
Void
ratio
Relative
density
(%)
HS1 C 122 24.5 129 1.14 100** 8.6 0.75 21
HS2 C 116 52 124 1.26 100** 6.0 0.66 46
HS3 H 118 53 128 1.19 100** 8.0 0.69 38
HS4 C 114 26.5 124 1.13 100** 10.3*** 0.52 85
HS5 C 114 49.5 125 1.20 100** 8.5 0.52 85
HS6 H 114 50 126 1.31 100** 5.6 0.52 85
HS7 S 120 48 127 1.25 100** 8.9 0.72 30
HS8 S(P) 115.5 50 125 1.12 100** 8.1 0.65 49
HS9 C 116 56 124 Not available 115 0.66 46
HS10 H 119 52 126 Not available 23 0.70 35
HS11 S - 199 - 1.18 88 18 - -
HS12 S - 194 - 0.42 85 41 - -
HS13 S - 197 - 0.56 27 44 - -
HS14 S - 198 - 1.48 94 104 - -
*C = cylindrical, H = H-section, S = square, S(P) = square with pointed tip ** = assumed on basis of preparation method *** = vane partly driven into underlying sand
The first group (Tests HS1-HS6) was used to provide data for comparison with the axisymmetric tests. Photographs of the fully penetrated piles are shown in Figures 4.4 and 4.5 for the cylindrical and H-section piles respectively. These show most of the features seen in the axisymmetric tests, and a quantitative comparison is attempted in section 4.1.4. However, one missing feature is the sand shed along the cylindrical pile within the 50 mm thick clay layers (compare Figures 4.4b and 4.1b). Although not visible in Figure 4.5, sand was carried down through the clay layers between the flanges of the H-section piles (which are pointing away from the camera) in a similar fashion to that observed in the axisymmetric tests.

Science Report SC020074/SR Piling in layered ground: risks to groundwater and archaeology 26
(a) (b) Test HS1 Test HS2
Uncompacted upper stratum Uncompacted upper stratum
(c) (d)
Test HS4 Test HS5
Compacted upper stratum Compacted upper stratum
Figure 4.4. Photographs of half-section models: cylindrical piles

Science Report SC020074/SR Piling in layered ground: risks to groundwater and archaeology 27
(a) (b) Test HS3 Test HS6
Uncompacted upper stratum Compacted upper stratum
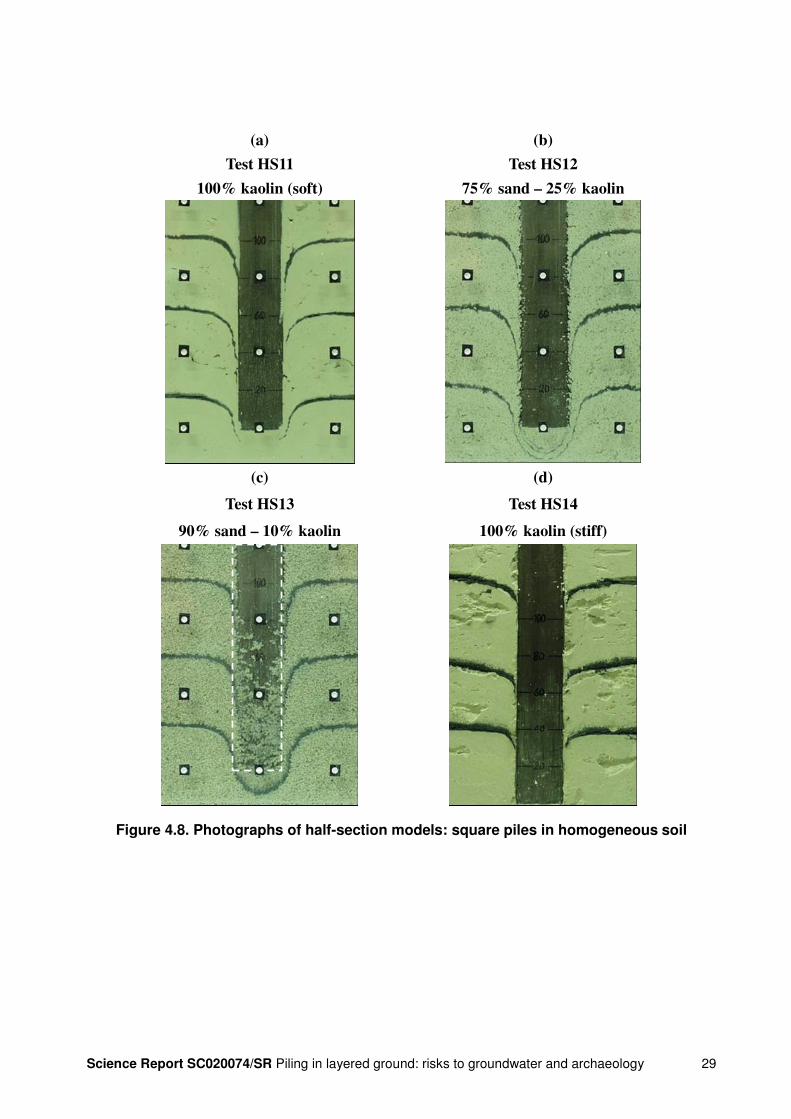
Figure 4.5. Photographs of half-section models: H-section piles The second and third groups of tests (Tests HS7-HS8 and HS9-HS10) were designed to explore the effect of solid pile cross-section (square versus cylindrical) and clay layer shear strength respectively. Figure 4.6 shows that the general pattern of deformation is the same for a square as for a cylindrical pile, although the lateral extent of the down-dragging of the upper sand into the clay appears somewhat larger (compare Figures 4.6a and 4.4b). It should be remembered, however, that the cross sectional area of the square pile is 27% larger than that of the cylindrical pile; therefore more soil must be displaced. The change from a flat-ended pile to one with a 30 degree point prevented material being trapped beneath the pile tip and carried down into the lower stratum (Figure 4.6b). The clay layer strength appears to have a strong influence on the deformation pattern, as shown in Figure 4.7. With a stronger clay layer less sand is drawn down from above but more clay is dragged down into the underlying sand (compare Figures 4.7a and 4.4b, or Figures 4.7b and 4.5a). The deformation pattern thus depends on the relative strengths of the clay and sand layers. The fourth group of tests (Tests HS11-HS14) was conducted in essentially homogeneous models constructed entirely of clay, clay mixed with cement, or clay mixed with sand. Thin black marker layers were incorporated and are visible, after deformation, in photographs, (see Figure 4.8). Because of the compaction of overlying layers, the marker layers could not be kept perfectly straight and horizontal as the models were built and this needs to be borne in mind when looking at Figure 4.8. Also, in Figure 4.8d the pile is shown after the viewing window had been removed and a film of soil trapped between the pile and the viewing window had been cleaned off. Tests HS11 and HS14 were used to explore the influence of the shear strength; Tests HS12 and HS13 were used to explore the behaviour in soils with a lower clay content, as more often encountered on urban archaeological sites. A fairly consistent pattern of behaviour was observed in all the tests in this group and the relatively low degree of saturation in Test HS13 does not appear to have had much influence on the test results. However, the down-dragging does not appear to be concentrated as close to the pile in the stronger clay as it is in the weaker one (compare Figures 4.8a and 4.8d, but ignore the lowest marker layer in Figure 4.8d due to lower boundary effects).

Science Report SC020074/SR Piling in layered ground: risks to groundwater and archaeology 28
(a) (b) Test HS7 Test HS8
Figure 4.6. Photographs of half-section models: square piles
(a) (b)
Test HS9 Test HS10
Cylindrical pile H-section pile
Figure 4.7. Photographs of half-section models: stiffer clay layers
Science Report SC020074/SR Piling in layered ground: risks to groundwater and archaeology 29
(a) (b) Test HS11 Test HS12
100% kaolin (soft) 75% sand – 25% kaolin
(c) (d)
Test HS13 Test HS14
90% sand – 10% kaolin 100% kaolin (stiff)
Figure 4.8. Photographs of half-section models: square piles in homogeneous soil

Science Report SC020074/SR Piling in layered ground: risks to groundwater and archaeology 30
4.1.3 Development of deformations in half-section models Figure 4.9 illustrates the typical development of deformations for a solid pile penetrating a relatively soft clay layer. Corresponding information for a relatively strong clay layer and for a homogenous clay model is given in Figures 4.10 and 4.11 respectively. In the case of layered soil, most of the experimental observations support a schematic account given in Figure 4.12. For almost all of the half-section layered models (as well as the axisymmetric ones), the clay layer was relatively weak compared with the sand layers. Therefore, a region of overlying sand was pushed down into the clay, but clay was not pushed down to the same extent into the underlying sand. However, in Test HS9 the clay layer was stronger than the sand layers and thus it was the clay that was pushed down into the sand layer below.

Science Report SC020074/SR Piling in layered ground: risks to groundwater and archaeology 31
Figure 4.9. Photographs of penetration stages in a half-section model: cylindrical pile through a soft clay layer

Science Report SC020074/SR Piling in layered ground: risks to groundwater and archaeology 32
Figure 4.10. Photographs of penetration stages in a half-section model: cylindrical pile through a stiff clay layer

Science Report SC020074/SR Piling in layered ground: risks to groundwater and archaeology 33
Figure 4.11. Photographs of penetration stages in a half-section model: square pile through homogeneous soil

Science Report SC020074/SR Piling in layered ground: risks to groundwater and archaeology 34
Figure 4.12. Schematic diagram of penetration stages in layered soil
4.1.4 Comparison of results from axisymmetric and half-section models As mentioned above some of the half-section tests were intended to provide data for comparison with corresponding axisymmetric tests. This comparison was most easily made by measuring the final deformed shape of the boundary between the clay layer and the upper sand, as recorded on the photographs (Figures 4.1, 4.2, 4.4 and 4.5). Results obtained by simple linear scaling are shown in Figure 4.13 in which the datum for elevation has been taken as the level of the boundary at a radial distance of 37.5 mm from the centreline of the pile. It should be kept in mind that, initially, the boundary was not perfectly straight. Figure 4.13a shows the comparison for cylindrical piles penetrating a 25 mm thick clay layer. It is clear that the intrusion of sand into the clay is significantly greater in the axisymmetric models than in the half-section ones with either compacted or uncompacted sand. This is thought to be due to lateral shedding of sand initially trapped beneath the pile tip, which was not seen in the half-section models. Figure 4.13b shows the comparison for cylindrical piles and a 50 mm thick clay layer. Here, there is good agreement between the axisymmetric and half-section results for the compacted sand. In the axisymmetric test lateral shedding of sand trapped beneath the pile tip occurred at a lower level (see Figure 4.1b) and therefore did not affect the boundary profile shown. Figure 4.13c shows the comparison for H-section piles and a 50mm thick clay layer, where the intrusion is greater in the half-section case with compacted sand. However, reasonable agreement is seen with uncompacted sand.
Nose cone of sand penetrates clay
2
Clay trapped and squeezed out laterally beneath residual nose
cone
Sand shed from nose cone
4
Clay displaced as pile approaches
1
Residual clay lost from beneath nose cone
Some clay dragged down
5
Nose cone degrades as penetration continues
3

Science Report SC020074/SR Piling in layered ground: risks to groundwater and archaeology 35
Reviewing Figure 4.13 as a whole, it is clear that while similar displacements are evident in some cases, there is not consistent quantitative agreement between the results from the two test types when conducted with sand compacted to about the same relative density. In the half-section tests, significantly larger displacements are always evident with compacted sand than with uncompacted sand.
(a) Cylindrical pile : 25mm clay layer
-2.5
-2.0
-1.5
-1.0
-0.5
0.0
0.5
0.0 0.5 1.0 1.5 2.0 2.5 3.0
Ver
tical
dis
plac
emen
t / p
ile
radi
us
Test A4 : LHS
Test A4 : RHS
Test HS1 : uncompacted sand LHS
Test HS1 : uncompacted sand RHS
Test HS4 : compacted sand LHS
Test HS4 : compacted sand RHS
Distance from pile / pile radius
(b) Cylindrical pile : 50mm clay layer
-2.0
-1.5
-1.0
-0.5
0.0
0.5
0.0 0.5 1.0 1.5 2.0 2.5 3.0
Ver
tical
dis
plac
emen
t / p
ile
radi
us
Test A3 : LHS
Test A3 : RHS
Test HS2 : uncompacted sand - LHS
Test HS2 : uncompacted sand - RHS
Test HS5 : compacted sand - LHS
Test HS5 : compacted sand - RHS
Distance from pile / pile radius

Science Report SC020074/SR Piling in layered ground: risks to groundwater and archaeology 36
(c) H-section pile : 50mm clay layer
-2.0
-1.5
-1.0
-0.5
0.0
0.5
0.0 0.5 1.0 1.5 2.0 2.5 3.0
Ver
tical
dis
plac
emen
t / p
ile
wid
th
Test A6 : LHSTest A6 : RHSTest A16 : LHSTest A16 : RHSTest HS3 : uncompacted sand - LHSTest HS3 : uncompacted sand - RHSTest HS6 : compacted sand - LHSTest HS6 : compacted sand - RHS
Distance from pile / pile width
Figure 4.13. Comparison of axisymmetric and half-section test results for vertical displacement
4.2 Groundwater flow
4.2.1 Permeabilities of model soils
4.2.1.1 Sand layers Grading curves for the two quartz sands used in the axisymmetric models are given in Figure 4.14. These were used to make initial predictions of permeability using the Kozeny-Carman equation (Carrier, 2003):
���
����
�
+��
���
���
���
����
����
�=
ee
SCk
1.
1.
1.
3
2µγ
where k = permeability, γ = unit weight of permeant, µ = viscosity of permeant, C = Kozeny-Carman empirical coefficient (taken as 5.0), S = specific surface area per unit volume of particles (estimated from the grading curve) and e = void ratio. Measurements were also made in a constant head permeameter to obtain directly the relationship between permeability and void ratio (Figure 4.15). It can be seen that, in the main, measured values fall in the middle of the range predicted using the Kozeny-Carman equation. Regression curves fitted to the experimental data were used to estimate the permeability of the sand layers in the models. The estimated permeability of the upper sand in each axisymmetric model is given in Table 4.1.

Science Report SC020074/SR Piling in layered ground: risks to groundwater and archaeology 37
0
10
20
30
40
50
60
70
80
90
100
0.01 0.10 1.00 10.00Seive size (mm)
% P
assi
ng
Fraction BFraction C
Figure 4.14. Particle size distributions of sands used in the models

Science Report SC020074/SR Piling in layered ground: risks to groundwater and archaeology 38
0.0
1.0
2.0
3.0
4.0
5.0
6.0
7.0
8.0
9.0
0.40 0.45 0.50 0.55 0.60 0.65 0.70 0.75
Void ratio
Ver
tical
per
mea
bilit
y ( x
10-3
m/s
) Experimental data (coarse sand)
Kozeny-Carman (spherical particles)
Kozeny-Carman (angular particles)
Regression curve
?
0.0
0.5
1.0
1.5
2.0
2.5
3.0
0.40 0.45 0.50 0.55 0.60 0.65 0.70 0.75
Void ratio
Ver
tical
per
mea
bilit
y ( x
10-3
m/s
) Experimental data (medium sand )
Kozeny Carman (rounded particles)
Kozeny Carman (angular particles)
Regression curve
Figure 4.15. Permeability variation with void ratio for sands used in the models
Leighton Buzzard sand - Fraction B
Leighton Buzzard sand - Fraction C
Science Report SC020074/SR Piling in layered ground: risks to groundwater and archaeology 39
4.2.1.2 Clay layers For kaolin consolidated from a slurry, as in the present tests, empirical correlations between permeability and void ratio were established by Al-Tabbaa and Wood (1987). These have been found to be reliable in previous research using the same source of kaolin (Hird and Moseley, 2000). The estimated, or predicted, vertical permeability of the clay layer in each axisymmetric model, based on the final measured water content, is given in Table 4.1. Because the clay would have tended to swell on release of the confining pressure at the end of the test, the estimates could slightly exceed the true values.
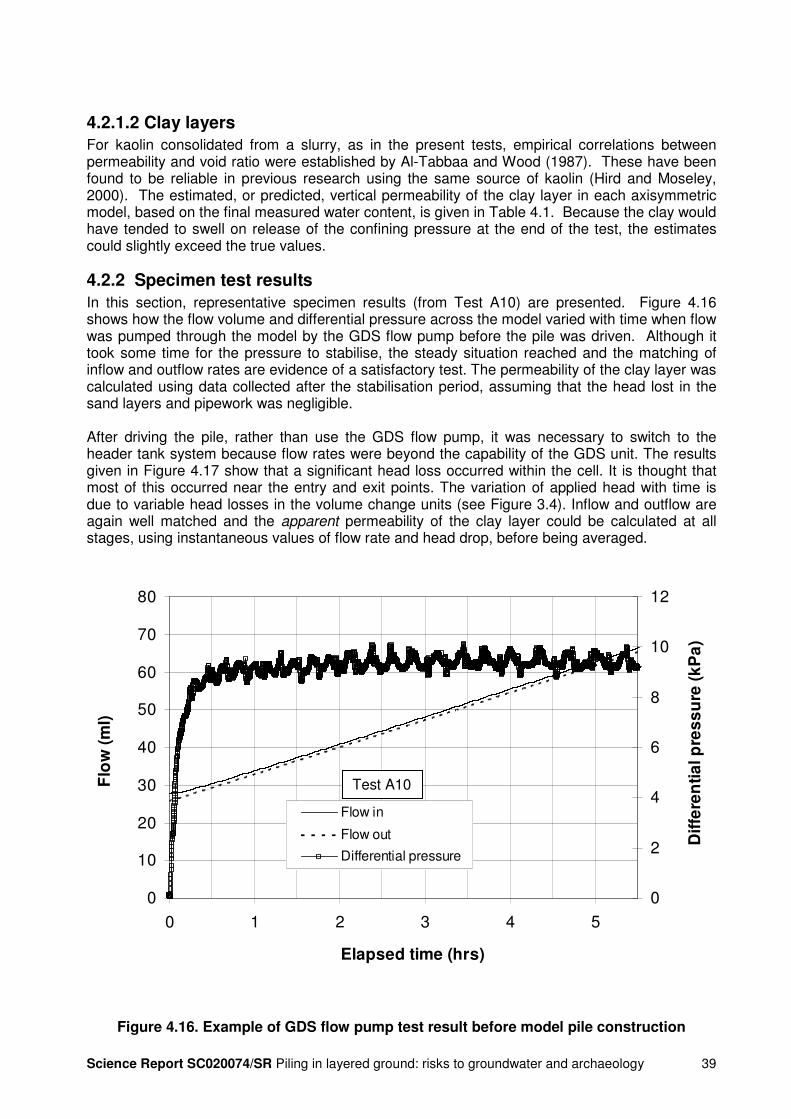
4.2.2 Specimen test results In this section, representative specimen results (from Test A10) are presented. Figure 4.16 shows how the flow volume and differential pressure across the model varied with time when flow was pumped through the model by the GDS flow pump before the pile was driven. Although it took some time for the pressure to stabilise, the steady situation reached and the matching of inflow and outflow rates are evidence of a satisfactory test. The permeability of the clay layer was calculated using data collected after the stabilisation period, assuming that the head lost in the sand layers and pipework was negligible. After driving the pile, rather than use the GDS flow pump, it was necessary to switch to the header tank system because flow rates were beyond the capability of the GDS unit. The results given in Figure 4.17 show that a significant head loss occurred within the cell. It is thought that most of this occurred near the entry and exit points. The variation of applied head with time is due to variable head losses in the volume change units (see Figure 3.4). Inflow and outflow are again well matched and the apparent permeability of the clay layer could be calculated at all stages, using instantaneous values of flow rate and head drop, before being averaged.
0
10
20
30
40
50
60
70
80
0 1 2 3 4 5
Elapsed time (hrs)
Flo
w (m
l)
0
2
4
6
8
10
12
Diff
eren
tial p
ress
ure
(kP
a)
Flow in
Flow out
Differential pressure
Figure 4.16. Example of GDS flow pump test result before model pile construction
Test A10

Science Report SC020074/SR Piling in layered ground: risks to groundwater and archaeology 40
0
20
40
60
80
100
120
0.0 0.5 1.0 1.5 2.0 2.5 3.0 3.5 4.0 4.5
Elapsed time (mins)
Flow
(ml)
0
2
4
6
8
10
12
Diff
eren
tial p
ress
ure
(kP
a)
Flow inFlow outDifferential pressure across cellDifferential pressure across clay
Figure 4.17. Example of header tank test result after model pile construction
Test initiated
Test A10
Test stopped

Science Report SC020074/SR Piling in layered ground: risks to groundwater and archaeology 41
4.2.3 Interpretation of test results Values of measured clay layer permeability, calculated as described above, are given in Table 4.3. It is immediately clear that some significant increases of permeability occurred as a result of driven pile construction. However, the apparent permeabilities calculated after pile construction cannot simply be assumed to apply at full scale as they depend on the ratio of pile diameter (or width for an H-section pile) to model diameter. In order to interpret the results at full scale it is better to think of either the increase of flow caused by the construction of a single pile, under a given hydraulic gradient across the clay layer, or the dimensions of an equivalent column of overlying soil adjacent to the pile in the clay, Figure 4.18. In each case it is assumed that individual piles do not interfere with one another, which is likely to be true if the spacing exceeds about three pile diameters.
Table 4.3. Summary of groundwater flow results
Clay layer permeability
(m/s)
Test
no.
Pile
type*
T/D
or
T/L** Pre-pile Post-pile
(apparent)
Increase of full-scale flow under
unit hydraulic gradient
(litres/day)
Normalised area of equivalent column of
overlying soil
(As/Ap)
A4 C 2 1.55 x 10⁻⁹ 1.46 x 10⁻⁹ Negligible Negligible
A5 C 1 1.40 x 10⁻⁹ 3.32 x 10⁻⁶ 1451 0.118
A6 H 2 1.21 x 10⁻⁹ 2.08 x 10⁻⁶ 911 0.044
A7 H 4 2.09 x 10⁻⁹ 1.29 x 10⁻⁶ 563 0.030
A8 C 4 1.81 x 10⁻⁹ 1.70 x 10⁻⁹ Negligible Negligible
A9 H 8 1.65 x 10⁻⁹ 1.08 x 10⁻⁷ 47 0.002
A10 H 2 2.08 x 10⁻⁹ 5.83 x 10⁻⁷ 254 0.051
A11 C 1 2.05 x 10⁻⁹ 1.41 x 10⁻⁶ 618 0.157
A13 CFA 1 1.10 x 10⁻⁶ Flow results unreliable – see text
A14 CFA 2 1.48 x 10⁻⁹ 2.34 x 10⁻⁹ Negligible Negligible
A15 CFA 2 1.42 x 10⁻⁹ 1.68 x 10⁻⁹ Negligible Negligible
A16 H 2 1.49 x 10⁻⁹ 2.19 x 10⁻⁶ 957 0.051 *C = cylindrical, H = H-section, CFA = continuous flight auger **T = clay layer thickness, D = pile diameter, L = pile side-length (for H-section)

Science Report SC020074/SR Piling in layered ground: risks to groundwater and archaeology 42
Figure 4.18. Equivalent column concept for preferential flow paths created by pile construction
The first approach leads to the ‘leakage’ flows shown in Table 4.3 based on the nominal model scale of 1:10. For other model scales flows can be multiplied by a factor of N2/100 where N is the geometrical scale factor. It is assumed that the permeabilities of the soils involved are the same as those in the model tests. The second approach does not depend on the model scale, as the equivalent soil column area, As, can be expressed non-dimensionally by dividing it by the pile’s cross-sectional area (including re-entrant area for the H-section pile), Ap, Table 4.3. It is assumed that the soil in the column has the same permeability as the overlying soil, but in reality, its permeability is likely to be lower for two reasons. Firstly, particle breakage in the soil close to the pile will have occurred and, secondly, the void ratio of the soil will have decreased (White and Bolton, 2004). The results of this second approach are expressed graphically in Figure 4.19, where the normalised equivalent column area is plotted against the clay layer thickness, T, normalised by the pile diameter, D, or width, L.
P = Pile US = Upper stratum LS = Lower stratum C = Clay
LS LS
* Note: a similar concept applies where the upper stratum is carried down within the flanges of an H-section pile.
P
US +
US P
US
LS LS
C

Science Report SC020074/SR Piling in layered ground: risks to groundwater and archaeology 43
Figure 4.19. Normalised plot of equivalent column area versus clay layer thickness Table 4.3 shows that no significant increase in flow resulting from the simulated construction of CFA piles. Unfortunately, as discussed in section 4.3.2 no reliable flow results could be obtained for Test A13.
4.3 Discussion and conclusions
4.3.1 Deformations The mechanism of deformation as a driven pile penetrates a clay layer sandwiched between coarser soils is illustrated schematically in Figure 4.12. However, this figure only applies for a clay layer that is relatively soft compared with the overlying and underlying soils. Because the shear strength of coarse-grained soils is strongly dependent on the stress level (or overburden pressure), and the strength of the clay on its stress history, other scenarios could arise in practice. In particular, the clay could be substantially more overconsolidated than in the model tests. It would then behave in a more brittle manner and could develop rupture surfaces, especially if it is naturally fissured. As previously noted (Section 2.1), extreme brittleness was modelled in tests on cemented sands by Houlsby et al. (1988) and a quite different deformation mechanism (punching shear) was observed. Further research is required to explore this aspect for brittle clays. The model tests revealed variations in both the absolute shear strength of the clay layers and their shear strength relative to that of the sand layers. The shear strengths of the clay measured in the half-section models are given in Table 4.2 but in the axisymmetric models it was too awkward to make similar measurements. However, from measurements on unused preconsolidated clay it is estimated that the shear strength in the axisymmetric models was in the
0.00
0.02
0.04
0.06
0.08
0.10
0.12
0.14
0.16
0.18
0.20
0 1 2 3 4 5 6 7 8 9
Normalised clay layer thickness (T/D or T/L)
Nor
mal
ised
are
a of
equ
ival
ent
colu
mn
(A s
/A p
)Cylindrical piles (Fraction B)
H-section piles (Fraction B)
H-section pile - repeat test (Fraction B)
Cylindrical piles (Fraction C)
H-section piles (Fraction C)

Science Report SC020074/SR Piling in layered ground: risks to groundwater and archaeology 44
range 10 – 20 kPa. Shear strengths of the sand would have been substantially larger in the axisymmetric models than in the half-section ones because of the confining pressure applied. In the half-section tests, the mechanism of deformation was shown to change as the strength of the clay layer increased (Figure 4.7). In the axisymmetric tests, the relatively high strength of the underlying sand layer compared with the clay is thought to have led to the lateral shedding of the upper sand trapped beneath the pile tip as it approached the lower sand. The lateral movement of trapped sand would have been encouraged by the squeezing of clay between the pile and the lower sand boundary (Stage 4 in Figure 4.12). In the half-section models this did not occur. If future half-section tests were to be conducted, it would be desirable to apply appropriate confining pressures to the soil. Because the exact mechanism of deformation depends on the strengths of the various layers, it will be difficult to predict accurately in practice. On the other hand, in clay layers it can be confidently stated that most of the vertical displacement (except possibly for brittle clays) is likely to be confined within a radius of 1.5 pile widths, providing the maximum particle size of the overlying soil is small relative to the pile width. Also, there is no evidence that overlying soil will continue to be dragged down to lower levels once the pile tip has entered a clay layer. For the half-section tests conducted entirely in clay, a comparison can be made between the vertical displacements of the marker layers and previous research, (see Figure 4.20). In this figure, the average results of Moseley (1997) are representative of previous work (see Figure 2.1a) and apply for a cylindrical pile. The present results, obtained from the central marker layer in Figure 4.8 with a datum at a distance of 37.5 mm from the pile centreline, apply for a square pile and have therefore been normalised using an equivalent pile radius (that is, the radius of a cylindrical pile with the same cross-sectional area). For Test HS11, displacements agree well with previous research. However, in Test HS14, where the clay was stronger than in most previous studies, a different pattern of results is evident and vertical displacements appear to have extended to a slightly larger radius. In entirely coarse-grained soils, previous research suggests that the radius of influence for vertical displacement can also be larger than in soft clays. Although horizontal displacements were not quantified in the tests, it would be reasonable to suppose that, for cylindrical piles, an upper limit to horizontal displacement would be in line with the results of previous research shown in Figure 2.1b. At a radial distance of 1.5 pile diameters, horizontal displacements could be as large as 15 per cent of the pile diameter, tailing off gradually with increasing distance. The relatively small radial displacement gradient would help to minimise archaeological damage. Unfortunately, the tests did not enable the influence of lateral boundary conditions to be determined. However, in the half-section tests the effect of the relative density of the upper sand was explored and shown to be significant. Looser sand was able to shear more easily around the pile tip and this reduced the extent of vertical deformation of the clay surface (Figure 4.4). This effect is likely to be similar to the effect of using a flexible, rather than a rigid, lateral boundary with dense sand.

Science Report SC020074/SR Piling in layered ground: risks to groundwater and archaeology 45
-1
-0.8
-0.6
-0.4
-0.2
0
0.21 2 3 4
Current radius / equivalent pile radius
Ver
tical
dis
plac
emen
t / e
quiv
alen
tpi
le r
adiu
s
Moseley (1997)Test HS11 - LHSTest HS11 - RHSTest HS14 - LHSTest HS14 - RHS
Figure 4.20. Comparison of present and previous results for vertical displacement adjacent to driven piles in clay
4.3.2 Groundwater flow For the axisymmetric tests, the estimated permeabilities of the clay layers (Table 4.1) were compared to the measured values prior to pile construction (Table 4.3). While of the correct order, except for Test A13, measured values usually exceeded estimated ones. In some cases, the measured values were 40 per cent larger. These discrepancies can probably be attributed to very small amounts of flow around the edges of the clay layer, where perfect contact between the membrane and the clay may not have existed. However, this does not invalidate the measurements of the relatively large changes in flow due to pile installation or the interpretation of the tests. In Test A13 the substantially higher measured permeability before pile construction is attributable to more serious leakage around the edges of the clay layer. This was sufficient to obscure the effects of pile construction and therefore no post-pile results are quoted. These tests suggest that solid cylindrical piles can be expected to seal when driven through a sufficient thickness of clay, that is, a thickness of about two pile diameters or greater (Figure 4.19). This depends on the clay behaving in a ductile manner and so may not apply to heavily overconsolidated or hard clays at relatively shallow depths. H-section piles, on the other hand, cannot be relied on to seal because of partial plugging of the re-entrant regions with overlying soil. Boutwell et al. (2000) suggested that the inferior performance of H-section piles was due to a smaller increase in lateral pressures as a result of installation, but this now appears incorrect. Plugging of the piles will depend on several factors including the size, relative density and

Science Report SC020074/SR Piling in layered ground: risks to groundwater and archaeology 46
crushability of the overlying soil particles. It would be extremely hard to predict its extent in practice. For solid piles driven through thin clay layers (that is, less than two pile diameters thick), and for H-section piles driven through thicker clay layers, the movement of groundwater in the presence of a hydraulic gradient could be substantial, as illustrated in Table 4.3. Over time it might be possible, for example, for groundwater perched above a thin clay layer to seep away into the underlying strata as a result of driven pile construction. As recognised by the Environment Agency (2001) and Davis et al. (2004), this groundwater movement could spread contamination or damage the preservation of archaeological remains. However, caution should be exercised if the present results (Table 4.3 and Figure 4.19) are used as a basis for calculations in field situations. Although Figure 4.19 is presented as a dimensionless diagram, the normalisation has not been experimentally verified. As mentioned in Section 4.2.3, it is likely that the soil particles making up the preferential flow paths (represented by the equivalent column) will have suffered some degree of breakage, accompanied by void ratio changes, during pile penetration. Different degrees of breakage in different materials would lead to different changes in permeability and this would undermine the normalisation principle. This could be the reason that the pair of data points at T/D = 1.0 for the cylindrical pile show some disparity. Further research into the applicability of the normalised relationship is therefore required. Square section driven piles would probably seal as well as cylindrical ones, given the similarity of the deformation mechanisms seen in the half-section tests. For CFA piles, despite difficulties experienced in achieving satisfactory small-scale models, the tests suggest that well-constructed CFA piles should seal adequately in clay layers with a thickness of two pile diameters or more.

Science Report SC020074/SR Piling in layered ground: risks to groundwater and archaeology 47
5 Observations in archaeological excavations
This chapter summarises the results of a survey to identify information in archaeological literature or archives on the impact of piling on buried archaeological deposits. The survey was undertaken to supplement information from the laboratory tests and provide comparable data from known archaeological sites. In the absence of any information relating to CFA piles, information on piles constructed using traditional (intermittent) auger boring techniques has been included.
5.1 Methods To obtain information on the impact of piling on buried deposits, three sources of information were searched: archaeological records held in Sites and Monuments Records (SMRs), published papers/reports and site photographic archives held in the Museum of London Archaeological Archive. A total of 46 SMRs were contacted by letter to see if any impacts of piling on deposits were recorded during archaeological evaluations or excavations. Replies were received from 17 SMRs and of these, 14 did not know of, or possess, any records of interest. The three that provided information were Plymouth, Cambridgeshire and Northamptonshire SMRs. It was clear that, when archaeological work had been undertaken in mitigation of development, this had tended to be targeted on areas away from piling so as to concentrate on areas that were presumed to contain the best preserved archaeology. This approach obviously leads to the possible impacts of piling not being observed or recorded. The information gained from the survey is discussed in Section 5.2. Reports and publications were examined for information on the impact of piling on archaeological deposits. The reports examined were those identified in the survey of SMRs and from previous knowledge. Two visits were made to Museum of London Archaeological Archive to examine photographic archives from eight large excavations undertaken in London over the last 20 years. The sites chosen were large sites known to have had pre-existing piling or to have had piling undertaken when archaeologists were on site. All slides held in the archive were examined for each site, the slides being held on hanging sheets with each sheet holding up to 24 slides. For each site, the approximate number of sheets for each site is noted below to demonstrate the relative size of each site archive: • Gresham Street (GSM97) – 100 sheets • Plantation House (FER97) – 250 sheets • No.1 Poultry (ONE94) – 200 sheets • The Guildhall (GYE92) – 250 sheets • Bull Wharf (BUF90) – 200 sheets • Thames Exchange (TEX88) – 40 sheets • St Albans House (ABS86) – 3 sheets • Sunlight Wharf (SUN86) – 13 sheets Notes were made regarding the impact of the piles on the archaeology.

Science Report SC020074/SR Piling in layered ground: risks to groundwater and archaeology 48
5.2 Case studies
5.2.1 Plymouth Plymouth SMR suggested the site of Discovery Wharf at Sutton Harbour, which was investigated by Exeter Archaeology. A representative of Exeter Archaeology stated that they watched the grubbing out of old pile caps but did not make any records regarding the absence, presence or nature of any disturbance caused by the piles. No further information was available.
5.2.2 Wisbech, Cambridgeshire Cambridgeshire SMR provided a copy of a report on excavations at Market Mews, Wisbech (Hinman, 2002). On this site, a modern borehole had been bored prior to excavation. Unfortunately, the type of boring rig used is unrecorded but it may well have been a cable percussion rig. A photograph of a section cut through the borehole showed that the layers around the borehole had been dragged down and distorted. The borehole was approximately 0.12 m in diameter, as estimated from the hole left, and the vertical displacement was up to about 0.2 m. The disturbance extended around the hole to a distance of approximately 0.25 m from its centre.
5.2.3 Northampton Northampton SMR provided information on the former Barclaycard Building site, Marefair, Northampton. In one of the trenches that was excavated (Trench 10), a concrete pile and pile cap were exposed and the impact of the pile on the sediments was recorded. The pile was 0.48 m in diameter and the pile cap was one metre thick. “Close to the building’s north wall, the action of driving the foundation pile had produced a characteristic distortion of the stratigraphy. The layers through which it had been driven had been warped by the action of pile driving, each one drawn down in an inverted cone towards the central pile. Close to the pile itself, the layers were mixed together by the resultant vibration and liquefaction in a sleeve around the pile a few centimetres thick. As a result, the area of damage and distortion from each individual pile can be quantified as a circle, of a radius c1.0m.” (Northamptonshire Archaeology Unpublished Report) As seen in Figure 5.1, a section showed that soil disturbance extended over a radius of 0.6 m from the centre of the pile, and that the vertical displacement near the pile was over one metre.

Science Report SC020074/SR Piling in layered ground: risks to groundwater and archaeology 49
Figure 5.1. Section showing disturbance due to a pile at Barclaycard Marefair Northampton (reproduced by permission of the Historical Environment Team, copyright Nothamptonshire County Council). Zone 2 represents the pile cap, zone 4 represents the pile and the remaining zones represent various soils.
5.2.4 London In examining the photographic archives held by the Museum of London, it was difficult to identify the degree of damage caused by piling. There were three main reasons for this. The first, as previously noted (Section 5.1), was the preference of archaeologists for focusing their work on the sites or areas of sites with the best preservation, resulting in a selective avoidance of areas with extensive piling. The second, and related, reason is that archaeologists are interested in recording the archaeology, not the damage to the archaeology. Many of the photographs therefore showed archaeology in the foreground with piles in the background but with no details of the impact of the piles on the archaeology. The final reason concerns the methods used to excavate sites. Over the last 20 years or so, the techniques used to excavate sites have changed, resulting in far fewer sections being cut and recorded. However, sections usually show the nature and extent of damage from piles far better than do plans. Nevertheless, a few comments can be made on the impacts observed in the photographs. There was a great deal of variation in the apparent impact. In some cases there appeared to be no damage, while in others the damage seemed extensive. Some of the most useful records were made at No. 1 Poultry (Rowsome, 2000). The site contained a range of piles which were all exposed as the site was excavated. Excavation took place after the insertion of new piles to create a basement for the building, as construction of the upper floors took place. Piles on the site included driven piles from the 1950s and 1960s, a modern secant pile wall and some modern two metre diameter augered piles with sleeves. Figure 5.2 shows that piles, presumed from their appearance to be augered (bored and cast in situ) piles, passed close to wooden structural remains. Following excavation the wood was found to be undisturbed other than where the pile had touched it. Another case of very limited damage is illustrated in Figure 5.3, where similar piles passed through a Roman mosaic floor without apparently disturbing the mosaic tiles beyond the footprint of the pile. In contrast, an example of extensive damage can be seen around a

Science Report SC020074/SR Piling in layered ground: risks to groundwater and archaeology 50
large diameter augered pile sleeve in Figure 5.4. In this case the pile has passed through a thin beaten earth floor that has disintegrated or distorted over a distance of about 0.6 m around the two metre diameter pile sleeve.
Figure 5.2. Pile through deposits containing a wooden structure, No.1 Poultry, London (copyright Museum of London Archaeology Service)
Figure 5.3. Piles through a Roman mosaic, No.1 Poultry, London (copyright Museum of London Archaeology Service)
Nixon (1998) provided a commentary on the piling strategy and damage observed at No. 1 Poultry. Surprisingly, perhaps, Nixon reported that the driven piles were observed to cause little physical distortion. This contrasted with experience at Thames Exchange, where old driven piles caused damage to timber structures extending to three pile diameters beyond the pile. Generally, the two metre diameter sleeved augered piles also showed almost no distortion (the damage illustrated in Figure 5.4 is an exception).

Science Report SC020074/SR Piling in layered ground: risks to groundwater and archaeology 51
However, for a minority of these piles damage was observed up to one metre away at the level of the water-table, where the deposits in these cases appeared to have liquefied. There were also a few piles where problems were caused by the casing dragging down timbers, creating voids that collapsed when water entered them.
Figure 5.4. Pile sleeve through a thin beaten earth floor, No.1 Poultry, London (copyright Museum of London Archaeology Service)
5.2.5 Worcester At Farrier Street in Worcester, drag-down was observed adjacent to 0.2 m square driven concrete piles (Dalwood et al., 1994). The area that was impacted extended up to 0.3 m from the pile, while the maximum vertical displacement was over 0.3 m. Artefacts were found to have been displaced next to the pile with later material dragged down and intermixed with earlier material. It was also noted that the piling did not appear to affect the soil micromorphology beyond the area of the pile, though no further details are provided on this.
5.2.6 Lincoln ARCUS undertook a watching brief on test piles which were driven on the JunXion site, Lincoln, prior to finalising the piling methodology to be employed. Two 0.25 m square concrete test piles were driven, one after pre-augering through a layer of fill. A trench was excavated with the piles in section and the observable impact of the piles recorded (Figure 5.5). The impacts observed included: drag-down which extended downwards up to one metre and laterally up to 0.1 m from the pile, cracking, remoulding of deposits and the creation of voids. With pre-augering the disturbance was restricted to the diameter of the auger (0.35 m). It was concluded that, in the given ground conditions, there was no significant difference between the impacts of the two types of pile. Full details of this work are provided in Davies (2003).

Science Report SC020074/SR Piling in layered ground: risks to groundwater and archaeology 52
Figure 5.5. Sections showing disturbance caused by driven and pre-augered driven concrete piles at Lincoln. Numbered zones (except 104 and 107) represent various soils.
5.2.7 Boston At a site in Skirbeck Road, Boston, Archaeological Project Services undertook a watching brief on a programme of piling that compared the results of different pile types and techniques (Rayner, 2005). Four piles were driven: square concrete, capped concrete (with a steel cap fitted at the base), tubular steel and square concrete with pre-augering. Disturbance around all of the piles was limited and in some cases it was difficult to distinguish the effects of the piles due to the complex archaeological stratigraphy (Figure 5.6). For the concrete pile, measurements of areas and depths of disturbance were not feasible. The capped concrete pile, 0.26 m square, caused vertical displacements of up to 0.3 m and a radius of disturbance of up to 0.32 m from the centre of the pile. Driving the steel pile had a more restricted impact, with thin bands of disturbance approximately 0.05 m thick running down the sides of the pile. A photograph of this pile shows limestone hardcore dragged down at least 0.3 m next to the pile. In the case of the pre-augered concrete pile, disturbance was restricted to diameter of the over-sized auger, as was the case at Lincoln.

Science Report SC020074/SR Piling in layered ground: risks to groundwater and archaeology 53
Figure 5.6. Sections showing disturbance caused by driven concrete, capped concrete and steel piles and pre-augered concrete piles at Boston (copyright Archaeological Project Services). Numbered zones represent various soils.

Science Report SC020074/SR Piling in layered ground: risks to groundwater and archaeology 54
5.3 Summary and conclusions Table 5.1 summarises the observed vertical displacements and lateral extent of disturbance from the case studies. In the last column the radius of disturbance is normalised by the pile diameter or width. Table 5.1. Summary of observations in archaeological excavations
Location Pile type Pile diameter
(m)
Soil type Maximum vertical
displacement (m)
Radius of disturbance
(m)
Radius of disturbance/
pile diameter (or
width)
Northampton Circular driven
0.48 Unknown 1.0 0.6 1.25
Wisbech, Cambridgeshire
Borehole 0.12 Cohesive fill1
0.2 0.25 2.08
No. 1 Poultry London2
Augered with metal
sleeve
2m Beaten earth floor
? About 1.6 0.8
Worcester Driven square
concrete
0.2 Cohesive fill1
0.3 0.4 2.00
Lincoln Driven square
concrete
0.25 Cohesive fill1
(compact)
1.0 0.25 1.00
Lincoln Pre-augered driven square
concrete
0.25 Cohesive fill1
(compact)
? 0.175 0.70
Boston Driven square
concrete
0.26 Limestone gravel over cohesive
fill1
? ? ?
Boston Driven capped square
concrete
0.26 Limestone gravel over cohesive
fill1
0.3 0.32 1.23
Boston Driven steel tube
0.19 Limestone gravel over cohesive
fill1
0.3 0.15 0.79
Boston pre-augered driven square
concrete
0.22 Limestone gravel over cohesive
fill1
? 0.16 0.73
1 Apparently cohesive, due to silt and/or clay content, and usually containing coarser particles embedded in the fine-grained matrix. 2 Other pile impacts were recorded at the site but are not shown in this table as the type of pile installation technique could not be fully identified.

Science Report SC020074/SR Piling in layered ground: risks to groundwater and archaeology 55
The first conclusion to be drawn from this study is that more effort needs to be made by archaeologists to record the impact of piling (and other construction techniques) on archaeology when suitable opportunities arise. Despite the information gathered for this report, the amount of field data on the impact of piling remains very limited. From the case studies presented, the following conclusions may be drawn:
• Driven piles can be expected to drag down the adjacent soil within a maximum radius of about two pile diameters (or widths); often the radius of influence will be much smaller.
• Pre-augering does not necessarily reduce the impact of subsequently driven piles, since the auger diameter may be larger than the pile diameter. However, it can provide more certainty about the area of potential damage from piling.
• In favourable ground conditions, augered piles can have remarkably little impact on archaeological remains (see Figure 5.3).
• Where a sleeve is used during augering, driving of the sleeve ahead of the auger risks damage akin to that caused by driven piles (see Figure 5.4).

Science Report SC020074/SR Piling in layered ground: risks to groundwater and archaeology 56
6 Conclusions and recommendations Physical model tests were used to investigate the behaviour of layered soils during the installation of piles and to achieve the objectives listed below. While an attempt was made to model the construction of CFA piles, the emphasis was on the penetration of driven piles. Some field observations bearing on the subject, were also collected. The main conclusions are given below. Objective 1: Investigate the deformations of layered soil caused by piling The mechanism of deformation of layered soil around a driven pile is described schematically in Figure 4.12. In essence, the deformation pattern is influenced in complex ways by the relative strengths of the soil layers, which depend on the effective overburden pressure, relative density (for sands) and stress history (for clays). The behaviour of heavily overconsolidated (brittle) clays could be significantly different and has not been investigated. The model tests confirm that, compared with deformations around driven piles, deformations around well-constructed CFA piles are very small. In homogeneous clay, or clay with very thin layers of coarser soil, deformations around solid driven piles are more predictable than in thickly layered soils and previous research (Figure 2.1) provides a predictive guide. Further research, employing half-section models, is recommended to widen the scope of the investigation. This should include investigation of soil layers that represent a range of urban archaeological deposits, as well as more brittle clays. With archaeology in mind, layers should have a greater variety of particle size and composition (including cementing and organic materials). Future models should be subjected to appropriate confining pressures and digital imaging techniques should be used to determine the displacement and strain fields. Objective 2: Quantify the change in overall permeability of layered soil (acting as an aquitard) in the vicinity of a pile Solid cylindrical piles are able to form a seal when driven through a clay layer with a thickness of at least two pile diameters, although this result may not hold for heavily overconsolidated clays. Where the clay is less than two pile diameters thick, substantial changes in overall vertical permeability can occur. Also, piles with re-entrant sections, such as H-section piles, seal less well than solid ones due to partial plugging with overlying soil. The effect of pile driving is equivalent to the creation of an additional seepage pathway in a column of overlying soil (Figure 4.18). A normalised diagram (Figure 4.19) shows the effects observed in the model tests, although further research is needed to test the validity of the normalisation. Solid driven piles with a square cross-section are likely to seal just as well as cylindrical piles, given the similarity of observed deformation mechanisms. CFA piles are also likely to seal well, unless construction practice is poor. Objective 3: Establish the extent of down-dragging of contaminated soil arising from pile construction Pile driving may cause contaminated soil to be carried down into underlying layers in three ways, all of which have been illustrated in the model tests. Firstly, a small amount of contaminated soil may be trapped and pushed down beneath the base of a flat-ended solid pile. A tendency for this soil to be shed around the sides of the pile within a clay layer was observed in some tests. The use of a pointed pile tip can eliminate this transport mechanism.

Science Report SC020074/SR Piling in layered ground: risks to groundwater and archaeology 57
The second mechanism involves a larger volume of soil forced to move down ahead of the advancing pile and into the upper part of an underlying softer layer. Here, most of it (apart from that trapped beneath the base of a flat-ended pile) is left behind as the pile moves on and, importantly, no new soil is dragged-down as it does so. The maximum penetration of the overlying soil into a softer layer in the tests was of the order of 1.5 pile diameters (or widths) but has been previously reported to be as large as three pile diameters. Thirdly, coarse-grained contaminated soil can be carried down within re-entrant sections, notably between the flanges of H-section piles, through a plugging mechanism. This soil is gradually left behind in an underlying clay layer. Objective 4: Establish the radius of influence of a pile on archaeology For driven piles, significant vertical displacements in a predominantly clay soil are unlikely to extend beyond 1.5 pile diameters (or widths) from the pile centreline. Occasionally, in deposits of interest to archaeologists, they could extend to two pile widths but this probably requires the piles to be square - square piles displace somewhat larger amounts of soil than cylindrical piles of the same width - and the deposits to contain relatively little clay. Most of the vertical displacement (or down-dragging of soil) is concentrated within a distance of one pile width from the pile centreline. Soil is also displaced outwards horizontally around a driven pile. Beyond the zone of significant vertical displacement, the magnitude of the horizontal movement changes only slowly with increasing radius in clay soils. This is helpful as far as damage to archaeology is concerned: soil layers and any artefacts they contain may be displaced but they remain almost undistorted. H-section piles displace smaller amounts of soil and hence cause smaller displacements than solid piles of comparable width. In thick layers of coarse-grained soil, the radius of influence for vertical displacement may well be larger than in fine-grained soil. Further research, as suggested above (under Objective 1), is therefore recommended.

Science Report SC020074/SR Piling in layered ground: risks to groundwater and archaeology 58
References Achleitner, S., Wett, B. and McManis, K.L. (2004). Deep foundations penetrating mineral sealing
barriers: impacts on hydraulic flow and contaminant transport. Environmental Engineering Science, 21(2), 231-240.
Ahmadi, M.M. and Robertson, P.K. (2004). Calibration chamber size and boundary effects for
CPT qc measurements. Proceedings ISC-2 on Geophysical Site Characterisation, 1, 829-833. Millpress: Rotterdam.
Al-Tabbaa, A. and Wood, D.M. (1987). Some measurements of the permeability of kaolin.
Geotechnique, 37(4), 499-503. Baligh, M.M. (1985). The strain path method. Journal of the Geotechnical Engineering Division,
ASCE, 111 (GT9), 1108-1136. Boutwell, G.P., Nataraj, M.S. & McManis, K.L. (2000). Deep foundations on brownfield sites.
Prague 2000 Conference, Prague. Carrier, W.D. (2003). Goodbye, Hazen; Hello, Kozeny-Carman. Journal of Geotechnical and
Geoenvironmental Engineering, ASCE, 129 (11), 1054-1056. Cooke, R.W. and Price, G. (1973). Strains and displacements around friction piles. Proceedings
8th International Conference on Soil Mechanics and Foundation Engineering, Moscow, 2.1, 53-60.
Cooke, R.W., Price, G. and Tarr, K. (1979). Jacked piles in London Clay: a study of load transfer
and settlement under working conditions. Geotechnique, 29 (2), 113-147. Dalwood, C.H., Buteux, V.A. & Darlington, J. (1994). Excavations at Farrier Street and other
sites north of the city wall, Worcester 1988-92. Transactions of the Worcestershire Archaeology Society 3rd Series, 14, 75-114.
Davies, G. (2003). Archaeological field evaluation of the impacts of piling at the JunXion, St
Marks Street, Lincoln. Unpublished ARCUS Report 750.1. Davis, M. J., Gdaniec, K. L. A., Bryce, M. and White, L. (2004). Study of the mitigation of
construction impacts on archaeological remains. London: Museum of London Archaeology Service.
Environment Agency (2001). Piling and penetrative ground improvement methods on land
affected by contamination: Guidance on pollution prevention. National Groundwater and Contaminated Land Centre report NC/99/73. Environment Agency: Bristol.
Francescon, M. (1983). Model pile tests in clay: stresses and displacements due to installation
and axial loading. PhD thesis, University of Cambridge. Gue, S.S. (1984). Ground heave around driven piles in clay. PhD thesis, University of Oxford. Hayman, J.W., Adams, R.B. & Adams, R.G. (1993). Foundation piling as a potential conduit for
DNAPL migration. Proceedings of the Air and Waste Management Association Meeting, Denver, CO.

Science Report SC020074/SR Piling in layered ground: risks to groundwater and archaeology 59
Hinman, M. (2002). Deeply stratified Medieval and Post-Medieval remains at Market Mews,
Wisbech. Cambridgeshire County Council Report No. 156 Hird, C.C. and Moseley. V.J. (2000). Model study of smear zones around vertical drains in
layered soil. Geotechnique, 50(1), 89-97. Houlsby, G.T., Evans, K.M. and Sweeney, M.A. (1988). End bearing capacity of model piles in
layered carbonate soils. In: Engineering for Calcareous Sediments, Jewell and Andrews (eds), pp. 209-214. Balkema: Rotterdam.
Lehane, B.M. and Gill, D.R. (2004). Displacement fields induced by penetrometer installation in
an artificial soil. International Journal of Physical Modelling in Geotechnics, 1(1), 25-36. Massarsch, K.R. and Broms, B.B. (1977). Fracturing of soil caused by pile driving in clay.
Proceedings 9th International Conference on Soil Mechanics and Foundation Engineering, Tokyo, 1, 197-200.
Massarsch, K.R. (1978). New aspects of soil fracturing in clay. Journal of the Geotechnical
Engineering Division, ASCE, 104(GT8), 1109-1123. Moseley, V.J. (1997). Effects of smear during vertical penetration of layered soils. PhD thesis,
University of Sheffield. Nixon, T. (1998). Practically preserved: observations on the impact of construction on urban
archaeological deposits. In: Preserving archaeological remains in situ, Corfield, Hinton, Nixon and Pollard (eds), Museum of London Archaeology Service, pp. 39-46.
Northamptonshire Archaeology (undated) Archaeological evaluation at Barclaycard, Marefair,
Northampton, Stage 2: Trial Excavation. Pestana, J.M., Hunt, C.E. and Bray, J.D. (2002). Soil deformation and excess pore pressure field
around a closed-ended pile. Journal of Geotechnical and Geoenvironmental Engineering, ASCE, 128 (1), 1-12.
Randolf, M.F., Steenfelt, J.S. and Wroth, C.P. (1979). The effect of pile type on design
parameters for driven piles. Proceedings 7th European Conference on Soil Mechanics and Foundation Engineering, Brighton, 2, 107-114.
Rayner, T. (2005). Archaeological investigations and watching brief on land at Skirbeck Road,
Boston, Lincolnshire (BSR04). Archaeological Project Services Report 20/0. Rowsome, P. (2000). Heart of the City, Roman, Medieval and modern archaeology revealed by
archaeology at 1 Poultry. English Heritage and Museum of London Archaeology Service. Sageseta, C. and Whittle, A.J. (2001). Prediction of ground movements due to pile driving in clay.
Journal of Geotechnical and Geoenvironmental Engineering, ASCE, 127 (1), 55-66. Thornburn, S., Greenwood, D.A. and Fleming, W.G.K. (1998). The response of sands to the
construction of continuous flight auger piles. In: Deep Foundations on Bored and Auger Piles, Van Impe (ed), pp. 429-443. Balkema: Rotterdam.
Van den Berg, P. (1994). Analysis of soil penetration. PhD thesis, Technical University of Delft.

Science Report SC020074/SR Piling in layered ground: risks to groundwater and archaeology 60
Vigiani, C. (1998). Further experiences with auger piles in Naples area. In: Deep Foundations on Bored and Auger Piles, Van Impe (ed), pp. 445-455. Balkema: Rotterdam.
Westcott, F.J., Smith, J.W.N. and Lean, C.M.B. (2003). Piling in contaminated ground:
environmental impacts, regulatory concerns and effective solutions. Engineering Geology, 70, 259-268.
White, D.J. and Bolton, M.D. (2004). Displacement and strain paths during plane-strain model
pile installation in sand. Geotechnique, 54 (6), 375-397.

We are The Environment Agency. It's our job to look afteryour environment and make it a better place – for you, andfor future generations.
Your environment is the air you breathe, the water you drinkand the ground you walk on. Working with business,Government and society as a whole, we are making yourenvironment cleaner and healthier.
The Environment Agency. Out there, making yourenvironment a better place.
Published by:
Environment AgencyRio HouseWaterside Drive, Aztec WestAlmondsbury, Bristol BS32 4UDTel: 0870 8506506Email: [email protected]
© Environment Agency
All rights reserved. This document may be reproduced withprior permission of the Environment Agency.