pilot performance during multiple failures: an … performance during multiple failures: an...
TRANSCRIPT
TRANSPORTATION HUMAN FACTORS, 2(1), 63–76Copyright © 2000, Lawrence Erlbaum Associates, Inc.
Pilot Performance During Multiple Failures:An Empirical Study of Different Warning Systems
Gideon SingerFlight Operations, Saab Aircraft AB
Linköping, Sweden
Sidney W. A. DekkerCentre for Human Factors in Aviation
Department of Mechanical EngineeringLinköping Institute of Technology
Dynamic fault management—that is, dealing with a cascade of failures while maintaining processintegrity—is a dominant human task in various transportation modes (e.g., commercial aviation,shipping). The way in which a warning system represents failures and the way in which the systemcontributes to failure management jointly determine the amount and kind of cognitive work in whichthe human has to engage to manage multiple failures. In this study pilot performance on 4 differentcommercial aviation warning systems was tested by measuring time and error rates in identifyingroot causes in a cascade of failures. All systems tested represent failures in the same basic way (amessage list) but differ in the kind of contribution they make to the failure management task; forexample, by sorting failures, prioritizing them, selecting only some failures for presentation, guid-ing the pilot on what to do next, or showing the pilot which systems are still operational. Human per-formance benefits accrued in systems that (a) provided guidance on what to do next and (b) showedwhich systems were still operational. These findings are consistent with the cognitive demands ofdynamic fault management and carry important messages for how those demands should be sup-ported. The results suggest that rather than automating even more of the human role in fault man-agement to minimize error counts, attention should be paid to the kinds of referents andrepresentations that are most useful in informing the operator of what is going on in the underlyingprocess and how best to cope with it.
A dominant role of human operators in all modes of transportation today is to manage system fail-ures. Faults in complex, dynamic systems typically propagate through physical as well as func-tional interdependencies, producing a cascade of disturbances and failures (Billings & Dekker,1996; Woods, 1994). Managing these failures can mean anything from diagnosing, understanding,and resolving them; to sorting or prioritizing them; to merely containing or mitigating their conse-quences. Almost invariably, however, the identification of primary faults (setting off the cascade)is of critical importance. Two characteristics of a warning system jointly influence the human abil-
Requests for reprints should be sent to Sidney W. A. Dekker, Linköping Institute of Technology, Centre for HumanFactors in Aviation, Department of Mechanical Engineering, SE-581 83, Linköping, Sweden. E-mail: [email protected]
ity to manage multiple failures and recognize root causes that underlie the disturbance chain. Theyalso determine the nature and amount of cognitive work in which the human has to engage whenfailures occur. These two characteristics are (a) how the system represents underlying failures andtheir interconnections on a warning display and (b) the extent to which the system itself contributesto the failure management task by sorting out, prioritizing, resolving, or containing the failure orby determining what is left operational and what to do next.
Incidents in commercial aviation and elsewhere keep stressing the need for better support dur-ing dynamic fault scenarios, especially in highly automated aircraft with multitudes of electron-ic interdependencies (e.g., Billings & Dekker, 1996). Studies about how to support the human inthis situation are often limited to paper evaluations (e.g., Hicks & De Brito, 1998) that produceno performance data. The Federal Aviation Administration (FAA; 1996) encouraged furtherresearch into aircraft warning systems, because data on different kinds of systems are eitherunavailable or inconclusive. For example, in earlier knowledge elicitation (Mårtensson &Singer, 1998), pilots from a variety of backgrounds revealed ambiguous preferences relative torepresentational features of warning systems. They tended to dislike guidance on what to do nextabout failures that arise from within their aircraft—yet they indicated they were happy to acceptguidance associated with warnings from the outside, for example, ground proximity warnings ortraffic alerts. They also indicated that they wanted less on the display and more prioritizing doneby the system but wanted to be kept fully in the loop on all malfunctions that have occurred andwhat, if anything, the system is doing in regard to them. This would seem to produce a collec-tion of irreconcilable design requirements, which is one reason pilot opinions about systemdesign are often treated with some suspicion by manufacturers and certifiers of systems alike(e.g., Courteney, 1999).
In this article we report empirical data on pilot performance with different kinds of warningsystems that were modeled on four existing systems in commercial airliners flying today. Thesesystems do not differ substantially with respect to their representational quality; that is, whatthey represent (aircraft subsystems and their status) and how they represent it (message lists con-taining abbreviations that point to some system and its status in some color) are essentially thesame across different manufacturers. Where they differ is the extent to which the system itselfcontributes to the failure management task, and there are various ways and gradations in whichmanufacturers do this. Contributing to the failure management task can vary from prioritized orsorted presentation, to selective presentation, to presenting guidance on what to do next, to indi-cating which system or component is still operational. This allowed us to assess the effect of dif-ferent ways in which systems themselves prioritize or otherwise deal with failures beforerepresenting them on a display.
PROBLEM REPRESENTATION
A fundamental finding from cognitive science and related research is that the representation of aproblem determines the kind of work in which the problem solver has to engage and influences theefficiency of the problem-solving process (Woods, 1995). As Simon (1969) put it, “Solving a prob-lem simply means representing it so as to make the solution transparent” (p. 71). Parallel findingsfrom studies of naturalistic decision making reflect how practitioners who are faced with complex,ill-structured problems make a considerable investment in making sense of the problem, in restruc-turing it, whereafter the decision (solution, really) becomes obvious (e.g., Klein, 1998). This means
64 SINGER AND DEKKER
that the representation of warnings goes deeper than superficial issues such as color, indentations,number of displayed lines, and so on. A critical aspect of representations—and how they help orhinder problem-solving performance—is the way in which differently coded symbols (words,lights, icons, colors, etc.) point to, or represent, referents in the underlying monitored process andwhether the referents represented are of any meaning given the problem-solving task (Woods,1995). Referents in today’s warning systems are often single components or subsystems (e.g.,LEFT GEN: the generator on the left side) and that component’s or system’s status (e.g., FAILED).The surface features of these referents are often the sole focus in design and evaluation discussions.Should this one be red or yellow? Should this be one indentation farther or not? How many warn-ings (referents) can we put on one page? Designers can get lost in the details of superficial featureswithout making fundamental progress on the representational quality, that is: What actually are thereferents of interest, and how do we represent those?
DYNAMIC FAULT MANAGEMENT
In the language of the domain (in this case, aviation), warnings are often said to serve three pur-poses: to (a) alert the pilot that something is wrong, (b) report what is wrong, and (c) guide thepilot in what to do (Mårtensson & Singer, 1998). These straightforward-sounding purposesobscure a much more intricate cognitive reality that lies behind the management of multiple fail-ures in a complex, ongoing, and changing process. What confronts problem solvers in dynamicdomains is the need to diagnose malfunctions while maintaining process integrity. This is calleddynamic fault management, a distributed human–machine activity that the field of human fac-tors is only just beginning to appreciate (Woods, 1994). A fault in dynamic processes typicallyproduces a cascade of disturbances or failures. Both functional and physical fault propagationare normal features of modern airline transports, given intersystem couplings and how tightlysystems are packed together physically (Billings, 1996; Billings & Dekker, 1996; Hicks & DeBrito, 1998). Not only must failures be managed while keeping the aircraft flying but also theirimplications for the ability to keep the aircraft flying in the first place need to be understood andacted on. Keeping the process intact and diagnosing failures are interwoven cognitive demandsin which timely understanding and intervention are often crucial.
Given system cross-couplings in modern airliners and the dual demands of dynamic faultmanagement, things other than the status of single components or systems may be more inter-esting for a pilot to derive from his representation of failures. For example, what are the inter-connections between the multiple failures (what is the structure of the problem so that a solutionor countermeasure becomes evident)? Given the phase of flight, what issue should be addressedfirst? What are the postconditions of these failures for the remainder of operations (i.e., what isstill operational, how far can I go, what do I need to reconfigure)? Is there any trend? Are therenoteworthy events and changes in the monitored process right now? Will any of this get worse?
Current warning systems in commercial aircraft do not go far in answering these questions,something that is confirmed by pilots’ assessments of these systems. For example, pilots have com-mented on too much data, particularly all kinds of secondary and tertiary failures, with no logicalorder, and primary faults (root causes) that are rarely, if ever, highlighted (Mårtensson & Singer,1998). The representational nature is limited to message lists, something that is known to hamperoperators’ visualization of the state of their system during dynamic failure scenarios (see Potter &Woods, 1991, who also recommended showing guidance to the operator on what to do next).
WARNING SYSTEMS AND PILOT PERFORMANCE 65

SUPPORTING THE FAILURE MANAGEMENT TASK
Warning systems today, although similar in their representational quality, differ in the extent towhich they contribute to the failure management task. The growth in computational power hasallowed designers to automate more and more in managing system failures, and in the field ofcommercial aviation different manufacturers have pursued different philosophies in what andhow much should be left for the human (Billings, 1996; Hicks & De Brito, 1998). The contri-bution of the system to failure management ranges from prioritizing or sorting the failures, toselecting some for presentation, to providing guidance on what to do next, to presenting whatsystem or component is left operational. Systems that sort and prioritize failures and leave outclutter can make the structure of the problem clearer (Klein, 1998), thus supporting failure man-agement by helping the human make quicker assessments about what may be the root cause. Butmanaging failures in complex, dynamic settings goes beyond just diagnosing failures or theirroot cause(s) individually. It also includes understanding the operational implications of failures,that is, understanding how failures threaten system integrity or operational continuity. Somewarning systems seem to cater more to this understanding than others do. So, given static repre-sentational quality across the different manufacturers, the way in which a system contributes tofailure management could carry consequences for human performance in dynamic fault man-agement. This is what we tested in this study.
FOUR DIFFERENT WARNING SYSTEMS
The study reported here was intended to generate empirical data on pilot performance with dif-ferent warning systems. Given static representational quality, existing systems show a gradientin how they support the human in managing failures and understanding their implications.Today’s systems range from contributing almost nothing to doing almost everything in terms offailure management. In between, systems typically try to support the pilot by sorting through themultiple failures and prioritizing them (which can reveal the nature of interdependencies; e.g.,by recognizing root causes) and by guiding the pilot on what to do next. In existing warning sys-tems available from commercial aircraft manufacturers, four levels of fault management supportcan be distinguished (see Table 1). These characterizations are not one-to-one relationships towhat the manufacturers offer but rather are inspired by how these systems work:
1. Show All. This was inspired by the Boeing 777 method of showing all the fault messageswith very little prioritization or processing of the relationships between the faults. The only inhi-bition is of clear direct subsystem failures messages. Severity is predetermined for each indi-vidual message, and the level is set by color. The messages are displayed in a chronologicalorder, which may result in the primary fault appearing at the bottom of the list.
2. Sort & Show. This was inspired by the Saab 2000 method of inhibiting all the messagesthat do not require pilot action when a high-level warning is presented. Severity even here is pre-determined by colors, and messages are displayed chronologically. System logic sorts the mes-sages of the same color and presents the primary fault (when known) at the top of the list. If afailure results in automatic system reconfiguration, this is usually shown. This method results inshorter lists and usually a primary fault at the top.
66 SINGER AND DEKKER

3. Sort & Guide. This was inspired by the A320 method of a fully defined logic for messageprioritization. In addition, only one failure is shown at a time, along with the immediate-actionsrequired of the pilot. Subsystem information is displayed on demand on a lower level display.This results in a clear information to the pilot of the primary fault and guidance for recovery.
4. Do & Show. This was inspired by the MD11 method, in which the system has a highdegree of autonomy and can react to failures without pilot action. The only exceptions are non-reversible actions (such as engine shutdown). For the majority of the failures the system informsthe pilot of system reconfiguration and present status. In addition, the system recognizes a com-bination of failures and gives a common name to the higher level of fault (dual engine).
EXPECTED RESULTS
Given that the representational nature of these systems does not differ fundamentally (showingthe status of single failed components), performance benefits would have to derive predomi-nantly from the way in which these systems contribute to failure management. Warning systemsthat basically pass a cascade of failures on to the human as they come in over time (such as theShow All system) have led to human performance decrements during critical incidents; forexample, inabilities to identify root causes or visualize the state of the process (Billings &Dekker, 1996; Potter & Woods, 1991). Short of profoundly re-evaluating the representationalnature of commercial aircraft warning systems (i.e., reconsidering what are actually the inter-esting changes, events, and implications and readjusting the representation’s referents on the
WARNING SYSTEMS AND PILOT PERFORMANCE 67
TABLE 1The Four Warning Systems Tested in This Study
Display Philosophy Modeled on Aircraft Type Display Features in Aviation Domain Language
“Show All” Boeing 777 All failed systems displayedRED/AMBER priority onlyRED only if single failure criticalDirect subsystem failures not shownFailures shown chronologically
“Sort & Show” Saab 2000 Predetermined declutter when no crew actionRED/AMBER priorityDirect subsystem failures not shownClear primary failure shown on topAutomatic reconfigurations not shown
“Sort & Guide” Airbus 320 Full predetermined priorityRED/AMBER priorityOnly one failure (most urgent) presented at a timeGuidance for immediate action follows failure messageSubsystems presented as status onlyAutomatic reconfigurations not shown
“Do & Show” Boeing MD-11 Full predetermined priorityCombined failure effect stated (“DUAL”)Automatic system reconfiguration—information to crewGuidance when crew action required
basis of that), other available warning systems depart from the Show All system by doing morefailure management themselves. Performance benefits could accrue if these properties supportthe dynamic fault management task.
• Modest performance benefits can be expected if the system itself makes some decisionsabout what warnings to represent in the first place. If presented failures carry no relevance to thesituation at hand, or do not require human action, their inhibition may improve performance onconcurrent tasks and assessments associated with dynamic fault management. The Sort & Showsystem is an example of a system that inhibits failure presentation to some extent: It prioritizesfailures and shows them only selectively.
• Furthermore, a system that sorts through the failures, presents them selectively, and guidesthe pilot in what to do next or where to look next, in addition to sorting through the failures,would support the dynamic fault management task: Both problem structure and subsequentactions (and implicit couplings between them that the pilot may recognize) are illuminated. TheSort & Guide system is an example of this, because it prioritizes failures, shows them selective-ly, and guides the operator in what to do next.
• Finally, a system that corrects or mitigates failures itself and then shows only what it has doneand what is left operational can be expected to carry performance benefits for the dynamic faultmanagement task. Pilots are aided in their understanding of how their process integrity is affectedby the failures that occurred and can project their consequences into the future (i.e., what implica-tions they carry for the rest of the flight). The Do & Show system is an example of this.
METHOD
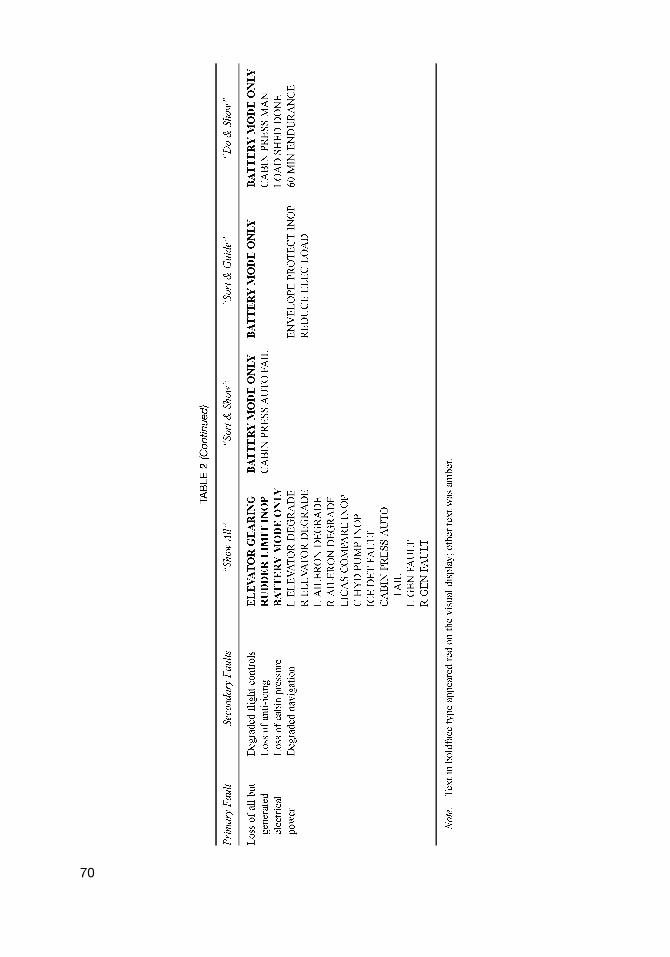
We set up a part-task simulation experiment to assess the human performance benefits associat-ed with four different aircraft warning systems. One hundred twenty-eight approaches on whichcomplex, multiple failures occurred were flown by 8 professional pilots in a part-task flight sim-ulator. The approach phase was chosen because it is known for its higher workload and multipleinterleaving tasks. Each of the 16 approaches flown by every pilot contained one out of fourdynamic failure scenarios in which a fault combination produced a cascade of secondary failures(see Table 2, which also shows how the various displayed failures would look to the pilot in thedifferent warning systems).
The list of messages was displayed at once, to create a common reference point from whichto measure response times (RTs) across different warning systems. Also, display formats of thedifferent warning systems were standardized with a common font. Each of the four failure sce-narios was presented to every pilot four times, using a different underlying warning system torepresent them every time. Thus, a pilot would be confronted with, for example, a loss ofhydraulic systems on a total of 4 approaches, but each time the amount of support the warningsystem offered in terms of prioritizing, filtering, or mitigating the failures would differ. The fourfailure scenarios, as well as the underlying warning system representing them, were randomizedacross the 16 approaches each pilot made, and the order was different for each of the 8 partici-pating pilots. The altitude (and thus distance from the runway) at which faults occurred also wasrandomized.
68 SINGER AND DEKKER

69
70

Participants
Eight professional pilots (all male, mean age 47.2 years, mean experience 15 years) participatedin this study. Each had substantial operating experience as pilot in command on complex aircraftwith flat-panel or CRT display warning systems, which were simulated in this study. All subjectpilots flew their approaches within a 2-week period.
Materials
The part-task simulator was constructed from a virtual applications prototyping system simula-tion tool based on a Silicon Graphics workstation, with a PC-based flight simulator that featuredrealistic engine and flight controls. The flight simulator was not coupled to the warning displaysimulator and therefore produced no feedback in terms of thrust or flight control anomalies.However, no recovery action was required of pilots—the emphasis in this study was on theirunderstanding and identification of failures. Pilots had dual displays: one warning display typi-cal in layout and character of those found in “glass cockpits” of airliners today and one head-upflight guidance system (HGS) display (a glass plate showing critical flight parameters) throughwhich the runway was visible. The HGS was modeled after a system that is becoming increas-ingly common on transport aircraft across the world, but none of the pilots in this study actual-ly had much prior experience with this HGS. The part-task simulator was set up in a center forvirtual reality and simulation at the participating pilot’s home base.
Tasks and Instructions
Before beginning their 16 approaches, pilots received a 30-min briefing on the aircraft, its sys-tems, the HGS, and the tasks required of them. They were allowed as many training approacheson the simulator as they felt they needed.
For the actual approaches, pilots were asked to identify the primary faults in the failure sce-nario they were confronted with as quickly as they could. As soon as they were confident theyhad identified the primary fault that was to be addressed, they were to indicate this by pressinga button. We kept track of RTs. We checked whether the pilots’ assessments were correct by pre-senting pilots with a multiple-choice question on the warning system display. This question laidout four alternative primary faults. To minimize learning over the 16 approaches, pilots were notshown whether they had made the right or the wrong assessments about the primary fault in afailure scenario. In addition, the order of failure scenarios and warning systems was randomizedacross the 8 participating pilots.
To reflect the dual nature of dynamic fault management, pilots were asked not only to examinethe failures presented and to try to understand them but also to maintain process integrity at the sametime—in this case, keeping the aircraft on a stable approach to the runway. Near the end of anapproach, this is known to be a high-gain tracking task. The simulator used in this study was cho-sen for its capability to monitor pilot performance on all the relevant parameters of the task, in thiscase air speed, sink rate, predicted touchdown point, and lateral and vertical deviations from theelectronic signals guiding the aircraft toward the runway (the instrument landing system). This sim-ulator dynamically measured pilot performance during the complete approach phase, narrowing theallowable window of deviations as the aircraft got closer to the runway. If the subject pilot exceed-ed the safe level of any of the parameters, a message (“APPROACH WARN”) was displayed and,if no corrective action were initiated after 1 sec, the approach would be considered to have failed.
WARNING SYSTEMS AND PILOT PERFORMANCE 71

Performance data from failed approaches were considered in the analysis of the results. Once theentire experiment was over, subject pilots were shown their own performance results (i.e., RTs andcorrectness in identifying the various faults), and the purpose of the experiment was explained.
RESULTS
The participant pilots all judged the part-task simulation approaches to be realistic, given theirpurpose, and commented that the workload experienced was typical of the task and circum-stances with which they usually were confronted. All participant pilots appeared motivated andtook the task to a professional level, trying to give the quickest and best response. No technicalanomalies occurred during any of the 128 approaches flown.
Figure 1 shows the mean RTs and error rates on the four different warning systems evaluated inthis study. On Warning System 3, Sort & Guide, pilots were quickest to acknowledge that they hadunderstood the failure scenario and recognized the primary fault, and indeed made no erroneousassessments of the failure scenario. Following closely in mean RT, Warning System 4—Do &Show—also produced a zero error rate. Warning System 1, Show All, led to the longest RTs andhighest error rates. Only one failed approach occurred, and it was on Warning System 1.
To evaluate whether the different warning systems produced significantly different RTs andwhat effect, if any, the kind of failure scenario had on these RTs, we conducted a two-way analy-sis of variance (with effect on RT of warning system, failure scenario, and their interaction, asthe variables). The kind of warning system had a highly significant effect on RTs, F(3, 84) =24.56, p < .0001, whereas the kind of failure scenario had a more modest but still significanteffect, F(3, 28) = 3.18, p < .04. We also found a significant interaction between the kind of fail-
72 SINGER AND DEKKER
FIGURE 1 Response times and error rates on the four warning systems tested in this study. SEC = seconds.

ure scenario with which the pilot was confronted and the kind of warning system on which thefailures were shown, F(9, 84) = 4.09, p < .0002, as shown in Figure 2.
A post hoc test, Tukey’s honestly significant difference test, revealed how performance onWarning System 1 (Show All) was significantly worse than on all others. Performance on thebest-scoring system (Warning System 3, Sort & Guide) was significantly better than perform-ance on Warning Systems 1 and 2 (Sort & Show) but not significantly better than performanceon Warning System 4 (Do & Show). This confirmed how Warning Systems 3 and 4 followed oneanother closely in fault identification times.
DISCUSSION
Figure 2 shows the mean RTs across the warning systems and failure scenarios. The engine failurescenario reveals a moderate improvement in RT as the participant pilots moved toward systems withhigher levels of guidance. This is to be expected, because engine failures are almost always a pri-mary cause of failures in other aircraft systems. This also goes for air speed failures, given the intri-cate connection between air speed data and highly automated flight control and engine systems.
The long mean RT on the Show All system in the electrical failure case could be attributed to thelong list of messages this warning system produces (all in amber), which requires longer readingtime. Indeed, message list length is obviously an artifact of the warning system. But longer readingtime should not produce higher error rates—if anything, it should produce lower error rates (thespeed–accuracy tradeoff; see Wickens, 1992). Yet the Show All system produced higher error ratesthan any other system. Thus, message list length does not really explain the performance differences
WARNING SYSTEMS AND PILOT PERFORMANCE 73
FIGURE 2 Plot of means: Two-way interaction of warning systems and failures.

observed in this study. It is significant that the only failed approach in this study occurred on theShow All system. It is possible that in this case the pilot fixed his attention on the warning displayin an attempt to understand what was in this case an electrical failure, showing a long dwell time fora display that demands a lot of cognitive work to be understood (Wickens, 1992).
The large step in the hydraulic failure case could be explained partially by the color codingin red of the primary failure, which would help the identification of the primary fault. The sameeffect of color coding could be one cause of lower RTs in the engine failure case, at least on thethree displays that use such coding, a result that confirms the importance of the role of repre-sentation in affecting human performance. More research must be done to try to isolate domi-nant warning systems and representational features that influence performance.
Overall, the results are consistent with expectations of how various warning systems would aidhumans in their dynamic fault management. Human performance gains become visible as soon asthe warning system itself manages various failures in some way before presenting them. There is anincrement in these performance gains, based on the nature of the warning system and depth to whichit supports the failure management task. Modest performance benefits are associated with a systemthat sorts the failures and shows them selectively, but some errors in identifying the primary faultstill occur. Performance benefits really accrue with a system that sorts through the failures, showsthem selectively, and guides the pilot in what to do next. In this study, pilots were quickest to iden-tify the primary fault in the failure scenario with such a system and made no errors in assessing whatit was. Similarly, a warning system that itself contains or counteracts many of the failures and showsmainly what is left to the pilot scores low RTs and zero error rates in identifying the primary fault.
Part-task simulation has been accepted as a more naturalistic extension to laboratory-basedexperimental research (Brehmer, Leplat, & Rasmussen, 1991), especially when used to createoperational environments in which actual expert practitioners can carry out meaningful domainwork. The tractability of such an experimental setting provides clear benefits in terms of controlover variance. This internal tightness is not only created, but also counterbalanced, by the aus-terity of the overall setting (only one pilot in interaction with a few systems). Such a spartanapproach carries consequences for the transportability of the results to richer circumstances, inwhich multiple crew members can interact in their responses to failures and have to juggle a larg-er set of simultaneous tasks as well. Also, the occurrence of a failure scenario on every approachhas little connection to operational reality. On the other hand, however, such failure frequency istypical of pilot recurrency or type training on simulators.
Finally, the mismatch between performance results (best performance on the Sort & Guidesystem) and interview data (pilots disliking guidance about internal failures; Mårtensson &Singer, 1998) is interesting; it reveals how hard it can be for practitioners to express clearly todesigners what may help or hinder their problem solving most. Such data can serve as a warn-ing for designers and certification authorities who rely on subjective pilot opinions as onlyhuman factors input to their system development and assessment activities.
CONCLUSION
Commercial aviation warning systems today provide message lists that represent single systemswith status statements coded in a particular color. They differ in how they contribute to manag-ing the failures. Human performance benefits become evident when warning systems support thedynamic fault management task, in which practitioners have to sort out and diagnose a cascadeof failures while maintaining process integrity at the same time. Given these demands, practi-
74 SINGER AND DEKKER
tioners benefit from seeing interconnections and hierarchies among failures, future degradations,additional failures to be expected, and plausible system reconfigurations to maintain processintegrity.
This study showed that the way in which warning systems contribute to failure managementhas consequences for human performance. For example, a system that guides the pilot in whatto do next or that shows the pilot what is still operational carries clear performance benefits.These results, however, should not be seen as justification for simply automating more of thefailure management task. Human performance difficulties associated with high automation par-ticipation in difficult or novel circumstances—such as brittle procedure following (Roth &Woods, 1989), in which operators follow heuristic cues from the automation rather than active-ly seeking and processing information related to the disturbance chain (Mosier, Skitka, Heers, &Burdick, 1997)—are well known.
Instead, these results indicate how progress can be made by changing the representational qual-ity of warning systems altogether, not just by automating more of the human task portion. If guid-ance is beneficial, and if knowing what is still operational is useful to the pilot, then the results ofthis study tell designers of warning systems to shift to another view of referents. Designers wouldhave to get away from relying on single systems and their status as referents to show on the dis-play and move toward referents that fix on higher order variables that carry more meaning relativeto the dynamic fault management task. Referents could integrate current status with future predic-tions, for example, or could cut across single parameters and individual systems to reveal structurebehind individual failures and show consequences in terms that are operationally immediatelymeaningful (e.g., loss of pressure, loss of thrust). To effectively support dynamic fault manage-ment, referents would have to convey the following (see also Johns, 1990):
• The threat a disturbance chain represents to overall system safety.• Interconnections and hierarchies among individual failures so that a problem solver can
recognize the structure of the underlying problem.• Changes and events that are happening now or in the near future so that a problem solver
can track developments or trends.• Ramifications of the current problem in terms of what is or will be left operational, so that
a problem solver can judge the consequences of the failures for overall system integrity.
Some designers will argue that such recognition and judgments are possible only on the basisof pilot expertise or, in the words of Don Norman (1993), that it is not knowledge which can beput in the world; it has to be in the head. The limitations of this approach (that training shouldabsorb design deficiencies) are severe, deep, and much commented on (e.g., FAA, 1996). In thisstudy the immediate performance benefits associated with warning systems that (a) provideguidance on what to do next and (b) show the pilot what is still operational confirm that thosekinds of referents would be useful given dynamic fault management demands.
ACKNOWLEDGMENTS
This work was supported by the Swedish Program in Aeronautical Research, Saab AB, and bya grant from the Flight Safety Department at the Swedish Civil Aviation Authority.
We are grateful to Håkan Alm for useful guidance and comments in preparing the final analysisand to the Center for Virtual Reality and Simulation in Linköping, Christiano Masi in particular.
WARNING SYSTEMS AND PILOT PERFORMANCE 75

REFERENCES
Billings, C. E. (1996). Aviation automation: The search for a human centered approach. Mahwah, NJ: LawrenceErlbaum Associates, Inc.
Billings, C. E., & Dekker, S. W. A. (1996). Advanced and novel automation concepts for the future system. In C. E.Billings, Aviation automation: The search for a human centered approach (pp. 221–231). Mahwah, NJ: LawrenceErlbaum Associates, Inc.
Brehmer, B., Leplat, J., & Rasmussen, J. (1991). Use of simulation in the study of complex decision making. In J.Rasmussen, B. Brehmer, & J. Leplat (Eds.), Distributed decision making: Cognitive models for cooperative work (pp.373–386). New York: Wiley.
Courteney, H. (1999). Human factors of automation: The regulator’s challenge. In S. W. A. Dekker & E. Hollnagel(Eds.), Coping with computers in the cockpit (pp. 109–130). Aldershot, England: Ashgate.
Federal Aviation Administration. (1996). Human factors Study Team report on the interface between flightcrews andmodern flight deck systems. Washington, DC: Author.
Hicks, M., & De Brito, G. (1998). Civil aircraft warning systems: Who’s calling the shots? Proceedings of HCI–Aero’98, the International Conference on Human–Computer Interaction in Aeronautics. Montreal, Canada.
Johns, G. L. (1990). Graphical interfaces to intelligent fault management systems: Issues and guidelines (Rep. No.MTR-90W00103). Houston, TX: National Aeronautics and Space Administration.
Klein, G. (1998). Sources of power: How people make decisions. Cambridge, MA: MIT Press.Mårtensson, L., & Singer, G. (1998). Warning systems in commercial aircraft: An analysis of existing systems (Rep. No.
TRITA-IEO-1998:01). Stockholm: Royal Institute of Technology.Mosier, K. L., Skitka, L. J., Heers, S., & Burdick, M. (1997). Automation bias: Decision making and performance in
high-tech cockpits. International Journal of Aviation Psychology, 8, 47–64.Norman, D. A. (1993). Things that make us smart. Reading, MA: Addison-Wesley.Potter, S. S., & Woods, D. D. (1991). Event driven timeline displays: Beyond message lists in human–intelligent system
interaction. IEEE, 8, 1283–1288.Roth, E. M., & Woods, D. D. (1989). Cognitive task analysis: An approach to knowledge acquisition for intelligent sys-
tem design. In G. Guida & C. Tasso (Eds.), Topics in expert system design (pp. 153–178). New York: North-Holland.Simon, H. (1969). Sciences of the artificial. Cambridge, MA: MIT Press.Wickens, C. D. (1992). Engineering psychology and human performance. New York: HarperCollins.Woods, D. D. (1994). Cognitive demands and activities in dynamic fault management: Abduction and disturbance man-
agement. In N. Stanton (Ed.), Human factors of alarm design (pp. 88–107). London: Taylor & Francis.Woods, D. D. (1995). Towards a theoretical base for representation design in the computer medium: Ecological percep-
tion and aiding human cognition. In J. Flack, P. Hancock, J. Caird, & K. Vincente (Eds.), Global perspectives on theecology of human–machine systems (pp. 106–128). Mahwah, NJ: Lawrence Erlbaum Associates, Inc.
76 SINGER AND DEKKER