pilot power management in wcdma networks: coverage control
TRANSCRIPT
Pilot Power Management in WCDMA Networks:Coverage Control With Respect to Traffic Distribution
Iana SiominaDepartment of Science and Technology
Linkoping UniversitySE-601 74, Norrkoping, Sweden
Di YuanDepartment of Science and Technology
Linkoping UniversitySE-601 74, Norrkoping, Sweden
ABSTRACTIn WCDMA networks, Common Pilot Channel (CPICH)signals are used by mobile terminals for channel quality es-timation, cell selection, and handover. The strength of theCPICH signal determines the coverage area of the cell, im-pacts the network capacity, and thereby the quality of ser-vice, and is therefore a crucial parameter in network plan-ning and optimization. Pilot power is the most importantparameter that allows to control the strength of the CPICHsignal. The more power is spent for pilot signals, the bet-ter coverage is obtained. On the other hand, a higher valueof the pilot power level in a cell means higher pilot pollu-tion in the network and less power available to serve usertraffic in the cell. In this paper, we consider the problemof minimizing the total amount of pilot power subject toa coverage constraint. We present a basic model for pilotpower optimization subject to a full coverage constraint aswell as its extended version which allows us to study variouscoverage levels and to consider user traffic distribution overthe network. We also propose an efficient algorithm thatgives near-optimal solutions to the problem. We report ournumerical experiments for a WCDMA network based on aplanning scenario for the city of Berlin.
Categories and Subject DescriptorsI.6 [Simulation and Modeling]: Model Development
General TermsAlgorithms
KeywordsWCDMA, network planning, CPICH, pilot power, coverage,traffic
Permission to make digital or hard copies of all or part of this work forpersonal or classroom use is granted without fee provided that copies arenot made or distributed for profit or commercial advantage and that copiesbear this notice and the full citation on the first page. To copy otherwise, torepublish, to post on servers or to redistribute to lists, requires prior specificpermission and/or a fee.MSWiM’04, October 4-6, 2004, Venezia, Italy.Copyright 2004 ACM 1-58113-953-5/04/0010 ...$5.00.
1. INTRODUCTIONCommon Pilot Channel (CPICH) is a fixed rate (30 kbps,
spreading factor 256) downlink physical channel that carriesa pre-defined bit/symbol sequence [1]. Normally, one cell hasonly one CPICH (Primary CPICH, or P-CPICH). In somecases, a cell may have several additional CPICH that arecalled secondary CPICH (S-CPICH). The cell may have aS-CPICH, for example, when this cell contains narrow beamantenna for serving a dedicated hot-spot area, i.e., the areawith a high traffic density level. In this case, a dedicatedarea uses the S-CPICH, whereas the P-CPICH broadcaststhe pilot signal over the entire cell.If a mobile terminal is unable to clearly receive one dom-
inant CPICH, due to interference or coverage problems, theresult is likely to be dropped calls, failed initiations, poorvoice quality and/or poor data throughput. The quality ofthe CPICH can be measured in terms of Ec/I0, which is arepresentation of the signal to interference-plus-noise ratiofor spread spectrum signals. The mobile terminals scan forthe CPICH signals continuously and measure the Ec/I0 ratioof all pilot signals they can detect. In order to keep a mobilereferenced to a cell, the Ec/I0 ratio at the mobile terminalmust exceed a minimum threshold at all times. (For UMTS,a typical threshold value is between -16 and -20 dB.)Increasing or decreasing the pilot power makes the cell
larger or smaller allowing us to control cell coverage. Sincecells have to be planned such that the estimated trafficdoes not exceed the cell capacity, the acceptable cell sizesstrongly depend on the current load and interference situa-tion. Thus, involving a trade-off between power consump-tion and coverage, pilot power management allows control-ling cell loads and improving network capacity. Another goalof pilot power management is to reduce pilot pollution andinterference in the network. Previous work of analyzing theeffect of pilot power on network performance can be foundin, for example, [6, 8, 11, 12]. Among these, the authorsof [8] show that a rule-based optimization technique for set-ting pilot power levels significantly outperforms a manually-designed solution in terms of network cost.In this paper, we study the problem of providing a certain
coverage level using a minimum amount of pilot power. Ina real-life situation, this kind of problem is to be solvedduring the planning phase of the WCDMA network as wellas during its maintenance. In the second case, pilot poweroptimization is referred to one of the mid-term tasks solvedby network operators aiming to improve network capacity.Our solution approach to the pilot power optimization
276
problem consists of mathematical programming techniques.We present a basic model for pilot power optimization sub-ject to a full coverage constraint as well as its extended ver-sion which allows us to study various coverage levels andto consider user traffic distribution over the network. Tosolve the problem, we propose an efficient algorithm basedon Lagrangian relaxation with an embedded primal heuris-tic. Even for large-scale networks, the algorithm finds near-optimal solutions of high quality with a reasonable amountof computing effort. We report our numerical experimentsfor a WCDMA network based on a planning scenario for thecity of Berlin.
2. SYSTEM MODELLING
2.1 Planning ParametersLet us consider a WCDMA network with m cells, and let
I denote the set of cells, i.e., I = {1, . . . , m}. The servicearea is represented by a grid of bins with a certain resolution,assuming the same signal propagation conditions across ev-ery bin. The total number of bins is denoted by n, and theset of bins is denoted by J = {1, . . . , n}.Let P T
i be the total transmission power available in cell i,and yi be the amount of power allocated to the pilot signalin this cell1. Thus, the amount of the power left for otherpurposes in the cell is P T
i − yi. A higher value of yi meanslarger coverage area for cell i, but, on the other hand, lesspower available to serve user traffic of cell i.We use gij (0 < gij < 1) to denote the power gain between
the base station of cell i and bin j. Thus, gijyi is the powerof the received pilot signal from cell i in bin j. In additionto the pilot signal, bin j also receives interfering signals,including the signals for user traffic from cell i, and signalsfrom some other base stations. The total interference canbe written as
Iij = (1− αj)Pigij +∑
k∈I:k �=i
Pkgkj + νj , (1)
where Pi (Pi ≤ P Ti ) is the power used both for the pilot
signal and the user traffic in cell i, αj ∈ (0, 1) is the orthog-onality factor in bin j to signals from cell i, and νj is theeffect of the thermal noise in bin j.We consider network scenarios with a high traffic load.
In particular, we assume that all base stations operate atfull power, which represents the worst-case interference sce-nario. Under this assumption, Pi = P T
i , ∀i ∈ I, and the in-terference in bin j with respect to cell i reads
Iij = (1− αj)PTi gij +
∑k∈I:k �=i
P Tk gkj + νj . (2)
We assume that pilot signal from cell i can be detected inbin j if and only if its Ec/I0 ratio is above a threshold γ0,that is, if
γij =gijyi
Iij=
gijyi
(1− αj)P Ti gij +
∑k∈I:k �=i
P Tk gkj + νj
≥ γ0.
(3)
1Linear scale is considered for all parameters and variablesin this paper.
Using (3), it can be derived that, if cell i covers bin j,then the pilot power yi must be at least Pij , defined as
Pij =γ0
gij·(1− αj)P
Ti gij +
∑k∈I:k �=i
P Tk gkj + νj
. (4)
Increasing the pilot power yields better coverage. How-ever, this is at a cost of less power available for user traffic.Our optimization problem is motivated by this trade-off –to ensure a certain coverage level using a minimum amountof pilot power.In this paper, we distinguish between service area coverage
level and traffic coverage level. The former is the proportionof bins for which (3) holds. The traffic coverage level is theratio between the sum of the amount of traffic demand ofbins where (3) holds, and the total traffic demand of theentire service area. To be able to estimate traffic coveragein the network, we introduce a new parameter, traffic de-mand. One possible interpretation of this parameter is theaverage number of active users in a bin asking for a specificservice. We use dj to denote the traffic demand in bin j,and D to denote the total traffic demand over the network(D =
∑j∈J dj). In a real network, user traffic demand has
a dynamic characteristic, and is non-uniformly distributedover the network. In static and short-term dynamic simula-tions, traffic demand can be modelled by a snapshot.In many network planning scenarios, it is required that
the pilot power level does not exceed some upper limit. Weuse Πmax
i to denote this limit for cell i, and assume thatΠmax
i ≤ P Ti . In some cases, pilot power can be also bounded
from below in order to control the difference in pilot powerlevels in adjacent cells and improve the performance of softhandover [3]. Let Πmin
i denote this lower limit and assumethat Πmin
i ≥ 0. The lower and the upper pilot power lim-its requirement can be either introduced in the model as anadditional constraint, or can be handled in the preprocess-ing step. The latter means that Pij values that are belowΠmin
i are set to this minimum value, whereas Pij values thatexceed the upper limit Πmax
i are excluded from the list ofpossible pilot power settings.
2.2 A Full Coverage ModelWe consider a pilot power optimization problem with the
requirement of full coverage, i.e., when each bin j must becovered by at least one cell. In this case, both traffic cov-erage level and service area coverage level are equal to theirmaximum value (i.e., 1.0). Thus, we do not consider trafficdistribution in this section.We use the following two types of variables in the model.
yi = The pilot power of cell i, (5)
xij =
{1 if cell i covers bin j, i.e., γij ≥ γ0,0 otherwise.
(6)
The problem formulation for the case of full coverage is pre-
277
sented below.
[M1] P ∗ = min∑i∈I
yi (7)
s.t.∑i∈I
xij ≥ 1, ∀j ∈ J (8)
Pijxij ≤ yi, ∀i ∈ I, ∀j ∈ J (9)
Πmini ≤ yi ≤ Πmax
i , ∀i ∈ I (10)
xij ∈ {0, 1}, ∀i ∈ I, ∀j ∈ J (11)
yi ∈ �+, ∀i ∈ I (12)
In M1, constraints (8) ensure full coverage. By constraints(9), pilot power level of cell i is greater than or equal tothe maximum Pij value among its bins. Constraints (10)ensure that pilot power level for each cell i is within a giveninterval.In the next section, we present a more sophisticated and
generalized model that allows various levels of the cover-age requirement and considers traffic distribution over thenetwork.
2.3 A Generalized Model for Various Cover-age Levels With Respect to Traffic Distri-bution
Full coverage2 of the service area is a desired networkproperty, but in real-life networks providing a full CPICHcoverage is usually very expensive both from economic andresource consumption point of view. A slight decrease in thecoverage level enables considerable reductions in the pilotpower and network resource utilization in general3. Thus,in practice, a guaranteed coverage level of 95-98% would besufficient for any WCDMA network.To be able to examine the impact of coverage level on the
total pilot power consumption, we modify the right-handside of the coverage constraints (8) in the following way,
∑i∈I
xij ≥ zj , ∀j ∈ J , (13)
where {zj} is a set of binary variables defined as follows,
zj =
{1 if bin j is to be covered by at least one cell,0 otherwise.
Let β ∈ (0, 1] denote the required level of traffic coverage(β = 1.0 corresponds to the case of full coverage). Then,to introduce the coverage requirement into the model, thefollowing constraint has to be added,
∑j∈J
djzj ≥ βD. (14)
We observe that in the case of uniform traffic distributionthe traffic coverage requirement, (14), becomes equivalentto the service coverage requirement, i.e., to the constraint
∑j∈J
zj ≥ βn. (15)
2By full coverage we mean 100% coverage of the service area.3In system management, this phenomenon is known asPareto’s Principle or the 80/20 Rule, which says that 20%of efforts always are responsible for 80% of the results.
We denote the final formulation of the generalized modelby M2. The formulation has the same objective as M1 andcontains the constraints (9), (10), (13), and (14). In net-works with uniform traffic distribution, constraints (14) canbe substituted by (15). We also observe that M1 is a spe-cial case of M2 when β = 1.0, therefore we consider M2 as ageneralized model for our pilot power optimization problem.M2 is a quite straightforward linear-integer formulation
for the pilot power optimization problem, but from a com-putational point of view, however, this formulation is notefficient. In particular, its linear programming (LP) relax-ation is very weak (i.e., the LP-optimum is often far awayfrom the integer optimum). Even for small networks, solvingM2 to optimality is out of reach of a standard branch-and-bound solution technique. In our numerical experiments, astate-of-the-art integer programming solver [4] did not man-age to find optimal or near-optimal solutions within anyreasonable amount of time. In Section 4.1, we propose anenhancement to M2 that substantially improves the qualityof the LP-relaxation and allows us to solve the problem evenfor large networks.
3. AD HOC SOLUTION FOR THE CASE OFUNIFORM PILOT POWER
In the case of uniform pilot power, the pilot power is setto be the same for all cells. Uniform pilot power is a possi-ble solution to our pilot power optimization problem. Thissolution can be computed analytically.We use yU to denote the pilot power level used by all
cells in the solution of uniform pilot power. A necessarycondition for covering bin j is that yU is at least as big asthe minimum of Pij among all cells, i.e., yU ≥ P j , whereP j = mini∈I Pij . Let Dj denote the total amount of trafficdemand in the network from the covered bins if the uniformpilot power level is equal to P j , i.e., Dj =
∑l∈J :P l≤P j dl.
To guarantee a certain level of traffic coverage, the totaltraffic demand from all the covered bins has to be at leastβD, i.e., if yU = P j∗ , then Dj∗ ≥ βD must hold.A straightforward approach is to sort the bins in ascend-
ing order with respect to P j . The first element in the sortedsequence, for which the corresponding value of Dj is notless than βD, yields the minimum uniform pilot power thatsatisfies the coverage requirement. Mathematically, the an-alytical solution can be presented as follows,
yU = minj∈J :Dj≥βD
P j . (16)
The uniform pilot power approach is efficient in simple prop-agation scenarios, where the signal attenuation is essentiallydetermined by distance. In such scenarios, if fairly uniformlydistributed traffic and equally-spread base stations are as-sumed, the sizes of the cells will be roughly the same. How-ever, in an in-homogenous planning situation (e.g., a mix ofrural and downtown areas), a uniform level of pilot power isnot an efficient solution from the power consumption pointof view. There is therefore a need of mechanisms that candetermine the optimal levels of the pilot power. In this sec-tion, we derived analytically the solution of uniform pilotpower. In the next section, we present the algorithm thatallows us to find a near-optimal solution for the general case.
278
4. SOLUTION APPROACH
4.1 An Enhanced FormulationAs was mentioned in Section 2.3, the formulation of the
generalized model, M2, is straightforward, but from a com-putational point of view it is inefficient. To avoid the weak-ness of M2, we derive an enhanced formulation to the prob-lem.First of all, to simplify the formulation, we remove con-
straints (10), i.e., the pilot power limits constraints, from theformulation M2. Instead, as explained in Section 2.1, weset the lower pilot power limits in the preprocessing step.To consider the upper limits, for each bin j, we define aset I(j) ⊆ I which contains all the cells that may coverbin j with a feasible pilot power level, i.e., I(j) = {i ∈ I:Pij ≤ Πmax
i }.We utilize the fact that, in an optimal solution, the pilot
power of any cell will attain a value that belongs to a discreteset. In particular, in an optimal solution to M2, yi = Pij forsome bin j. This is because unless additional bins can becovered, further increase of yi will make the solution non-optimal.We introduce the following notation. For cell i, we sort Pij
in ascending order, and use a sequence bi1, b
i2, . . . , b
il−1, b
il, . . .
to denote the sorted indices of bins. Thus, we obtain thesequence Pibi
1≤ Pibi
2≤ . . . ≤ Pibi
l−1≤ Pibi
l≤ . . ., where bi
l is
the bin at position l in the sorted sequence for cell i. Weuse Bi to denote the total number of bins in the sortedsequence for cell i. (Usually Bi is much less than n, becausethe bins, for which the required pilot power exceed Πmax
i ,can be ignored.) Moreover, we consider the sorted sequenceof power levels for cell i in the following incremental fashion:
P Iibi
1= Pibi
1,
P Iibi
2= Pibi
2− Pibi
1,
. . .
P Iibi
l= Pibi
l− Pibi
l−1,
. . .
P Iibi
Bi
= PibiBi
− PibiBi−1
.
For any l ∈ {2, . . . , Bi}, the value of P Iibi
lis the additional
power needed for cell i to cover bin bil, provided that cell
i already covers bin bil−1. The pilot power of cell i thus
equals∑Bi
l=1 P Iibi
lxibi
l. The total amount of pilot power can
therefore be expressed as∑
i∈I∑Bi
l=1 P Iibi
lxibi
l.
With the above notation, the model discussed in Section 2.3can be reformulated as follows.
[M3] P ∗ = min∑i∈I
Bi∑l=1
P Iibi
lxibi
l(17)
s.t.∑j∈J
djzj ≥ βD (18)
∑i∈I(j)
xij ≥ zj , ∀j ∈ J (19)
xibil−1
≤ xibil, ∀i ∈ I, ∀l ∈ {2, . . . , Bi}(20)
xij ∈ {0, 1}, ∀j ∈ J , ∀i ∈ I(j) (21)
zj ∈ {0, 1}, ∀j ∈ J (22)
The enhanced formulation, M3, is much more efficientthan M2 in terms of the solution quality of the LP-relaxation.It can be proved that the LP-relaxation of M3 is at least asstrong as that of M2.
4.2 Algorithm OverviewThe algorithm is based on Lagrangian relaxation and has
two main parts, one of which is aimed to solve a relaxedproblem. In the second part, we adjust the current solutionof the relaxed problem to a feasible solution that satisfiesall the constraints of the enhanced model, M3. The firstpart, which gives us a lower bound, is to be solved itera-tively, within a chosen number of steps, independently onthe second part, using a standard subgradient method. Thesecond part implies the performing of the adjusting proce-dure in each iteration step and at the end it provides thebest feasible solution found. We use three stopping criteriafor the subgradient solver: maximum number of steps (500steps), dual gap less than 1%, and maximum number of con-secutive steps during which the lower bound has not beenimproved (50 steps).The iterative procedure consists of the following steps:
1. Construct the relaxed problem. See Section 4.3 formore details.
2. Solve m + 1 subproblems. For a given set of Lagrangemultipliers, we solve one knapsack problem for thez-variables, and m Lagrangian subproblems (one foreach cell) to find a coverage map in terms of the x-variables.
3. Find the lower bound. Calculate the Lagrangian func-tion.
4. Find a feasible solution. Adjust the solution of therelaxed problem to a feasible one. See Section 4.4 formore details.
5. Save the best feasible solution. Compare the best fea-sible solution found up till now to the current solutionobtained in step (4) and choose the solution with theminimum value of objective function, i.e., the mini-mum amount of total pilot power.
6. Check stopping criteria. The stopping criteria are max-imum number of steps, dual gap, and maximum num-ber of consecutive steps during which the lower boundhas not been improved. If one of these criteria is sat-isfied then go to step (9).
7. Update Lagrangian multipliers
8. Repeat steps (2)-(8).
9. Save result.
4.3 Lagrangian RelaxationA Lagrangian relaxation that exploits the structure of the
problem is the core of the algorithm presented in Section 4.2.We relax the coverage constraints (19) using Lagrange mul-tipliers, {λj}, j = 1, . . . , n, and construct the following re-laxed model.
279

[R1] min∑i∈I
Bi∑l=1
(P Iibi
l− λbi
l)xibi
l+
∑j∈J
λjzj (23)
s.t.∑j∈J
djzj ≥ βD (24)
xibil−1
≤ xibil, ∀i ∈ I, ∀l ∈ {1, . . . , Bi} (25)
xij ∈ {0, 1}, ∀j ∈ J , ∀i ∈ I(j) (26)
zj ∈ {0, 1}, ∀j ∈ J (27)
We decompose the problem R1 into m + 1 independentsubproblems. For each cell i, we can solve the problem whichminimizes
∑Bil=1 (P
Iibi
l− λbi
l)xibi
lsubject to the correspond-
ing constraints from (25).A simple way to solve the ith subproblem is to find, for
every cell i, arg minK=1,...,Bi
{ K∑l=1
(P Iibi
l− λbi
l)}, and then assign
0’s and 1’s to the x-variables to realize the minimum.To find the optimal values of the z-variables, we solve
a problem that minimizes∑
j∈J λjzj subject to constraint
(24). Applying a simple substitution zj = 1− zj , this prob-lem is easily transformed to a standard 0-1 maximum knap-sack problem which can be solved using a standard dynamicprogramming algorithm.Solving m subproblems gives the optimal coverage map
which, however, does not necessarily satisfies the traffic cov-erage requirement given by constraints (24). Therefore, tofind a feasible solution, we apply a heuristic procedure dis-cussed in Section 4.4.
4.4 A Heuristic ProcedureOur primal heuristic procedure consists of the following
two phases:
• Increase the coverage area of cells unless the coverageconstraint is satisfied;
• Reduce the number of over-covered bins, i.e., bins forwhich the left-hand side of (19) is strictly greater thanzj .
If there are several cells that may cover an uncovered binin the first phase, we choose the cell with the least additionalpower needed to cover this bin. Note also that covering anuncovered bin also implies that all the bins for which thepilot power is less than or equal to what is needed to coverthis bin, will also become covered.In the second phase, we use the fact that if bin j is covered
by several cells, and among them there is a cell, say cell i,for which all other bins than j and covered by cell i demanda less pilot power than Pij , then we can reduce the pilotpower level in cell i by P I
ij .The second phase follows right after the first one, but in
order to improve the result the second phase may be appliedtwice, i.e., before and after the first phase.
5. A CASE STUDYIn this section, we investigate the impact of coverage level
on the total pilot consumption and present computationalresults obtained for a test network originating from a plan-ning scenario for the city of Berlin. The planning scenario
was provided by the Momentum project group [5]. The testnetwork has the following characteristics: 50 sites, 148 cells,and 22500 bins. The total service area is 7500 x 7500 m2.The bin size is 50 x 50 m2.In our computational experiments we consider the en-
hanced formulation of the problem derived in Section 4.1.The model parameters are set to the following values:
• Ec/I0 target γ0 = 0.01;
• maximum power P Ti = 20 W for all cells;
• upper pilot power limit Πmaxi = 2.5 W for all cells;
• lower pilot power limit Πmini = 0 W for all cells, i.e.,
we do not limit the pilot power levels from below;
• thermal noise νj = 1.5488 · 10−14 for all bins;
• the orthogonality factor αj ∈ {0.327, 0.633, 0.938} de-pends on the channel model in bin j (typically urban,mixed, or rural area).
The traffic demand is given as a static load grid thatcontains the expected average number of users in each binat one instance in time [2]. In our numerical experiments,we considered traffic demand for speech-telephony service.Figure 1 shows the distribution of traffic demand over thenetwork for this specific service for the Berlin city.
4.593 4.594 4.595 4.596 4.597 4.598 4.599 4.6
x 106
5.818
5.819
5.82
5.821
5.822
5.823
5.824
5.825x 10
6
X, [m]
Y, [
m]
0
0.05
0.1
0.15
0.2
0.25
0.3
0.35
0.4
Figure 1: Traffic demand for speech-telephony ser-vice for the city of Berlin.
The power gains, gij , are the predicted values for a spe-cific network configuration [2]. These values are given viapropagation grids for each cell i and include path loss andshadowing (or slow fading) components. The shadowing wasmodelled statistically as a zero-mean log-normal distributionwith a standard deviation of 8 dB [10].We examine the results obtained by the relaxation-based
algorithm discussed in Section 4 and compare to those ob-tained for the uniform pilot power case discussed in Section 3.All computational experiments have been conducted on aPentium 4-M laptop with a 1.8 GHz CPU and 512 MB RAM.For the tested network, the computational time for the re-laxation-based algorithm is 3-6 minutes, depending on cov-erage level requirement. The range of computing time is a
280
reasonable amount of time for such a big network. More-over, a state-of-the-art integer programming solver [4] didnot manage to find optimal (or any near-optimal) solutionfor the same test network because of lack of memory.Table 1 and Table 2 present two sets of solutions ob-
tained for various coverage levels: solutions obtained bythe relaxation-based algorithm and analytical solutions foruniform pilot power. For each of these two solutions, weshow the total power consumption and the average powerper cell. We note that solutions obtained by the relaxation-based algorithm significantly outperform those of uniformpilot power, especially for higher levels of traffic coverage. InTable 1 we also present the lower bounds obtained from theLagrangian relaxation as well as the relative gaps betweenthe best feasible solutions found and their lower bounds. Weobserve that the solution for the full coverage case has thesmallest gap, 5.71%. The gap slightly increases when thetraffic coverage level decreases, but the quality of all pre-sented solutions is high enough from the network planningpoint of view.
Table 1: Numerical solutions for various coveragelevels.
Traffic coverage Pilot power, [W] Lower Gap,level β Total Av. per cell bound [%]1.00 114.40 0.7730 108.22 5.710.99 99.94 0.6753 93.07 7.380.98 94.61 0.6392 86.93 8.830.97 89.01 0.6014 82.54 7.840.96 86.21 0.5825 78.91 9.250.95 83.44 0.5638 75.78 10.110.94 80.98 0.5472 72.97 10.980.92 75.48 0.5100 67.49 11.840.90 71.77 0.4849 63.79 12.51
Table 2: Ad hoc solutions for uniform pilot powerfor various coverage levels.
Traffic coverage Pilot power, [W]level β Total Average per cell1.00 356.44 2.40840.99 184.73 1.24820.98 160.48 1.08430.97 144.83 0.97860.96 133.72 0.90350.95 125.33 0.84680.94 118.59 0.80130.92 107.68 0.72760.90 98.97 0.6687
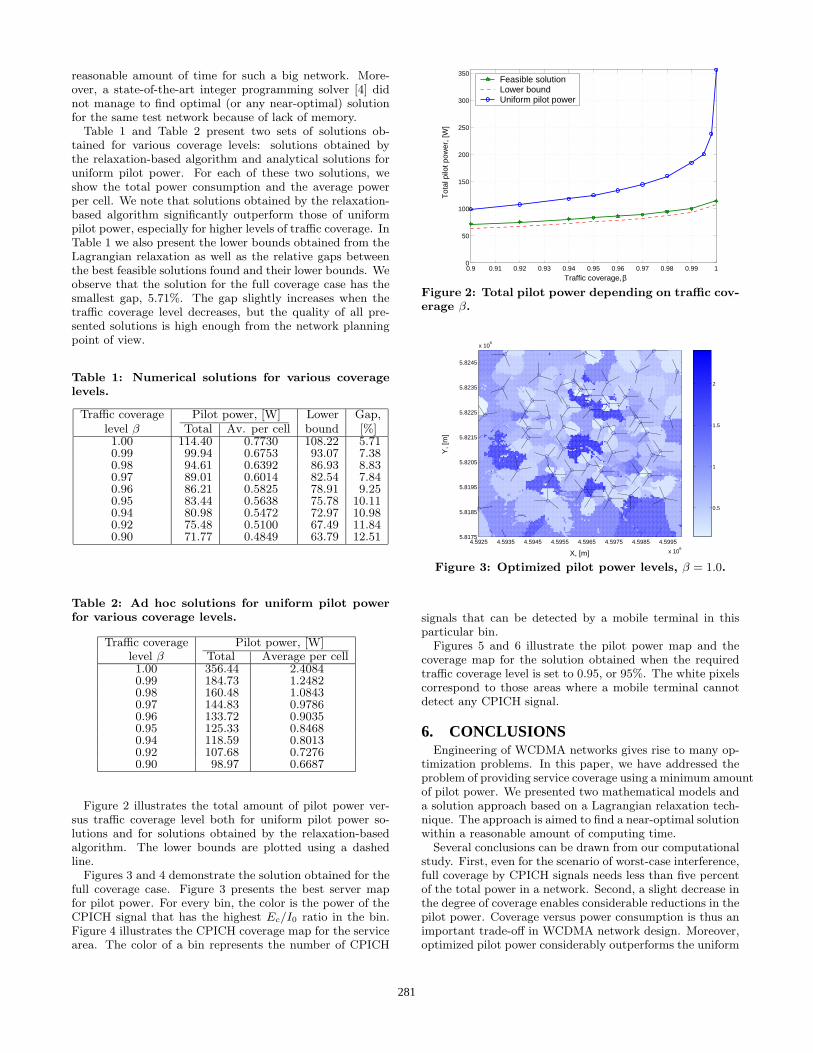
Figure 2 illustrates the total amount of pilot power ver-sus traffic coverage level both for uniform pilot power so-lutions and for solutions obtained by the relaxation-basedalgorithm. The lower bounds are plotted using a dashedline.Figures 3 and 4 demonstrate the solution obtained for the
full coverage case. Figure 3 presents the best server mapfor pilot power. For every bin, the color is the power of theCPICH signal that has the highest Ec/I0 ratio in the bin.Figure 4 illustrates the CPICH coverage map for the servicearea. The color of a bin represents the number of CPICH
0.9 0.91 0.92 0.93 0.94 0.95 0.96 0.97 0.98 0.99 10
50
100
150
200
250
300
350
Traffic coverage, β
Tot
al p
ilot p
ower
, [W
]
Feasible solutionLower boundUniform pilot power
Figure 2: Total pilot power depending on traffic cov-erage β.
4.5925 4.5935 4.5945 4.5955 4.5965 4.5975 4.5985 4.5995
x 106
5.8175
5.8185
5.8195
5.8205
5.8215
5.8225
5.8235
5.8245
x 106
X, [m]
Y, [
m]
0.5
1
1.5
2
Figure 3: Optimized pilot power levels, β = 1.0.
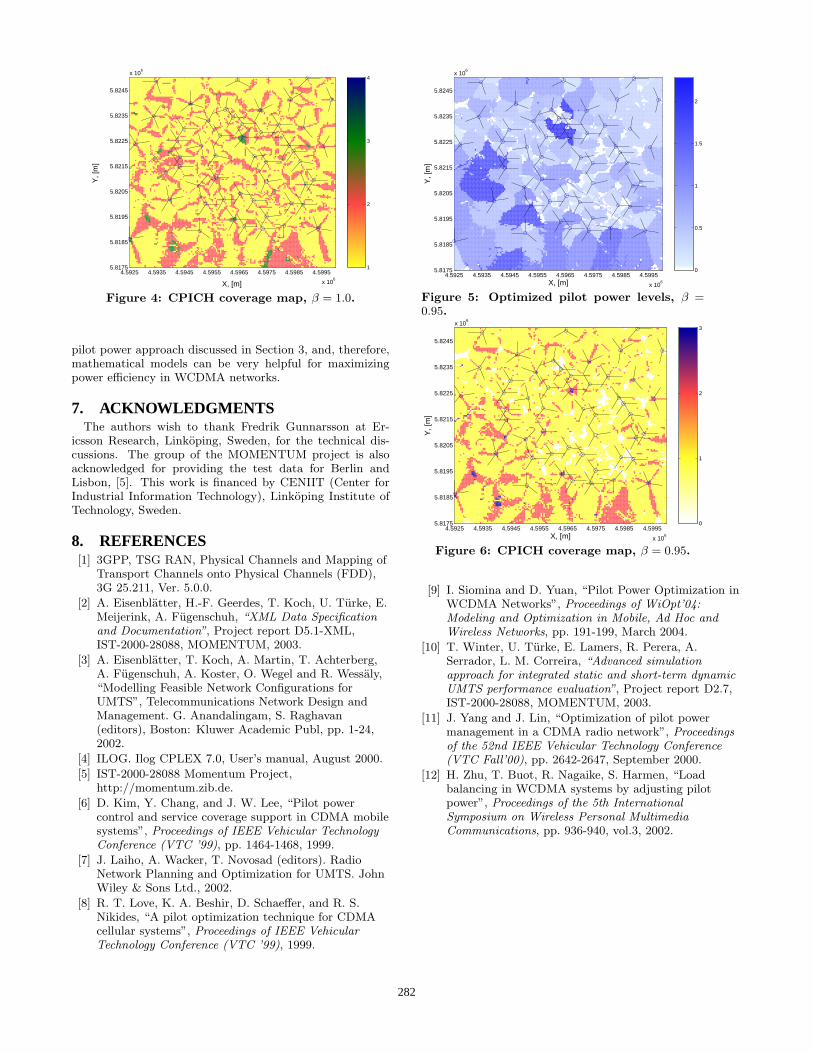
signals that can be detected by a mobile terminal in thisparticular bin.Figures 5 and 6 illustrate the pilot power map and the
coverage map for the solution obtained when the requiredtraffic coverage level is set to 0.95, or 95%. The white pixelscorrespond to those areas where a mobile terminal cannotdetect any CPICH signal.
6. CONCLUSIONSEngineering of WCDMA networks gives rise to many op-
timization problems. In this paper, we have addressed theproblem of providing service coverage using a minimum amountof pilot power. We presented two mathematical models anda solution approach based on a Lagrangian relaxation tech-nique. The approach is aimed to find a near-optimal solutionwithin a reasonable amount of computing time.Several conclusions can be drawn from our computational
study. First, even for the scenario of worst-case interference,full coverage by CPICH signals needs less than five percentof the total power in a network. Second, a slight decrease inthe degree of coverage enables considerable reductions in thepilot power. Coverage versus power consumption is thus animportant trade-off in WCDMA network design. Moreover,optimized pilot power considerably outperforms the uniform
281
4.5925 4.5935 4.5945 4.5955 4.5965 4.5975 4.5985 4.5995
x 106
5.8175
5.8185
5.8195
5.8205
5.8215
5.8225
5.8235
5.8245
x 106
X, [m]
Y, [
m]
1
2
3
4
Figure 4: CPICH coverage map, β = 1.0.
pilot power approach discussed in Section 3, and, therefore,mathematical models can be very helpful for maximizingpower efficiency in WCDMA networks.
7. ACKNOWLEDGMENTSThe authors wish to thank Fredrik Gunnarsson at Er-
icsson Research, Linkoping, Sweden, for the technical dis-cussions. The group of the MOMENTUM project is alsoacknowledged for providing the test data for Berlin andLisbon, [5]. This work is financed by CENIIT (Center forIndustrial Information Technology), Linkoping Institute ofTechnology, Sweden.
8. REFERENCES[1] 3GPP, TSG RAN, Physical Channels and Mapping of
Transport Channels onto Physical Channels (FDD),3G 25.211, Ver. 5.0.0.
[2] A. Eisenblatter, H.-F. Geerdes, T. Koch, U. Turke, E.Meijerink, A. Fugenschuh, “XML Data Specificationand Documentation”, Project report D5.1-XML,IST-2000-28088, MOMENTUM, 2003.
[3] A. Eisenblatter, T. Koch, A. Martin, T. Achterberg,A. Fugenschuh, A. Koster, O. Wegel and R. Wessaly,“Modelling Feasible Network Configurations forUMTS”, Telecommunications Network Design andManagement. G. Anandalingam, S. Raghavan(editors), Boston: Kluwer Academic Publ, pp. 1-24,2002.
[4] ILOG. Ilog CPLEX 7.0, User’s manual, August 2000.
[5] IST-2000-28088 Momentum Project,http://momentum.zib.de.
[6] D. Kim, Y. Chang, and J. W. Lee, “Pilot powercontrol and service coverage support in CDMA mobilesystems”, Proceedings of IEEE Vehicular TechnologyConference (VTC ’99), pp. 1464-1468, 1999.
[7] J. Laiho, A. Wacker, T. Novosad (editors). RadioNetwork Planning and Optimization for UMTS. JohnWiley & Sons Ltd., 2002.
[8] R. T. Love, K. A. Beshir, D. Schaeffer, and R. S.Nikides, “A pilot optimization technique for CDMAcellular systems”, Proceedings of IEEE VehicularTechnology Conference (VTC ’99), 1999.
4.5925 4.5935 4.5945 4.5955 4.5965 4.5975 4.5985 4.5995
x 106
5.8175
5.8185
5.8195
5.8205
5.8215
5.8225
5.8235
5.8245
x 106
X, [m]
Y, [
m]
0
0.5
1
1.5
2
Figure 5: Optimized pilot power levels, β =0.95.
4.5925 4.5935 4.5945 4.5955 4.5965 4.5975 4.5985 4.5995
x 106
5.8175
5.8185
5.8195
5.8205
5.8215
5.8225
5.8235
5.8245
x 106
X, [m]
Y, [
m]
0
1
2
3
Figure 6: CPICH coverage map, β = 0.95.
[9] I. Siomina and D. Yuan, “Pilot Power Optimization inWCDMA Networks”, Proceedings of WiOpt’04:Modeling and Optimization in Mobile, Ad Hoc andWireless Networks, pp. 191-199, March 2004.
[10] T. Winter, U. Turke, E. Lamers, R. Perera, A.Serrador, L. M. Correira, “Advanced simulationapproach for integrated static and short-term dynamicUMTS performance evaluation”, Project report D2.7,IST-2000-28088, MOMENTUM, 2003.
[11] J. Yang and J. Lin, “Optimization of pilot powermanagement in a CDMA radio network”, Proceedingsof the 52nd IEEE Vehicular Technology Conference(VTC Fall’00), pp. 2642-2647, September 2000.
[12] H. Zhu, T. Buot, R. Nagaike, S. Harmen, “Loadbalancing in WCDMA systems by adjusting pilotpower”, Proceedings of the 5th InternationalSymposium on Wireless Personal MultimediaCommunications, pp. 936-940, vol.3, 2002.
282