pilot software manual - network analysis community · mini ... figure 23 mult-line strip chart with...
TRANSCRIPT

WiFi Pilot Page 1
WiFi Pilot
User’s Manual

WiFi Pilot Page 2
PUBLISHED BY CACE Technologies, Inc. 1949 5th Street, Suite 103 Davis, CA 95616
Copyright © 2009 CACE Technologies, Inc.
All rights reserved. No part of the contents of this manuscript may be reproduced or transmitted in any form or by any means without the written permission of the publisher.
Wireshark and the Wireshark icon are registered trademarks of Wireshark Foundation, Inc.
Microsoft Word, DOS, Windows XP, Microsoft Excel, Microsoft Wordpad, and Windows Vista are registered trademarks of Microsoft, Inc.
Acrobat Reader is a registered trademark of Adobe Systems, Inc.
The example companies, organizations, products, domain names, e-mail addresses, logos, people, places, and events depicted herein with the exception of those aforementioned, are fictitious.
WiFi Pilot User’s Manual Document Revision: 2.0 Document Date: July, 2009
http://www.cacetech.com

WiFi Pilot Page 3
Contents
1. Overview ........................................................................................................................................ 14 What is WiFi Pilot? ..................................................................................................................................... 14
Exclusive Support for AirPcap Adapters ............................................................................................. 14 Wireshark Integration ........................................................................................................................ 14 Interactive Views and Charts .............................................................................................................. 14 Drill-Down........................................................................................................................................... 15 Time Control ....................................................................................................................................... 15 Watches .............................................................................................................................................. 15 Extensive Wireless Views ................................................................................................................... 15 Flexible Report Generation ................................................................................................................ 15
Hardware and Software Requirements for WiFi Pilot................................................................................ 16 Purpose and Layout of this Manual ........................................................................................................... 16
2. Graphical User Interface ................................................................................................................. 17 Graphical User Interface Components ....................................................................................................... 17 Ribbon Panel .............................................................................................................................................. 17 Sources Panel ............................................................................................................................................. 18 Views Library .............................................................................................................................................. 18 Main Workspace ........................................................................................................................................ 19
Menu Button ...................................................................................................................................... 19 Status Bar ........................................................................................................................................... 20
3. Home Ribbon ................................................................................................................................. 20 Trace Files ................................................................................................................................................... 21
Add Trace File ..................................................................................................................................... 21 Add Folder .......................................................................................................................................... 21 Clear List ............................................................................................................................................. 21
Export ......................................................................................................................................................... 21 Wireshark ........................................................................................................................................... 21 File ...................................................................................................................................................... 21
Settings ....................................................................................................................................................... 22 Channel Selector ................................................................................................................................ 22 Wireless Decryption Key Manager ..................................................................................................... 22 Name Resolution ................................................................................................................................ 22 Sub Net Mask (Disabled in WiFi Pilot) ................................................................................................ 23
General ....................................................................................................................................................... 23 Search ................................................................................................................................................. 23 Update Sources .................................................................................................................................. 23 Close All Tabs ...................................................................................................................................... 24 Start Page ........................................................................................................................................... 24
View ............................................................................................................................................................ 24 Pause .................................................................................................................................................. 24 Resume ............................................................................................................................................... 24 Save View ........................................................................................................................................... 24 Restore View ...................................................................................................................................... 24
Selection ..................................................................................................................................................... 25 Send to Wireshark .............................................................................................................................. 25 Send to Trace File ............................................................................................................................... 25 Drill Down ........................................................................................................................................... 25 Copy to Clipboard ............................................................................................................................... 25
4. Time Control .................................................................................................................................. 25
WiFi Pilot Page 4
Time Control Ribbon .................................................................................................................................. 28 Begin ................................................................................................................................................... 28 Step Back ............................................................................................................................................ 28 Step Forward ...................................................................................................................................... 28 End ...................................................................................................................................................... 28 Selection Duration .............................................................................................................................. 29 Time Selection .................................................................................................................................... 29
5. Watches ......................................................................................................................................... 30 Creating Watches on Strip Charts and Bar Charts ..................................................................................... 30
Name and Description ........................................................................................................................ 31 Severity ............................................................................................................................................... 32 Enabled ............................................................................................................................................... 32
Trigger Conditions ...................................................................................................................................... 32 Expanded Trigger Condition ............................................................................................................... 33 Multi-Line Strip Charts ....................................................................................................................... 33 Timing Details for Bar Charts .............................................................................................................. 34
Actions ........................................................................................................................................................ 35 Transition Conditions ......................................................................................................................... 35 Notify Me ............................................................................................................................................ 36 Send an email with the Watch event details...................................................................................... 37 Start a packet capture ........................................................................................................................ 37 Send a remote syslog message over UDP .......................................................................................... 38 Run a program on the Pilot Probe ...................................................................................................... 38 Send a message to a Twitter account ................................................................................................ 38 Log the events in the Windows event log .......................................................................................... 38 Log the events in a CSV file on the Pilot Probe .................................................................................. 39
Watches/Events Ribbon ............................................................................................................................. 39 Add Watch .......................................................................................................................................... 39 Edit Selected Watch ........................................................................................................................... 39 Remove Selected Watch .................................................................................................................... 39 Enable Selected Watch ....................................................................................................................... 40 Pause Selected Watch ........................................................................................................................ 40 Filtering Events Section ...................................................................................................................... 40 Events Overlay Section ....................................................................................................................... 43
Predefined Watches ................................................................................................................................... 43 6. Reporting Ribbon ........................................................................................................................... 45
Generate Report ........................................................................................................................................ 45 Current View....................................................................................................................................... 45 All Views ............................................................................................................................................. 45 Format ................................................................................................................................................ 45 Open Reports ..................................................................................................................................... 46
Management .............................................................................................................................................. 46 Recent ................................................................................................................................................. 46 Change Folder..................................................................................................................................... 47 Browse Folder ..................................................................................................................................... 47
Settings ....................................................................................................................................................... 47 Title ..................................................................................................................................................... 47 Analyst/Client Information ................................................................................................................. 47 Report Designer .................................................................................................................................. 48
7. Report Designer Ribbon .................................................................................................................. 49 Styles .......................................................................................................................................................... 49

WiFi Pilot Page 5
Includes ...................................................................................................................................................... 49 Change Logo ....................................................................................................................................... 49 Table of Contents ............................................................................................................................... 49 MD5 Checksums of Trace Files ........................................................................................................... 50 Cover Page .......................................................................................................................................... 50 Data as Table ...................................................................................................................................... 50
Visual Settings ............................................................................................................................................ 50 White Chart Background .................................................................................................................... 50 Draft Images (Faster) .......................................................................................................................... 50
Page Setup .................................................................................................................................................. 50 Portrait ............................................................................................................................................... 50 Landscape ........................................................................................................................................... 50
Display ........................................................................................................................................................ 51 Zoom Amount ..................................................................................................................................... 51 Decrease Zoom ................................................................................................................................... 51 Increase Zoom .................................................................................................................................... 51
Width .......................................................................................................................................................... 51 Page ............................................................................................................................................................ 51 Close Designer ............................................................................................................................................ 52
8. Sources Panel ................................................................................................................................. 53 Devices ....................................................................................................................................................... 53
Context Menus in the Devices Panel .................................................................................................. 54 Files ............................................................................................................................................................ 55
Importing Trace Files .......................................................................................................................... 55 Tooltips ............................................................................................................................................... 61
9. Views Panel .................................................................................................................................... 62 Using Views ................................................................................................................................................ 62 View Library ................................................................................................................................................ 63
Context Menus ................................................................................................................................... 63 Tooltips ............................................................................................................................................... 65
Recently Used ............................................................................................................................................. 65 Context Menus ................................................................................................................................... 65
Custom Views ............................................................................................................................................. 65 Context Menus ................................................................................................................................... 65
Search Text Box .......................................................................................................................................... 68 10. Main Workspace............................................................................................................................. 69
Context Menus ................................................................................................................................... 70 Tooltips ............................................................................................................................................... 70 Notes .................................................................................................................................................. 70 Selection ............................................................................................................................................. 72 Mini .................................................................................................................................................... 72
11. Conversation Ring ........................................................................................................................... 72 Default ................................................................................................................................................ 72 Scroll Wheel ........................................................................................................................................ 72 Hover with Tooltip .............................................................................................................................. 72 Selected .............................................................................................................................................. 73 Mini .................................................................................................................................................... 73
Context Menu ............................................................................................................................................ 74 Context Sub-Menus ............................................................................................................................ 74
Tooltips ....................................................................................................................................................... 75 Endpoint ............................................................................................................................................. 75

WiFi Pilot Page 6
Conversation ...................................................................................................................................... 76 12. Strip Chart ...................................................................................................................................... 77
Diagram ...................................................................................................................................................... 77 Current Selection Interval .................................................................................................................. 77 Selection ............................................................................................................................................. 79 Mini .................................................................................................................................................... 80
Context Menu ............................................................................................................................................ 80 Context Sub-Menu ............................................................................................................................. 81
Dialogs ........................................................................................................................................................ 82 Tooltips ....................................................................................................................................................... 82
13. Bar Chart ........................................................................................................................................ 83 Single Bar Chart .......................................................................................................................................... 83
Default ................................................................................................................................................ 83 Selection with Tooltip ......................................................................................................................... 83 Mini .................................................................................................................................................... 84
Stacked Bar Chart ....................................................................................................................................... 84 Default ................................................................................................................................................ 84 Mini .................................................................................................................................................... 85
Grouped Bar Chart ..................................................................................................................................... 85 Default ................................................................................................................................................ 85 Selection ............................................................................................................................................. 85 Mini .................................................................................................................................................... 86
Context Menu ............................................................................................................................................ 87 Context Sub-Menus ............................................................................................................................ 88
Tooltips ....................................................................................................................................................... 89 14. Scatter Plot..................................................................................................................................... 89
Default ................................................................................................................................................ 90 Selection ............................................................................................................................................. 90 Mini .................................................................................................................................................... 90
Context Menu ............................................................................................................................................ 91 Context Sub-Menus ............................................................................................................................ 91
Tooltips ....................................................................................................................................................... 93 15. Pie Chart ........................................................................................................................................ 93
Default ................................................................................................................................................ 93 Selection ............................................................................................................................................. 93 Mini .................................................................................................................................................... 94
Context Menu ............................................................................................................................................ 94 Context Sub-Menus ............................................................................................................................ 95
Tooltips ....................................................................................................................................................... 95 16. Data Grid ........................................................................................................................................ 95
Grouping Bar .............................................................................................................................................. 96 Column Headers ......................................................................................................................................... 96 Filter Bar ..................................................................................................................................................... 96 Hierarchy .................................................................................................................................................... 97 Selection ..................................................................................................................................................... 97 Context Menu ............................................................................................................................................ 98
Context Sub-Menus ............................................................................................................................ 99 Tooltips ....................................................................................................................................................... 99
17. Channels Button ........................................................................................................................... 100 All Channels ...................................................................................................................................... 101 2.4GHz Center Frequencies: ............................................................................................................. 101

WiFi Pilot Page 7
5GHz Center Frequencies: ................................................................................................................ 101 Channel Names................................................................................................................................. 101 All Channels Panel ............................................................................................................................ 102 Channel List ...................................................................................................................................... 102 Selection Controls ............................................................................................................................ 103 Search and Filter Bar ........................................................................................................................ 103
Locked Channels ....................................................................................................................................... 103 Title ................................................................................................................................................... 103 Selection Controls ............................................................................................................................ 103 Transfer Controls .............................................................................................................................. 104 Channel List ...................................................................................................................................... 104
Scan Sequence ......................................................................................................................................... 104 Duration............................................................................................................................................ 105 Selection Controls ............................................................................................................................ 105 Transfer Controls .............................................................................................................................. 105 Channel List ...................................................................................................................................... 105
18. Drill Down .................................................................................................................................... 106 How to ...................................................................................................................................................... 106 Example .................................................................................................................................................... 106
19. Decryption ................................................................................................................................... 107 Wireless Decryption Keys Manager ......................................................................................................... 107
Adding a Key ..................................................................................................................................... 108 WPA Related Packet Injection .......................................................................................................... 109
20. Filter Dialog .................................................................................................................................. 111 Filter Library ............................................................................................................................................. 111 Filter Parameters ...................................................................................................................................... 111
21. Search Dialog ................................................................................................................................ 112 Search Context ......................................................................................................................................... 112 Search Style .............................................................................................................................................. 112
Regular Expression Example ............................................................................................................. 113 22. Security Disclosures ...................................................................................................................... 113 23. Appendix A Chart Types ................................................................................................................ 114 24. Appendix B Filters ......................................................................................................................... 115 25. Appendix C Report Example Breakdown ........................................................................................ 116
Chart Figures
Chart Figure 1 View Notes Toggle Button .......................................................................................................... 71 Chart Figure 2 Chart Selected ............................................................................................................................ 72 Chart Figure 3 Chart Not Selected ..................................................................................................................... 72 Chart Figure 4 Conversation Ring ...................................................................................................................... 72 Chart Figure 5 Conversation Ring Hover ............................................................................................................ 73 Chart Figure 6 Conversation Ring Selection ....................................................................................................... 73 Chart Figure 7 Conversation Ring Mini .............................................................................................................. 73 Chart Figure 8 Strip Chart .................................................................................................................................. 77 Chart Figure 9 Strip Chart with Horizontal Zoom............................................................................................... 78 Chart Figure 10 Strip Chart Selection (Time) ..................................................................................................... 79 Chart Figure 11 Strip Chart Selection (Element) ................................................................................................ 79 Chart Figure 12 Strip Chart Mini ........................................................................................................................ 80 Chart Figure 13 Single Bar Chart ........................................................................................................................ 83

WiFi Pilot Page 8
Chart Figure 14 Single Bar Chart Selection ........................................................................................................ 84 Chart Figure 15 Single Bar Chart Mini ................................................................................................................ 84 Chart Figure 16 Stacked Bar Chart ..................................................................................................................... 84 Chart Figure 17 Stacked Bar Chart Mini ............................................................................................................. 85 Chart Figure 18 Grouped Bar Chart ................................................................................................................... 85 Chart Figure 19 Grouped Bar Chart Selection (Column) .................................................................................... 86 Chart Figure 20 Grouped Bar Chart Selection (Component Instance) ............................................................... 86 Chart Figure 21 Grouped Bar Chart Selection (Component) ............................................................................. 86 Chart Figure 22 Grouped Bar Chart Mini ........................................................................................................... 87 Chart Figure 23 Scatter Plot ............................................................................................................................... 90 Chart Figure 24 Scatter Plot Draw Box ............................................................................................................... 90 Chart Figure 25 Scatter Plot Multiple Selection ................................................................................................. 90 Chart Figure 26 Scatter Plot Mini ....................................................................................................................... 90 Chart Figure 27 Pie Chart ................................................................................................................................... 93 Chart Figure 28 Pie Chart Selection ................................................................................................................... 93 Chart Figure 29 Pie Chart Mini ........................................................................................................................... 94 Chart Figure 30 Grid ........................................................................................................................................... 96 Chart Figure 31 Bar Chart ................................................................................................................................. 114 Chart Figure 32 Conversation Ring .................................................................................................................. 114 Chart Figure 33 Data Grid ................................................................................................................................ 114 Chart Figure 34 Pie Chart ................................................................................................................................. 114 Chart Figure 35 Strip Chart .............................................................................................................................. 114 Chart Figure 36 Scatter Plot ............................................................................................................................. 114
Context Menus
Context Menu 1 Devices Panel (No Selection) .................................................................................................. 54 Context Menu 2 Devices Panel (Interface Selected) .......................................................................................... 54 Context Menu 3 Devices Panel (View Selection) ............................................................................................... 54 Context Menu 4 Devices Panel (View Selection) ............................................................................................... 55 Context Menu 5 Files Panel (No Selection) ........................................................................................................ 57 Context Menu 6 Files Panel (Trace File Selected on Local System) ................................................................... 57 Context Menu 7 Files Panel (Trace Folder Selected on Local System) .............................................................. 58 Context Menu 8 Devices Panel (View Selection) ............................................................................................... 59 Context Menu 9 Devices Panel (View Selection) ............................................................................................... 60 Context Menu 10 View Library Folder ............................................................................................................... 63 Context Menu 11 View Library View ................................................................................................................. 64 Context Menu 12 Recently Used Folder ............................................................................................................ 65 Context Menu 13 Custom Folder ....................................................................................................................... 66 Context Menu 14 Custom Folder ....................................................................................................................... 66 Context Menu 15 Custom View ......................................................................................................................... 67 Context Menu 16 View Panel Search ................................................................................................................. 68 Context Menu 17 Conversation Ring (Selection) ............................................................................................... 74 Context Menu 18 Conversation Ring (No Selection) ......................................................................................... 74 Context Menu 19 Strip Chart (Selection) ........................................................................................................... 80 Context Menu 20 Strip Chart (No Selection) ..................................................................................................... 80 Context Menu 21 Bar Chart (Selection) ............................................................................................................. 87 Context Menu 22 Bar Chart (No Selection) ....................................................................................................... 87 Context Menu 23 Scatter Plot (Selection).......................................................................................................... 91 Context Menu 24 Scatter Plot (No Selection) .................................................................................................... 91

WiFi Pilot Page 9
Context Menu 25 Pie Chart (Selection) .............................................................................................................. 94 Context Menu 26 Pie Chart (No Selection) ........................................................................................................ 94 Context Menu 27 Grid (Selection) ..................................................................................................................... 98 Context Menu 28 Grid (No Selection) ................................................................................................................ 98
Context Sub Menus
Context Sub Menu 1 Sampling Time .................................................................................................................. 64 Context Sub Menu 2 Data Retention Time ........................................................................................................ 64 Context Sub Menu 3 User Filter ......................................................................................................................... 67 Context Sub Menu 4 Select ................................................................................................................................ 74 Context Sub Menu 5 Conversation Ring Settings .............................................................................................. 75 Context Sub Menu 6 Conversation Ring Settings (Detail).................................................................................. 75 Context Sub Menu 7 Select ................................................................................................................................ 81 Context Sub Menu 8 Strip Chart Settings .......................................................................................................... 81 Context Sub Menu 9 Select ................................................................................................................................ 87 Context Sub Menu 10 Bar Chart Settings (Detail) .............................................................................................. 88 Context Sub Menu 11 Scatter Plot Select .......................................................................................................... 91 Context Sub Menu 12 Scatter Plot Dimensions ................................................................................................. 92 Context Sub Menu 13 Scatter Plot Dimensions (Detail) ................................................................................... 92 Context Sub Menu 14 Scatter Plot Settings ....................................................................................................... 92 Context Sub Menu 15 Pie Chart Select .............................................................................................................. 94 Context Sub Menu 16 Pie Chart Settings ........................................................................................................... 95 Context Sub Menu 17 Pie Chart Settings (Detail) .............................................................................................. 95 Context Sub Menu 18 Select .............................................................................................................................. 99 Context Sub Menu 19 Grid Columns .................................................................................................................. 99 Context Sub Menu 20 Grid Settings ................................................................................................................... 99
Dialogs
Dialog 1 Strip Chart Settings .............................................................................................................................. 82 Dialog 2 Filter Editor ........................................................................................................................................ 111 Dialog 3 Search Dialog...................................................................................................................................... 112
Figures
Figure 1 User Interface Breakdown (Major) ...................................................................................................... 17 Figure 2 Ribbon Panel ........................................................................................................................................ 17 Figure 3 Devices, and Files Panel ....................................................................................................................... 18 Figure 4 Views Panel .......................................................................................................................................... 18 Figure 5 Main Workspace .................................................................................................................................. 19 Figure 6 User Interface Breakdown (Minor) ...................................................................................................... 19 Figure 7 Menu Button ........................................................................................................................................ 19 Figure 8 Home Ribbon ....................................................................................................................................... 20 Figure 9 Getting Started ..................................................................................................................................... 24 Figure 10 Traffic Type Over Time Showing Time Selection Windows................................................................ 26 Figure 11 Traffic Type Over Time with Multi-Level Zoom Selection .................................................................. 27 Figure 12 Time Control Bars ............................................................................................................................... 27 Figure 13 Time Control Ribbon .......................................................................................................................... 28 Figure 14 Selection Duration Section of the Time Control Ribbon .................................................................... 29

WiFi Pilot Page 10
Figure 15 Time Selection Section of the Time Control Ribbon .......................................................................... 29 Figure 16 Strip Chart with Context Menu .......................................................................................................... 30 Figure 17 Watch Editor Panel ............................................................................................................................ 31 Figure 18 Watch Severity ................................................................................................................................... 32 Figure 19 Trigger Condition ............................................................................................................................... 32 Figure 20 Relational Operators .......................................................................................................................... 32 Figure 21 Trigger Condition Expanded ............................................................................................................... 33 Figure 22 Sample Choices for Satisfied for ........................................................................................................ 33 Figure 23 Mult-Line Strip Chart with Filtering ................................................................................................... 34 Figure 24 Multi-Line Strip Chart without Filtering ............................................................................................. 34 Figure 25 Timing Details ..................................................................................................................................... 34 Figure 26 Aggregating Chart .............................................................................................................................. 35 Figure 27 Transition Conditions ......................................................................................................................... 36 Figure 28 Event Notifications ............................................................................................................................. 36 Figure 29 Event Structure .................................................................................................................................. 37 Figure 30 Email Action ....................................................................................................................................... 37 Figure 31 Capture Packets Panel........................................................................................................................ 37 Figure 32 Send to Remote Syslog ....................................................................................................................... 38 Figure 33 Run a Program .................................................................................................................................... 38 Figure 34 Send to Twitter Account .................................................................................................................... 38 Figure 35 Send to Windows Event Log............................................................................................................... 39 Figure 36 Send to CSV File.................................................................................................................................. 39 Figure 37 Watches and Events Ribbon .............................................................................................................. 39 Figure 38 Add Watch .......................................................................................................................................... 39 Figure 39 Edit Watch .......................................................................................................................................... 39 Figure 40 Remove Watch ................................................................................................................................... 39 Figure 41 Enable Watch ..................................................................................................................................... 40 Figure 42 Pause Watch ...................................................................................................................................... 40 Figure 43 Events Panel ....................................................................................................................................... 40 Figure 44 Event Filtering Section of the Watches/Events Ribbon ..................................................................... 41 Figure 45 Add to Pin List .................................................................................................................................... 41 Figure 46 (Show the) Pin List .............................................................................................................................. 41 Figure 47 The Pin List ......................................................................................................................................... 41 Figure 48 Severities Filter ................................................................................................................................... 42 Figure 49 Severities List ..................................................................................................................................... 42 Figure 50 Watches and Events Filter .................................................................................................................. 42 Figure 51 Time Selection .................................................................................................................................... 42 Figure 52 Apply Button ...................................................................................................................................... 43 Figure 53 Events Overlay Section ....................................................................................................................... 43 Figure 54 Predefined Watches ........................................................................................................................... 44 Figure 55 Watch Editor Panel with Filter Settings ............................................................................................. 44 Figure 56 Reporting Ribbon ............................................................................................................................... 45 Figure 57 Open Reports ..................................................................................................................................... 46 Figure 58 Title .................................................................................................................................................... 47 Figure 59 Report Designer Ribbon ..................................................................................................................... 49 Figure 60 Styles .................................................................................................................................................. 49 Figure 61 Table of Contents ............................................................................................................................... 49 Figure 62 MD5 Checksums ................................................................................................................................. 50 Figure 63 Cover Page ......................................................................................................................................... 50 Figure 64 Data as Table ...................................................................................................................................... 50 Figure 65 White Chart Background .................................................................................................................... 50

WiFi Pilot Page 11
Figure 66 Draft Images (Faster).......................................................................................................................... 50 Figure 67 Portrait ............................................................................................................................................... 50 Figure 68 Landscape........................................................................................................................................... 51 Figure 69 Zoom Amount .................................................................................................................................... 51 Figure 70 Sources Panel ..................................................................................................................................... 53 Figure 71 Devices and Files Tabs ........................................................................................................................ 53 Figure 72 Files Panel (Empty) ............................................................................................................................. 55 Figure 73 Files Panel (Expanded) ....................................................................................................................... 56 Figure 74 Views Library ...................................................................................................................................... 62 Figure 75 Instance of a View .............................................................................................................................. 62 Figure 76 A View in the Main Workspace .......................................................................................................... 69 Figure 77 Chart Context Menu Overview .......................................................................................................... 70 Figure 78 View With Collapsed Notes ................................................................................................................ 70 Figure 79 View With Expanded Notes ............................................................................................................... 71 Figure 80 Grid Grouping Bar .............................................................................................................................. 96 Figure 81 Selection Based Grid Filtering Drop Down ......................................................................................... 97 Figure 82 Selection Based Grid Filtering Enabled .............................................................................................. 97 Figure 83 Advanced Grid Filtering ...................................................................................................................... 97 Figure 84 Wireless Interface in Sources Panel ................................................................................................. 100 Figure 85 Channel Management Panel ............................................................................................................ 100 Figure 86 All Channels ...................................................................................................................................... 101 Figure 87 Channel List ...................................................................................................................................... 102 Figure 88 Locked Channels............................................................................................................................... 103 Figure 89 Scan Sequence ................................................................................................................................. 104 Figure 90 Channel Duration ............................................................................................................................. 105 Figure 91 Wireshark analyzing an WiFi Pilot generated Deauthentication frame .......................................... 110
Icons
Icon 1 Add Trace File .......................................................................................................................................... 21 Icon 2 Add Trace Folder ..................................................................................................................................... 21 Icon 3 Clear List .................................................................................................................................................. 21 Icon 4 Channel Selector ..................................................................................................................................... 22 Icon 5 Wireless Decryption Key Manager .......................................................................................................... 22 Icon 6 Name Resolution ..................................................................................................................................... 22 Icon 7 Sub Net Mask .......................................................................................................................................... 23 Icon 8 Search ...................................................................................................................................................... 23 Icon 9 Update Sources ....................................................................................................................................... 23 Icon 10 Close All Tabs ......................................................................................................................................... 24 Icon 11 Pause Live Capture ................................................................................................................................ 24 Icon 12 Resume Live Capture ............................................................................................................................. 24 Icon 13 Save Custom View ................................................................................................................................. 24 Icon 14 Restore Default View ............................................................................................................................ 24 Icon 15 Send to Wireshark ................................................................................................................................. 25 Icon 16 Send to File ............................................................................................................................................ 25 Icon 17 Drill Down .............................................................................................................................................. 25 Icon 18 Copy to Clipboard .................................................................................................................................. 25 Icon 19 Current View ......................................................................................................................................... 45 Icon 20 All Views ................................................................................................................................................ 45 Icon 21 Format ................................................................................................................................................... 45

WiFi Pilot Page 12
Icon 22 Recent.................................................................................................................................................... 47 Icon 23 Change Folder ....................................................................................................................................... 47 Icon 24 Browse Folder ....................................................................................................................................... 47 Icon 25 Analyst/Client Information .................................................................................................................... 47 Icon 26 Report Designer..................................................................................................................................... 48 Icon 27 Change Logo .......................................................................................................................................... 49 Icon 28 Decrease Zoom ...................................................................................................................................... 51 Icon 29 Increase Zoom ....................................................................................................................................... 51 Icon 30 Zoom Width ........................................................................................................................................... 51 Icon 31 Zoom Page ............................................................................................................................................. 51 Icon 32 Close Designer ....................................................................................................................................... 52 Icon 33 Wireless Adapter .................................................................................................................................. 53 Icon 34 Select No Channels .............................................................................................................................. 103 Icon 35 Invert Selection ................................................................................................................................... 103 Icon 36 Select All Channels .............................................................................................................................. 103 Icon 37 Select No Channels .............................................................................................................................. 103 Icon 38 Invert Selection ................................................................................................................................... 104 Icon 39 Select All Channels .............................................................................................................................. 104 Icon 40 Transfer Channels ................................................................................................................................ 104 Icon 41 Remove Channels ................................................................................................................................ 104 Icon 42 Select No Channels .............................................................................................................................. 105 Icon 43 Invert Selection ................................................................................................................................... 105 Icon 44 Select All Channels .............................................................................................................................. 105 Icon 45 Transfer Channels ................................................................................................................................ 105 Icon 46 Remove Channels ................................................................................................................................ 105
Submenus
Submenu 1 Send to Wireshark .......................................................................................................................... 21 Submenu 2 Send to File ..................................................................................................................................... 22 Submenu 3 Name Resolution ............................................................................................................................ 22 Submenu 4 Sub Net Mask .................................................................................................................................. 23 Submenu 5 Format............................................................................................................................................. 46 Submenu 6 Recent Reports................................................................................................................................ 47 Submenu 7 Recent Reports (Detail) ................................................................................................................... 47 Submenu 8 Analyst/Client Information ............................................................................................................. 48 Submenu 9 Decryption Keys ............................................................................................................................ 107 Submenu 10 Decryption Keys with Key ........................................................................................................... 108 Submenu 11 Decryption Keys with Key (Detail) .............................................................................................. 108
Tooltips
Tooltip 1 Files Panel Folder ................................................................................................................................ 61 Tooltip 2 Files Panel Trace File ........................................................................................................................... 61 Tooltip 3 Conversation Ring Endpoint ............................................................................................................... 75 Tooltip 4 Conversation Ring Conversation ......................................................................................................... 76 Tooltip 5 Scatter Plot ......................................................................................................................................... 93 Tooltip 6 Pie Chart.............................................................................................................................................. 95

WiFi Pilot Page 13

WiFi Pilot Page 14
Overview
What is WiFi Pilot?
WiFi Pilot is a powerful Windows-based 802.11 network analysis tool consisting of an intuitive and visually-oriented user interface and a powerful wireless analysis engine, designed to increase your troubleshooting effectiveness. WiFi Pilot is based on CACE Pilot, CACE Technologies powerful network analysis, visualization, and reporting tool, and the AirPcap Family of 802.11 wireless adapters.
WiFi Pilot has the following features:
Exclusive Support for AirPcap Adapters
Wireshark Integration
Interactive Views and Charts
Drill-Down
Time Control
Watches
Extensive Wireless Views
Report Generation
Exclusive Support for AirPcap Adapters
WiFi Pilot works exclusively with AirPcap Family of WLAN packet capture adapters for the Windows platform. All of the adapters in the AirPcap Family are USB based and capture full 802.11 data, management, and control frames. The AirPcap Family of adapters ranges from an 802.11b/g capture-only adapter to an 802.11a/b/g/n capture and injection adapter. WiFi Pilot incorporates the multi-channel aggregation support provided by the AirPcap software. When using multiple AirPcap adapters, WiFi Pilot allows the user to simultaneously view and capture on multiple 802.11 channels.
Wireshark Integration
WiFi Pilot and the AirPcap adapters are fully integrated with Wireshark allowing you to leverage your team’s existing expertise. WiFi Pilot makes it possible to select a wireless traffic source and view it with Wireshark: you have the best protocol analyzer in the world available to you at all times. In addition, Wireshark’s prodigious dissector library for deep 802.11 packet analysis and the corresponding display filters are available for use within WiFi Pilot.
Using WiFi Pilot’s innovative Channel Selection interface, you have complete control of your AirPcap adapters while you capture with Wireshark. For example, using multiple AirPcap adapters, you can easily configure Wireshark to continuously listen on one channel while at the same time “hopping” on the other channels.
Interactive Views and Charts
Views are the core analysis and visualization paradigm in WiFi Pilot. WiFi Pilot contains over 35 WLAN Views providing a broad range of protocol support for wireless network analysis and troubleshooting. Views consist of a collection of interactive display components called Charts.
WiFi Pilot offers a complete collection of Charts including bar, pie, and strip charts, scatter plots, conversation rings, and grids. Views and charts are interactive – they can be resized, moved, and most importantly, users can perform visual selections on graphical elements within a Chart, such as selecting individual bars within a bar chart or time intervals within a strip chart.
The interactive Views can be thoroughly customized, saved, exported, imported, and shared with colleagues. Each of these charts data can be exported to multiple formats and can be included in WiFi Pilot’s innovative report generator.

WiFi Pilot Page 15
Drill-Down
Drill-Down is one of the most powerful and unique features of WiFi Pilot. Drill-Down occurs when the user applies a View to a source which itself is the result of a selection make within a Chart of a previously instantiated View – this powerful paradigm increases your analysis capabilities many fold.
Through CACE Technologies’ industry-leading and visually-based Drill-Down feature, WiFi Pilot can be used to analyze very large trace files, quickly guiding the user to the handful of packets responsible for the anomalous network behavior.
Time Control
Viewing metrics computed over days, weeks, and months can be challenging. With WiFi Pilot’s “back-in-time” technology, the user can move through View metrics computed over extended periods of time with just a few mouse clicks. Based on the selected time interval, subsampling and aggregation techniques are used to optimize the granularity of the visual presentation of the View metrics thereby easily zooming in and out of the View metrics. The back-in-time technology applies to live and off-line wireless traffic.
Watches
WiFi Pilot includes a sophisticated triggering and alerting technology called Watches. The user is able to create a Watch on many View metrics and be alerted based on a trigger condition computed on a metric. For example, the user can be alerted on high bandwidth, encryption and vendor types, and so on. When a Watch detects that a trigger condition is true, then a corresponding action will be taken. Possible actions include, event logging, sending email, sending a Twitter message, starting a packet trace capture, and much more.
Extensive Wireless Views
WiFi Pilot features the following abilities:
Aggregation of multiple AirPcap wireless devices for easy management.
Fast and powerful 802.11 A, B, G, and N channel selection management.
WEP, WPA, and WPA2 decryption with key management.
Analysis that includes, but is not limited to, the following: o Per channel, per host, and per network analysis of things such as
Bandwidth over time Signal versus noise over time 802.11 frame types over time
o Access point and Console discovery o Vendor discovery
Analysis and graphical displays include the following: o Retransmission conversations o Access point associations o Top traffic across networks, channels, or any subset o Probe requests
Flexible Report Generation
Graphically customizable reports can be automatically generated to show things such as:
Wireless conversations at the MAC layer
Wireless discovery including access points and stations
Encryption analysis
Retransmission conversations

WiFi Pilot Page 16
And much more; in fact, hundreds of easy to use charts that can be scoped and limited to whatever conditions necessary. These charts can be combined in a single report or created in separate reports in one or more formats, with just a click of the mouse. Supported formats include:
Microsoft Excel
Microsoft Word
HTML
All relevant trace files and their MD5 digests can be automatically packaged in a ZIP file along with the generated reports for easy distribution.
Hardware and Software Requirements for WiFi Pilot
WiFi Pilot is available on Windows platforms including XP and Vista. Although the system requirements for WiFi Pilot scale with usage, in order to use WiFi Pilot effectively, the following minimum configuration is recommended:
Wireless Interface One or more AirPcap adapters
Operating System Windows XP or Windows Vista
Host Hardware A Core Duo 2.0 GHz class machine or better with USB 2.0 interface(s)
Available Disk Space A base install requires approximately 300MB of disk space. Additional space is required to store generated reports or trace files created with WiFi Pilot.
Memory At least 2 GB of system memory
Video Hardware and Settings A graphics card with a minimum resolution of 1024 x 768
Purpose and Layout of this Manual
The purpose of this manual is to introduce the reader to the major features of WiFi Pilot. It is assumed that the reader of this manual is familiar with 802.11 wireless networking. Care was taken to avoid technical explanations except when necessary for conceptual understanding or functional explanation.
This manual is meant to be coupled with videos available online and on the CD shipped with WiFi Pilot. Since certain things are better explained by visual example, to gain a full understanding of the capabilities of WiFi Pilot and to maximize your facility with this unique tool, we recommend that both this manual and the videos be used.

WiFi Pilot Page 17
Graphical User Interface
Graphical User Interface Components
Figure 1 User Interface Breakdown (Major)
The graphical user interface of WiFi Pilot, broken up into the five main sections, is shown in Figure 1. Each section represents a major topic of this manual. The descriptions below are conceptual overviews of each section.
Ribbon Panel
Figure 2 Ribbon Panel
The Ribbon Panel provides access to global settings, management, and general actions. There are four ribbon panels (Home, Time Control, Watches/Events, and Reporting) that can be tabbed through using the mouse wheel.

WiFi Pilot Page 18
Sources Panel
Views Library
Figure 4 Views Panel
The Views section contains a library of 802.11 visual analysis configurations called “Views”. Views correspond to specific analyses and graphical presentations of wireless traffic and can be applied to both live and offline wireless sources.
Views are both general and specific with varying levels of customization available.
Figure 3 Devices, and Files Panel
The Sources Panel contains representations of the AirPcap interfaces and wireless trace files and is one of the most important parts of WiFi Pilot. It has two tabs, “Devices” and “Files”. These can be cycled through by clicking on them. The meaning of each is the following:
Devices The Devices tab contains the AirPcap interface offering live sources of network traffic to WiFi Pilot. Figure 3 depicts the AirPcap interface with 3 AirPcap adapters offering simultaneous access to 3 channels. The Channels button in the main ribbon is used to configure the channel setup for the Airpcap interfaces. This includes channel scanning and fixed channel settings.
Files The Files tab depicts local trace files of wireless captures with their associated folders. WiFi Pilot only opens trace files that contain wireless network traffic.

WiFi Pilot Page 19
Main Workspace
Figure 5 Main Workspace
The Main Workspace has tabbed windows which can be one of the following:
Views
Report Preview for Global Designer
Getting Started Tab
The windows can be moved by dragging them and can be closed either by clicking on the icon on the left-hand side of the tab name or middle-clicking on the tab itself.
Figure 6 shows the Getting Started page which includes icons representing introductory videos to WiFi Pilot.
There are two minor parts of the user interface:
Figure 6 User Interface Breakdown (Minor)
Menu Button
Figure 7 Menu Button
The Menu Button has the following components:
Import Custom Views and Settings… The Import Custom Views and Settings… menu option will open a file created by one of the two export menu options described below and apply it to WiFi Pilot. This applies to all settings in the global configuration file, which are enumerated throughout this manual. Briefly, it entails items such as
Custom views
Report settings
Channel scan sequence

WiFi Pilot Page 20
Status Bar
The Status Bar lists the last operation that was done such as applying a view to a device. During certain operations, the status bar also includes a graphical horizontal bar on its right hand side that displays the percentage completion of an operation.
Home Ribbon
Figure 8 Home Ribbon
The Home Ribbon serves as the primary interface to WiFi Pilot. Most operations can be executed via this ribbon. Certain parts of the ribbon are disabled by default. This is to be expected, as will be explained below. The sections of the ribbon are broken down going left to right, top to bottom.
Decryption keys
References to the trace files in the Files panel Additionally, the custom views from the exported configuration are imported and loaded in the custom views section of the Views panel.
Export Custom Views and Settings… The Export Custom Views and Settings… menu option prepares a file that can be imported into another instance of WiFi Pilot. This file contains the global configuration file, whose settings are enumerated throughout this manual.
Export Custom Views… The Export Custom Views… menu option prepares a file that can be imported into another instance of WiFi Pilot that contains only the custom views.
Print View… The Print View… creates a default report from the current view and sends it to the printer. The report is not saved to disk.
Recent Views The Recent Views section lists the five most recently applied views and their descriptions. Views can be selected from here and will be applied to the currently selected device or file, as described below in the section “Applying a View”.
Note: To close any submenu of the ribbon, such as the Decryption Keys or Channels,
simply click the button again or somewhere outside of the submenu and it will
close. Furthermore, all changes take place immediately hence there is no need
for confirmation buttons.

WiFi Pilot Page 21
Trace Files
WiFi Pilot can analyze wireless trace files of arbitrary size in the PCAP capture format with the following restrictions: 802.11 Wireless trace files are identified by having either a RadioTap1 or PPI2 header.
Add Trace File
Add Folder
Icon 2 Add Trace
Folder
The Add Folder button adds a directory of wireless trace files to the Files panel for analysis. The selected folder is scanned for all wireless trace files and WiFi Pilot will only import applicable files. Similar to the add trace file operation, this operation adds a reference to the folder and relevant files and does not copy anything on disk.
Furthermore, this operation is not recursive and does not scan subfolders.
Clear List
Export
The Export section lists the functions that can be used to export wireless traffic from a selected device or file to either Wireshark or to a (wireless) trace file.
Wireshark
File
1 NetBSD: http://netbsd.gw.com/cgi-bin/man-cgi?ieee80211_radiotap+9+NetBSD-current
2 CACE Technologies: http://www.cacetech.com/documents/PPI_Header_format_1.0.1.pdf
Icon 1 Add Trace
File
The Add Trace File button adds a wireless trace file to the Files panel for analysis. This operation only adds a reference to the file and is not a copy operation. If the file moves on disk, the reference will be no longer valid.
Icon 3 Clear List
The Clear List button clears the list of trace files in the Files panel.
Submenu 1 Send
to Wireshark
The Wireshark button sends traffic from the selected device or file to Wireshark. Note that this is a two click operation. The first click opens a submenu with two options:
Without Filter The Without Filter menu option sends all traffic from the selected device or trace file to Wireshark. In the case of a device, Wireshark will present, by default, a live scrolling capture. The default behavior can be changed by editing the Wireshark preferences.
With Filter The With Filter menu option opens up a filter selection dialog (explained later) to filter the traffic to be sent to Wireshark.

WiFi Pilot Page 22
Settings
The Settings section contains global settings that are immediately applicable to all open views and their charts.
Channel Selector
Icon 4 Channel
Selector
The Channel Selector button opens up a submenu that allows for the management of the set and duration of channels to scan or lock. This interface is a large topic and is explained in its own section later on.
Wireless Decryption Key Manager
Icon 5 Wireless Decryption Key
Manager
The Wireless Decryption Key Manager button opens a submenu that allows for the management of the list of keys to decode encrypted wireless traffic. This interface is explained in the Decryption section.
Name Resolution
Submenu 2 Send
to File
The File button sends traffic from the selected device or file to a new trace file. Note that this is a two click operation. The first click opens a submenu with two options:
Without Filter The Without Filter button sends all traffic from the selected device or trace file and places it in a trace file of a specified name.
With Filter The With Filter button opens up a filter selection dialog (explained later) to filter the traffic to be sent to a new trace file of a specified name.
After a trace file is created, it is immediately available in the Files panel of the Device and Files Panel.
Icon 6 Name Resolution
Submenu 3 Name
Resolution
The Name Resolution button opens a submenu that allows for the specification of whether certain things should be resolved automatically in a chart. The button gives a submenu with three modal options with only one available:
MAC Addresses When the Mac Addresses check box is checked, a passive file-based lookup is done that converts the leftmost 3 bytes of a MAC address to its respective organization (OUI).
IP Address (Disabled in WiFi Pilot) When the IP Addresses check box is checked, an active DNS lookup is done to resolve IP Addresses to domain names.
TCP and UDP Ports (Disabled in WiFi Pilot) When the TCP and UDP Ports check box is checked, a passive lookup is done to convert TCP and UDP port numbers into their well-known service names. This is simply a table lookup in a known hosts file and does not do any form of service fingerprint matching.

WiFi Pilot Page 23
Sub Net Mask (Disabled in WiFi Pilot)
General
The General section contains buttons that apply to all devices and tabs.
Search
Icon 8 Search
The Search button opens a search dialog window that can be used to find data in the charts. The search context is the labels of the items in a chart which can be selected. For instance you can search for a MAC address. The Search Dialog is described in its own section later on.
Update Sources
Icon 9 Update
Sources
The Update Sources button updates the list of sources for the Devices and Files Panels. Please note that an AirPcap adapter will not be available immediately after it is plugged in, nor will it disappear immediately after being unplugged. It takes about 10 seconds before WiFi Pilot recognizes a change of device.
Icon 7 Sub Net Mask
Submenu 4 Sub Net Mask
The Sub Net Mask button opens a submenu allowing for specification of a global sub net mask to all applicable views and functions as a quick way to discard unwanted traffic. A View’s tooltip indicates whether the net mask is applicable to that view.
The submenu contains two input boxes and two check boxes:
IP Address The IP Address edit box is used to specify a decimal darpa dot notation IPv4 address such as 192.168.0.100. The IP address doesn’t need to be an actual address currently assigned. It is simply a guidance for the filter.
Net Mask The Net Mask edit box is used to specify a decimal darpa dot notation IPv4 net mask address such as 255.255.255.0. Together, the IP Address and sub net mask form a CIDR address block. For instance, in the above example, with a net mask of 255.255.255.0 and an IP Address of 192.168.1.100, the CIDR address block would be 192.168.1.0/24.
No Mask The No Mask check box disables the sub net mask entirely.
Automatic The Automatic check box enables heuristic checks that derive sub net mask values from IP level traffic analysis.

WiFi Pilot Page 24
Close All Tabs
Icon 10 Close All
Tabs
The Close All Tabs button closes all open tabs. This applies to the following tabs:
Views
Report designer
Getting started
Start Page
Figure 9 Getting
Started
The Getting Started button opens a tab in the main workspace that provides:
Access to video tutorials
View
The View section has buttons used for view management.
Pause
Icon 11 Pause Live
Capture
The Pause Live Capture button pauses a capture on the current view and charts. This button is only enabled in a live capture. Additionally, when a view is paused, all data that passes through the interface in the interim is discarded.
Resume
Icon 12 Resume Live
Capture
The Resume Live Capture button resumes a capture on the current view and charts. This button is only enabled in a “paused” live capture.
Save View
Restore View
Icon 14 Restore
Default View
The Restore View button restores default view settings. These can be inferred from the description of the custom views in the Views section.
Icon 13 Save Custom View
The Save View button saves the current view as a custom view. Custom views are explained in the Views section.

WiFi Pilot Page 25
Selection
There are some common functions amongst the charts which are only enabled if there is an active selection in a chart. These functions are on the Home ribbon in the Selection group. Each of these functionalities is also available through the context menu of any chart.
Send to Wireshark
Icon 15 Send to
Wireshark
The Send to Wireshark button sends traffic from the current selection to Wireshark by spawning a new instance of Wireshark and delivering the selected packets to Wireshark.
Send to Trace File
Icon 16 Send to File
The Send to File button sends traffic from the current selection to disk as a trace file and is useful for storing a subset of the original capture. If the traffic was encrypted and is being properly decrypted at the time, then the trace file will store the decrypted traffic.
Drill Down
Icon 17 Drill Down
The Drill Down button applies a view to the current selection in a chart. This is an important and powerful feature of WiFi Pilot and is explained in its own section.
Copy to Clipboard
Icon 18 Copy to
Clipboard
The Copy to Clipboard button copies textual representation of the chart information of the current selection to the clipboard for exporting to another application.
Time Control
The Time Control feature of WiFi Pilot allows the user to go “back in time” over a View that has been computed over days, weeks, or months and applies to Views computed over live and off-line sources. Based on the View and the selected time interval, subsampling and aggregation techniques are used to optimize the granularity of the visual presentation of the View metrics.

WiFi Pilot Page 26
Figure 10 Traffic Type Over Time Showing Time Selection Windows
Figure 10 shows the Traffic Type Over Time View applied to a trace file. The purple bar just below the strip chart is called the Time Controller. It has two fields, Current Selection and the Total Window. The Total Window (in the bar just below the strip chart) indicates that the trace file duration is over 14 hours in duration. The Current Selection (or Selection) is the interval of time that is actually displayed in the Charts that comprise the View. In the above figure, the Current Selection says that the interval contains the complete file and that the sample points correspond to average bandwidth displayed at 10-minute intervals. The underlying bandwidth computation over this trace file was actually computed a 1-second intervals, but since the Current Selection is in excess of 14 hours in duration, it does not make sense to depict the results at the highest granularity. The WiFi Pilot analysis engine bases the level of subsampling on the duration of the Current Selection. This is an example of how subsampling is automatically used to display View metrics in a meaningful way. In Figure 11 we have “zoomed-in” on the View so that the Current Selection interval is 5 minutes long and now the bandwidth is averaged over 10-second intervals. The change in resolution is handled automatically in WiFi Pilot, thereby making is very easy to move around and to zoom in and out of very long-duration trace files and live captures.

WiFi Pilot Page 27
Figure 11 Traffic Type Over Time with Multi-Level Zoom Selection
In Figure 12 we show the Time Control Bars in more detail. The bottom bar is called the Time Scroll Bar and it represents the entire trace file or live capture. The Time Window graphically depicts an interval of time within the overall trace file or live capture. In this example, the Time Window is 1 hour, 15 minutes, and 50 seconds in duration. The Time Window element within the Time Scroll Bar can be resized and moved throughout the file.
Figure 12 Time Control Bars

WiFi Pilot Page 28
The (Current) Selection is that interval in time within the trace file or live capture that we are actually seeing in the View. In the above example, the Selection is within the time interval of the Time Window and thus is depicted there. The duration of the Selection interval and its location with the trace file or live capture can be changed using buttons within the Time Control Ribbon. If an endpoint of the Selection interval is within the Time Window, the user can click and drag on the endpoint to change the size of the Selection interval. The user can also click and drag on the Selection interval to move the location of the entire interval without changing the size of the interval.
Time Control Ribbon
Figure 13 Time Control Ribbon
As we have seen, the Time Control feature of WiFi Pilot allows the user to go “back in time” over a View that has been computed over days, weeks, or months. The Time Control Ribbon provides additional mechanisms for moving through a long-duration View.
Begin
The Begin button allows a user to move the Current Selection interval to the beginning of the View (back-in-time).
Step Back
The Step Back button allows the user to move the Current Selection interval one step back in time where the size of the step is equal to the length of the Current Selection interval.
Step Forward
The Step Forward button allows the user to move the Current Selection interval one step forward in time where the size of the step is equal to the length of the Current Selection interval.
End
The End button allows the user to move the Current Selection interval to the end of the current View.

WiFi Pilot Page 29
Selection Duration
Figure 14 Selection Duration Section of the Time Control Ribbon
The Selection Duration section of the Time Control ribbon provides a number of alternatives for setting the length of the Current Selection interval. Recall that the Current Selection interval corresponds to the portion of the View metric that is displayed in the Charts that make up a View. For example, if the Chart is a strip chart, then the duration of the visible portion of the strip chart is precisely the Current Selection interval. For other charts, the visible portion of the Chart shows the View metric computed of the span of time equal to the Current Selection interval. For example, if the Chart is a conversation ring, then the conversation ring shows the host conversations that have taken place during the Current Selection interval. The Selection Duration section contains some fixed durations to choose from such as 10 seconds, 10 minutes, etc. An All History choice is available too. For a trace file, the All History selection corresponds to the duration of the entire trace file. For a live capture, All History corresponds to going back in time from the present time to the beginning of the capture or an amount of time equal to the Data Retention Time, whichever is smaller. There is also a Custom setting option. Finally, there are Zoom In, Zoom Out, and Zoom to Selection options. Clicking on the Zoom In button reduces the Current Selection interval by 66%. Clicking on the Zoom Out button increases the duration of the Selection interval to 150% of its current duration. If a time duration selection is made in a Strip Chart, the Zoom to Selection button will change the Current Selection interval to the selection made on the Strip Chart.
Time Selection
Figure 15 Time Selection Section of the Time Control Ribbon
The Time Selection section of the Time Control ribbon allows the user to pick the absolute location and duration of the Current Selection interval within the current View (either live or off-line) – set the Start Time, the End Time, and then click on Apply. Create Filter: When the user clicks on the Create Filter button a new Filter is created that will filter out all packets that do not fall within the Current Selection interval. This filter can be used when applying a new View to a source and will filter out all packets that do not fall within the Current Selection interval. This is very useful in comparing two different Views with respect to the same time interval. For example, Bandwidth Over Time and IP Conversations during the same interval to see which hosts were talking during a spike in bandwidth. Copy: Copies the Current Selection interval to the clipboard. Paste: Changes to Current Selection interval to the interval contain on the clipboard.

WiFi Pilot Page 30
Watches
A Watch consists of a Trigger Condition and one of more associated Actions. The idea is that every time the Trigger Condition is satisfied, then the associated Actions are “executed.” Watches are always associated with a View and the Trigger Condition of a Watch is based on the metric computed according to a particular selection within the View.
For example, suppose that the View is Bandwidth Over Time with a Sampling Time of one second and the selected Chart within the View is Packet Bandwidth Over Time. This means that for every second, packets-per-second is computed over the packets that arrived during the previous Sampling Time – this is the quantity shown in the Chart. If a Watch were associated with this Chart, then the Trigger Condition would be checked every second using the computed packets-per-second. In the following sections with show how Watches are created for Strip Charts and Bar Charts.
Creating Watches on Strip Charts and Bar Charts
Figure 16 Strip Chart with Context Menu
In Figure 16 we show the context menu associated with the Packets per Second strip chart within the Bandwidth Over Time View. Right clicking in the Packets per Second chart brings up the context menu. The Add Watch submenu item brings up the Watch Editor panel (Figure 17) which can be used to create a Watch on the metric (Packets per Second) associated with the selected chart.
Note: The Trigger Condition is checked at the underlying Sampling Time intervals,
even if the chart is showing sub-sampled or aggregated data for larger intervals.
Note: Watches can only be applied to Strip Charts and Simple Bar Charts.

WiFi Pilot Page 31
We set up the Watch by completing the necessary items in the Watch Editor panel.
Figure 17 Watch Editor Panel
Name and Description
The Name field is used to assign a name to the Watch and the Description field is used to provide specific details regarding the Watch.

WiFi Pilot Page 32
Severity
Figure 18 Watch Severity
The Severity field contains a drop-down list (see Figure 18) with a number of different “severity” levels. These levels are mainly used to distinguish events (actions) from one another and can be used when searching for specific events.
Enabled
When the Enabled and Running checkbox is checked, the Watch, once it is created, is immediately active. Otherwise, if the box is not checked, the Watch can be created but the Trigger Condition will not be activated until the Watch is enabled.
Trigger Conditions
Figure 19 Trigger Condition
The Trigger Condition elements are shown in Figure 19 and together they represent a Boolean condition, that is, an expression that evaluates to either True or False. The leftmost box contains the value to be tested. Recall that in Figure 16 the Packets (per second) strip chart was selected when the New Watch submenu item was selected. This accounts for the Packets value in the left-most box. The middle box is a drop-down list that contains relational operators that can be selected (see Figure 20 for the list of operators.
Figure 20 Relational Operators
Finally, there is the rightmost box which contains the comparison value. The Trigger Condition in the example shown in Figure 19 is True whenever Packets is greater than 2,300.

WiFi Pilot Page 33
Figure 21 Trigger Condition Expanded
Figure 21 shows the “within” condition and what you get when the Trigger Condition is expanded. The “within” condition requires two values, namely, lower and upper limits in that order. This is also true for the “outside” condition. In the case of the “within” condition, the Trigger Condition is True whenever the value (Packets per second) is less than or equal to the upper limit and greater than or equal to the lower limit.
Expanded Trigger Condition
Expanding the Trigger Condition reveals the “Satisfied for” check box. When the box is checked, then the Trigger Condition becomes the conjunction of the underlying relational expression and the “Satisfied for” condition, that is, both must be True for the Trigger Condition to be True. In the above example (Figure 21), the ”Satisfied for” condition is true whenever the underlying relational expression is true for 4 consecutive seconds. If the Sampling Time is 1 second, then the Trigger Condition is true if the underlying relational expression (Packets is within 2,300 and 4,300 for 4 consecutive seconds). The Expanded Trigger Condition is very useful when we only want to react to a condition if that condition is True for at least a minimum amount of time, in this case 4 seconds.
Figure 22 Sample Choices for Satisfied for
In the above figure we show the contents of the drop-down box for the choice of durations for “Satisfied for.” The duration can be selected from this list or created from scratch using the formats shown in the list.
Multi-Line Strip Charts
In the case of a single line strip chart as in Figure 16, The Trigger Condition is evaluated every Sample Time on the single value computed at each sample point. But what happens with multi-line strip charts where multiple values are computed at each Sample Time? There are two cases: 1. Multiple characteristics are computed for each packet, or 2. the packets are partitioned into multiple categories and a single metric is computed for the packets in each category.

WiFi Pilot Page 34
Single value, multiple packet types
Figure 23 Mult-Line Strip Chart with Filtering
Figure 23 depicts the case where the multi-line strip chart shows Channel Bandwidth Over Time. Each packet is examined and partitioned according to its channel and the bandwidth per second is computed for each channel. In general, a Watch on this strip chart would check the Trigger Condition for each channel for each Sample Time and generate an event for each traffic type for which the Trigger Condition is met. This means that there could be as many events generated at each Sample Time as there are observed channels. If a line selection is made before the Watch is created, Data Filter field will show the set of lines for which the packet bandwidth will be calculated. In Figure 23 we show that two lines, channel 1 and channel 6, have been selected. The Watch Editor acknowledges the line selection under the Data Filter section which automatically appears.
Multiple values, single packet type
Figure 24 Multi-Line Strip Chart without Filtering
Figure 24 shows another type of multi-line strip chart. This example comes from the Frame Size Over Time View in the Generic folder. In this case, the Average, Max, and Min frame sizes are computed for each packet – there are three different values associated with each packet and the lines in the strip chart represent these values. Now different lines are represented as different “values” in the left-hand-side of the Trigger Condition relational expression. See the drop-down box in Figure 24.
Timing Details for Bar Charts
Figure 25 Timing Details
The section called “Timing Details” applies to aggregating charts such as Bar Charts. Strip Charts are not aggregating charts and therefore the Timing Details section is grayed out for strip charts.

WiFi Pilot Page 35
Figure 26 Aggregating Chart
The Current Selection interval in Figure 26 is equal to 1 minutes. The bar chart on the left partitions the incoming packets according to the packet type and counts the number of packets for each packet type. For example, in the left-most chart, there are 271 ACK packets. But there is more to the story. The Current Selection interval is 1 minutes which means that the bars are the sums seen over a 1-munute intervals. In the case of the above chart, the interval is from 17:43:43 to 17:44:43. The length of the aggregation interval for the bar chart is, for convenience, also show in the chart’s tab.
In setting up a Watch for an aggregating chart it is important to specify the interval over which the aggregation takes place. There are two radio buttons in the Timing Details section, and one or the other must be selected. The first one specifies the aggregation back in time from the current time. At each Sampling Time, the value of each bar is determined by aggregating over the aggregation interval specified. The aggregation intervals are overlapping. The second radio button is for specifying non overlapping aggregation intervals. Suppose we wanted to aggregate the total packets over every hour for each packet type. For each hour we would begin a new aggregation interval. This means that for each Sample Time, the aggregation interval extends back to the start of the current hour. Therefore the aggregation interval grows until it reaches one hour and then starts again. In our bar chart example, the aggregation function is SUM. A number of other aggregation functions are used throughout WiFi Pilot, namely, MAX, MIN, AVG, TIME AVG, and others.
Actions
The Trigger Condition is an expression which is evaluated at each Sample Time. Even when the trigger is True, we may want some additional context before we execute the corresponding actions. For example, we may only want to execute the associated actions when the Trigger Condition makes a transition from False to True on successive Sample Times. These additional conditions are called Transition Conditions.
Transition Conditions
Note: It is important to point out that the Timing Details lets us set an aggregation
interval for the Watch that is independent of the aggregation associated with the
Current Selection interval.

WiFi Pilot Page 36
Figure 27 Transition Conditions
Figure 27 shows the contents of the drop-down box. These are the Transition Conditions that are used, in conjunction with the Trigger Condition, to determine when the associated actions are to be executed. The icons are suggesting: leading edge, every time; leading edge, only once; trailing edge, every time; and every time.
Every time the condition becomes true. Actions are executed whenever the Trigger Condition is True on the current Sample Time and was False on the previous Sample Time. The Actions are also executed if the Trigger Condition is True when the Watch is activated (i.e., before there is any history for the Watch).
Only the first time the condition becomes true. Actions are executed the first time the Trigger Condition is true on a Sample Time and was False on the previous Sample Point. The Actions are also executed if the Trigger Condition is True when the Watch is activated (i.e., before there is any history for the Watch). The Actions are executed at most one time.
Every time the condition becomes false. Actions are executed whenever the Trigger Condition is False on the current Sample Time and was True on the previous Sample Time. The Actions are also executed if the Trigger Condition is True when the Watch is activated (i.e., before there is any history for the Watch).
Every time the condition is true. Actions are executed whenever the Trigger Condition is True.
Notify Me
The Notify Me action is always executed and makes a record of the event on the strip chart and in the Events panel.
Figure 28 Event Notifications

WiFi Pilot Page 37
Figure 28 shows how the event notifications appear on a strip chart and in the Events panel. Notice that the event selected in the Events panel is highlighted in the strip chart and also on the Time Window. If a vertical line representing an event on the strip chart is selected, the corresponding event is shown as selected in the Events panel and in the Time Window. Moreover, if the event line is selected in the Time Window, it is shown as selected in both the Events panel and the strip chart.
Figure 29 Event Structure
The Event Structure begins with a circle with the color corresponding to the color of the Watch Severity. The following number is the event Unique ID followed by the Name of the event. This is followed by the date and time at which the event occurred. The second line begins with the Trigger Condition and the value, in parentheses, that caused the Trigger Condition to be true followed by the “line” that was selected in the strip chart when the Watch was defined.
Send an email with the Watch event details
Start a packet capture
Figure 30 Email Action
If “Send email with the Watch event details” is selected the Send Email Parameters Editor appears. This should be filled in with the mail server information, account, and destination email addresses. When the Action occurs, email will be sent to the destination email addresses with the Event information.
Figure 31 Capture Packets Panel
When “Start a packet capture” is selected the panel in Figure 31 appears. The File name is a mandatory field and specifies the absolute path name of the capture file to be created. The “Packets to Capture,” “Bytes to Capture,” and “Seconds to Capture” are stopping conditions, whichever comes first. An optional Filter String can be specified along with the Filter Type. When the event occurs, a packet capture will be initiated and terminated according to the stopping conditions.

WiFi Pilot Page 38
Send a remote syslog message over UDP
Run a program on the Pilot Probe
Send a message to a Twitter account
Log the events in the Windows event log
Figure 32 Send to Remote Syslog
Send a syslog message using UDP to a remote host.
Figure 33 Run a Program
Enter the Program Name (complete path name) and any arguments.
Note: Note that Pilot Probe refers
to the local machine on
which WiFi Pilot is running.
Figure 34 Send to Twitter Account
Enter Twitter account information and a Message. The message will be sent to the Twitter account for every event instance.
The event will be entered into the local Windows event log. The Severity corresponds to the Windows severities.

WiFi Pilot Page 39
Log the events in a CSV file on the Pilot Probe
Watches/Events Ribbon
Figure 37 Watches and Events Ribbon
Add Watch
Figure 38 Add Watch
The Add Watch button is enabled when there is either a strip chart or bar chart selected within the current View. Clicking on the Add Watch button brings up the Watch Editor panel for creating a new Watch for the selected chart within the current View.
Edit Selected Watch
Figure 39 Edit Watch
With a Watch selected in the Sources panel, the Edit button brings up the Watch Editor. The Watch parameters can be modified with the Watch Editor.
Remove Selected Watch
Figure 40 Remove Watch
With a Watch selected in the Sources panel, the Remove button is used to remove the Watch and all of the associated events in the Events panel
Figure 35 Send to Windows Event Log
Figure 36 Send to CSV File
The event will be written as a CSV file using the complete pathname provided in the Action Editor.
Note: Note that Pilot Probe refers
to the local machine on
which WiFi Pilot is running.

WiFi Pilot Page 40
Enable Selected Watch
Figure 41 Enable Watch
With a disabled Watch selected in the Sources panel, the Enable button will cause the Watch to become active.
Pause Selected Watch
Figure 42 Pause Watch
With an enabled Watch selected in the Sources panel, the Pause button is used to disable (or pause) the Watch. During the time the Watch is disabled, no events will be generated.
Filtering Events Section
Figure 43 Events Panel
When there are multiple Watches, or even a single Watch, it is possible to generate a very large number of Events. Sorting through these looking for significant ones can be daunting. The Events Panel has a search box that can be used to isolate events of interest. Another possibility for filtering events can be found in the middle sections of the Watches/Events ribbon.

WiFi Pilot Page 41
Figure 44 Event Filtering Section of the Watches/Events Ribbon
In Figure 44 we show the sections on the Watches/Events ribbon that deal with locating Events by filtering on:
Views Filter
Severity Filter
Watches and Events Filter
Views Filter
This section of the ribbon deals with filtering Events based on their associated Views.
No Filters is selected. Filtering on View is disabled
Current View is selected. The Views Filter selects only those Events that are associated with the Current View
Pinned Views is selected. The Pin List contains a list of Views that have been “Pinned.” When Pinned Views is selected, the Views Filter selects only those Events that are selected with some View in the “Pin List”
Add to Pin List
Figure 45 Add to Pin List
With a View selected in the Sources Panel, clicking on Add to Pin List will add the selected View to the Pin List.
(Show the) Pin List
Figure 46 (Show the) Pin List
The Pin List button is active whenever there is at least one View in the Pin List. Clicking on the Pin List button (when it is active), will show the Pin List.
The Pin List
Figure 47 The Pin List
The Pin List itself shows the pinned views and their sources. The sources can be either live or a trace file. Views can be removed from the Pin List by clicking on the corresponding check boxes.
Note: The events filter that results from these three filter sections is the conjunction of
the filtering provided by the individual sections.

WiFi Pilot Page 42
Severities Filter
Figure 48 Severities Filter
The Severities Filter section allows us to add filters on the Event severities. The three choices are disjoint.
All Severities. This is equivalent to no Severity filtering.
High Severities. High severities are defined to be Error or higher – Error, Critical, Alert, and Emergency.
Severities (List). When this button is selected, the Events are filtered on the severity levels in this list. The list can be set/reset by clicking on the down-arrow.
Severities List
Figure 49 Severities List
The Severities List contains the severities that will be used by the severities filter. The selected severities are those with the checks. Severities can be selected or un-selected using the check boxes.
Watches and Events Filter
Figure 50 Watches and Events Filter
Event filtering based on the corresponding Watch Name, Watch Description, Event IDs, or Time Interval.
Time Filter
Figure 51 Time Selection
The Start and End times can be filled in manually, or the Paste operation can be used. Typically, the clipboard is carrying a time interval that was obtained using the copy operation in the Time Selection section of the Time Control ribbon. Conversely, if the time interval is available, the Copy operation can be used to save the interval to the clipboard for use in making time selections by pasting it into the Time Selection section of the Time Control ribbon.
Apply

WiFi Pilot Page 43
Figure 52 Apply Button
Once all of the parameters in the Watches and Events Filter have been set, click on the Apply button for the filter to take effect.
Note: The Watches and Events Filter does not take effect until the
user clicks on the Apply button.
Events Overlay Section
Figure 53 Events Overlay Section
By selecting the Overlay Enabled button, the radio buttons are enabled.
Source Chart. Only show the events in a Chart of the Watches that are associated with the Chart. This is the usual case where you see the events only in the chart where the Watch was created.
Source View. Show events associated with all of the Watches in a View in each Chart of a View. This is generally used when one of the charts in a View has a Watch and you want to see these events displayed in the other charts in the View.
All Views. Show all the events of all the Watches in all of the charts of all of the Views. Is often used if only one chart has a Watch and you want to see where these events occur in the charts of all of the other Views.
Predefined Watches
The Views panel contains a folder named “Watches.” In Figure 54 we show the expanded Watches folder.

WiFi Pilot Page 44
Figure 54 Predefined Watches
The expanded Watches folder contains 4 entries. Each of these entries consists of a View plus a Watch which is associated with the View. For Example, the Detect Rogue APs is a bandwidth threshold view (Packets/s > 0) with an associated Watch that is filtering on the mac vendor strings specified the Pilot filter: “!(p_mac::source_mac.vendor.str contains "cisco")”. This View/Watch combination can be applied to either a live or off-line source just like any other View. However, when it is applied, the Watch Editor automatically appears to be filled in with the usual parameters. In this case a Filter Settings section is made available to further modify the Watch before applying the View/Watch combination.
Figure 55 Watch Editor Panel with Filter Settings
Figure 55 shows the watch editor for the Bandwidth Threshold predefined Watch. In addition to the usual Watch settings, the user can specify Filter Settings to select specific traffic types.

WiFi Pilot Page 45
Once the combined View/Watch is applied, it behaves exactly the same as if the View and the Watch were each applied independently – the View/Filter to the source and the Watch to the View.
Reporting Ribbon
Figure 56 Reporting Ribbon
The Reporting Ribbon is used to create and manage reports created from views. Certain sections and buttons of the ribbon are disabled by default. Reports can be made from one view or from all open views. Reports can be generated for a number of different file formats in a single batch operation. Many things can be customized in a generated report. The ribbon will be discussed top-to-bottom, left-to-right, broken up by section.
Generate Report
This section manages how the reports are generated without concern for the style, layout, or what is included in a report. It instead, specifies the format, and how to manage post generation of reports.
Current View
Icon 19 Current View
The Current View button is used to generate a report using the current view. In order for this to work, a view must be the foremost tab. Under any other situation, this button is disabled. This button and the next button, “All Views” act differently depending on the settings of the final two buttons of the section, Format and Open Reports.
All Views
Icon 20 All Views
The All Views button is used to generate a report using all open views. This button and the previous button, Current View, act differently depending on the settings of the final two buttons of the section, Format and Open Reports.
Format
Note: Filters that appear in predefined View/Watch combinations are placed between
the source and the View to filter out unwanted packets before being processed
by the View. The Watch is subsequently applied to the metrics produced by the
View.
Icon 21 Format
The Format button opens a submenu that specifies one or more export formats. These selections are saved in the global configuration file. By default, only the PDF option is selected.
The meaning of each check box is as follows:
PDF Report The PDF Report checkbox refers to a PDF 1.4 (Acrobat 5.x or newer) PDF document

WiFi Pilot Page 46
Open Reports
Figure 57 Open
Reports
The Open Reports check box, selected by default, works in the following way:
When On Pressing the Current View or All Views button instantiates the appropriate helper applications to be open with the generated reports. For instance, if generating Word and HTML formatted reports, then the default word processor and web browser will open and display the reports.
When Off No programs are opened when a report is generated.
Management
Generated reports are saved to a user-specified directory. The default directory is the “My Documents” (or language equivalent) directory in the users “Documents and Settings” (or language equivalent) directory. This can be changed as desired. The Management section provides a convenient way to get to the directory, manage recently created reports, and change the report directory.
Recent
Submenu 5 Format
generated with all security turned off. Generated documents have been tested to generate correctly with Acrobat Reader, ghostview 3.6.2, and xpdf 3.01. Zip Package The Zip Package check box refers to a ZIP file with the following contents:
Each trace file analyzed in the report.
The MD5 cryptographic digests (if enabled) of the trace files.
The PDF version of the report. Excel Spreadsheet The Excel Spreadsheet check box refers to an excel spreadsheet with the tabular data of the report in a way that can be used to generate further graphs and charts with the spreadsheet graphing options that are available in Excel. Word Document The Word Document check box refers to a “Rich Text Formatted” (RTF) document that can be viewed in Microsoft Word. Text File The Text File check box refers to a plain text document. Naturally, no images are available, but the image data is made available in tabular form.
HTML Page The HTML Page check box refers to a generated HTML page and a directory containing the images of the relevant charts in PNG format. The HTML is compatible with all major modern web browsers.
The Recent button opens a submenu to manage recently generated reports. By default, before reports are generated, the Recent button is disabled.

WiFi Pilot Page 47
Change Folder
Icon 23 Change
Folder
The Change Folder button changes where future generated reports will be saved.
Browse Folder
Icon 24 Browse
Folder
The Browse Folder button opens a browser window to determine the folder where future reports will be saved in the Windows Explorer shell.
Settings
The Settings section manages what will go on the cover page of the report, if it is to exist (See the section on the Report Designer about how to turn it off).
Title
Figure 58 Title
The Title edit box specifies what to call subsequently generated reports. The title goes on the cover page if the page is included in the report generation. See the section on the Report Designer Ribbon that follows for more information.
Analyst/Client Information
Icon 22 Recent
After a report is generated, a reference to it is placed in the Recent sub menu list. The list holds at most, the five most recently generated reports and may be cleared at any time. Note that the clear operation does not physically remove any file from disk but simply clears it from the referential list inside of WiFi Pilot.
Submenu 6 Recent Reports
Each submenu item has in turn, another submenu to open one of the formatted reports from the generated report package. Additionally, reports can be renamed and removed irrevocably from disk.
Submenu 7 Recent Reports (Detail)
Icon 25 Analyst/Client Information
The Analyst/Client Information button presents a submenu that specifies what information will appear on the cover page of a report. Each field is directly analogous to what will appear on the cover page. Refer to the appendix on the example report for more information.

WiFi Pilot Page 48
Report Designer
Icon 26 Report
Designer
The Report Designer button opens a new tab in the ribbon bar to do specific design actions on subsequently generated reports. This ribbon is described below.
Submenu 8 Analyst/Client Information

WiFi Pilot Page 49
Report Designer Ribbon
Figure 59 Report Designer Ribbon
The Report Designer ribbon is not always available. It is a contextual ribbon that only appears when reports are being designed. In order to get to it, click the Report Designer button at the end of the Reporting ribbon (described at the end of the previous section).
When clicked, a generic template report appears as a tabbed window which does not correspond to any specific data from a view. All changes made in the report designer take effect immediately and there is no need to save when exiting the designer.
Additionally, the designer can be left open while generating reports for quick changes. Note that any changes made to the template via the report designer will only affect how subsequent reports are generated.
Styles
Figure 60 Styles
The Styles section controls the themed look and feel of subsequent reports. There are five choices to choose from and each can be viewed by simply hovering over them with the mouse. A theme can be selected and set as the default by clicking on it. In the depiction on the left for instance, the first style is selected.
Includes
The Includes section has options that determine what is presented inside a report.
Change Logo
Icon 27 Change Logo
The Change Logo button is used to specify the logo that will go in the upper right hand side of the cover page of all subsequent reports.
Table of Contents
Figure 61 Table of
Contents
The Table of Contents check box (checked by default) is used to specify whether to include a table of contents in subsequent reports.
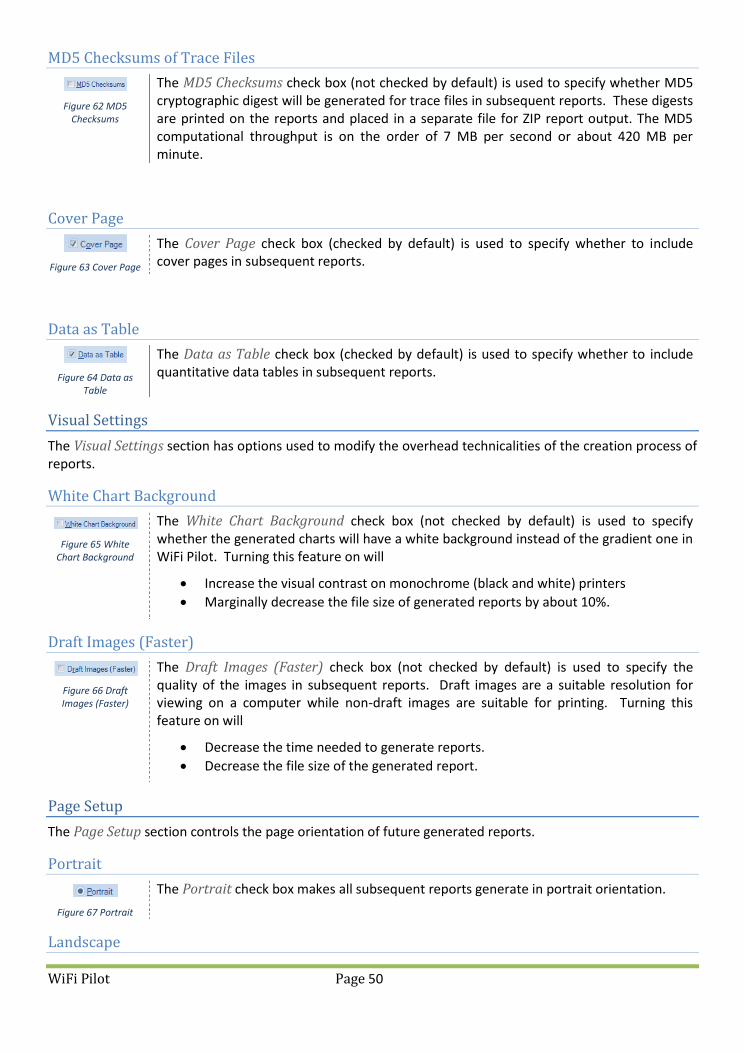
WiFi Pilot Page 50
MD5 Checksums of Trace Files
Figure 62 MD5
Checksums
The MD5 Checksums check box (not checked by default) is used to specify whether MD5 cryptographic digest will be generated for trace files in subsequent reports. These digests are printed on the reports and placed in a separate file for ZIP report output. The MD5 computational throughput is on the order of 7 MB per second or about 420 MB per minute.
Cover Page
Figure 63 Cover Page
The Cover Page check box (checked by default) is used to specify whether to include cover pages in subsequent reports.
Data as Table
Figure 64 Data as
Table
The Data as Table check box (checked by default) is used to specify whether to include quantitative data tables in subsequent reports.
Visual Settings
The Visual Settings section has options used to modify the overhead technicalities of the creation process of reports.
White Chart Background
Figure 65 White
Chart Background
The White Chart Background check box (not checked by default) is used to specify whether the generated charts will have a white background instead of the gradient one in WiFi Pilot. Turning this feature on will
Increase the visual contrast on monochrome (black and white) printers
Marginally decrease the file size of generated reports by about 10%.
Draft Images (Faster)
Figure 66 Draft Images (Faster)
The Draft Images (Faster) check box (not checked by default) is used to specify the quality of the images in subsequent reports. Draft images are a suitable resolution for viewing on a computer while non-draft images are suitable for printing. Turning this feature on will
Decrease the time needed to generate reports.
Decrease the file size of the generated report.
Page Setup
The Page Setup section controls the page orientation of future generated reports.
Portrait
Figure 67 Portrait
The Portrait check box makes all subsequent reports generate in portrait orientation.
Landscape

WiFi Pilot Page 51
Figure 68 Landscape
The Landscape check box makes all subsequent reports generate in landscape orientation.
Display
The Zoom section is used to control the magnification of the report template.
Zoom Amount
Figure 69 Zoom Amount
The Zoom Amount drop down specifies the magnification of the template in the report designer.
Decrease Zoom
Icon 28 Decrease Zoom
The Decrease Zoom button decreases the magnification level of the template in the report designer by 10%.
Increase Zoom
Icon 29 Increase Zoom
The Increase Zoom button increases the magnification level of the template in the report designer by 10%.
Width
Icon 30 Zoom Width
The Screen Width button changes the magnification level of the template in the report designer so the width of a page matches all that is available in the tab.
Page
Icon 31 Zoom Page
The Page Height button changes the magnification level of the template in the report designer so that an entire page can be viewed.

WiFi Pilot Page 52
Close Designer
Icon 32 Close Designer
The Close Designer button closes the report designer ribbon and template view tab. Since all changes are immediate, there is not prompt to save for changes.

WiFi Pilot Page 53
Sources Panel
The Sources Panel has two tabs, namely, Devices and Files.
Figure 70 Sources Panel
The Sources Panel contains representations of the AirPcap interface, and trace files and is one of the most important parts of WiFi Pilot. It has two tabs, “Devices” and “Files”. These can be cycled through by clicking on them. The meaning of each is the following:
Devices The Devices tab contains a representation of the AirPcap live sources of wireless network traffic. Figure 70 depicts an AirPcap interface representing 3 channels of AirPcap devices.
Files The Files tab contains representations of local folders and trace files. WiFi Pilot will only analyze trace files that are created through the capture of wireless traffic.
Figure 71 Devices and Files Tabs
The Devices and Files panel has two tabs. Clicking on the tabs switches between displaying the devices and the trace files. For instance, on the left hand side and in the previous image, the “Devices” tab is selected.
Devices
WiFi Pilot supports multiple AirPcap wireless capture devices.
Wireless Adapters
Icon 33 Wireless Adapter
Normal wireless adapters in Windows are not designed to do packet capture and analysis. CACE Technologies AirPcap adapters are made specifically to do packet capture and network analysis and are currently the only wireless adapters supported. Additionally, multiple AirPcap Adapters are shown as a single device because the wireless adapters share the same airspace and, all adapters being equal, any one adapter can receive the same traffic as any other. Therefore, WiFi Pilot will internally break up tasks among multiple adapters so that many channels can be scanned and locked without having to worry about which channel a particular physical adapter scans and locks on.

WiFi Pilot Page 54
Context Menus in the Devices Panel
There are three types of Context Menus in the Devices panel which will appear under the three conditions below:
With Nothing Selected
Context Menu 1 Devices
Panel (No Selection)
With nothing selected, the options are as follows:
Refresh Sources The Refresh Sources menu option must be executed if you want WiFi Pilot to rescan the available AirPcap adapters and display the currently available devices. Additionally, the trace folders are rescanned and updated to reflect whether files have been removed or modified.
With an Interface Selected
With a View Selected
Context Menu 2 Devices
Panel (Interface Selected)
With an interface selected, the options are as follows:
Refresh Selected The Refresh Sources menu option must be executed if you want WiFi Pilot to rescan the available interfaces and display the currently available devices. Additionally, the trace folders are rescanned and updated to reflect whether files have been removed or modified.
Send to Wireshark The Send to Wireshark menu option instructs WiFi Pilot to start up Wireshark and send all traffic from the selected interface to Wireshark.
Send to Wireshark with Filter The Send to Wireshark with Filter menu option instructs WiFi Pilot to start up Wireshark and send all traffic from the selected device to Wireshark that matches a specified user-defined filter configured through the filter dialog box, which will appear first. The Filter Dialog Box is explained in a later section.
Send to File The Send to File menu option instructs WiFi Pilot to send all traffic from the selected device to a user-specified trace file.
Send to File with Filter The Send to File with Filter menu option instructs WiFi Pilot to send all traffic from the selected device to a user-specified trace file with a filter defined in the filter dialog box, which will appear first. The Filter Dialog Box is explained in a later section.
Context Menu 3 Devices Panel (View Selection)
With a View Selected:
Generate Report The Generate Report menu option generates a report from the selected View.
Detach The Detach menu item “closes” the View in the Main Window but does not stop the analysis engine from continuing to calculate the View metric applied to a live

WiFi Pilot Page 55
With a Detached View Selected
Files
Figure 72 Files Panel (Empty)
The Files Panel contains representations of folders and trace files. WiFi Pilot can analyze wireless trace files of arbitrary size in the PCAP capture format with the following restrictions: trace files must have either a RadioTap3 or PPI4 header. That is, WiFi Pilot will not open non-802.11 trace files, such as trace file resulting from a capture on an Ethernet interface. This includes captures made though a non AirPcap wireless adapter like the ones used on laptops for connecting to a WLAN.
Importing Trace Files
Trace files can be imported the following ways:
Creating one There are various ways traffic can be sent to a file such as by context clicking on the AirPcap device and choosing the “Send to File” option. Whenever anything is sent to file, it is stored on disk and upon completion of the operation, the file will appear in the Files panel in the appropriate folder and ready for use by WiFi Pilot.
Context menu Described below, files can be imported by bringing up a context menu in the Files Panel.
Home Ribbon Described in the Home Ribbon’s Trace File section, there are buttons that do identical functionality to those in the context menu with respect to importing files.
3 NetBSD: http://netbsd.gw.com/cgi-bin/man-cgi?ieee80211_radiotap+9+NetBSD-current
4 CACE Technology: http://www.cacetech.com/documents/PPI_Header_format_1.0.1.pdf
source. The View remains in the Devices panel as if it were applied to the live interface, but it is grayed out and appears inactive. Close If the user is the creator of the selected View, then the Close menu option will close the selected View.
Context Menu 4 Devices Panel (View Selection)
With a Detached View Selected:
Attach The Attach menu option opens the View in the WiFi Pilot main window. This reverses the change made with the Detach menu item was applied to this View.
Close If the user is the creator of the selected View, then the Close menu option will close the selected View.

WiFi Pilot Page 56
Figure 73 Files Panel (Expanded)
When importing trace files, a hierarchical tree will form that can be expanded and collapsed. Every trace file will have a parent directory which may or may not have its own parent and so on. Multiple directory roots may exist as shown in Figure 73. Note that in WiFiPilot, Views may only be applied to trace files with PPI or RadioTap headers. In Figure 73, Views may not be applied to daily.pcap – this trace file does not contain 802.11 traffic.

WiFi Pilot Page 57
Context Menus in the File Panel
The context menus for the File Panel are described below:
With Nothing Selected
Context Menu 5 Files Panel (No
Selection)
The options are as follows:
Refresh Sources The Refresh Sources menu option must be executed if you want WiFi Pilot to rescan the available interfaces and display the currently available devices. Additionally, the trace folders are rescanned and updated to reflect whether files have been removed or modified.
Add a Trace File The Add a Trace File menu option adds a trace file to the Files panel for analysis. This operation only adds a reference to the file and is not a copy operation. If the file moves on disk, the reference will be no longer valid.
Add a Folder The Add a Folder menu item adds a directory of trace files to the Files panel for analysis. The selected folder is scanned for all supported trace files and WiFi Pilot will only import applicable files. Similar to the add trace file operation, this operation adds a reference to the folder and relevant files and does not copy anything on disk. Furthermore, this operation is not recursive and does not scan subfolders.
Clear Trace Files The Clear Trace Files button clears the list of trace files in the Files panel.
With A Trace File Selected
Context Menu 6 Files Panel (Trace
File Selected on Local System)
With a trace file selected, the options are as follows:
Send to Wireshark The Send to Wireshark menu option starts up Wireshark and sends all traffic from the selected trace file there.
Send to Wireshark with Filter The Send to Wireshark with Filter menu option starts up Wireshark and sends all traffic from the selected trace file there that matches a specified user-defined filter configured through the filter dialog box, which will appear first. The Filter Dialog Box is explained in a later section.
Send to File The Send to File menu option sends all traffic from the selected trace file to a user specified trace file. This is a useful function because it allows for the decryption of traffic to be exported as a decrypted trace file.
Send to File with Filter The Send to File with Filter menu option sends all traffic from the selected trace file in a user specified trace file with a filter to be defined in the filter

WiFi Pilot Page 58
With A Trace Folder Selected
dialog box, which will appear first. This is a useful function because it can greatly reduce the size of a trace file to only those packets of interest. The Filter Dialog is explained in a later section.
Browse Containing Folder The Browse Containing Folder menu option opens a Windows Explorer window pointed to the folder of the selected trace file.
Cut The Cut menu option obtains a reference to the “to-be-cut” trace file. When the Paste operation is invoked, the file is copied to the “paste” location and removed from the original location only if the paste location references the same system as the Cut operation.
Copy The Copy menu option obtains a reference to the “to-be-copied” trace file. When the Paste operation is invoked, the file is copied to the “paste” location and is NOT removed from the original location.
Paste The Paste menu option will copy a previously Cut or Copied file to the selected Paste location.
Calculate Checksum (MD5) The Calculate Checksum (MD5) menu option calculates the MD5 cryptographic digest of the selected trace file and presents it in a window. This value is remembered and will be used later in tooltips and reports if applicable.
Delete The Delete menu option removes the selected trace file from disk. The trace file is not sent to the recycle bin.
Remove from List The Remove from List menu option removes the selected trace file’s reference from the Files List, but not from the local file system.
Rename The selected trace file can be renamed using the Rename menu option. The file name is renamed in the Files Panel and also on the local file system.
Context Menu 7 Files Panel (Trace Folder Selected on Local System)
With a trace folder selected, the options are as follows:
Refresh Selected The Refresh Selected menu option rescans a folder for new trace files and updates the status of those already added.
Browse Folder The Browse Folder menu option opens an explorer window pointed to the selected folder.
Cut The Cut menu option obtains a reference to the “to-be-cut” folder. When

WiFi Pilot Page 59
With a View Selected
With a Detached View Selected
the Paste operation is invoked, the folder and its contents are copied to the “paste” location and removed from the original location only if the source and destination are on the same system. If the source and destination are on different systems, then Cut behaves like a Copy operation.
Copy The Copy menu option obtains a reference to the “to-be-copied” folder. When the Paste operation is invoked, the folder is copied to the “paste” location and is NOT removed from the original location.
Paste The Paste menu option will copy a previously Cut or Copied file to the selected Paste location.
New Folder The New Folder menu option removes all trace files from the Files panel with respect to the selected folder that do not have a view open on them.
Remove from List The Remove from List menu option removes all trace files from the Files panel with respect to the selected folder that do not have a view open on them.
Delete Trace Files The Delete Trace Files menu option irrevocably deletes all trace files from the Files panel with respect to the selected folder that do not have a view open on them.
Context Menu 8 Devices Panel (View Selection)
With a View Selected:
Generate Report The Generate Report menu option generates a report from the selected View.
Detach The Detach menu item “closes” the View in the Main Window but the View metric that was computed over the trace file is saved by the analysis engine. The View remains in the Files panel as if it was applied to the trace file, but it is grayed out and appears inactive. Close If the user is the creator of the selected View, then the Close menu option will close the selected View.
With a Detached View Selected:
Attach The Attach menu option opens the View in the WiFi Pilot main window. This reverses the change made with the Detach menu item was applied to this View.
Close

WiFi Pilot Page 60
Context Menu 9 Devices Panel (View Selection)
If the user is the creator of the selected View, then the Close menu option will close the selected View.

WiFi Pilot Page 61
Tooltips
The Files panel has two tooltips. They occur when hovering over the following:
Folder
File
Folder
Tooltip 1 Files Panel Folder
The Folder tooltip shows the full path of the folder the mouse is hovering over and how many trace files and folders were found in it.
File
Tooltip 2 Files Panel Trace File
The File tooltip shows the full path of trace file the mouse is hovering over along with the three metrics:
Created On The date the trace file was created on.
Size The kilobyte size of the trace file.
Link Type The link type of the trace file. This is important because the WiFi Pilot Views can only be applied to 802.11 trace files.
Additionally, if the MD5 cryptographic digest is computed for the trace file via the “Calculate Checksum (MD5)” option in the context click menu described above, then it will also get placed in the tooltip list.

WiFi Pilot Page 62
Views Panel
Using Views
Views are applied to one of the following:
AirPcap Devices or Trace Files
Selections within Views (also known as Drill Down)
Applying a View
Views can be applied to an AirPcap device or trace file in the following ways:
Figure 74 Views Library
Figure 75 Instance of a View
A View in WiFi Pilot represents a specific set of calculations that can be applied to both live and off-line (trace files) sources. The calculations associated with a View are called the View metrics. These metrics are visually presented to the user in terms of Charts. Charts graphical elements within a Chart are selectable such as bars within a bar chart and time intervals within a strip chart, etc.
Each view is depicted in the following format: [Icon] [Name] ([Sampling Time] - [Data Retention
Time])
For example, in Figure 74:
The Icon denotes the link type(s) of the source to which the View applies. In the case of WiFi Pilot, the only live View source is the Airpcap interface.
o 802.11 link type
The View’s name is “Discovery – Aps and Stations”
The Sampling Time is 1 second and so the associated metric is computed for every second.
The Data Retention Time is 1 day (1d), which means that once a day’s worth of samples are calculated, the oldest samples will be dropped as new samples are calculated. This parameter is only used for live sources. In the case of trace files, all of the samples over the duration of the trace file are retained.
The above parameters can be changed and multiple instances of a view can exist with different parameters by utilizing the custom views as explained below. The name of the custom view can also be changed to whatever is desired.
The Views panel above has four sections, which from bottom to top are:
View Library
Recently Used
Custom Views
Search Text Box

WiFi Pilot Page 63
Double Clicking on a View When double clicking on a view, it is applied to the currently selected device or file, depending on which tab is open.
Pressing Enter on a View This operation has identical consequences to the double click previously described.
Dragging the View on to the Device, File, or Open View This is similar to the above method, however, a view can be dragged on to any device or file. Additionally, after doing a selection within a chart in an open view, a view can be dragged on to the chart. The significance of this operation is that the view will be applied to the subset of data that is selected.
Drill Down button in the Home Ribbon and Chart context menu option The effects the same result as applying a view to a selection as described above, however, achieved through a different set of operations. Every chart has a context menu option of “Drill Down” that lists the Custom, Recently Used, and View Library. This context menu option is enabled when a selection is made in the chart. Selecting one of the views results in the view being applied to the subset of data selected. The drill-down menu button works identically and is there to accommodate different usage patterns.
Applying a View with a Filter
The first three ways of selecting a view have a special meta-command operation. When holding down the control key and applying a view either by
Double Clicking
Pressing Enter
Dragging and Dropping
A filter dialog box opens. At this point, a filter can be specified to apply the view with. The Filter Dialog is explained in a later section.
View Library
The View Library is the main repository of all the views available in WiFi Pilot. Views are divided into folders which are, in some cases further subdivided.
Context Menus
The view library has two types of context menus. They are triggered when right clicking on either of the following:
Folder
View
Folder
Context Menu 10 View Library
Folder
The context menu for a folder in the view library section has the following options:
Apply The Apply menu option applies all the views in the currently selected folder to the selected device or file in the Devices and Files panel.
Apply with Filter The Apply with Filter menu option applies all the views in the currently selected folder to the selected device or file in the Devices and Files panel with a specified

WiFi Pilot Page 64
View
filter. The Filter Dialog (described later) pops up when this option is selected.
Apply as a Report The Apply as a Report menu option automatically creates a report with the “All Views” option as all the views in the currently selected folder applied to file selected in the Files panel. This menu option is disabled when a device is selected.
Copy to Custom The Copy to Custom menu option copies the currently selected folder to the Custom folder (described later).
Context Menu 11 View Library
View
Context Sub Menu 1 Sampling
Time
Context Sub Menu 2 Data
Retention Time
The context menu for a view in the view library section has the following options:
Apply The Apply menu option applies the selected view to the selected device or file in the Devices and Files panel.
Apply with Filter The Apply with Filter menu option applies the selected view to the selected device or file in the Devices and Files panel with a specified filter. The Filter Dialog (described later) pops up when this option is selected.
Apply as a Report The Apply as a Report menu option automatically creates a report with the “All Views” option to the selection view applied to the file selected in the Files panel. Apply as a Report cannot be applied to a live interface.
Sampling Time The Sampling Time menu option is very important. It specifies the ultimate granularity in time of the calculation of the corresponding View metric. All of the metrics shown refer to those that are calculated with reference to a specific time period; by default, usually a second. However, this time period is variable and can be changed to other values (which are shown in the contextual submenu). The value selected is shown at the end of the textual representation of the views in the Views Library along with the Data Retention Time value (described next).
Data Retention Time The Data Retention Time and the Sampling Time menu options are very important options that determine the calculation of View metrics for live sources. The Data Retention Time value is the time period of the View metric history that is retained for a View applied to a live source. Once the Data Retention Time is reached, the oldest View metrics are discarded as new sample points are calculated. The Data Retention time has no effect on the duration of the View metrics retained for trace files. In the case of trace files, the complete View metric over the duration of the trace file is retained.
Copy to Custom The Copy to Custom menu option copies all the views in the currently selected folder to the Custom section (described later).

WiFi Pilot Page 65
Tooltips
Tooltips for the View Library act as documentation for the views. They are made visible by hovering over the icon for a view or folder. All of the tooltips for the Views are available in the Appendices.
Recently Used
The Recently Used folder contains the five most recently used views. The Recently Used folder is not shown when the folder is empty. This is the case when WiFi Pilot is started and whenever the Clear Recently Used List menu item is selected.
Context Menus
The Recently Used section has two types of context menus. They are triggered by right clicking on either of the following:
Recently Used Folder
View within the Recently Used Folder
Recently Used Folder
Custom Views
Custom Views are the regular views in the views library with different settings. At the view level, the chart window positions and sizes are saved. At the chart level it varies. In the description of the charts it is noted whether the option is saved or not in a custom view.
Context Menus
The Custom section has two types of context menus. They are triggered when right clicking on either of the following:
Folder (including the root “Custom” folder with the star icon)
View
Context Menu 12 Recently
Used Folder
The context menu for a folder in the recently used section has the following options:
Apply The Apply menu option applies all the views in the recently used folder to the selected device or file in the Devices and Files panel.
Apply with Filter The Apply with Filter menu option applies all the views in the recently used folder to the selected device or file in the Devices and Files panel with a specified filter. The filter dialog (described later) pops up when this option is selected.
Apply as a Report The Apply as a Report menu option will automatically create a report with the “All Views” option as all the views in the recently used folder applied to the file selected in the Files panel. Apply as a Report cannot be applied to a device.
Clear Recently Used List The Clear Recently Used List removes the references to all of the views in the Recently Used folder. The Context menus for Views within the Recently Used Folder are identical to those when applied to Views in the View Library.

WiFi Pilot Page 66
Custom Folder
Folder within the Custom Folder
Context Menu 13 Custom
Folder
The context menu for the Custom folder has the following options:
Apply The Apply menu option applies all the views in the selected folder in the custom section to the selected device or file in the Devices and Files panel.
Apply with Filter The Apply with Filter menu option applies all the views in the selected folder in the custom section to the selected device or file in the Devices and Files panel with a specified filter. The filter dialog (described later) pops up when this option is selected.
Apply as a Report The Apply as a Report menu option automatically creates a report with the “All Views” option as all the views in the selected folder in the custom section applied to the file selected in the Files panel. The Apply as a Report menu option cannot be applied to a device.
Create Subfolder The Create Subfolder opens a dialog that prompts for the name of a to-be created subfolder in the custom section.
Clear Custom The Clear Custom menu option removes the references to all of the views in the selected folder in the custom section.
Context Menu 14 Custom
Folder
The context menu for a folder within the Custom folder has the following options:
Apply The Apply menu option applies all the views in the selected folder in the custom section to the selected device or file in the Devices and Files panel.
Apply with Filter The Apply with Filter menu option applies all the views in the selected folder in the custom section to the selected device or file in the Devices and Files panel with a specified filter. The filter dialog (described later) pops up when this option is selected.
Apply as a Report The Apply as a Report menu option automatically creates a report with the “All Views” option as all the views in the selected folder in the custom section applied to the file selected in the Files panel. The Apply as a Report menu option cannot be applied to a device.
Create Subfolder The Create Subfolder opens a dialog that prompts for the name of a to-be created subfolder in the custom section.
Clear Folder The Clear Custom menu option removes the references to all of the views and sub folders in the selected folder in the custom section.
Rename

WiFi Pilot Page 67
View
The Rename menu option prompts for the new name for the folder.
Delete The Delete menu option will delete the folder and all of its contents.
Context Menu 15 Custom View
Context Sub Menu 3 User Filter
The context menu for a view in the Custom section has the following options:
Apply The Apply menu option applies the selected view to the selected device or file in the Devices and Files panel.
Apply with Filter The Apply with Filter menu option applies the selected view to the selected device or file in the Devices and Files panel with a specified filter. The filter dialog (described later) pops up when this option is selected.
Apply as a Report The Apply as a Report menu option automatically creates a report with the “Current View” option as the selected view for the file selected in the Files panel. The Apply as a Report menu option cannot be applied to a device.
Sampling Time The Sampling Time menu option is very important. It specifies the ultimate granularity in time of the calculation of the corresponding View metric. All of the metrics shown refer to those that are calculated with reference to a specific time period; by default, usually a second. However, this time period is variable and can be changed to other values (which are shown in the contextual submenu). The value selected is shown at the end of the textual representation of the views in the Views Library along with the Data Retention Time value (described next).
Data Retention Time The Data Retention Time and the Sampling Time menu options are very important options that determine the calculation of View metrics for live sources. The Data Retention Time value is the time period of the View metric history that is retained for a View applied to a live source. Once the Data Retention Time is reached, the oldest View metrics are discarded as new sample points are calculated. The Data Retention time has no effect on the duration of the View metrics retained for trace files. In the case of trace files, the complete View metric over the duration of the trace file is retained.
User Filter The User Filter menu option sets a permanent filter associated with the view so it does not need to be specified each time. Clicking on Set brings up the Filter Dialog which is described later. After a filter is set, the menu options of Modify and Remove are enabled, and their functions are self-explanatory.
Duplicate The Duplicate menu option duplicates the reference to a view so that different options can be saved for a view.
Rename The Rename menu option allows a reference shown in the Custom section to be named to whatever is desired.

WiFi Pilot Page 68
Search Text Box
Delete The Delete menu option deletes the selected view in the Custom section. All settings for the custom view are lost.
Context Menu 16 View Panel Search
The Search Box is used to locate Views for specific purposes. In the figure, we have typed VoIP. This search will find all of the Views that have “VoIP” in either the View Name or the View Description. The drop-down check box also allows searches over the Chart Notes of all the charts that are part of a View. The Search box is a convenient way to find the View that you are looking for. In a sense, it provides an alternative ways of organizing the View Library.

WiFi Pilot Page 69
Main Workspace
The Main Workspace uses tabbed windows which will usually be referred to as “Views” or the more general term “tabs”. A View consists of a number of Charts – the View depicted below consists of a strip chart, a bar chart, and a conversation ring. In general, the specific analyses supported by a View are displayed in the Charts that make up the View.
Figure 76 A View in the Main Workspace
Each View has a main tab that contains the View Title. Each of the Charts that make up a View has its own tab. The Time Control window along the bottom edge of the View provides two time intervals, namely, the Current Selection interval and the Total Window interval.
Current Selection: The Charts that comprise the View display the View metrics computed over the Current Selection interval. The duration following the “@” sign has the following interpretations. For a live View, the interval following the “@” sign it the time between the updates to the View metrics. If one to the Charts in the View is a strip chart, then this value is the subsampling interval for the points in the strip chart. For all other Chart types, this value is not used.

WiFi Pilot Page 70
Total Window: In the case of a live source, the Total Window is the duration from when the View was first applied until the current time. In the case of a trace file, the Total Window is the interval of time over which the trace file was captured.
Context Menus
Tooltips
Since some of the methods of data display afford solely qualitative comparison, tooltips are available on some charts to give a quantitative representation of what is graphically displayed.
Notes
Note: The phrase “traffic” in the following sections refers to all subsequent traffic after
the action is performed when dealing with live sources, and the applicable
region of the entire trace file when dealing with trace file analysis or drill down.
Figure 77 Chart Context Menu Overview
Each chart has a context menu that is specific to that chart. However, with few exceptions, all charts share certain options in their context menus:
Export and Drill Down Operations
Search over Charts
Add a New Watch (only available in Strip Charts and Bar Charts in WiFi Pilot 2.0)
Chart-Specific Operations
General Chart and Selection Operations
None of these menu options are described here and are instead, elaborated on a per chart basis.
Figure 78 View With Collapsed Notes
Every chart has a section that can be used to place notes that will be included in a generated report and if applicable, saved in a custom view. In the view on the left, all the note areas are collapsed.

WiFi Pilot Page 71
Chart Figure 1 View Notes Toggle Button
Each chart has a long horizontal button near the bottom border. The colors of the image on the left have been exaggerated to highlight where the button is located.
Figure 79 View With Expanded Notes
When single clicked, a text area will appear under the associated graph for text. There is a default description for each graph provided. The text in the notes section is included in generated reports and the notes are saved in a custom view. The same view above is shown, this time with all notes areas expanded.

WiFi Pilot Page 72
Selection
Mini
Every Chart has a large view with legends and controls, and a mini view with just the graphic itself. In a mini view, none of the elements can be selected and there is no contextual menu.
Conversation Ring
In the Conversation Ring, “conversation” endpoints are placed around an ellipse. The Conversation Ring is used where “stations”, represented by the endpoints, communicate (have a conversation) with each other. The endpoints are depicted as circles with a line connecting a pair of endpoints signifying that two endpoints are communicating with each other. The size of the endpoint and the size of the line are proportional to how much traffic occurs over a given time period. The endpoints and links that have been updated in the last update interval are highlighted in green.
Default
Scroll Wheel
The mouse scroll wheel is used to change the magnification level of the conversation ring. This is useful when there endpoints are densely distributed and can’t be discerned.
Hover with Tooltip
Chart Figure 2 Chart Selected
Chart Figure 3 Chart Not Selected
There is a notion of chart selection. This is important for the search button in the Home Ribbon, among other things.
A chart is selected when there is an orange border within it, as depicted to the right. In any view, there is at most one chart selected at any given time.
Chart Figure 4 Conversation Ring
Along with the “Update Every” and “Show Last” options previously described, the Conversation Ring is customizable in the following ways:
Magnification with the scroll wheel
Endpoint color
Name resolution
Option of transited bytes or packets to signify endpoint and connection size
There are three distinct mouse based operations for the conversation ring:
Scroll Wheel
Hover
Selection

WiFi Pilot Page 73
A hover is when the mouse is over what can be selected, but not clicked. A hover highlights all the associated connections regarding and endpoint or the associated endpoints regarding a connection. The hover operation causes a tooltip to pop up (described later) giving quantitative information regarding a connection or endpoint.
Chart Figure 5 Conversation Ring Hover
Selected
Mini
Chart Figure 6 Conversation Ring Selection
Selection in a Conversation Ring is done by clicking on an endpoint or connection. When clicking on a connection, the connection and the associated endpoints become selected. When clicking on an endpoint, all of the connections with that endpoint and the associated endpoints on the other side of the connections become selected.
Control+click is supported for multiple endpoint or connection based selections (which can be mixed).
Chart Figure 7 Conversation Ring Mini
This is the miniature view of the Conversation Ring.

WiFi Pilot Page 74
Context Menu
Context Sub-Menus
The Conversation Ring has the following contextual submenus:
Settings
Context Menu 17 Conversation Ring
(Selection)
Context Menu 18
Conversation Ring (No Selection)
Context Sub Menu 4
Select
The context menu for the Conversation Ring is as follows:
Send to Wireshark The Send to Wireshark menu option sends the traffic from the selected endpoint(s) and connection(s) to Wireshark for analysis.
Send to File The Send to File menu option sends the traffic from the selected endpoint(s) or connection(s) to a user-specified trace file which will appear, after completion, in the Files panel, for immediate analysis.
Drill Down The Drill Down menu option applies the user-specified view to the selected endpoint(s) or connection(s) and opens a new view tab in the main workspace.
Copy to Clipboard The Copy to Clipboard menu option copies tabular values pertaining to the current selection to the clipboard. These are copied in the order that the hosts were discovered in the conversation ring. The data in each row is the same as the data available in that elements tooltip (described below) and ordered left-to-right as the tooltip is ordered top to bottom. For instance, since the endpoint’s tooltip is displayed “Address, TotBytes, TotPkts” etc, a single copied row will have a corresponding listing, ordered by tabs. The only exception to this rule is that the “Last Seen” value is not included in what is copied to the clipboard.
Create Filter The Create Filter menu option creates a filter based on the current selection and adds the filter to the Filter List.
Search… The Search menu option opens a search dialog window that can be used to find data in the charts. The search context is the labels of the items in a chart which can be selected. For instance, an IP address, MAC address, or hostname can be searched. The Search Dialog is described in its own section later on.
Resolve Selected/Resolve All The Resolve Selected/Resolve All menu option resolves the names for the types of things not specified in the Name Resolution menu – since the selected options are resolved automatically.
Select… The Select… menu option has two submenu options to either select the connection(s) and endpoint(s) in the Conversation Ring, or to invert the current selection of the endpoint(s) and connection(s).
Settings The Settings menu option opens up a submenu with specific settings for the chart. It is described below.

WiFi Pilot Page 75
Context Sub Menu 5 Conversation Ring Settings
Context Sub Menu 6 Conversation Ring Settings (Detail)
The Conversation ring has the following settings:
Element Size Shows
Choose Color
Element Size Shows The endpoint(s) and connection(s) are drawn in a size which is proportional to the relative quantitative values of either the number of bytes or the number of packets received in a specific time period. This submenu can change that option.
Choose Color The Choose Color contextual submenu is used to change the color of the endpoints.
Tooltips
The conversation ring has two kinds of tooltips:
Connection Based
Endpoint Based
Endpoint
Tooltip 3 Conversation Ring
Endpoint
When hovering over an endpoint, a tooltip pops up with the following fields:
Address The Address refers to the associated MAC address of the endpoint. This value can be useful if it is still needed after a name resolution takes place.
TotBytes The TotBytes refers to the total number of bytes that have transited either in or out of that endpoint. It is the sum of the RcvBytes and the SentBytes.
TotPkts The TotPkts refers to the total number of packets that have transited either in or out of that endpoint. It is the sum of the RcvPkts and the SentPkt.
RcvBytes The RcvBytes refers to the total number of bytes received at that endpoint over a given sample period, i.e. the sum packet size of all packets wherein the endpoint was the destination field in the packet.
RcvPkts The RcvPkts refers to the total number of packets received at that endpoint over a given sample period, i.e. the total number of all packets wherein the endpoint was the destination field in the packet.
SentBytes The SentBytes refers to the total number of bytes sent from that endpoint over a given sample period, i.e. the sum packet size of all packets wherein the endpoint was the source field in the packet.
SentPkts The SentPkts refers to the total number of packets sent at that endpoint over a given sample period, i.e. the total number of all packets wherein the

WiFi Pilot Page 76
Conversation
endpoint was the source field in the packet.
Last Seen The Last Seen refers to the last time a packet with either the source or the destination field of the endpoint was seen.
Tooltip 4 Conversation Ring
Conversation
When hovering over a connection, a tooltip pops up with the following fields:
SrcAddress(A) The SrcAddress(A) refers to which address was the source address in the first packet regarding that connection.
DstAddress(B) The DstAddress(B) refers to which address was the destination address in the first packet regarding that connection.
TotBytes The TotBytes refers to the total number of bytes sent between the SrcAddress and DstAddress over a given sample period and is the sum of BytesAB and BytesBA.
TotPkts The TotPks refers to the total number of packets sent between the SrcAddress and DstAddress over a given sample period and is the sum of PktsAB and PktsBA.
BytesAB The BytesAB refers to the total number of bytes sent from the SrcAddress and DstAddress over the view’s sample period.
BytesBA The BytesBA refers to the total number of bytes sent from the DstAddress to the SrcAddress over the view’s sample period.
PktsAB The PktsAB refers to the total number of packets sent from the SrcAddress to the DstAddress over the view’s sample period.
PktsBA The PktsBA refers to the total number of packets sent from the DstAddress to the SrcAddress over the view’s sample period.
Last Seen The Last Seen refers to the last time a packet was seen with the source and destination field being the endpoints of the connection.

WiFi Pilot Page 77
Strip Chart
The Strip Chart is a useful tool for displaying quantitative data with respect to time.
Diagram
The Strip Chart diagram has the following elements:
Time Control Area
Legend
Data area o Min/Max
Current Selection Interval
This is an Example of a View containing a Strip Chart:
Chart Figure 8 Strip Chart
The View depicted above consists of 3 charts, namely, a strip chart, a bar chart, and a pie chart. In this section we are focused on the strip chart (the top-most chart).
Note: The Current Selection bar (at the bottom of the View) simultaneously applies to
all of the Charts contained in a View.

WiFi Pilot Page 78
Current Selection: The data points displayed in the strip chart correspond to the View metric (Bits per Second) computed over the Current Selection Interval. In the case shown above, the duration of the interval is 7 minutes, starting at time 22:03:16 on Wednesday, July 09, 2008, with a subsampling interval of 10 seconds. This means that each point represents the average bits-per-second computed over 10-second intervals.
Total Window: The Total Window interval gives the total duration of the trace file or, in the case of a live capture, the total duration of the capture or the Data Retention Time, whichever is smaller.
Chart Figure 9 Strip Chart with Horizontal Zoom
Chart Figure 9 shows the strip chart “zoomed” horizontally using the Selection bar in the Time Window. The Current Selection interval is 1 minute and 30 seconds long and starts at time 22:29:24 on Wednesday, July 9, 2008.
The user can also open the Time Control Ribbon to set the duration and location of the Current Selection.
The minimum and maximum values within the Current Selection are displayed (with the exception that of a minimum or maximum is obvious from context, it is not indicated).
Along with the “Sampling Time” and “Data Retention Time” options previously described, the Strip Chart is customizable in the following ways:

WiFi Pilot Page 79
Toggle of legend visibility
Rescale of Y Axis
Selection
The Strip Chart supports two types of selection:
Time based
Line based
Time Based Selection
A Time Based Selection is useful on all instances of the Strip Chart and is done by clicking and dragging the mouse over the time to be selected. An example result is shown below:
Chart Figure 10 Strip Chart Selection (Time)
Multiple selection is prohibited for time based selection.
Line Based Selection
A Line Based Selection is useful on instances of the Strip Chart where more than one metric is being charted, for instance, showing the bandwidth of the 802.11 b/g channels, as seen below where BG channel 8 selected:
Chart Figure 11 Strip Chart Selection (Element)
Lines are selected by clicking on them or their representation in the legend. Control+click is supported for multiple selections.

WiFi Pilot Page 80
Mini
This is the miniature view of the Strip Chart:
Chart Figure 12 Strip Chart Mini
The legend disappears and a gray border appears around the image.
Context Menu
Context Menu 19 Strip
Chart (Selection)
Context Menu 20 Strip
Chart (No Selection)
The context menu for the Strip Chart is as follows:
Send to Wireshark The Send to Wireshark menu option will send the traffic from the selected time slice or line(s) to Wireshark for analysis.
Send to File The Send to File menu option will send the traffic from the selected time slice or line(s) to a user-specified trace file which will appear, after completion, in the Files panel, for immediate analysis.
Drill Down The Drill Down menu option will apply the user-specified view to the selected time slice or line(s) and opens a new view tab in the main workspace.
Copy to Clipboard The Copy to Clipboard menu option respects the Time-Display Format specified. It works the following way for the two selection modes:
Time Based Selection All samples in the time slice selected. The format is as follows: [Time] [Value of highest ordered item in the label] [Value of
next item] …
Line Based Selection All samples of the selected line over the entire time period of the trace file. The format is as follows: [Time] [Value of selected element at that time]…
Create Filter The Create Filter menu option creates a filter based on the current selection within the strip chart and adds the filter to the Filter List.
Search… The Search menu option opens a search dialog window that can be used to find data in the charts. The search context is the labels of the items in a chart which can be selected. For instance, an IP address, MAC address, or hostname can be

WiFi Pilot Page 81
Context Sub-Menu
The Strip Chart has the following contextual submenu:
Settings
Settings
Context Sub Menu 7 Select
searched. The Search Dialog is described in its own section later on.
Add Watch The Add Watch menu option opens up the Watch Editor dialog window. The Trigger Condition is based on the currently selected strip chart. The Data Filter, if any, is based on the line selection within the strip chart.
Fit Y Axis Scale the vertical height of the strip chart to fit within the chart.
Time Display Format See below.
Resolve Selected/Resolve All The Resolve Selected/Resolve All menu option resolves, when applicable, either the Port Name, IP Address, or Mac Address of all of the lines of the Strip Chart but only when that to be resolved is not selected for automatic resolution in the Name Resolution submenu available in the Home Ribbon.
Select… The Select… menu option has two submenu options described at the beginning of this section. However, since multiple selections cannot be done with time slices, the invert option is only available after line selection.
Settings The Settings menu option opens up a submenu with specific settings for the chart. It is described below.
Context Sub Menu 8 Strip Chart Settings
The Settings contextual submenu for the Strip Chart has the following options:
Show Legend Toggle off or on the legend for the Strip Chart.
Show Min/Max Toggle off or on the display of minimum and maximum text indications next to the minimum and maximum values for a line.
Setup Y Axis Opens up a separate dialog box, which is described next.

WiFi Pilot Page 82
Dialogs
Tooltips
The tooltips for the Strip Chart are the full quantitative value of a specific sample point of the element in the data area.
Dialog 1 Strip Chart Settings
The Set Y Axis Bounds dialog box is opened from the context menu underneath the Settings submenu. When opened, it has the following parameters:
Upper Bound Set the upper Y axis bound for the Strip Chart.
Lower Bound Set the lower Y axis bound for the Strip Chart.
Auto Size Handle the upper and lower bounds of the Strip Chart automatically.
Number Of Rows The number of division increments on the Y Axis. For instance, if the lower bound is 0 and the upper bound is 100 and the Number Of Rows is set to 10, then the Y axis will increment by units of 10 and there will be 10 alternations of colors for the horizontal depiction of the chart.
Auto Number Of Rows Handle the Number Of Rows of the Strip Chart automatically.

WiFi Pilot Page 83
Bar Chart
The Bar Chart displays quantitative metrics in a graphical bar based chart. It is used when there is a known domain for a metric and division of the domain is useful. Quantities are graphically represented and restricted to a linear scale.
There are three types of Bar Charts:
Single Bars
Stacked Bar Chart
Grouped Bars
Single Bar Chart
Single Bar Charts are the most basic form of Bar Charts. Each column is a single valued bar. Unlike with the other bars, the colors of the bars have no significance other than their correspondence to the legend.
Along with the “Update Every” and “Show Last” options previously described, the Single Bar Chart is customizable in the following ways:
Bar reordering
Rescale of Y-Axis
Toggle of “other” visibility
Toggle of legend visibility
Toggle of label visibility above individual bars
Default
This is an example of the default view for a Single Bar Chart:
Chart Figure 13 Single Bar Chart
Selection with Tooltip
A bar in a Single Bar Chart is selected by clicking on the bar itself, or the column it lies in, or its representation in the legend. Control+click is supported for multiple selection

WiFi Pilot Page 84
Chart Figure 14 Single Bar Chart Selection
Mini
This is the miniature view of the Single Bar Chart:
Chart Figure 15 Single Bar Chart Mini
Stacked Bar Chart
A Stacked Bar Chart is similar to a Single Bar Chart except that each column is subdivided into predetermined constituents. These constituent components can be selected and analyzed individually or collectively.
Along with the “Update Every” and “Show Last” options previously described, the Stacked Bar Chart is customizable in the following ways:
Bar reordering
Rescale of Y-Axis
Toggle of legend visibility
Toggle of label visibility above individual bars
Default
This is an example of the default view for a Stacked Bar Chart:
Chart Figure 16 Stacked Bar Chart

WiFi Pilot Page 85
Mini
This is the miniature view of the Stacked Bar Chart:
Chart Figure 17 Stacked Bar Chart Mini
Grouped Bar Chart
A Grouped Bar Chart is similar to a Single Bar Chart except that each column is subdivided into 2 or more sub columns. The sub columns are used to group similar but distinct things in a Bar Chart.
Along with the “Update Every” and “Show Last” options previously described, the Grouped Bar Chart is customizable in the following ways:
Bar reordering
Rescale of Y-Axis
Toggle of legend visibility
Toggle of label visibility above individual bars
Default
This is an example of the default view for a Grouped Bar Chart:
Chart Figure 18 Grouped Bar Chart
Selection
Selection of the Grouped Bar Chart can happen three ways:
Selection of a column
Selection of one of the components of a column
Selection of all instances of a certain subcomponent across all columns
Column
A column based selection refers to all traffic with respect to the column name. For instance, in the below example, the selection equates to all traffic from IEEE 802.11 wireless channel 11. This method of selection is achieved by selecting the area around the bar with respect to the desired column inside the chart, but not the bar itself.

WiFi Pilot Page 86
Chart Figure 19 Grouped Bar Chart Selection (Column)
Component Instance
A component instance based selection refers to all traffic with respect to the selected subset of the column name. For instance, in the below example, the selection equates to STA traffic from 802.11 channel 11. This method of selection is achieved by clicking on the component.
Chart Figure 20 Grouped Bar Chart Selection (Component Instance)
Component
A component based selection refers to all traffic with respect to the selected subset. For instance, in the below example, the selection equates to STAs from all 802.11 B/G channels. This method of selection is achieved by clicking on the iconic representation of the component to be selected in the legend.
Chart Figure 21 Grouped Bar Chart Selection (Component)
Mini
This is the miniature view of the Grouped Bar Chart:

WiFi Pilot Page 87
Chart Figure 22 Grouped Bar Chart Mini
Context Menu
All three types of Bar Charts; Single, Stacked, and Grouped, share the same context menu with a single exception noted below in the context submenus description.
Context Menu 21 Bar
Chart (Selection)
Context Menu 22 Bar Chart (No Selection)
Context Sub Menu 9
Select
The context menu for the Bar Chart is as follows:
Send to Wireshark The Send to Wireshark menu option sends the traffic from the selected bar(s) or component(s) to Wireshark for analysis.
Send to File The Send to File menu option sends the traffic from the selected bar(s) or component(s) to a user-specified trace file which will appear, after completion, in the Files panel for immediate analysis.
Drill Down The Drill Down menu option applies the user-specified view to the selected bar(s) or components(s) and opens a new view tab in the main workspace.
Copy to Clipboard The Copy to Clipboard menu option works in the following way for each type of Bar Chart:
Single Bars The format is: [X Axis Label] [Y Axis Value] Example: ARP 12
IP 1,217
Stacked Bar Chart The format is: [Column Header Name] – [Component Name] [Value] Example: 192.168.77.0 – Sent 34,272
192.168.77.0 – Received 32,480
192.168.77.0 – Internal 4,152 Grouped Bar Chart
The format is: [Column Header Name] – [Component Name] [Value] Example: 2422 MHz [BG 003]-AP 0
Create Filter The Create Filter menu option creates a filter based on the current selection within the bar and adds the filter to the Filter List.
Search… The Search menu option opens a search dialog window that can be used to find data in the charts. The search context is the labels of the items in a chart which can be
WiFi Pilot Page 88
Context Sub-Menus
The Bar Charts have one contextual submenu:
Settings
selected. For instance, an IP address, MAC address, or hostname can be searched. The Search Dialog is described in its own section later on.
Add Watch The Add Watch menu option opens up the Watch Editor dialog window. The Trigger Condition is based on the currently selected bar chart. The Data Filter, if any, is based on the bars selected within the bar chart (if any).
Fit Y Axis The Fit Y Axis menu option resizes the Y scale of the Bar Chart so that the largest bar is equal to the height of the chart.
Resolve Selected/Resolve All The Resolve Selected/Resolve All menu option resolves, when applicable, either the Port Name, IP Address, or Mac Address of the bar(s) in the Bar Chart but only when that to be resolved is not selected for automatic resolution in the Name Resolution submenu available in the Home Ribbon.
Select… The Select… menu option has two submenu options described at the beginning of this section with an option to either select the bar(s) and component(s) of the Bar Chart, or invert the selection of bar(s) and component(s).
Settings The Settings menu option opens up a submenu with specific settings for the chart. It is described below.
Context Sub Menu 10 Bar Chart Settings
(Detail)
The settings submenu for the Bar Chart context menu has two items:
Show Legend The Show Legend menu option toggles off or on the Bar Chart legend.
Show Bar Labels The Show Bar Labels menu option toggles off or on the Bar Chart labels.
Show “Other” Bar In Single Bar Charts, there is a column for all information that does not fit in the designated bars. This is called the “Other” bar and this menu option toggles it off or on.
Sort The Sort menu option opens a submenu with the following two mutually exclusive sets of options The first set of mutually exclusive options:
Sort By Label The Sort By Label menu option sorts the bars alphabetically by their labeled column names.
Sort By Value

WiFi Pilot Page 89
Tooltips
The tooltips for the Bar Chart correspond to the label of the bar over which the mouse is hovering.
Scatter Plot
The Scatter Plot is a versatile and flexible chart that can display complex relationships between values. Scatter Plots are display three metrics:
Y Axis
X Axis
Dot size of the circles, referred to as points
Each of these metrics can be assigned to one of a predefined set of options. For instance, the user may specify that the Y-Axis represent 802.11 Channel usage or average frame size.
Scatter Plots are useful when there ought to be a relation between values, such as the total number of packets and the total bytes sent out by a host. Assume the Y Axis is “Packet Count” and the X Axis is “Byte Count”. It can be assumed that there would be roughly a diagonal from the origin outward. An anomaly would be if this relationship was broken or perhaps if it didn’t seem to exist at all (which could be evident of a much more severe networking problem).
The Sort By Value menu option sorts the bars numerically by their quantitative values.
The second set of mutually exclusive options:
No Sorting The No sorting menu option disables sorting. Under this condition, bars are added left to right on a first come basis.
Left To Right Sorting The Left To Right Sorting menu option sorts the bars sequentially from left to right, either by name or value, as specified in the first mutually exclusive group.
Right to Left Sorting The Right To Left Sorting menu option sorts the bars sequentially from right to left, either by name or value, as specified in the first mutually exclusive group.

WiFi Pilot Page 90
Default
Selection
Mini
Chart Figure 26 Scatter Plot Mini
This is the miniature view of the Scatter Plot.
Chart Figure 23 Scatter Plot
Along with the “Update Every” and “Show Last” options previously described, the scatter plot is customizable in the following ways:
Assignment of the dot size relation
Assignment of X-Axis
Assignment of Y-Axis
Chart Figure 24 Scatter Plot Draw Box
Chart Figure 25 Scatter Plot Multiple Selection
Selection in a Scatter Plot is done by one of four ways:
Search operation
Selection from the legend
Drawing a box around the points
Clicking on the Points to be selected.
Control+click for multiple selection is supported in point based and legend based selection.

WiFi Pilot Page 91
Context Menu
Context Sub-Menus
The Scatter Plot has three contextual submenus:
Dimensions
Context Menu 23 Scatter Plot
(Selection)
Context Menu 24 Scatter Plot
(No Selection)
Context Sub Menu 11 Scatter
Plot Select
The context menu for the Scatter Plot is as follows:
Send to Wireshark The Send to Wireshark menu option sends the traffic from the selected point(s) to Wireshark for analysis.
Send to File The Send to File menu option sends the traffic from the selected point(s) to a user-specified trace file which will appear, after completion, in the Files panel for immediate analysis.
Drill Down The Drill Down menu option applies the user-specified view to the selected point(s) and opens a new view tab in the main workspace.
Copy to Clipboard The Copy to Clipboard menu option will copy to the clipboard a tabular list of values of all of the supported metrics with respect to a selection. It also includes a column header and notation for appropriate units.
Create Filter The Create Filter menu option creates a filter based on the current selection within the scatter plot and adds the filter to the Filter List.
Search… The Search menu option opens a search dialog window that can be used to find data in the charts. The search context is the labels of the items in a chart which can be selected. For instance, an IP address, MAC address, or hostname can be searched. The Search Dialog is described in its own section later on.
Fit X and Y Axes The Fit X and Y Axes menu option resizes the X and Y scales of the Scatter Chart so that the largest X and Y excursions fit within the chart.
Resolve Selected/Resolve All The Resolve Selected/Resolve All menu option resolves, when applicable, either the Port Name, IP Address, or Mac Address of the point(s) in the Scatter Plot but only when that to be resolved is not selected for automatic resolution in the Name Resolution submenu available in the Home Ribbon.
Select… The Select… menu option has two submenu options described at the beginning of this section with an option to either select the point(s) in the Scatter Plot, or inverts the selection of point(s).
Settings The Settings menu option opens up a sub-menu with specific settings for the chart. It is described below.

WiFi Pilot Page 92
Select (shown above)
Settings
Dimensions
Settings
Context Sub Menu 12 Scatter Plot Dimensions
Context Sub Menu 13 Scatter Plot Dimensions (Detail)
The Dimensions submenu for the Scatter Plot context menu has four items:
X Axis The X Axis menu option gives all possible sub choices for the significance of the X-Axis coordinate. Some charts may only have one option, while others may have multiple; for instance, “Bits/s” versus “Bytes/s” or “Packets/s”.
Y Axis The Y Axis menu option gives all possible sub choices for the significance of the Y-Axis coordinate. Some charts may only have one option, while others may have multiple; for instance, “Bits/s” versus “Bytes/s” or “Packets/s”.
Size The Size menu option has a submenu where the dot size of the points can be enabled and associated with a metric or disabled by selecting “Nothing”.
Advanced The Advanced menu option opens up a separate dialog box.
Context Sub Menu 14 Scatter Plot Settings
The settings submenu for the Scatter Plot context menu has five items:
Show Legend The Show Legend check box menu option toggles off or on the Scatter Plot legend.
Show Bubble Labels The Show Bubble Labels menu option toggles off and on what would otherwise be viewed via a tooltip by hovering over a point.
Autosize The Autosize menu option toggles off and on whether the area will resize based on maximum values automatically.

WiFi Pilot Page 93
Tooltips
Tooltip 5 Scatter Plot
A tooltip comes up when hovering over a point. It has the following values:
Name The Name of the point being charted, such as an 802.11 wireless channel.
X The X value refers to the position the point currently occupies on the X axis and the significance of this with respect to the units for the X axis.
Y The Y value refers to the position the point currently occupies on the Y axis and the significance of this with respect to the units for the Y axis.
Size The Size value refers to the dot size of the point and the significance of this with respect to the units for the dot size.
Pie Chart
The Pie Chart shows quantitative values as a percentage of a whole. Pie Charts are useful for instance, when looking at local versus non-local traffic, or finding out what percentage of total traffic is constituted by a particular host. The elements of a Pie Chart are referred to as slices.
Default
Selection
Chart Figure 27 Pie Chart
Along with the “Update Every” and “Show Last” options previously described, the Pie Chart is customizable in the following ways:
Toggle of percentage or quantitative value to be displayed for the time slices.
Toggle of legend visibility.
The Pie Chart can be zoomed in and out using the scroll wheel on the mouse.
Chart Figure 28 Pie Chart Selection
Selection in a Pie Chart is done either by clicking on a slice in the Pie Chart or on its representation in the legend. Control+click for multiple selection is supported.

WiFi Pilot Page 94
Mini
Chart Figure 29 Pie Chart Mini
This is the miniature view of the Pie Chart.
Context Menu
Context Menu 25 Pie Chart
(Selection)
Context Menu 26 Pie Chart
(No Selection)
Context Sub Menu 15 Pie
Chart Select
The context menu for the Pie Chart is as follows:
Send to Wireshark The Send to Wireshark menu option sends the traffic from the selected slice(s) to Wireshark for analysis.
Send to File The Send to File menu option sends the traffic from the selected slice(s) to a user-specified trace file which will appear, after completion, in the Files panel for immediate analysis.
Drill Down The Drill Down menu option applies the user-specified view to the selected slice(s) and opens a new view tab in the main workspace.
Copy to Clipboard The Copy to Clipboard menu option has the following format: [Slice Name] [Quantitative Value] [Percentage Value]
It refers to all selected slices.
Create Filter The Create Filter menu option creates a filter based on the current selection within the Pie Chart and adds the filter to the Filter List.
Search… The Search menu option opens a search dialog window that can be used to find data in the charts. The search context is the labels of the items in a chart which can be selected. For instance, an IP address, MAC address, or hostname can be searched. The Search Dialog is described in its own section later on.
Resolve Selected/Resolve All The Resolve Selected/Resolve All menu option resolves, when applicable, either the Port Name, IP Address, or Mac Address of the slice(s) in the Pie Chart but only when that to be resolved is not selected for automatic resolution in the Name Resolution submenu available in the Home Ribbon.
Select… The Select… menu option has two submenu options described at the beginning of this section with an option to either select the slice(s) in the Pie Chart, or inverts the selection of slice(s).

WiFi Pilot Page 95
Context Sub-Menus
The Pie Chart has one contextual submenu:
Settings
Settings
Tooltips
Tooltip 6 Pie Chart
A tooltip comes up when hovering over a slice. It has the following values:
Value The Value refers to the quantitative value associated with that slice.
Percent The Percent refers to the percentage that the slice constitutes of the whole.
Last Seen The Last Seen refers to the last time that element of the slice was seen in traffic. This can give an idea as to what percentage in the time domain the slice refers to.
Data Grid
The Data Grid chart shows quantitative information pertaining to a number of metrics in a hierarchically displayed grid. The grid has rows and columns.
The columns can be
Rearranged to any sequential order desired
Resized
Hidden and shown
Settings The Settings menu option opens up a sub-menu with specific settings for the chart. It is described below.
Context Sub Menu 16 Pie Chart Settings
Context Sub Menu 17 Pie Chart Settings (Detail)
The settings submenu for the Pie Chart context menu has two items:
Show Legend The Show Legend check box menu option toggles off or on the Pie Chart legend.
Labels Show… The Labels Show… menu option has a submenu with two mutually exclusive toggles:
Percentage The Percentage toggle labels the slice value(s) as a percentage of the whole pie.
Value The Value toggle labels the slice value(s) with their quantitative equivalents.

WiFi Pilot Page 96
The rows can be
Hierarchically defined
Collapsed and expanded
Filtered and hidden by a variety of different means
Sorted by any column or multiple columns simultaneously
In order to explain functionality, a few things have been turned on from the default chart. Additionally, since the grid is very compact, some conventions needed to be broken to make the diagram clear. Only part of the entire control is shown.
Chart Figure 30 Grid
Grouping Bar
The elements of the Grouping Bar, called groups, determine the row hierarchy. In the example above, the root level has all of the 802.11 B/G channels. Each channel can be expanded to show the associated ESSIDs on it. The individual ESSIDs can then, in turn be expanded to show the APs or stations that are associated with each ESSID.
Figure 80 Grid Grouping Bar
Each element of the Grouping Bar also has an arrow after the name. This specifies the sorting order of that level of the hierarchy. For instance, the channels are descending and the ESSIDs are listed alphabetically ascending. Any of these can be toggled by clicking on the group itself.
Additionally, groups forming the hierarchy in the Grouping Bar can be rearranged by dragging the elements to be in different orders. The hierarchy changes are reflected immediately. Things can be removed from the hierarchy by dragging them out of the sequence.
The Grouping Bar is explained in much more details in the videos.
Column Headers
The Column Headers refers to columns which can be turned on and off thru the context menu. Rows can be sorted via one or more columns. The first, left-most column header contains the hierarchy specified in the Grouping Bar.
Filter Bar
The Data Grid Filter Bar allows for filtering on a column by column basis of all the rows. Two types of filtering are supported:
Selection Based
Advanced

WiFi Pilot Page 97
Selection Based
Advanced
Figure 83 Advanced Grid Filtering
Advanced filtering is available by clicking on the ellipses (…) on the right of one of the column’s filters. A drop down opens that which lists a number of string and value manipulations and comparisons.
After an expression is entered, the rows not satisfying the expression are automatically hidden.
Additionally the icon on the left hand side of the filter box changes, as can be seen in Figure 82. Clicking on the icon removes the filter and shows the hidden rows.
Hierarchy
The data grid rows may be organized in a multi-tiered tree via the grouping bar. They can be fully expanded and collapsed through the context menu.
Selection
Multiple selection in the Data Grid can only be done on the same hierarchical level. For instance, a child and a parent cannot be simultaneously selected. However, a child and its siblings can.
Figure 81 Selection Based Grid
Filtering Drop Down
Figure 82 Selection Based Grid
Filtering Enabled
Selection Based filtering is available by clicking on the down arrow on the right of one of the column’s filters. A drop down list opens that lists the unique entries of the associated column. After an entry is selected, the rows not satisfying the filter are hidden.
Additionally the icon on the left hand side of the filter box changes, as can be seen in Figure 82. Clicking on the icon removes the filter and shows the hidden rows.

WiFi Pilot Page 98
Context Menu
Context Menu 27 Grid (Selection)
Context Menu 28 Grid (No Selection)
The context menu for the Data Grid is as follows:
Send to Wireshark The Send to Wireshark menu option sends the traffic from the selected row(s) to Wireshark for analysis.
Send to File The Send to File menu option sends the traffic from the selected row(s) to a user-specified trace file which will appear, after completion, in the Files panel for immediate analysis.
Drill Down The Drill Down menu option applies the user-specified view to the selected row(s) and opens a new view tab in the main workspace.
Copy to Clipboard The Copy to Clipboard menu option copies in a tabular form, the values of each row selected. They are copied to the clipboard in a sequential manner that matches how they appear in the grid.
Create Filter The Create Filter menu option creates a filter based on the current selection within the Grid and adds the filter to the Filter List.
Search… The Search menu option opens a search dialog window that can be used to find data in the charts. The search context is the labels of the items in a chart which can be selected. For instance, an IP address, MAC address, or hostname can be searched. The Search Dialog is described in its own section later on.
Columns The Columns menu option expands to a submenu that is used to show and hide columns in the grid. The submenu is described below.
Fit Content The Fit Content menu option resizes the columns making all of the column data visible.
Expand All The Expand All menu option expands the ordered hierarchy of the rows.
Collapse All The Collapse All menu option collapses the ordered hierarchy of the rows.
Resolve All The Resolve All menu option is always disabled for the grid and is included in the context menu in order to be consistent with the other charts.
Select… The Select… menu option has two submenu options described at the beginning of this section with an option to either select all row(s) at a certain level in the hierarchy or inverts the selection of row(s).
Settings

WiFi Pilot Page 99
Context Sub-Menus
The Data Grid has two contextual submenus:
Columns
Settings
Columns
Settings
Tooltips
The tooltips on the Data Grid correspond to all entries for a particular row. This is also what will be copied out in a Copy to Clipboard operation.
Context Sub Menu 18 Select
The Settings menu option opens up a submenu with specific settings for the chart. It is described below.
Context Sub Menu 19 Grid Columns
The Columns submenu of the Data Grid context menu has a variable number of non-mutually exclusive toggles which depends on the chart and view. Toggling the submenu options make their corresponding columns visible or hidden in the data grid.
Context Sub Menu 20 Grid Settings
The Settings submenu of the Data Grid context menu has the following options:
Remember Column Sizes The Remember Column Sizes menu option saves the current size of the columns for a custom view. This is the only way to save the size of the columns as they are not automatically saved when a custom view is created or modified.
Show Filter Bar The Show Filter Bar menu option shows or hides the filter bar on the Data Grid Chart.
Show Grouping Bar The Show Grouping Bar menu option shows or hides the Grouping Bar on the Data Grid Chart.

WiFi Pilot Page 100
Channels Button
WiFi Pilot provides 802.11 wireless analysis on live traffic using the CACE Technologies AirPcap adpaters for the wireless interfaces.
Figure 84 Wireless Interface in Sources Panel
Regardless of the number of AirPcap devices connected to the system, they are shown as a single aggregated capture device, where the number of channels, in parentheses, corresponds to the actual number of AirpCap capture devices (see Figure 84). The AirPcap adapters have been aggregated into a single capture device for convenience in dealing with hopping or scan sequences, where the adapters are sequenced through multiple channels as specified using the Channel Management Panel. The Channels button in the Home Ribbon brings up the Channel Management Panel. The Channel Management Panel is the way, in wireless captures, to specify on which channels to capture for a particular time interval. The Channel Management Panel is available in the Home Ribbon and is shown below
Figure 85 Channel Management Panel

WiFi Pilot Page 101
Note: To close the Channel Management Panel, click the Channels button again or
somewhere outside of the submenu. All changes take place immediately hence
there is no need for confirmation buttons.
There are three main sections of the Channel Management Panel as shown in the above image:
All Channels
Locked Channels
Scan Sequence
All Channels
Figure 86 All Channels
For the purpose of this document, a channel corresponds to a center frequency, bandwidth, and type of 802.11 frames that can be received. The types of frames are:
BG – 802.11b or 802.11g
A – 802.11a
N – 802.11n without an extension channel
NHigh – 802.11n with an extension channel above the center frequency
Nlow – 802.11n with an extension channel below the center frequency
The available channels depend on the AirPcap devices attached to the system.
2.4GHz Center Frequencies:
AirPcap Classic/Tx – 20 MHz bandwidth, 802.11b,g (BG)
AirPcap Ex – 20 MHz bandwidth, and 802.11b,g (BG)
AirPcap Nx – 20 MHz bandwidth, and 802.11b,g,n (BG or N)
AirPcap Nx – 40 MHz bandwidth, and 802.11b,g,n (BG or N or NHigh or Nlow)
5GHz Center Frequencies:
AirPcap Ex – 20 MHz bandwidth, and 802.11a (A)
AirPcap Nx – 20 MHz bandwidth, and 802.11a,n (A or N)
AirPcap Nx – 40 MHz bandwidth, and 802.11a,n (A or N or NHigh or NLow)
For example, the AirPcap Ex adapter at 2.437GHz center frequency will capture BG frames. At 5.260GHz, the AirPcap Ex adapter will capture A frames.
The AirPcap Nx adapter at 2.437GHz center frequency and 20MHz bandwidth will capture BG, A, and N frames. At 5.260GHz center frequency and 40 MHz bandwidth (NHigh), the AirPcap Nx adapter will capture A, N, and NHigh frames.
Channel Names

WiFi Pilot Page 102
Channel List
Channels are generally identified with a by a number and a frequency band. For example, channel 13 in the 2.4 GHz band corresponds to center frequency 2.472GHz. Not every available channel in WiFi Pilot will have an assigned number. This is indicated by N/A for the channel name.
All Channels Panel
The All Channels panel includes the following:
A list of all of the available channels. This list depends on the available AirPcap adapters. The list columns include the channel name, the center frequency, and the type of frame that can be received.
A search bar that automatically matches any field in the channel list.
4 filter buttons to quickly hide or show the A, BG, N, and Unnamed channels.
Alternating color rows so that different ways to interpret a channel at the same frequency is visually broken up.
Selection control buttons
This allows for a flat traditional list of channels that can be quickly navigated and selected without having to worry about the complexities of the standards.
However, given the complexity of the standards, there are some very important restrictions that must be taken into consideration when using multiple classes of AirPcap adapters at once:
N and BG channels are mutually exclusive. If there is 1 N adapter and 1 BG adapter, then only the N adapter can scan the 2.4GHz BGN range.
For the purpose of documentation, the control has been broken into the following components:
Channel List
Search and Filter Bar
Selection Controls
Figure 87 Channel List
The Channel List is a scroll-able list of all channels supported by all connected AirPcap Adapters. This list automatically changes when the number of adapters changes (which is updated by clicking the Update Sources button, described in the Home Panel section).
The colors in the list are to provide contrast for easy navigation. The only rule they follow is that they are alternated based on frequency.
The Channel List has three columns:
Channel The canonical name for a channel. This is how the channel is usually referred to, such as channel 6. Please note, not all available frequencies have names such as this.
Frequency The actual center frequency that the row refers to. These are in MHz.
Type

WiFi Pilot Page 103
Selection Controls
Icon 34 Select No
Channels
The Select None button deselects all channel(s) in the channel list, if applicable.
Icon 35 Invert Selection
The Select Inverse button inverts the channel list selection(s).
Icon 36 Select All
Channels
The Select All button selects all of the channel(s) in the channel list.
Search and Filter Bar
The search text box can be edited at any given time and gives the results in real time.
The filter bar contains four buttons, each corresponding to a set of channel types. Since there may be times when not all classes of AirPcap Adapters are plugged in, some of the filter buttons will be disabled. For instance, in the example, since there is no 802.11n wireless adapter plugged in, the N button is grayed out.
Locked Channels
Title
The Title specifies how many channels can be locked. This number is equal to the number of AirPcap adapters recognized by WiFi Pilot. If you plug more AirPcap Adapters in, or take some out, then you must click the Update Sources button in the Home Ribbon in order for your changes to be reflected in the maximum channel tally.
Selection Controls
The type of Channel, one of the following: BG, A, N, NHigh, NLow.
Figure 88 Locked Channels
The Locked Channels is a list of channels that are used to assign a wireless adapter dedicated to a channel. It contains 4 elements:
Title
Selection controls
Transfer controls
Channel list
The following is saved in the global configuration file:
Locked channels
Icon 37 Select No Channels
The Select None button deselects all channel(s) in the channel list, if applicable.

WiFi Pilot Page 104
Transfer Controls
Channel List
The Channel List is a color coded list of locked channels. The significance of the colors is simply that a distinct color means a distinct wireless adapter.
Scan Sequence
Note: The scan sequence is determined by the number of AirPcap adapters and their
individual capabilities. For consistent results that are independent of the
specific scan sequence, it is advisable that to have only on type of AirPcap
adapter in the system, e.g., either all AirPcap Ex adapters or all AirPcap Nx
adapters. Having both AirPcap Ex and AirPcap Classic/Tx adapters works well in
the 2.4GHz band, but not in the 5GHz band.
Icon 38 Invert Selection
The Select Inverse button inverts the channel list selection(s).
Icon 39 Select All Channels
The Select All button selects all channel(s) in the channel list.
Icon 40 Transfer Channels
The Right Arrow button adds the selected channel(s) to the lock list.
Icon 41 Remove Channels
The Remove button removes the selected channel(s) from the lock list. The lock list can legally have zero elements.
Figure 89 Scan Sequence
The Scan Sequence is a list of channels that the wireless adapter(s) will listen on occasionally. It contains 4 elements:
Duration
Selection controls
Transfer controls
Channel list
The following is saved in the global configuration file:
Scan sequence elements
Duration for each element
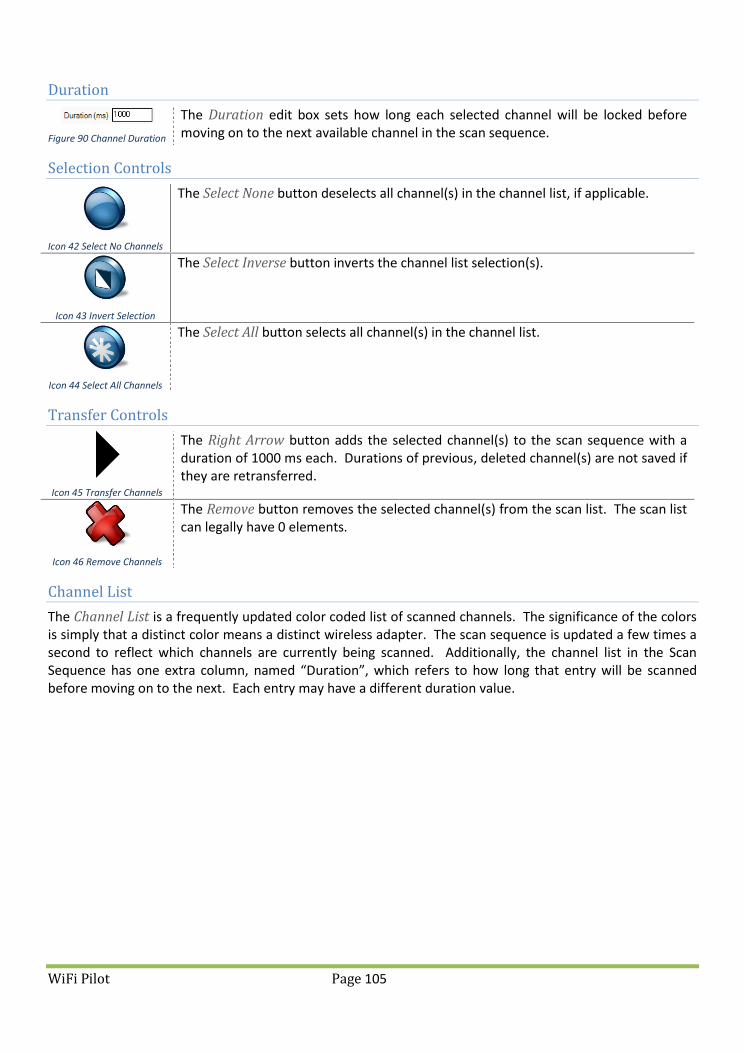
WiFi Pilot Page 105
Duration
Figure 90 Channel Duration
The Duration edit box sets how long each selected channel will be locked before moving on to the next available channel in the scan sequence.
Selection Controls
Transfer Controls
Channel List
The Channel List is a frequently updated color coded list of scanned channels. The significance of the colors is simply that a distinct color means a distinct wireless adapter. The scan sequence is updated a few times a second to reflect which channels are currently being scanned. Additionally, the channel list in the Scan Sequence has one extra column, named “Duration”, which refers to how long that entry will be scanned before moving on to the next. Each entry may have a different duration value.
Icon 42 Select No Channels
The Select None button deselects all channel(s) in the channel list, if applicable.
Icon 43 Invert Selection
The Select Inverse button inverts the channel list selection(s).
Icon 44 Select All Channels
The Select All button selects all channel(s) in the channel list.
Icon 45 Transfer Channels
The Right Arrow button adds the selected channel(s) to the scan sequence with a duration of 1000 ms each. Durations of previous, deleted channel(s) are not saved if they are retransferred.
Icon 46 Remove Channels
The Remove button removes the selected channel(s) from the scan list. The scan list can legally have 0 elements.

WiFi Pilot Page 106
Drill Down
The Drill Down feature is one of the most powerful and conceptually oriented features of WiFi Pilot. Briefly, Drill Down allows for data to be viewed by iteratively applying views to visually selected subsets of data. This definition will be broken up below:
Data to be viewed By ‘data’, this means any information, computation, or meta information; for instance, bytes over time, or all traffic on TCP port 80.
By Iteratively Applying Views Views cannot only be applied on devices or files, but on data itself. The view that is generated from the data can then, in turn, have another view applied on itself and so on.
To Visually Select Subsets Of Data Every chart has a method of selecting data subsets that allow for the execution of a drill down operation.
How to
The Drill Down functionality of WiFi Pilot is accessible in three ways:
Home Ribbon Drill Down button available in the Selection Section
Context click Drill Down option available on any chart
Dragging a view from the Views Panel over the chart (with a current selection) to be drilled down
Example
For examples of Drill Down sequences and operations please refer to the videos.
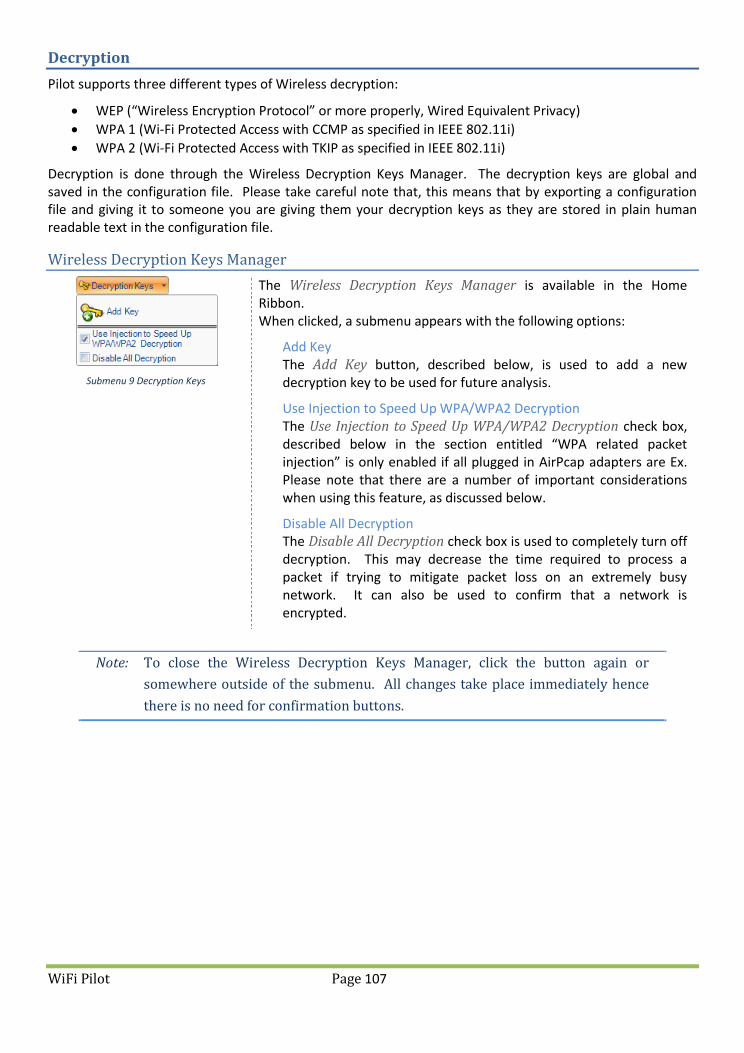
WiFi Pilot Page 107
Decryption
Pilot supports three different types of Wireless decryption:
WEP (“Wireless Encryption Protocol” or more properly, Wired Equivalent Privacy)
WPA 1 (Wi-Fi Protected Access with CCMP as specified in IEEE 802.11i)
WPA 2 (Wi-Fi Protected Access with TKIP as specified in IEEE 802.11i)
Decryption is done through the Wireless Decryption Keys Manager. The decryption keys are global and saved in the configuration file. Please take careful note that, this means that by exporting a configuration file and giving it to someone you are giving them your decryption keys as they are stored in plain human readable text in the configuration file.
Wireless Decryption Keys Manager
Submenu 9 Decryption Keys
The Wireless Decryption Keys Manager is available in the Home Ribbon. When clicked, a submenu appears with the following options:
Add Key The Add Key button, described below, is used to add a new decryption key to be used for future analysis.
Use Injection to Speed Up WPA/WPA2 Decryption The Use Injection to Speed Up WPA/WPA2 Decryption check box, described below in the section entitled “WPA related packet injection” is only enabled if all plugged in AirPcap adapters are Ex. Please note that there are a number of important considerations when using this feature, as discussed below.
Disable All Decryption The Disable All Decryption check box is used to completely turn off decryption. This may decrease the time required to process a packet if trying to mitigate packet loss on an extremely busy network. It can also be used to confirm that a network is encrypted.
Note: To close the Wireless Decryption Keys Manager, click the button again or
somewhere outside of the submenu. All changes take place immediately hence
there is no need for confirmation buttons.

WiFi Pilot Page 108
Adding a Key
Submenu 10 Decryption Keys with Key
Submenu 11 Decryption Keys with Key
(Detail)
To add a key, click on the Add Key button. The submenu will change and have a scrollable list with one decryption key. As many decryption keys can be added as desired. Note that there is no need to associate a particular decryption key to a trace file or wireless adapter and that the decryption key will be automatically matched with its specific context.
After a decryption key has been added, its parameters need to be set. This is done by clicking on the decryption key. A submenu opens to the right of the key title with seven controls:
Name The Name field refers to the canonical name of the decryption key. This is used for management of decryption keys, is what will appear as the name in the key gallery, and in no way affects decryption. These names need not be unique.
Type The Type combo box is used to specify the type of decryption key to be added. This is a crucial option as different types equate to entirely different decryption algorithms.
SSID The SSID field is required for WPA related decryption keys but is disabled for WEP decryption keys because the SSID is not needed to decrypt WEP traffic.
Key The Key field is used to specify the shared decryption key needed for a wireless network to be decrypted. Hexadecimal values can be placed here as a single string when appropriate and are not case sensitive. Additionally, 104 bit and 40 bit WEP decryption keys are detected automatically from the Key field input length. For instance, if the type is set to WEP and “A05B06c07d” was put into the Key field, it will be detected as a 40-bit WEP key.
Show The Show check box shows or hides the text in the Key field. By default the Key field uses substitution characters for obfuscation. However, this can be disabled and the field can be seen in plain text by toggling on the Show check box.
Disable Key The Disable Key check box disallows a decryption key from being considered when decrypting traffic. This can be useful for two reasons:
To confirm that traffic is encrypted
To speed up decryption; By disabling a decryption key, fewer decryption keys will be considered as candidates for decryption and so therefore, decryption will speed up.
Delete Key The Delete Key button immediately and irreversibly removes a decryption key from the Key list.

WiFi Pilot Page 109
WPA Related Packet Injection
Wireless networks secured using the WPA protocol cannot be decrypted as easily as their WEP counterparts. This is because unlike with WEP, simply having a decryption key is not enough to view the traffic of other stations on a network. The access point establishes a different, temporary, ostensibly unique trusted link with each station on the network.
In order to successfully decrypt WPA traffic then, even with a valid decryption key, the set up of this link needs to be captured. However, because stations may not authenticate for hours or possibly longer, in order to view traffic without waiting a long time, the hosts need to re-associate with their access point.
This can be achieved by sending out a de-authentication request which asks the stations to re-associate with their access point.
Note: WPA packet injection only works if all the plugged in AirPcap adapters are EX
class. If not all of the plugged in adapters are AirPcap EX, then the checkbox will
be disabled.
Note: Although it ultimately depends on the wireless adapter of the station, it is very
probable that this action will temporarily drop the connection between a station
and its access point.

WiFi Pilot Page 110
In Wireshark, the deauthentication frame will look similar to the figure below:
Figure 91 Wireshark analyzing an WiFi Pilot generated Deauthentication frame
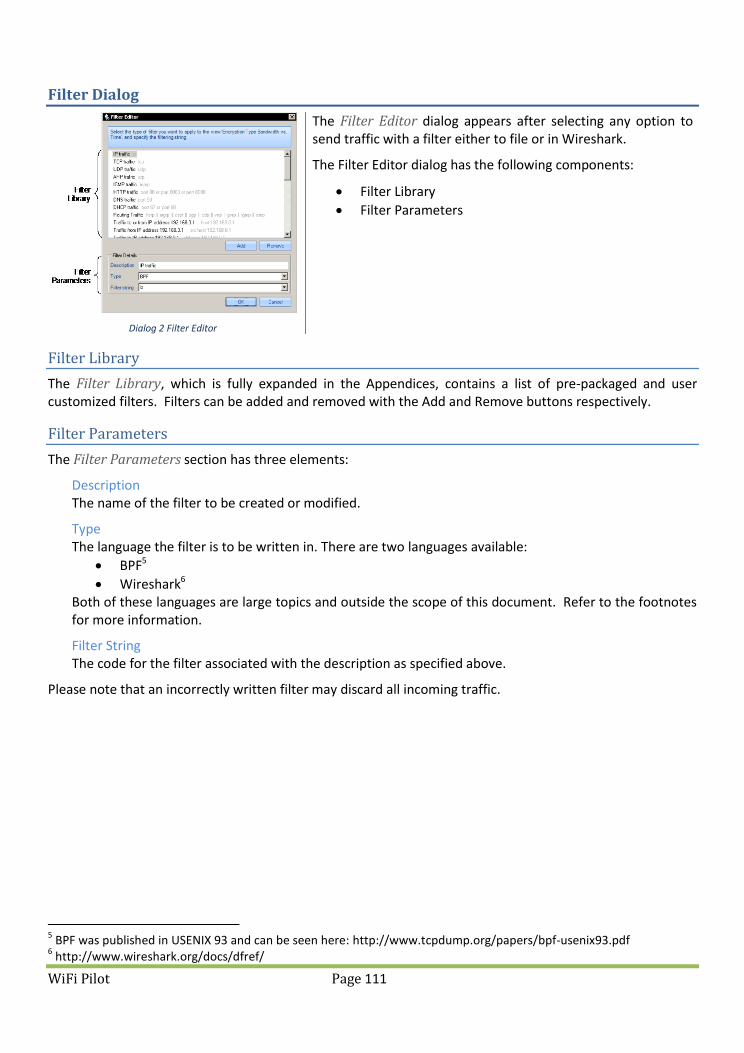
WiFi Pilot Page 111
Filter Dialog
Filter Library
The Filter Library, which is fully expanded in the Appendices, contains a list of pre-packaged and user customized filters. Filters can be added and removed with the Add and Remove buttons respectively.
Filter Parameters
The Filter Parameters section has three elements:
Description The name of the filter to be created or modified.
Type The language the filter is to be written in. There are two languages available:
BPF5
Wireshark6 Both of these languages are large topics and outside the scope of this document. Refer to the footnotes for more information.
Filter String The code for the filter associated with the description as specified above.
Please note that an incorrectly written filter may discard all incoming traffic.
5 BPF was published in USENIX 93 and can be seen here: http://www.tcpdump.org/papers/bpf-usenix93.pdf
6 http://www.wireshark.org/docs/dfref/
Dialog 2 Filter Editor
The Filter Editor dialog appears after selecting any option to send traffic with a filter either to file or in Wireshark.
The Filter Editor dialog has the following components:
Filter Library
Filter Parameters

WiFi Pilot Page 112
Search Dialog
Search Context
Using the Look in drop down selection, searches can be executed over the following three scopes:
Current Chart The Current Chart drop down menu option refers to the currently selected chart with the orange border as documented at the beginning of the section on charts.
Current View The Current View drop down menu option refers to the foremost tab and all associated charts.
All Open Views The All Open Views drop down menu option refers to all open views that have a tab open in the main workspace
Search Style
Different types of searches can be executed based on what is selected in the Find Option subsection of the Search dialog. There are four checkboxes:
Match case The Match Case check box toggles case sensitivity with latin alphanumeric characters [A-Z].
Match whole word By default, search looks for substrings. If a hostname is “www.cacetech.com” and “cacete” was searched for, then “www.cacetech.com” would still be selected. When Match whole word is checked, then only a search term of the full “www.cacetech.com” will select the specific instance.
Inverse Selection The Inverse Selection check box toggles whether the results that match the search term should be selected, or their respective inverse.
Use Regular Expressions “Regular Expressions” are a technical term which allow for a very flexible match. WiFi Pilot supports POSIX regular expressions, which are well documented elsewhere. Here are the basic regular expression syntax: ^ Match the beginning of a label.
“^i” would match “intel” but not “cisco”. $ Match the end of a label.
Dialog 3 Search Dialog
The Search dialog can be activated either by clicking on the binocular icon labeled search in the Main Ribbon or by context clicking on a chart and choosing the “Search” option. There are two features of searches:
Search Context
Search Style

WiFi Pilot Page 113
“l$” would match “intel” but not “airlink”. . Any single character. “i.t” would match “intel” or “virtech” but not “cisco”. ? Zero or one of the previous character. “i.?t” would match “intel” and “itech” but not the word “inert”. * Zero or more of the previous character. “i.*e” would match “intel” and “virtech” but not “cisco”. + One or more of the previous character. “i.*n” would match “intel” but “i.+n” would not. | Multiplicity operator
“intel|cisco” will match either “intel” or “cisco” but not “virtech”. The parenthesis can be used to encapsulate an expression. For instance “(el|co)$”
\ The escape character.
In order to find a dot, “.” will not suffice since it will select any character. Specifying “\.” overrides the default operation of the dot.
{#,#} A certain count of the previous character.
The “,“ operator specifies a range. At least one is required. “i.,2-e” would match “intel” since there are 2 characters between the I and e. “,2-” or “,2,-” can be read as “only 1 character”. “,1,4-” can be read as “between 1 and 4 characters”.
[range] A range of characters.
Ranges can be either an enumerated list of characters, such as “*abde+” or a hyphenated list such as “*A-Z+” or “*0-9+”. For instance “1*0-3+,2-” would match “103” and “121” but not “140” or “152”. Additionally, ranges support the ^ operator for inversion. For instance, “^*^i+” would select say “airlink” and “netgear” but not “intel”.
Regular Expression Example
All local IPv4 networks In IPv4 space, 10.0.0.0/8, 192.168.0.0/16, and 172.16.0.0/16 are reserved for local networks. A regular expression that matches all of them would be as follows:
^(192\.168|10\.|172\.16)
Security Disclosures
Please carefully read the following important disclosures.
Unlike with Wireshark, once a valid decryption key is defined, all relevant subsequent traffic is automatically decrypted, and, if saved, will be stored decrypted to disk.
Independent of whether decryption keys are shown or hidden, they are stored on disk in plain text. Exporting a configuration file equates to exporting the plain text decryption keys that have been entered.

WiFi Pilot Page 114
Appendix A Chart Types
Here are the formal names for the different charts
Chart Figure 31 Bar Chart
Chart Figure 32 Conversation Ring
Chart Figure 33 Data Grid
Chart Figure 34 Pie Chart
Chart Figure 35 Strip Chart
Chart Figure 36 Scatter Plot

WiFi Pilot Page 115
Appendix B Filters

WiFi Pilot Page 116
Appendix C Report Example Breakdown

WiFi Pilot Page 117