pilot spinning of viscose staple fibres. - diva portal838767/fulltext01.pdf · for production of...
TRANSCRIPT
Pilot spinning of viscose staple
fibres.
Screening for important spinning parameters using design
of experiments.
Johanna Eriksson
Degree Project in Engineering Chemistry, 30 hp
Report passed: May 2015
Supervisors:
Sara Hellström, Domsjö Fabriker AB
Alf Gustafsson, MoRe Research
Johan Trygg, Umeå University

I
Abstract
The viscose process has been used for over hundred years to produce man-made fibres from
cellulose. The process is very versatile; modifications at different stages in the process can be
done to obtain different fibre properties. The regeneration mechanism determines the fibre
tensile properties and depends on many process variables. In 2012, a spin pilot was purchased
by SP Processum and has since then been managed by MoRe Research. The spin pilot can be
used to spin viscose fibres from pilot made or fabric made viscose, which enables further
evaluation of the properties of dissolving cellulose by correlating them to the quality of the
viscose fibres.
In this study different spinning parameter’s importance for spinning of staple fibres was
evaluated in order to develop a robust and reliable spinning method. The effect of bleaching
on viscose fibres was also investigated along with the difference in result for preconditioned
and unconditioned fibres. A 23 full factorial design with four centre points was constructed
and performed. Evaluation of the results gave very poor models. The results showed that the
bleaching treatment had a great impact on the fibre properties. The bleaching had most likely
caused degradation of the viscose fibres which would be an explanation for the poor quality of
the models of the experimental design. The study also showed that it is important to condition
the viscose fibres before analysis in order to obtain reliable results.

II
III
Sammanfattning
Viskosprocessen har använts i över hundra år för att producera så kallade ”man-made” fibrer
från cellulosa. Processen är mycket mångsidig, små förändringar i olika delar av processen
kan göras för att få olika fiberegenskaper. Fiberegenskaperna bestäms av
regenereringsmekanismen vilket i sin tur beror på många processvariabler. Under 2012
inskaffade SP Processum en spinnpilot som sedan dess har använts av MoRe Research.
Spinnpiloten kan användas för att spinna viskosfibrer från pilottillverkad eller
fabriksproducerad viskos, vilket ger ytterligare en möjlighet att utvärdera egenskaper hos
dissolving cellulosa genom att korrelera dess egenskaper med kvalitéten på viskosfibrerna.
I denna studie utvärderades olika spinning parametrar betydelse för spinning av stapelfibrer
för att kunna utveckla en robust och tillförlitlig spinning metod. Dessutom undersöktes
effekten av blekning på viskosfiberegenskaperna och skillnaden mellan fibrer som
konditionerat och inte konditionerats innan analys. En 23 full faktoriell design med fyra
mittpunkter konstruerades och utfördes. Utvärdering av resultaten gav mycket dåliga
modeller. Resultaten visade att blekningsbehandlingen hade en stor inverkan på
fiberegenskaper. Blekningen hade troligen orsakat nedbrytning av viskosfibrerna, vilket skulle
förklara den dåliga kvalitéten på modellerna för den experimentella designen. Studien visade
också att det är viktigt att konditionera viskosfibrerna före analys för att få tillförlitliga
resultat.

IV
V
Abbreviations
Cellulose I: Naturally existing cellulose.
Cellulose II: Synthetically formed cellulose.
DOE: Design of Experiments.
DP: Degree of Polymerization.
Elongation: The percentage increase in length to the breaking point and is
expressed in %.
Godet: A roller.
HWM: High Wet Modulus.
MLR: Multiple Linear Regressions.
MVDA: Multivariate data Analysis.
OPLS: Orthogonal partial least squares projections to latent structures.
PCA: Principal component analysis.
PLS: Partial least squares projections to latent structures.
RI: Ripening index/Hottenroth index. Measure how fast the viscose
coagulates.
Spinneret: Nozzle with small holes used for spinning of fibres.
SUS-plot: Shared and unique structure plot.
Tenacity: Strength of a fibre or yarn, which is defined as the breaking
strength divided with the titre, expressed in the unit cN/dtex.
Tex: The mass in grams per 1000 meters.
Titre: Linear density, the weight per unit length of a yarn, expressed in
the unit tex.

VI
VII
Table of content
1. INTRODUCTION 1
1.1 Domsjö Fabriker AB 1
1.2 Background 1
1.3 Aim 2
1.4 Limitations 2
1.5 How to solve the problem 2
2. THEORY 2
2.1 The composition of wood 2
2.1.1 Cellulose 3
2.1.2 Hemicellulose 6
2.1.3 Lignin 7
2.2 The sulfite pulping process 8
2.2.1 Barking and chipping 8
2.2.2 Digestion 8
2.2.3 Bleaching 9
2.2.4 Finishing 9
2.2.5 Refining and recycling 9
2.3 The viscose process 10
2.3.1 Mercerisation 10
2.3.2 Pressing 11
2.3.3 Shredding 11
2.3.4 Ageing 11
2.3.5 Xanthation 11
2.3.6 Dissolving 11
2.3.7 Ripening 11
2.3.8 De-aeration and filtering 11
2.3.9 Spinning 11
2.3.10 Stretching 12
2.3.11 Finishing 12
2.4 Properties and applications of viscose rayon 12
2.4.1 Regular rayon 13
2.4.2 High performance staple fibres (Modal Fibres) 14
2.4.3 High tenacity rayon 14
2.5 Spinning of viscose fibers 14
2.5.1 Viscose dope 15
2.5.2 Spin bath 15
2.5.3. Modifiers and additives 16
2.5.4 Stretching 16
2.6 Bleaching 16
2.7 Spinning pilot, MoRe Research 17
2.8 Design of experiments 18
2.9 Multivariate data analysis 18
VIII
3. MATERIAL AND METHODS 19
3.1 Material 19
3.1.1 Viscose 19
3.1.2 Spinneret 19
3.2 Methods 20
3.2.1 Spinning 20
3.2.2 Sampling 21
3.2.3 Design of experiments 21
3.2.4 Effect of bleaching on viscose fibres 23
3.2.5 Multivariate data analysis 24
3.3 Analysis methods 24
3.3.1 Ripening index 24
3.3.2 Determination of cellulose and alkali content 24
3.3.4 Determination of linear density and tensile properties 25
4. RESULT AND DISCUSSION 25
4.1 Results from analysis with MODDE 25
4.2 Effect of bleaching on viscose fibres 28
4.2.1 Bleaching experiment with three different bleaching concentrations 28
4.2.2 Comparison between bleached and unbleached fibres in the experimental design 31
4.3 Conditioning before analysis 31
5. CONCLUSIONS 32
5.1 Recommendations 33
6. COMPLEMENTARY AND FUTURE WORK 33
7. ACKNOWLEDGEMENTS 34
REFERENCES 35
APPENDICES:
Spinning settings for each experiment. i
Analysis results for the fractional factorial design iii
1
1. Introduction
1.1 Domsjö Fabriker AB
Domsjö Fabriker AB in Örnsköldsvik, Sweden, started as a sulphite mill in 1903 and has
since then developed into the biorefinery the company is today. Domsjö Fabriker AB is now a
part of the Aditya Birla group, a multinational conglomerate from India with companies from
36 countries and a revenue of US $ 45 billion. Aditya Birla is one of the world's largest
manufacturers of viscose staple fibre, but also produce a lot of other different products e.g.
aluminium, cement and chemicals. In the Aditya Birla group, Domsjö is one of four cellulose
plants. Dissolving cellulose, lignin and bioethanol are the main products that Domsjö Fabriker
produce and as a part of the biorefinery concept (i.e. using all the components in a tree and
refine them into valuable products), Domsjö also produces biogas, bioresin, bioenergy and
carbon acid. Specialty cellulose main area of use is the fashion and textile industry as the raw
material for viscose manufacturing, but it can also be used as sausage casing, filling in
medical tablets and as thickening agent in paint and food.[1][2]
1.2 Background
The viscose process has been used for over hundred years to produce man-made fibres from
cellulose. The process is very versatile; modifications at different stages in the process can be
done to obtain different fibre properties. The regeneration mechanism determines the fibre
tensile properties and depends on many process variables. Fibre tenacity should be
proportional to the stretch applied to the filaments during the spinning stage i.e. more stretch
result in more orientation, which in turn leads to higher strength. However, the higher the
tenacity is, the lower the extensibility of the fibre, which means that the fibre strength and the
extensibility must be weighed against each other in order to obtain desirable fibre
properties.[3]
The allowable stretch depends on the extent to which regeneration of the
cellulose can be retarded. The delay of regeneration depends on the viscose composition,
ripening index, viscose viscosity, spin bath composition and temperature of the spin bath.
Addition of modifiers also helps to delay the regeneration and increase the stretch.
Consequently, the viscose process is a multivariate system.
Dissolving cellulose (i.e. a pulp with low lignin and hemicelluloses content) is mainly used
for production of viscose and spinning of viscose staple fibres. The quality of the dissolving
cellulose is regularly assessed with different cellulose analysis; however one of the most
effective ways to evaluate the cellulose quality for viscose manufacturing is to produce
viscose in pilot scale. The research and development company MoRe Research has a viscose
micro pilot, which enable determination of cellulose suitability for viscose production by
evaluation of the viscose dope. In 2012, a spin pilot was purchased by SP Processum and has
since then been managed by MoRe Research. The spin pilot can be used to spin viscose fibres
from pilot made or fabric made viscose, which enables further evaluation of the properties of
dissolving cellulose by correlating them to the quality of the viscose fibres.
2
1.3 Aim
The main purpose of this master thesis is to define important parameters for spinning of staple
fibre in the viscose pilot plant at MoRe Research. This is done to be able to develop a robust
and reliable test method with more optimized settings for the spin pilot at MoRe Research for
evaluation of dissolving cellulose with respect to the manufacturing of viscose.
1.4 Limitations
The main limitations for what can be accomplished in this project are due to the budget
restriction and the time limit. The number of experiments performed was narrowed to be as
few as possible to minimize the cost and keep the project within the time limit, but still be
sufficient enough to obtain desirable information from the results and accomplish proper
evaluation of the data.
The project is focused on spinning of staple fibres and examining the influence of a limited
number of chosen spinning parameters on the viscose fibre properties. Only three parameters
were chosen for investigation, to minimize the amount of experiments. The choice of the
parameters and their settings were based on knowledge obtained from the literature study. The
process variables were chosen due to their theoretically large impact on the final fibre
properties and are varied in the industries to obtain desirable fibre properties. The interval
chosen for the process variables were set to be in the intervals that are used for spinning of
viscose fibres in the industries. The fibre properties that were examined were titre, tenacity
and elongation.
1.5 How to solve the problem
Fabric viscose from the same batch was used for spinning of the staple fibres in the spin pilot
and the process settings such as the spin bath composition and the applied stretch was varied
according to the experimental design (found in table 5 in section 3.2.3). After the spinning
was finished the fibres were washed, bleached, dried and then sent to analysis. The
relationship between the spinning parameters and the fibre properties was evaluated.
Comparison between bleached fibres and unbleached fibres was done to evaluate the
bleaching effect on the fibre properties.
2. Theory
2.1 The composition of wood
Cellulose, hemicellulose and lignin are the main compounds in tree cell walls. Substances
with low molecular-weight e.g. extractives can also be found in the tree, but to a lower extent.
The relative amount of cellulose, hemicellulose and lignin, as well as the chemical
composition of the two latter, vary between different wood species; between softwood (e.g.
spruce and pine) and hardwood (e.g. birch and maple).[4]
Domsjö Fabriker uses spruce and
pine as raw materials. The cellulose, hemicellulose and lignin content in spruce and pine are
41-42%, 28% and 27% respectively.[5]
3
2.1.1 Cellulose
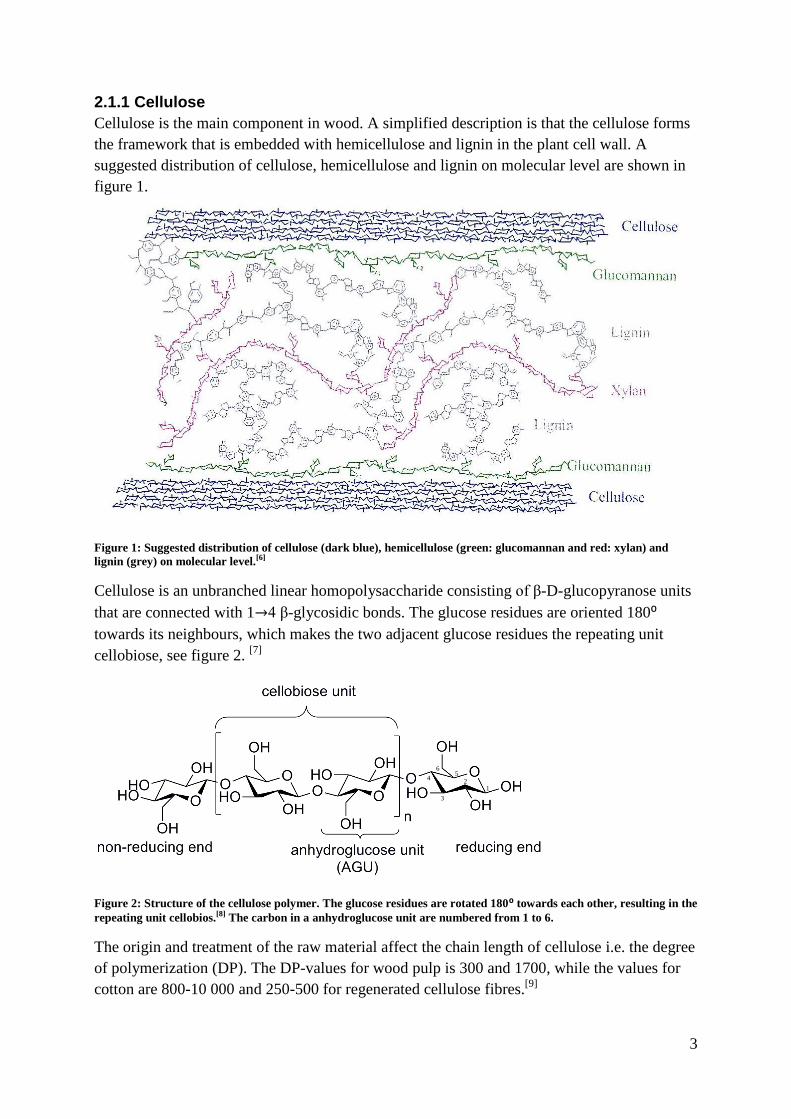
Cellulose is the main component in wood. A simplified description is that the cellulose forms
the framework that is embedded with hemicellulose and lignin in the plant cell wall. A
suggested distribution of cellulose, hemicellulose and lignin on molecular level are shown in
figure 1.
Figure 1: Suggested distribution of cellulose (dark blue), hemicellulose (green: glucomannan and red: xylan) and
lignin (grey) on molecular level.[6]
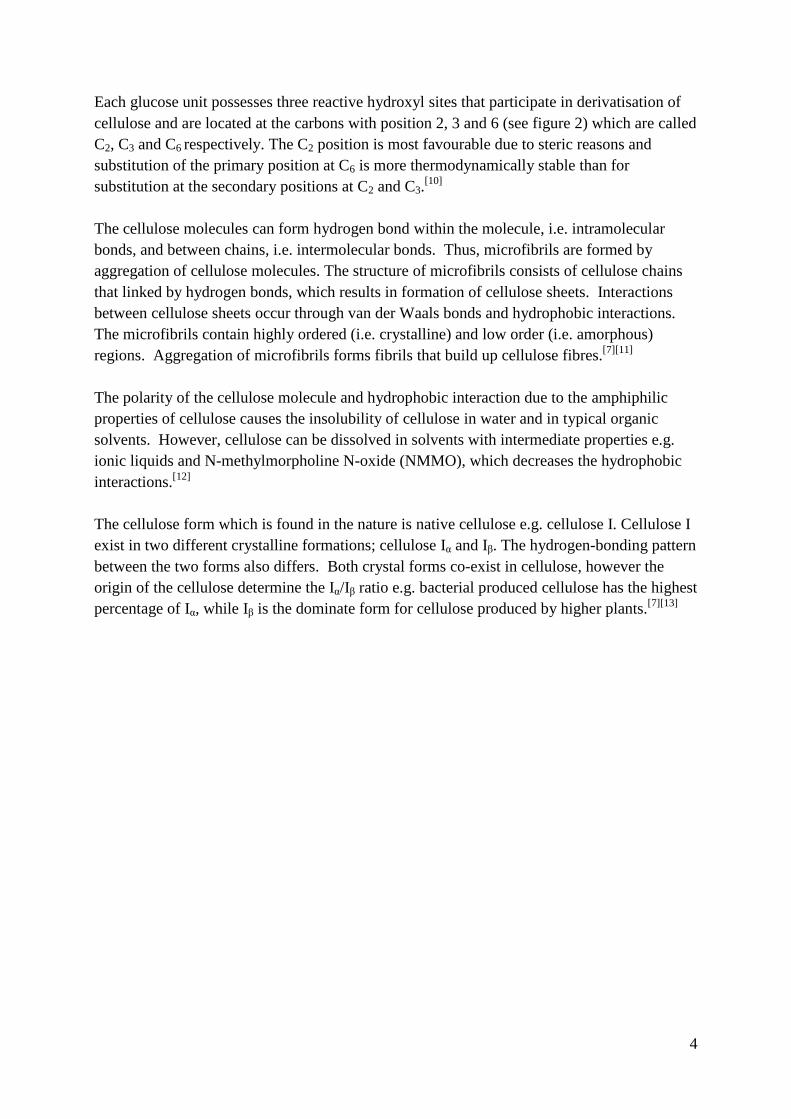
Cellulose is an unbranched linear homopolysaccharide consisting of β-D-glucopyranose units
that are connected with 1 4 β-glycosidic bonds. The glucose residues are oriented 180⁰
towards its neighbours, which makes the two adjacent glucose residues the repeating unit
cellobiose, see figure 2. [7]
Figure 2: Structure of the cellulose polymer. The glucose residues are rotated 180⁰ towards each other, resulting in the
repeating unit cellobios.[8] The carbon in a anhydroglucose unit are numbered from 1 to 6.
The origin and treatment of the raw material affect the chain length of cellulose i.e. the degree
of polymerization (DP). The DP-values for wood pulp is 300 and 1700, while the values for
cotton are 800-10 000 and 250-500 for regenerated cellulose fibres.[9]
1 2
3
4
6 5
4
Each glucose unit possesses three reactive hydroxyl sites that participate in derivatisation of
cellulose and are located at the carbons with position 2, 3 and 6 (see figure 2) which are called
C2, C3 and C6 respectively. The C2 position is most favourable due to steric reasons and
substitution of the primary position at C6 is more thermodynamically stable than for
substitution at the secondary positions at C2 and C3.[10]
The cellulose molecules can form hydrogen bond within the molecule, i.e. intramolecular
bonds, and between chains, i.e. intermolecular bonds. Thus, microfibrils are formed by
aggregation of cellulose molecules. The structure of microfibrils consists of cellulose chains
that linked by hydrogen bonds, which results in formation of cellulose sheets. Interactions
between cellulose sheets occur through van der Waals bonds and hydrophobic interactions.
The microfibrils contain highly ordered (i.e. crystalline) and low order (i.e. amorphous)
regions. Aggregation of microfibrils forms fibrils that build up cellulose fibres.[7][11]
The polarity of the cellulose molecule and hydrophobic interaction due to the amphiphilic
properties of cellulose causes the insolubility of cellulose in water and in typical organic
solvents. However, cellulose can be dissolved in solvents with intermediate properties e.g.
ionic liquids and N-methylmorpholine N-oxide (NMMO), which decreases the hydrophobic
interactions.[12]
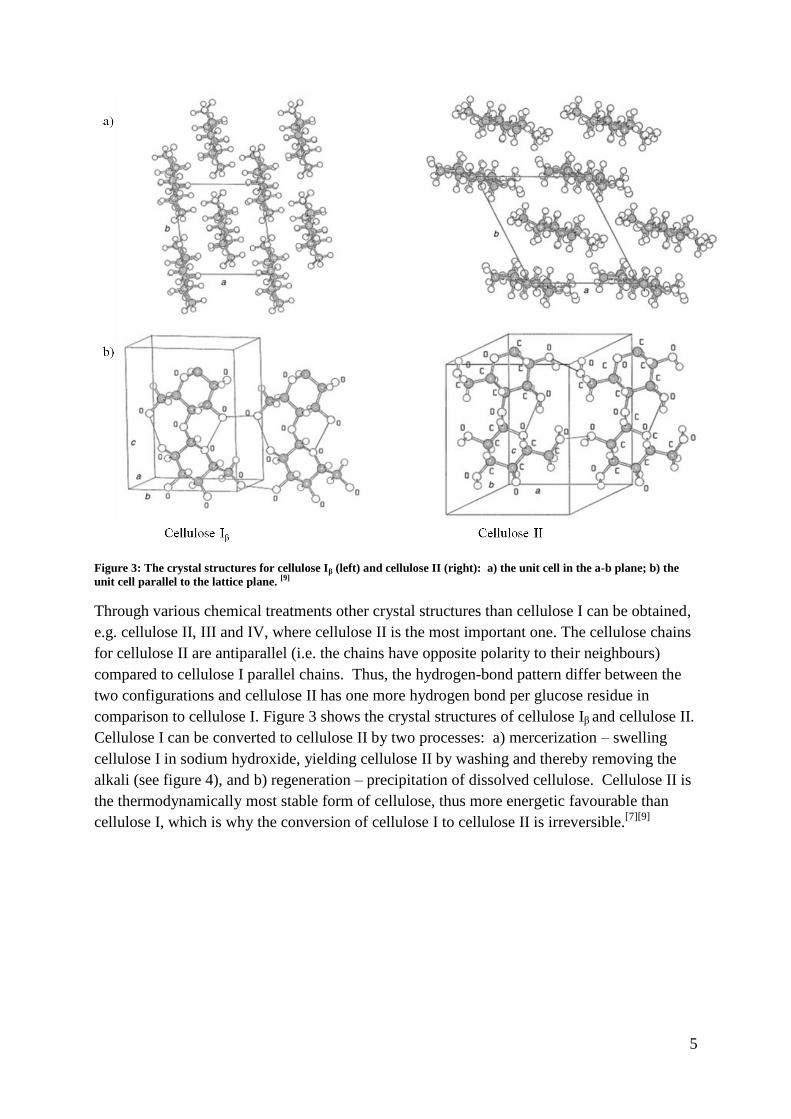
The cellulose form which is found in the nature is native cellulose e.g. cellulose I. Cellulose I
exist in two different crystalline formations; cellulose Iα and Iβ. The hydrogen-bonding pattern
between the two forms also differs. Both crystal forms co-exist in cellulose, however the
origin of the cellulose determine the Iα/Iβ ratio e.g. bacterial produced cellulose has the highest
percentage of Iα, while Iβ is the dominate form for cellulose produced by higher plants.[7][13]
5
Figure 3: The crystal structures for cellulose Iβ (left) and cellulose II (right): a) the unit cell in the a-b plane; b) the
unit cell parallel to the lattice plane. [9]
Through various chemical treatments other crystal structures than cellulose I can be obtained,
e.g. cellulose II, III and IV, where cellulose II is the most important one. The cellulose chains
for cellulose II are antiparallel (i.e. the chains have opposite polarity to their neighbours)
compared to cellulose I parallel chains. Thus, the hydrogen-bond pattern differ between the
two configurations and cellulose II has one more hydrogen bond per glucose residue in
comparison to cellulose I. Figure 3 shows the crystal structures of cellulose Iβ and cellulose II.
Cellulose I can be converted to cellulose II by two processes: a) mercerization – swelling
cellulose I in sodium hydroxide, yielding cellulose II by washing and thereby removing the
alkali (see figure 4), and b) regeneration – precipitation of dissolved cellulose. Cellulose II is
the thermodynamically most stable form of cellulose, thus more energetic favourable than
cellulose I, which is why the conversion of cellulose I to cellulose II is irreversible.[7][9]
6
Figure 4: Schematic suggestion of how cellulose I convert to cellulose II. Treatment of parallel cellulose I with NaOH
cause the cellulose to swell and become alkali cellulose. Cellulose II with anti-parallel chains is formed when the alkali
is washed away.[7]
2.1.2 Hemicellulose
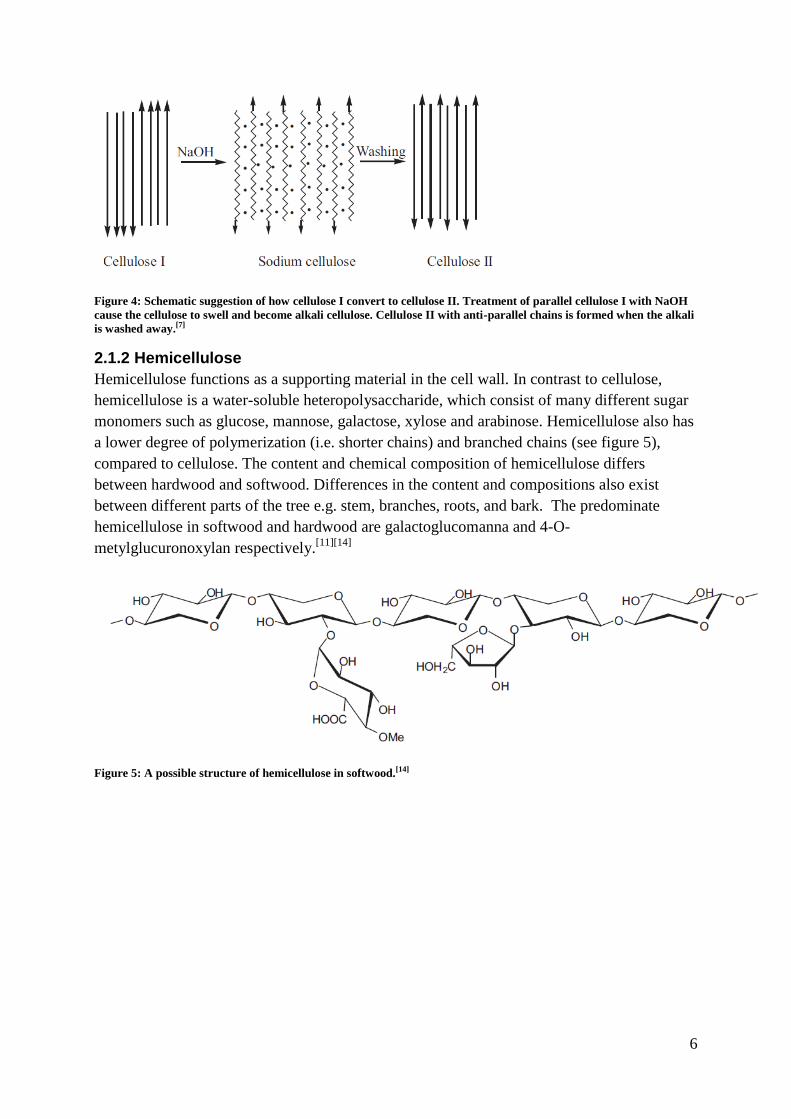
Hemicellulose functions as a supporting material in the cell wall. In contrast to cellulose,
hemicellulose is a water-soluble heteropolysaccharide, which consist of many different sugar
monomers such as glucose, mannose, galactose, xylose and arabinose. Hemicellulose also has
a lower degree of polymerization (i.e. shorter chains) and branched chains (see figure 5),
compared to cellulose. The content and chemical composition of hemicellulose differs
between hardwood and softwood. Differences in the content and compositions also exist
between different parts of the tree e.g. stem, branches, roots, and bark. The predominate
hemicellulose in softwood and hardwood are galactoglucomanna and 4-O-
metylglucuronoxylan respectively.[11][14]
Figure 5: A possible structure of hemicellulose in softwood.[14]
7
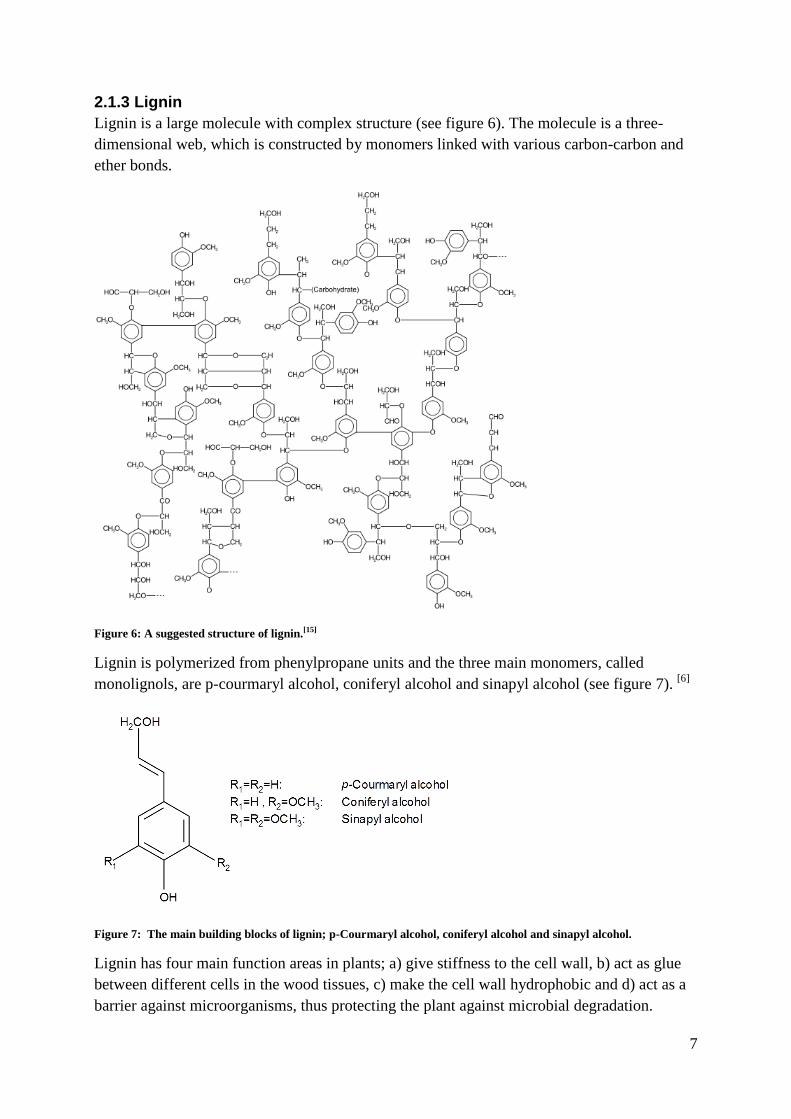
2.1.3 Lignin
Lignin is a large molecule with complex structure (see figure 6). The molecule is a three-
dimensional web, which is constructed by monomers linked with various carbon-carbon and
ether bonds.
Figure 6: A suggested structure of lignin.[15]
Lignin is polymerized from phenylpropane units and the three main monomers, called
monolignols, are p-courmaryl alcohol, coniferyl alcohol and sinapyl alcohol (see figure 7). [6]
Figure 7: The main building blocks of lignin; p-Courmaryl alcohol, coniferyl alcohol and sinapyl alcohol.
Lignin has four main function areas in plants; a) give stiffness to the cell wall, b) act as glue
between different cells in the wood tissues, c) make the cell wall hydrophobic and d) act as a
barrier against microorganisms, thus protecting the plant against microbial degradation.
8
Lignin is suitable for executing these functions due to its structure. Since lignin is insoluble in
water various treatments such as sulfonation, oxidation and hydrolysis are needed to increase
the water solubility of the molecule.[6]
2.2 The sulphite pulping process
The sulphite process is a chemical process and can be carried out under different conditions
i.e. acidic, neutral and alkaline, where the acidic sulphite pulping process is the most
common. Hydrogen sulphite (HSO3-) and sulphur dioxides (SO2) are the main chemical
agents in the acidic process with counter ions e.g. Ca2+
, Mg2+
and Na+. The pH of the reaction
media affects the reactions of HSO3- and SO2 with lignin. The general reactions that take
place in the acidic sulphite pulping process are: a) sulfonation - the softening of the lignin that
makes it more hydrophilic, b) hydrolysis – the breaking of linkages between lignin and
carbohydrates and inter-lignin bonds, resulting in smaller lignin fragments making it more
water soluble and c) condensation – the formation of carbon-carbon bonds, making the lignin
more insoluble, which is an undesired process.[4]
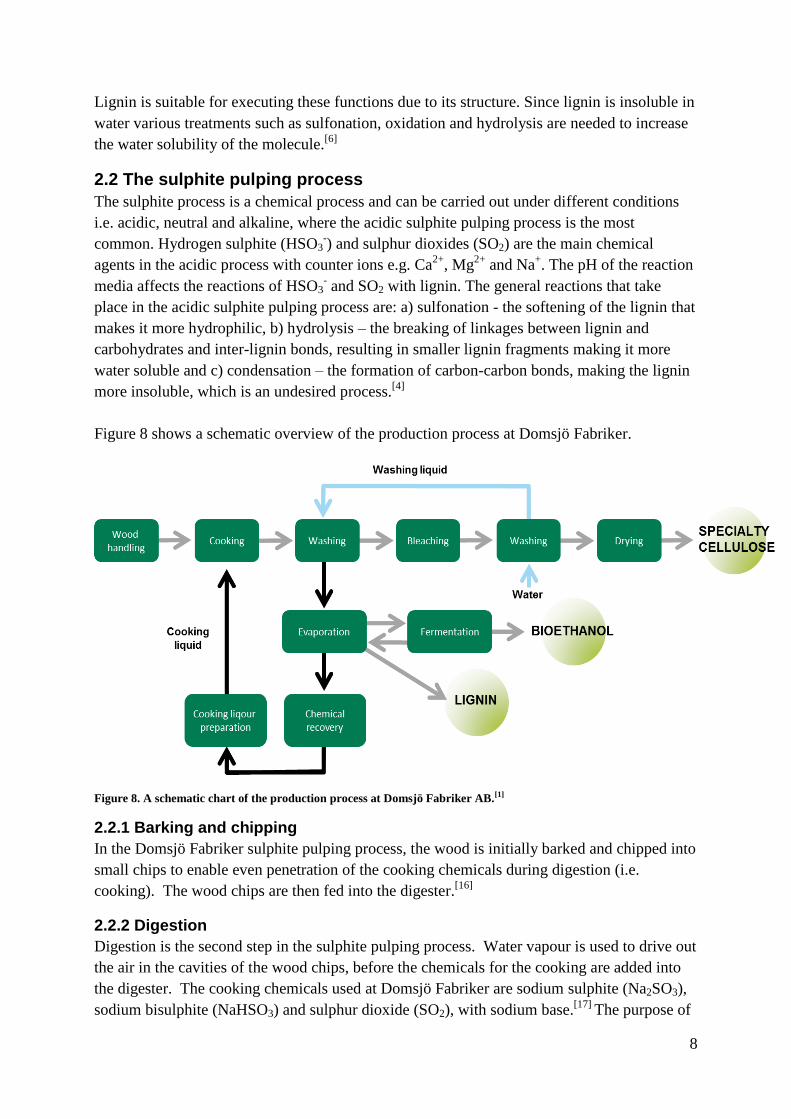
Figure 8 shows a schematic overview of the production process at Domsjö Fabriker.
Figure 8. A schematic chart of the production process at Domsjö Fabriker AB.[1]
2.2.1 Barking and chipping
In the Domsjö Fabriker sulphite pulping process, the wood is initially barked and chipped into
small chips to enable even penetration of the cooking chemicals during digestion (i.e.
cooking). The wood chips are then fed into the digester.[16]
2.2.2 Digestion
Digestion is the second step in the sulphite pulping process. Water vapour is used to drive out
the air in the cavities of the wood chips, before the chemicals for the cooking are added into
the digester. The cooking chemicals used at Domsjö Fabriker are sodium sulphite (Na2SO3),
sodium bisulphite (NaHSO3) and sulphur dioxide (SO2), with sodium base.[17]
The purpose of
9
the digestion is removal of lignin and hemicellulose, to enable separation of the cellulose
fibres. The dissolving of hemicellulose occurs to an extent that the cellulose molecules are not
destroyed. The digestion with sodium base takes place in two steps each with different
temperatures and pH. When desirable viscosity of the pulp is reached the digestion is stopped.
The viscosity is measured by assessing the colour on the cooking liquor.
After digestion the cellulose is washed to remove cooking chemicals and dissolved lignin and
hemicellulose.[17]
2.2.3 Bleaching
The first step in the bleaching of the cellulose pulp is alkalisation with NaOH to dissolve and
remove lignin residues. This also causes removal of some of the remaining hemicellulose. The
remaining lignin is activated by the process for the following bleaching steps.[18]
In the second
bleaching step, hydrogen peroxide (H2O2) is used for further removal of the lignin. The
hydrogen peroxide reacts with the functional groups of lignin, which results in smaller water-
soluble lignin fragments and an increase in the brightness of the pulp due to the decrease in
the light absorption of lignin.[19][20]
2.2.4 Finishing
When the bleaching process is finished, the pulp is washed and dried. The dried pulp is then
cut into sheets, which is bundled together into bales ready for shipping.[21]
2.2.5 Refining and recycling
At Domsjö Fabriker the used cooking liquor is evaporated to reduce the water content as
much as possible, which enables extraction of energy by burning organic content, production
of ethanol by fermentation of the degraded hemicellulose and further refinements of
chemicals for production of lingosulfonate.[22]
When the melt from the combustion of the organic material is dissolved in water, “green
liquor” is produced. By various treatment steps of the “green liquor” the cooking chemicals
are recovered and recycled.[23]
10
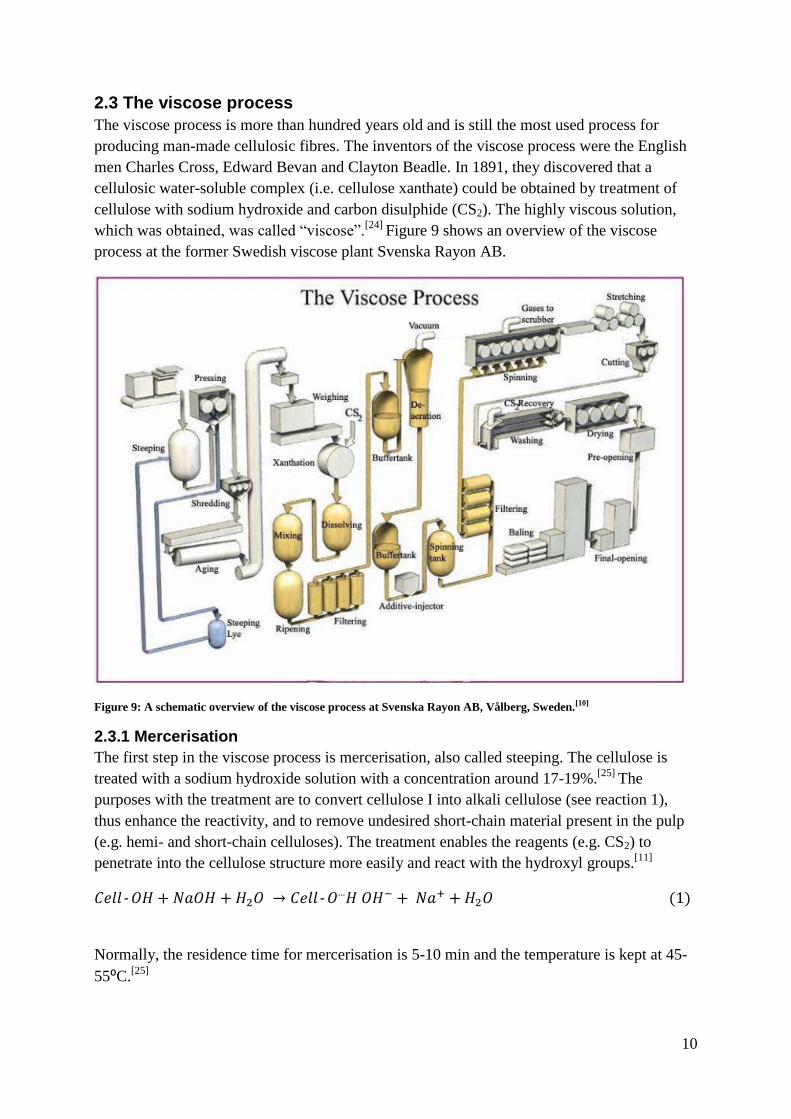
2.3 The viscose process
The viscose process is more than hundred years old and is still the most used process for
producing man-made cellulosic fibres. The inventors of the viscose process were the English
men Charles Cross, Edward Bevan and Clayton Beadle. In 1891, they discovered that a
cellulosic water-soluble complex (i.e. cellulose xanthate) could be obtained by treatment of
cellulose with sodium hydroxide and carbon disulphide (CS2). The highly viscous solution,
which was obtained, was called “viscose”.[24]
Figure 9 shows an overview of the viscose
process at the former Swedish viscose plant Svenska Rayon AB.
Figure 9: A schematic overview of the viscose process at Svenska Rayon AB, Vålberg, Sweden.[10]
2.3.1 Mercerisation
The first step in the viscose process is mercerisation, also called steeping. The cellulose is
treated with a sodium hydroxide solution with a concentration around 17-19%.[25]
The
purposes with the treatment are to convert cellulose I into alkali cellulose (see reaction 1),
thus enhance the reactivity, and to remove undesired short-chain material present in the pulp
(e.g. hemi- and short-chain celluloses). The treatment enables the reagents (e.g. CS2) to
penetrate into the cellulose structure more easily and react with the hydroxyl groups.[11]
- - … (1)
Normally, the residence time for mercerisation is 5-10 min and the temperature is kept at 45-
55⁰C.[25]
11
2.3.2 Pressing
Excess NaOH is removed from the alkali cellulose slurry by mechanical pressing. Dissolved
hemicellulose is removed with the NaOH. However, some hemicellulose remains since the
alkali cellulose still contains NaOH. Most of the drawn off NaOH is re-used in the
mercerisation step.[25]
2.3.3 Shredding
After the pressing step, shredding of the cellulose is performed to increase reactivity area of
the alkali cellulose.[25]
2.3.4 Ageing
To obtain an acceptable viscosity of the viscose dope the degree of polymerization (DP) of the
cellulose needs to be reduced. The cellulose is degraded through oxidation due to reactions
with oxygen from the air.[25]
2.3.5 Xanthation
Treatment of the alkali cellulose with CS2 vapour produces sodium cellulose xanthate:
- - (2)
The target level of CS2 and the temperature determine the time for complete xanthation,
which is usually 0.5-1.5 hours.[25]
The cellulose xanthate compound is soluble in NaOH
solution but very unstable. Side-reactions occur during the xanthation process e.g. formation
of trithiocarbonate, which is responsible for the orange/yellow colour of the xanthate (and
viscose dope).[10]
2.3.6 Dissolving
The cellulose xanthate is dissolved in sodium hydroxide solution to form viscose dope. The
cellulose chains are forced apart by the xanthate substituents, which reduce the hydrogen
bonds between the chains and thus allowing dissolution of cellulose in the NaOH-solution.
2.3.7 Ripening
Redistribution of the xanthate groups occur in the viscose dope during the ripening step.
Hydrolysis of xanthate groups will release CS2, which can either react with other hydroxyls
within the molecule (i.e. rearrangement from the kinetically favourable positions at C2 and C3
to the thermodynamically stable position at C6) or disappear as a by-product.[10][26]
2.3.8 De-aeration and filtering
The viscose dope is de-aerated and filtered, to remove dispersed air and particles before the
spinning step. Impurities in the viscose dope can cause blockage of the holes of the spinnerets
(i.e. a nozzle with small holes) and dispersed air or other gases in the dope can lead to
unstable spinning.[25]
2.3.9 Spinning
The viscose dope is pressed through the small holes of the spinneret into an acid spin bath,
creating a fine viscose filament from each hole. The cellulose is regenerated by the sulphuric
acid in the spin bath:
12
- - (3)
The spin bath usually contains H2SO4, NaSO4 and ZnSO4 in various concentrations. The rate
of regeneration is determined by the composition of the spin bath, which also affects the
properties of the regenerated fibres.[25]
2.3.10 Stretching
The viscose fibres need to be stretched before the regeneration to achieve satisfactory tensile
properties. Because the structure within the filaments is not fixed in early stages of the
regeneration process, the cellulose chains can be aligned along the fibre axis by stretching.[25]
2.3.11 Finishing
The cellulose filaments are cut into proper length, which depend on the desired end-product.
Then the fibre is washed to remove unwanted remains from the spin bath such as dihydrogen
sulphide, carbon disulphide and zinc sulphide. Fatty agents are used on the fibres to improve
surface parameters e.g. glossiness, depending on the end product. After the washing steps the
fibres are dried and then pressed into bales.[10]
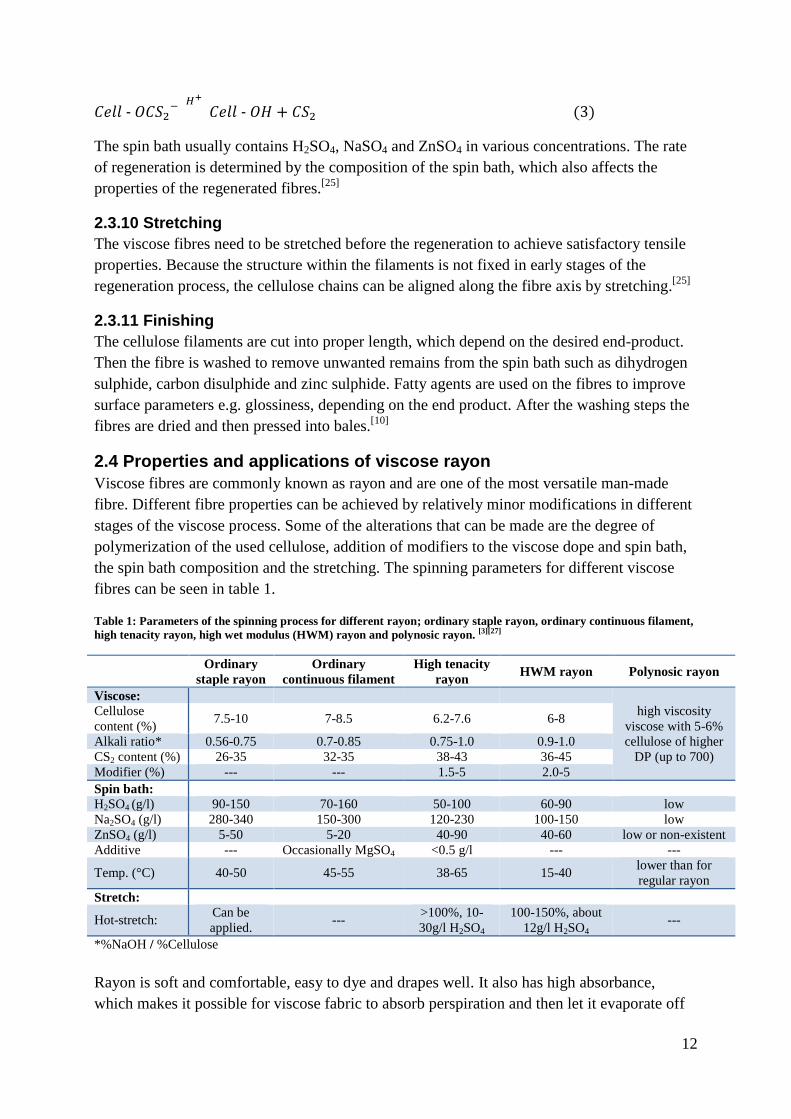
2.4 Properties and applications of viscose rayon
Viscose fibres are commonly known as rayon and are one of the most versatile man-made
fibre. Different fibre properties can be achieved by relatively minor modifications in different
stages of the viscose process. Some of the alterations that can be made are the degree of
polymerization of the used cellulose, addition of modifiers to the viscose dope and spin bath,
the spin bath composition and the stretching. The spinning parameters for different viscose
fibres can be seen in table 1.
Table 1: Parameters of the spinning process for different rayon; ordinary staple rayon, ordinary continuous filament,
high tenacity rayon, high wet modulus (HWM) rayon and polynosic rayon. [3][27]
Ordinary
staple rayon
Ordinary
continuous filament
High tenacity
rayon HWM rayon Polynosic rayon
Viscose:
high viscosity
viscose with 5-6%
cellulose of higher
DP (up to 700)
Cellulose
content (%) 7.5-10 7-8.5 6.2-7.6 6-8
Alkali ratio* 0.56-0.75 0.7-0.85 0.75-1.0 0.9-1.0
CS2 content (%) 26-35 32-35 38-43 36-45
Modifier (%) --- --- 1.5-5 2.0-5
Spin bath:
H2SO4 (g/l) 90-150 70-160 50-100 60-90 low
Na2SO4 (g/l) 280-340 150-300 120-230 100-150 low
ZnSO4 (g/l) 5-50 5-20 40-90 40-60 low or non-existent
Additive --- Occasionally MgSO4 <0.5 g/l --- ---
Temp. (°C) 40-50 45-55 38-65 15-40 lower than for
regular rayon
Stretch:
Hot-stretch: Can be
applied. ---
>100%, 10-
30g/l H2SO4
100-150%, about
12g/l H2SO4 ---
*%NaOH / %Cellulose
Rayon is soft and comfortable, easy to dye and drapes well. It also has high absorbance,
which makes it possible for viscose fabric to absorb perspiration and then let it evaporate off
13
the skin. Some of the applications of rayon are manufacturing of clothing textiles, domestic
textiles e.g. bedspread, tablecloths and curtains and manufacturing of industrial textiles used
for products such as tyre cords and hoses. Rayon is produced as filament and staple fibres, out
of which staple fibres are most common.[28]
It is classified into different types, e.g. regular
rayon, Modal, high tenacity rayon, based on chemical and physical properties such as tenacity
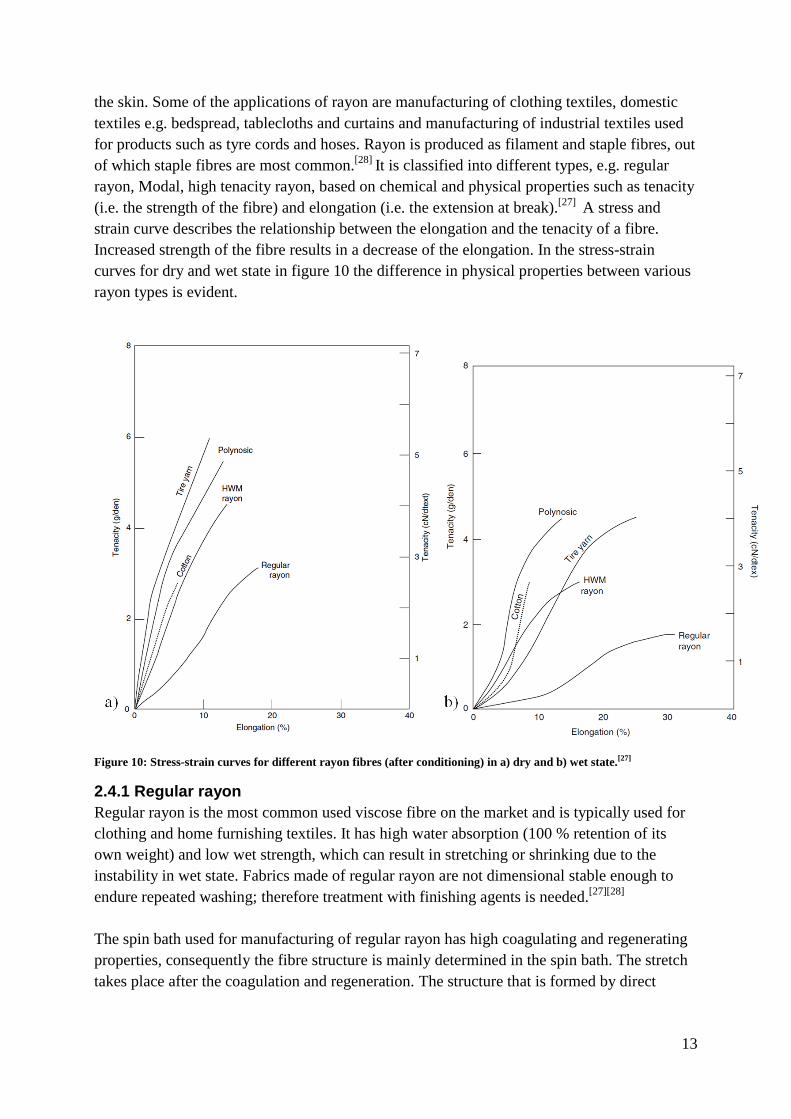
(i.e. the strength of the fibre) and elongation (i.e. the extension at break).[27]
A stress and
strain curve describes the relationship between the elongation and the tenacity of a fibre.
Increased strength of the fibre results in a decrease of the elongation. In the stress-strain
curves for dry and wet state in figure 10 the difference in physical properties between various
rayon types is evident.
Figure 10: Stress-strain curves for different rayon fibres (after conditioning) in a) dry and b) wet state.[27]
2.4.1 Regular rayon
Regular rayon is the most common used viscose fibre on the market and is typically used for
clothing and home furnishing textiles. It has high water absorption (100 % retention of its
own weight) and low wet strength, which can result in stretching or shrinking due to the
instability in wet state. Fabrics made of regular rayon are not dimensional stable enough to
endure repeated washing; therefore treatment with finishing agents is needed.[27][28]
The spin bath used for manufacturing of regular rayon has high coagulating and regenerating
properties, consequently the fibre structure is mainly determined in the spin bath. The stretch
takes place after the coagulation and regeneration. The structure that is formed by direct
14
coagulation of cellulose is a fringed micellar structure where blocks of crystallites are linked
together with molecules in an amorphous region.[27]
2.4.2 High performance staple fibres (Modal Fibres)
High performance fibres (generic name Modal) have high tenacity and high wet modulus
(HWM) i.e. resistance to extension when wet. Due to these properties, Modal fabrics have
high resistance to dimensional changes. Modal fibres are mainly manufactured by two
processes; the polynosic-fibre process and the high wet modulus (HWM) process. The
difference in the two processes can be seen in table 1. In the polynosic process, the low acid
and zinc spin bath concentrations in combination with the low spin bath temperature makes it
possible to apply very high stretch (up to 300%). Polynosic fibres have high alkali resistance
but are brittle. HWM fibres have similar modulus as cotton, i.e. the ratio between change of
stress and change of strain (see stress-strain curves in figure 10). However, HWM fabrics do
not wrinkle.[3][27]
When producing Modal fibres the coagulation and stretch occur together
before the regeneration and crystallisation, which results in a fibrillar structure of the fibre
(long crystalline regions linked with molecules in amorphous regions).[27]
2.4.3 High tenacity rayon
Production of high tenacity rayon is made by modification of the regular rayon process. High
stretch is applied to increase the degree of orientation and thus high crystallinity. This results
in increased wet and dry strength while the elongation is decreased. High tenacity rayon is
thermostable and has low shrinkage (shrink in hot water). The main use of high tenacity rayon
is as a reinforcing fabric in mechanical rubber goods e.g. tyres, hoses and drives belts.[27]
2.5 Spinning of viscose fibres
Spinning is a complex process where several chemical and physical reactions occur almost at
the same time. Initially, the viscose coagulates and forms a skin around the filament due to the
acid and salt in the spin bath. Then, neutralization of the alkali occurs when the acid begins to
make a way into the viscose filaments. Simultaneously, decomposition of cellulose xanthate
takes place leading to regeneration of cellulose and carbon disulphide. The diffusion rate
affects the rates of the chemical reactions that take place in the fibre formation, which is the
reason why the extent of the reaction across the fibre diameter will vary. The conversions of
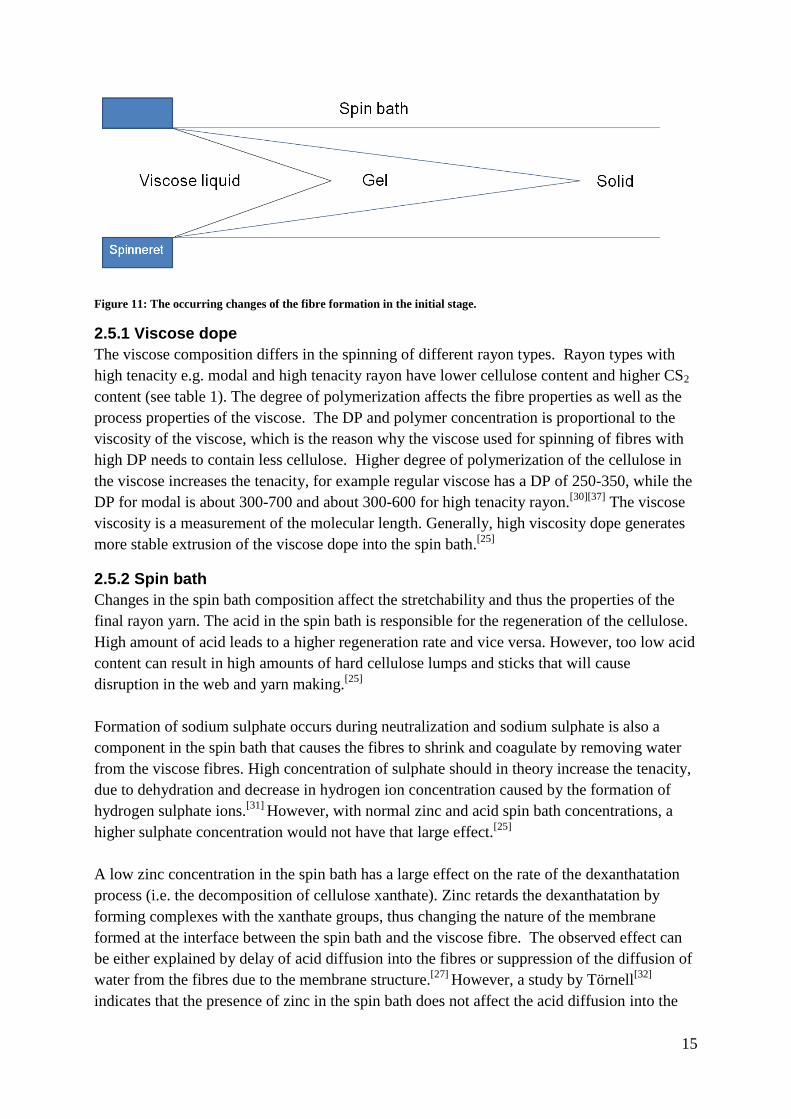
one filament which take place during the initial fibre formation are schematically shown in
figure 11. In the spinning process many of the final properties of rayon is predetermined. The
properties can be affected by the viscose and spin bath composition as well as the parameters
of the spinning scheme e.g. applied stretch, temperature of the spin bath and the design of the
nozzle and nozzle holes.[27][29]
15
Figure 11: The occurring changes of the fibre formation in the initial stage.
2.5.1 Viscose dope
The viscose composition differs in the spinning of different rayon types. Rayon types with
high tenacity e.g. modal and high tenacity rayon have lower cellulose content and higher CS2
content (see table 1). The degree of polymerization affects the fibre properties as well as the
process properties of the viscose. The DP and polymer concentration is proportional to the
viscosity of the viscose, which is the reason why the viscose used for spinning of fibres with
high DP needs to contain less cellulose. Higher degree of polymerization of the cellulose in
the viscose increases the tenacity, for example regular viscose has a DP of 250-350, while the
DP for modal is about 300-700 and about 300-600 for high tenacity rayon.[30][37]
The viscose
viscosity is a measurement of the molecular length. Generally, high viscosity dope generates
more stable extrusion of the viscose dope into the spin bath.[25]
2.5.2 Spin bath
Changes in the spin bath composition affect the stretchability and thus the properties of the
final rayon yarn. The acid in the spin bath is responsible for the regeneration of the cellulose.
High amount of acid leads to a higher regeneration rate and vice versa. However, too low acid
content can result in high amounts of hard cellulose lumps and sticks that will cause
disruption in the web and yarn making.[25]
Formation of sodium sulphate occurs during neutralization and sodium sulphate is also a
component in the spin bath that causes the fibres to shrink and coagulate by removing water
from the viscose fibres. High concentration of sulphate should in theory increase the tenacity,
due to dehydration and decrease in hydrogen ion concentration caused by the formation of
hydrogen sulphate ions.[31]
However, with normal zinc and acid spin bath concentrations, a
higher sulphate concentration would not have that large effect.[25]
A low zinc concentration in the spin bath has a large effect on the rate of the dexanthatation
process (i.e. the decomposition of cellulose xanthate). Zinc retards the dexanthatation by
forming complexes with the xanthate groups, thus changing the nature of the membrane
formed at the interface between the spin bath and the viscose fibre. The observed effect can
be either explained by delay of acid diffusion into the fibres or suppression of the diffusion of
water from the fibres due to the membrane structure.[27]
However, a study by Törnell[32]
indicates that the presence of zinc in the spin bath does not affect the acid diffusion into the
16
fibres, which makes it more likely that the zinc effect is caused by the suppression of water.
The presence of zinc in the spin bath allows high stretch to be applied, which in turn results in
high tenacity fibres.
The temperature of the spin bath does also affect the regeneration rate. High temperature leads
to faster regeneration.[26]
In a zinc-free spin bath the temperature have a large effect on the
decomposition of cellulose xanthate and is, according to Törnell’s study of viscose spinning,
the most important variable for zinc-free spinning.[31]
2.5.3. Modifiers and additives
Organic compounds, e.g. amines, quaternary bases, polyethylene oxides and
dithiocarbamates, can be added to the viscose and/or to the spin bath in order to delay the
regeneration. Interactions between modifiers and other components in the spinning system
can provide control over the development of the fibre structure. Interactions between
and ions in contact with modifiers is believed to cause the formation of a quite stable
layer, consisting of compounds containing sulphur and zinc, on the surface of the fibres.[3]
This causes decreasing diffusion rate of acid penetration and decreased water removal from
the viscose dope. The use of modifiers changes the crystallite size and delays the regeneration
as well as increase the allowable stretch. This is the reasons why modifiers are used to obtain
fibres with high tenacity.[27]
2.5.4 Stretching
The fibres must be stretched during or shortly after the extrusion of the viscose to achieve
satisfactory tensile properties. The stretchability depends on the degree to which regeneration
of the cellulose can be delayed and is affected by the spinning parameters mention above (e.g.
viscose and spin bath compositions). High stretch results in more oriented chains and more
rigid crystalline structure, hence higher tenacity. The maximum tenacity which can be
obtained by stretching is achieved by applying spinning stretch below the break stretch, i.e.
the stretch where the fibres will rupture under the prevailing spinning conditions. When
stretch is applied beyond this optimum, the fibre structure is disrupted, which affects the
strength negatively. Hot-stretch in diluted sulphuric acid enables the structure of the fibre to
be fixed in its maximum orientation state, which results in fibres with high tenacity
properties.[25][27]
If the stretch is applied sufficiently far away from the nozzle or in a second
bath (e.g. hot-stretch), the applied stretch has a great impact on the final fibre properties.
However, if the stretch instead occurs close to the nozzle, it has very little effect on the fibre
properties.[29]
The degree of stretch applied on the fibres along with the number of spinneret
holes and the viscose delivery rate to the spinneret determine the fibre titre, which can
simplified be described as the thickness of the fibre and is measured in the unit tex (i.e. the
mass in grams per 1000 meters) or denier (i.e. the mass in grams per 900 meters).[27]
2.6 Bleaching
Bleaching is an after treatment of the viscose fibres, which can be performed to give the fibres
a bright appearance. Sodium hypochlorite is commonly used as a bleaching agent for
cellulosic fibres; however it also has a degrading effect on cellulose. The pH has a large
impact on the bleaching action of NaOCl. At a high pH (above 9.5) the degradation of
17
cellulose is very small, but at lower pH (below 8.5) fast bleaching and severe fibre
degradation occurs. The decomposition of the bleaching chemicals and reactions between the
bleaching agent and cellulose are assumed to create free radicals, which cause oxidation
reactions. Oxidation reactions results in conversion of the cellulose hydroxyl-groups into
carboxyl, ketone and aldehyde groups, where the products are called oxycellulose. Hydrolysis
reactions can also take place, leading to the formation of hydrocellulose. The formation of
oxycelluloses and hydrocelluloses causes cellulose degradation. Since the structure of
ordinary rayon has low ordered crystallinity, it is very accessible for chemicals and therefore
the effect from bleaching can be severe.[33][34]
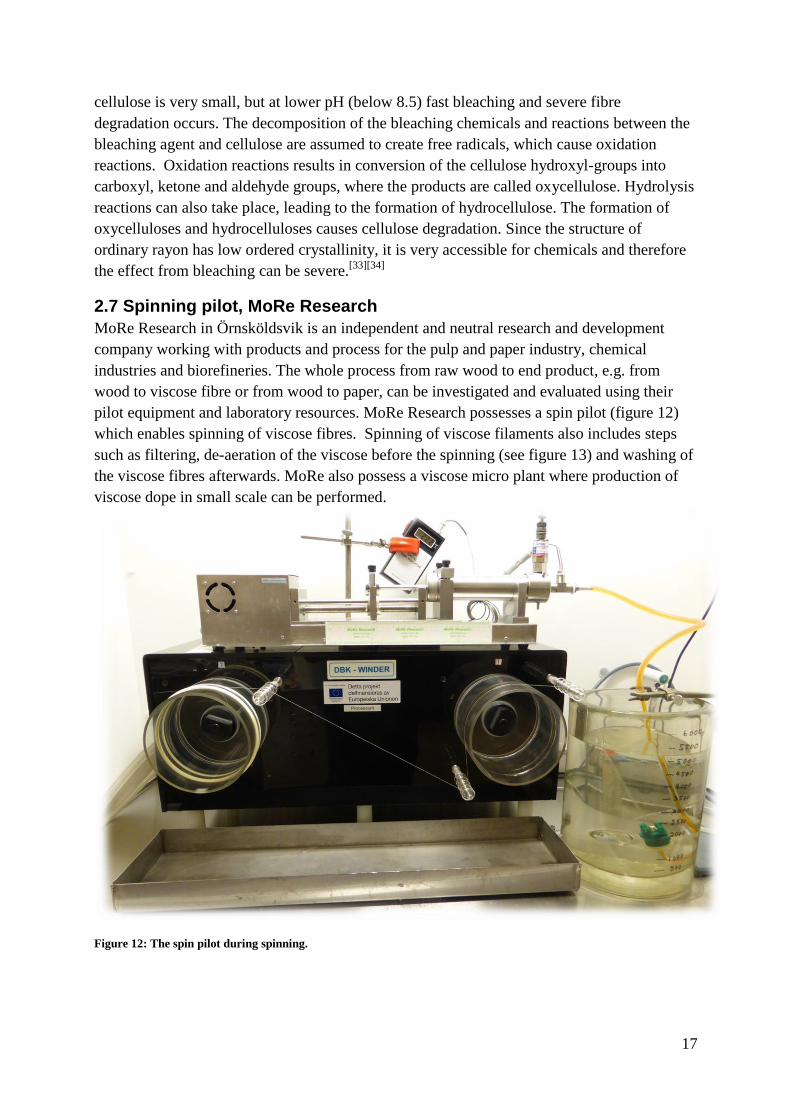
2.7 Spinning pilot, MoRe Research
MoRe Research in Örnsköldsvik is an independent and neutral research and development
company working with products and process for the pulp and paper industry, chemical
industries and biorefineries. The whole process from raw wood to end product, e.g. from
wood to viscose fibre or from wood to paper, can be investigated and evaluated using their
pilot equipment and laboratory resources. MoRe Research possesses a spin pilot (figure 12)
which enables spinning of viscose fibres. Spinning of viscose filaments also includes steps
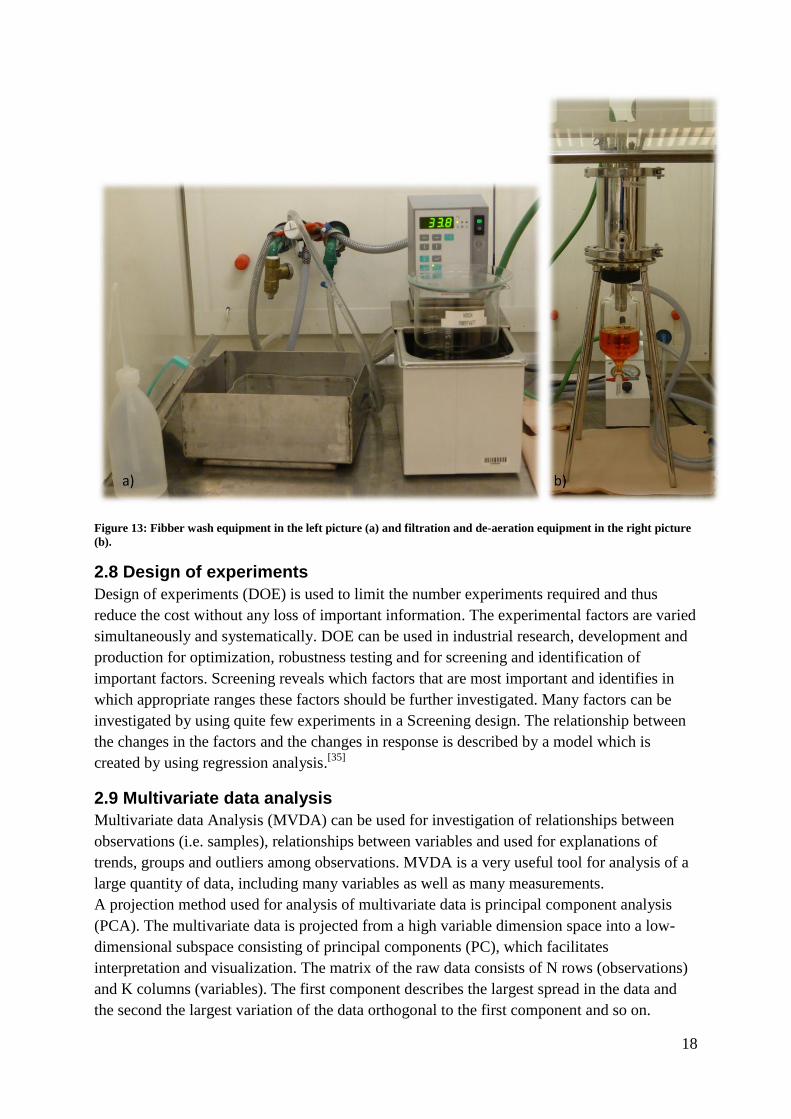
such as filtering, de-aeration of the viscose before the spinning (see figure 13) and washing of
the viscose fibres afterwards. MoRe also possess a viscose micro plant where production of
viscose dope in small scale can be performed.
Figure 12: The spin pilot during spinning.
18
Figure 13: Fibber wash equipment in the left picture (a) and filtration and de-aeration equipment in the right picture
(b).
2.8 Design of experiments
Design of experiments (DOE) is used to limit the number experiments required and thus
reduce the cost without any loss of important information. The experimental factors are varied
simultaneously and systematically. DOE can be used in industrial research, development and
production for optimization, robustness testing and for screening and identification of
important factors. Screening reveals which factors that are most important and identifies in
which appropriate ranges these factors should be further investigated. Many factors can be
investigated by using quite few experiments in a Screening design. The relationship between
the changes in the factors and the changes in response is described by a model which is
created by using regression analysis.[35]
2.9 Multivariate data analysis
Multivariate data Analysis (MVDA) can be used for investigation of relationships between
observations (i.e. samples), relationships between variables and used for explanations of
trends, groups and outliers among observations. MVDA is a very useful tool for analysis of a
large quantity of data, including many variables as well as many measurements.
A projection method used for analysis of multivariate data is principal component analysis
(PCA). The multivariate data is projected from a high variable dimension space into a low-
dimensional subspace consisting of principal components (PC), which facilitates
interpretation and visualization. The matrix of the raw data consists of N rows (observations)
and K columns (variables). The first component describes the largest spread in the data and
the second the largest variation of the data orthogonal to the first component and so on.
19
Before the model is fitted, the data is scaled and mean-centred.
“Partial least square projections to latent structures” (PLS) is another MVDA method. PLS is
a method for regression analysis of many variables and many responses. In PLS two spaces
are created, one for X (variables) and one for Y (responses). The method is used in order to
investigate how things vary together. Just as for PCA, the data is first scaled and mean-
centred. A major difference between PCA and PLS is that the maximum covariance between
the predictor variables (X) and the responses (Y) can be described using PLS, while the
maximum variance in the data (X) is described by PCA. In other words PCA has models
variation only in one data block, while PLS has models variation in two data blocks.
Consequently, PCA is most usable for data overview and PLS for prediction and making
quantitative models.[36]
Orthogonal partial least square projections to latent structures (OPLS)
is a modified version of PLS that can be used for classification instead of PLS. For an OPLS
model the systematic variation is divided into two parts; one which is linearly related to the
response (Y) while the other is orthogonal to it. The result of this is that class separation is
concentrated into the first component (i.e. the correlated) variation while the uncorrelated
variation is found in orthogonal components, which is an advantage over PLS.[38]
3. Material and methods
3.1 Material
3.1.1 Viscose
Frozen viscose dope was received from ENKA GmbH & Co. KG, Germany. ENKA is a
company produces high quality viscose filament yarns for the textile industry and uses
Domsjö dissolving cellulose for viscose production. The viscose had a cellulose content of 8.8
% and an alkali content of 5.4% (see section 3.3.2 for analysis methods).
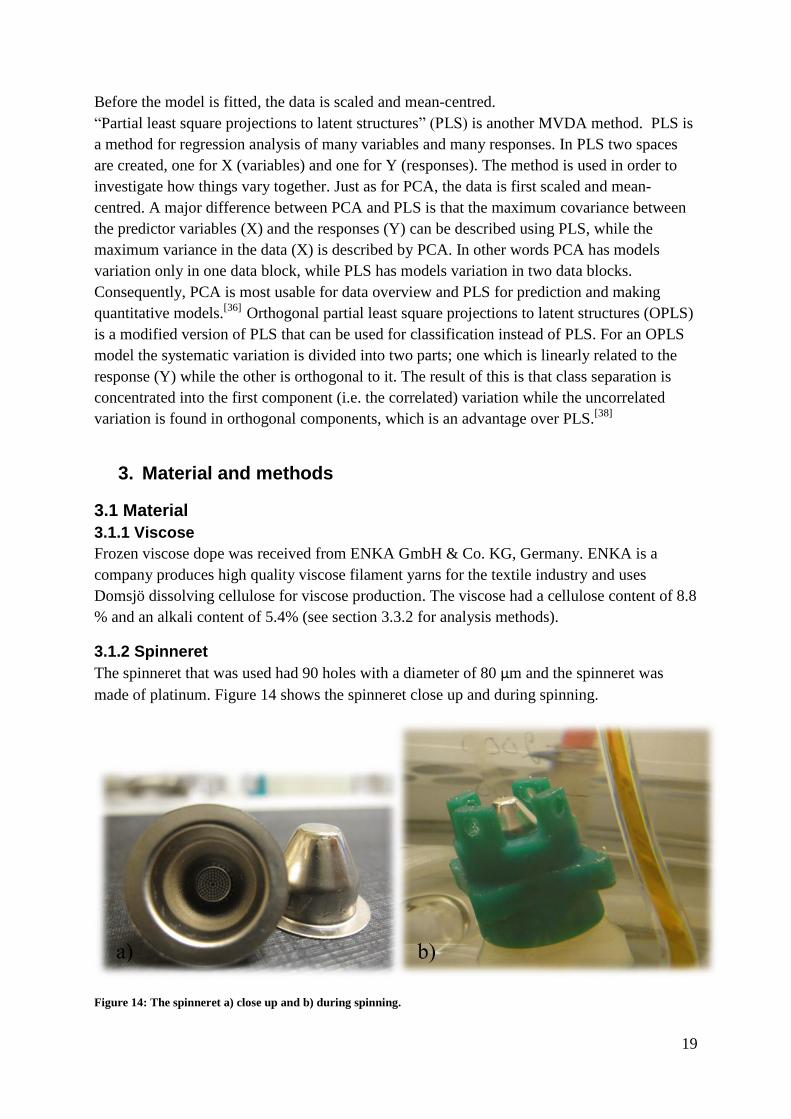
3.1.2 Spinneret
The spinneret that was used had 90 holes with a diameter of 80 μm and the spinneret was
made of platinum. Figure 14 shows the spinneret close up and during spinning.
Figure 14: The spinneret a) close up and b) during spinning.
20
3.2 Methods
3.2.1 Spinning
The frozen viscose was thawed for about 45-1h in a warm water bath (40-45⁰C). The thawed
viscose was filtered and de-aerated for 1 h. Analysis of Ripening Index and determination of
cellulose and alkali content (see section 3.3) was performed when the de-aeration was
finished. The filtered and de-aerated viscose was added to a syringe, which then was placed at
the spinning pilot and the spinning was initialized. The pump throw was set for 5 ml/min
which resulted in an extrusion speed of 11 m/min (according to equation 4 below). The speed
of godet 1 was set to 18.7 m/min, which gave a draw ratio of 1.7 (see equation 5). The speed
of godet 2 was varied (see table 2) to obtain the desirable stretch according to the design (see
section 3.2.3) between godet 1 and godet 2. The stretch was calculated according to equation
6. The spinning was ended when almost all viscose in the syringe had been utilized.
Table 2: The speed for godet 2 to obtain desirable stretch between godet 1 and godet 2, for the different settings
according to the experimental design (see section 3.2.3).
High 0 Low
v2 (m/min) v2 (m/min) v2 (m/min)
31.8 29.5 27.1
(4)
v0 = extrusion speed (m/min)
Q = pump throw (ml/min)
a = number of holes in the spinneret
d = diameter of the holes in the spinneret (m)
(5)
v0 = extrusion speed (m/min)
v1 = velocity of godet 1 (m/min)
(6)
v1 = velocity of godet 1 (m/min)
v2 = velocity of godet 2 (m/min)
The spun fibres were removed from godet 2, cut and washed in one litre washing solution at
each step according to the washing scheme in table 3, then dried in an oven of 105⁰C for 3 h.
All the experimental parameters for each run can be seen in APPENDIX.
21
Table 3: Fibre washing scheme, which chemicals for each washing step, concentrations, temperature, residence time
and their functions.
Step Chemical Concentration
(g/l)
Temp.
(⁰C) Function
Time
(min)
1 H2SO4 18 90
Assure a complete regeneration, as
well as remove the salts and gases
e.g. CS2 and H2S.
15
2 H2O - rt Removal of chemicals from
previous step. 15
3 NaOH 1 60 Removal of H2SO4 and sulphate-
and sulphite by-products. 15
4 H2O - rt Removal of chemicals from
previous step. 15
5 NaOCl 1.2 (active
chloride) 45 Bleaching. 15
6 H2O - rt Removal of chemicals from
previous step. 15
7 Acetic acid 1 45 Removal of excess alkali from the
bleaching process. 15
8 H2O - rt Removal of chemicals from
previous step. 15
rt = room temperature
3.2.2 Sampling
After the spinning was considered stable the fibres were moved along the godet (i.e. a rotating
cylinder) for sampling. The fibres were kept as straight as possible between the godets. The
sample was cut, washed and dried.
From each sample about 20-30 fibres were sorted out for analysis. The fibres were then
placed in a conditioned room, with a temperature of 25⁰C and humidity of 50% for over 4
hours. Between 10-20 of the conditioned fibres were then analysed.
3.2.3 Design of experiments
An experimental design was created in MODDE in order to be able to retrieve maximize
information from the results about the correlation between variables and responses. Only three
variables were varied; stretch (%), sulphuric acid content (g/l) and zinc sulphate content (g/l).
A Screening was made to find the most important spinning parameter and evaluate how the
different spinning parameters affected the final properties of the viscose fibre, in order to
discover which settings are suitable for spinning of staple fibres in the spin pilot.
For all classical experimental designs used for screening, optimization and robust testing, the
foundation is formed by a full factorial design. However, the most commonly used design for
screening is fractional factorial design, since investigation of many factors can be performed
with a relatively few experiments.[35]
First, a fractional factorial design with three variables
and three centre points (i.e. replicates) was constructed and performed, resulting in a total of 7
runs. The three variables were stretch, sulphuric acid content and zinc sulphate content. All
22
the variables were chosen to vary within the normal industrial spinning parameters and the
variables ranges and units can be seen in table 4.
Table 4: The spinning parameters that were varied in the experimental design; stretch, sulphuric acid content and
zinc sulphate content, their different levels and their expressed units.
Unit High 0 Low
Stretch % 70 57.5 45
Acid content g/l 130 105 80
Zinc content g/l 25 16.5 8
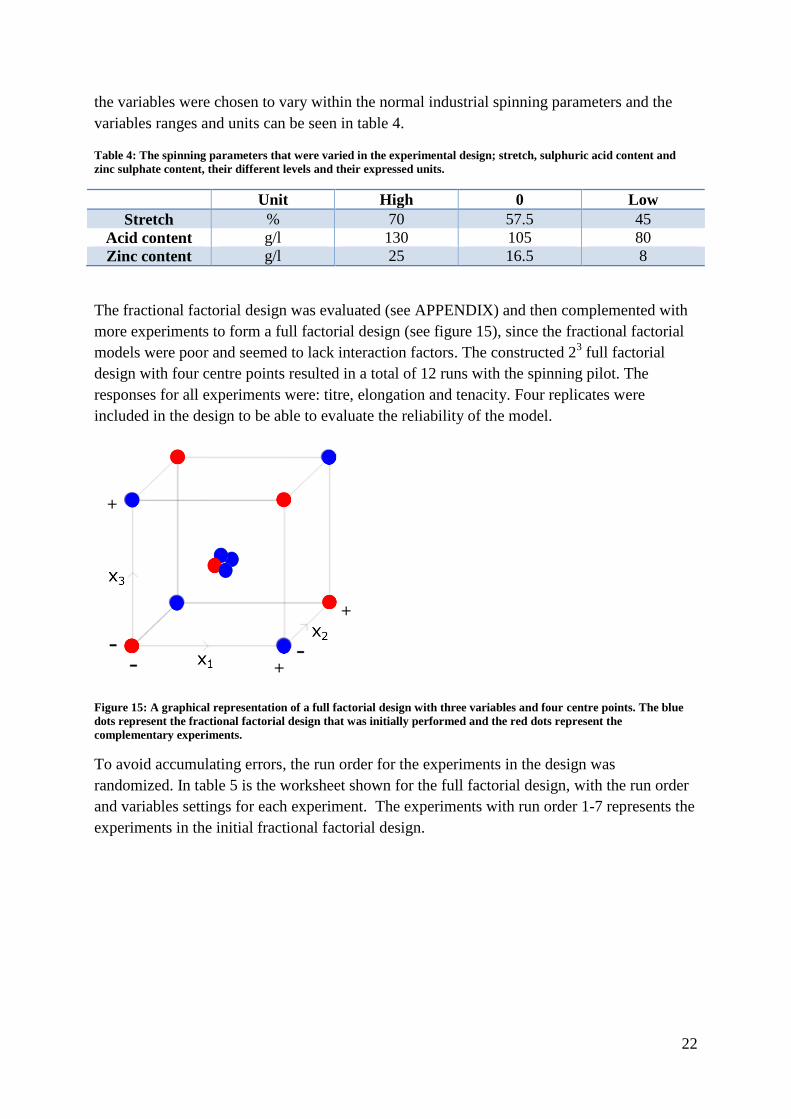
The fractional factorial design was evaluated (see APPENDIX) and then complemented with
more experiments to form a full factorial design (see figure 15), since the fractional factorial
models were poor and seemed to lack interaction factors. The constructed 23 full factorial
design with four centre points resulted in a total of 12 runs with the spinning pilot. The
responses for all experiments were: titre, elongation and tenacity. Four replicates were
included in the design to be able to evaluate the reliability of the model.
Figure 15: A graphical representation of a full factorial design with three variables and four centre points. The blue
dots represent the fractional factorial design that was initially performed and the red dots represent the
complementary experiments.
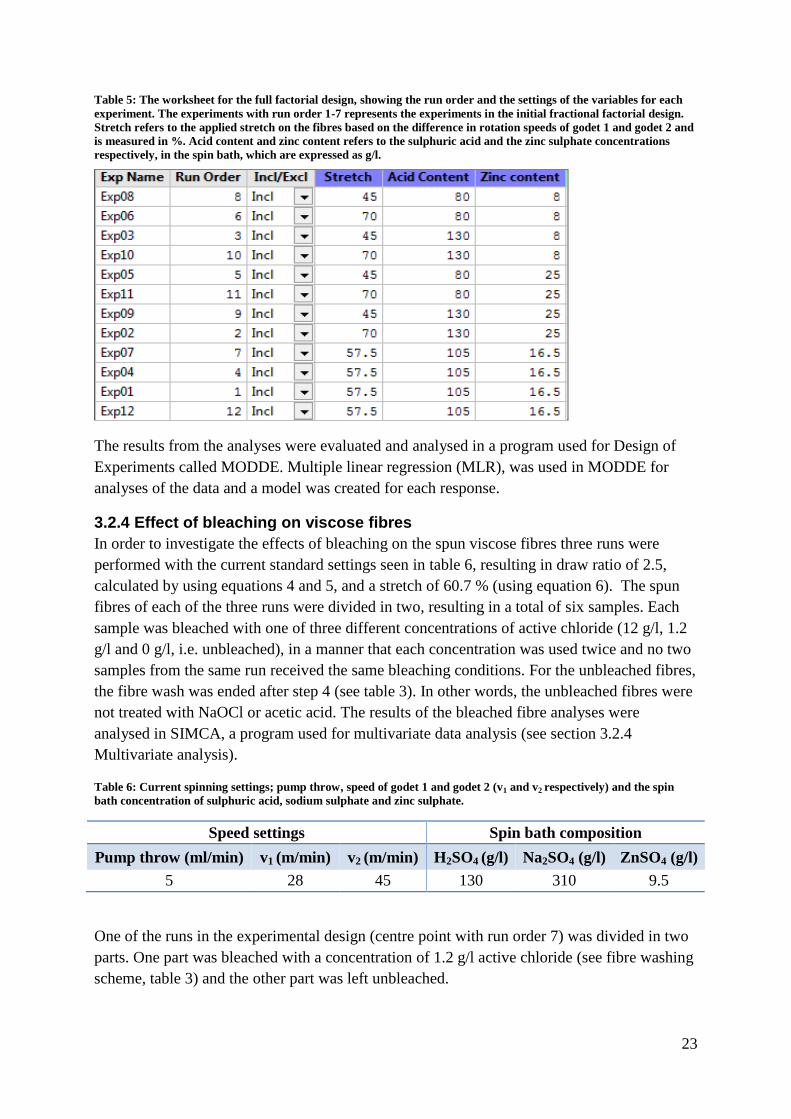
To avoid accumulating errors, the run order for the experiments in the design was
randomized. In table 5 is the worksheet shown for the full factorial design, with the run order
and variables settings for each experiment. The experiments with run order 1-7 represents the
experiments in the initial fractional factorial design.
23
Table 5: The worksheet for the full factorial design, showing the run order and the settings of the variables for each
experiment. The experiments with run order 1-7 represents the experiments in the initial fractional factorial design.
Stretch refers to the applied stretch on the fibres based on the difference in rotation speeds of godet 1 and godet 2 and
is measured in %. Acid content and zinc content refers to the sulphuric acid and the zinc sulphate concentrations
respectively, in the spin bath, which are expressed as g/l.
The results from the analyses were evaluated and analysed in a program used for Design of
Experiments called MODDE. Multiple linear regression (MLR), was used in MODDE for
analyses of the data and a model was created for each response.
3.2.4 Effect of bleaching on viscose fibres
In order to investigate the effects of bleaching on the spun viscose fibres three runs were
performed with the current standard settings seen in table 6, resulting in draw ratio of 2.5,
calculated by using equations 4 and 5, and a stretch of 60.7 % (using equation 6). The spun
fibres of each of the three runs were divided in two, resulting in a total of six samples. Each
sample was bleached with one of three different concentrations of active chloride (12 g/l, 1.2
g/l and 0 g/l, i.e. unbleached), in a manner that each concentration was used twice and no two
samples from the same run received the same bleaching conditions. For the unbleached fibres,
the fibre wash was ended after step 4 (see table 3). In other words, the unbleached fibres were
not treated with NaOCl or acetic acid. The results of the bleached fibre analyses were
analysed in SIMCA, a program used for multivariate data analysis (see section 3.2.4
Multivariate analysis).
Table 6: Current spinning settings; pump throw, speed of godet 1 and godet 2 (v1 and v2 respectively) and the spin
bath concentration of sulphuric acid, sodium sulphate and zinc sulphate.
Speed settings Spin bath composition
Pump throw (ml/min) v1 (m/min) v2 (m/min) H2SO4 (g/l) Na2SO4 (g/l) ZnSO4 (g/l)
5 28 45 130 310 9.5
One of the runs in the experimental design (centre point with run order 7) was divided in two
parts. One part was bleached with a concentration of 1.2 g/l active chloride (see fibre washing
scheme, table 3) and the other part was left unbleached.
24
3.2.5 Multivariate data analysis
The raw data from the fibre analyses of the viscose fibres treated with different bleaching
concentrations were included in a PCA model with bleaching concentration as factor and titre,
elongation and tenacity as responses. The three different bleaching concentrations; 12 g/l
active chloride, 1.2 g/l active chloride and 0 g/l active chloride (i.e. unbleached), were divided
in to classes; class 1, 2 and 3 respectively. A model for all the three classes was made in order
to discover and display differences between unbleached and bleached viscose fibres. To be
able to interpret the differences between the classes, an OPLS-model for class 1 and one for
class 2, both with class 3 as reference, was constructed.
3.3 Analysis methods
3.3.1 Ripening index
Ripening index (RI) is also called the Hottenroth index or Hottenroth number. The RI gives
the amount of 10 % ammonium chloride solution required for coagulation of 20 g viscose
solution diluted with 30 ml water. The test indicates how fast the viscose coagulate, and
thereby the quality of the viscose. A low number means fast coagulation, which indicates poor
viscose for spinning of fibres. The RI should be between 11-14 for spinning of strong
fibres.[27]
3.3.2 Determination of cellulose and alkali content
The cellulose content in the viscose was determined by collecting about 1.5 g of viscose (the
exact weight was noted), which was then pressed between two glass plates. The plates was
separated by sliding and placed in a sulphuric acid bath until the viscose film had loosened
from the plates. The cellulose films was washed thoroughly with water and dried by removing
excessive moisture with a filter cloth. The films were placed in an oven of 105⁰C for 2-3
hours. The cellulose content was calculated according to following equation:
(7)
The alkali content in the viscose was determined by first weighing in about 2.5 g viscose and
then dissolve it in 100 ml deionized water with magnetic stirrer. The solution was boiled and
10ml 0.5mol/dm3 H2SO4 was added and then the solution was left for cooling. When the
solution reached room temperature, some drops of phenolphthalein were added and then the
solution was titrated with 1.0 mol/dm3 NaOH until the solution changed colour. Equation 5
was used to calculate the alkali content:
(8)
V1 = volume of H2SO4 (ml)
V2 = volume of NaOH (ml)
n1, n2 = concentration of H2SO4 and NaOH respectively (mol/dm3)
mv = mass viscose (g)
25
3.3.4 Determination of linear density and tensile properties
Vibroskop 400 (Lenzing instruments GmbH & Co. KG) was used according to SS-EN ISO
5079 for determination of titre (i.e. the linear density of the fibres) by using an electronic
pulse to set the fibre into vibrations. The linear density is derived from the vibration
frequency of the fibre. Vibrodyn 400 ((Lenzing instruments GmbH & Co. KG) was used
according to SS-EN ISO 5079, ISO1130-1975 and ISO1973 for determination of the
elongation (i.e. extension at break) and tenacity (dry).
4. Result and discussion
4.1 Results from analysis with MODDE
The stretch parameter for each run was calculated according to equation 6 based on the speed
on godet 1 and godet 2 during each experiment (see APPENDIX). This resulted in a stretch of
58.3 for centre point with run order 12, a stretch of 57.8 for the centre points with the run
order 1, 4 and 7 and a stretch of 69.5 for the experiments with run order 10 and 11. For some
runs there were difficulties to get the right speed settings to obtain the desirable stretch
(Exp10, Exp11 and Exp12). This along with rounding errors, due to the calculation of the
stretch were the reasons why the mention runs above deviated a little from the original design
(table 5). The worksheet for the screening model, with the mean results for each run and their
actual settings is shown in table 7.
Table 7: The full factorial design showing the experiment names, run order, the actual settings of the variables for
each experiment and the mean results for the three responses; titre, elongation and tenacity. The units for each
response are dtex, % and cN/tex respectively. Stretch refers to the applied stretch on the fibres based on the
difference in rotation speeds of godet 1 and godet 2 and is measured in %. Acid content and zinc content refers to the
sulphuric acid and the zinc sulphate concentrations respectively, in the spin bath, which are expressed as g/l
Variables Responses
Experiment
name
Run
order
Stretch
(%)
Acid content
(g/l)
Zinc content
(g/l)
Titre
(dtex)
Elongation
(%)
Tenacity
(cN/tex)
Exp01, cp 1 57.8 105 16.5 2.5 10.7 13.8
Exp02 2 70 130 25 2.7 14.2 10.7
Exp03 3 45 130 8 2.6 12.0 13.3
Exp04, cp 4 57.8 105 16.5 2.3 10.7 14.7
Exp05 5 45 80 25 2.5 11.7 13.3
Exp06 6 70 80 8 2.3 6.3 12.5
Exp07, cp 7 57.8 105 16.5 2.3 9.9 13.8
Exp08 8 45 80 8 2.7 6.6 9.6
Exp09 9 45 130 25 2.3 8.9 9.4
Exp10 10 70 130 8 2.0 4.5 10.1
Exp11 11 70 80 25 2.2 7.8 11.9
Exp12, cp 12 58.3 105 16.5 2.4 8.5 11.0
The raw data was evaluated and the replicate plots in figure 16 show that the replicates for
responses titre and elongation are located relatively in the middle of the response intervals
indicating linearity between the variables and the response. The spread between the replicates
(1, 4, 7, 12) for tenacity is large and very similar to the spread between the designed
26
experiments. This means that the variation in the response between the designed experiments
cannot be distinguished from the noise and therefore no adequate model can be created from
the data.
Figure 16: Replicate plots showing the mean results for the different responses; titre (plot to the left), elongation (plot
in the middle) and tenacity (plot to the right). The blue squares represent the centre points and the green dots
represent each run. The experiments are numbered according to the run order.
The significance of all the factors for each response and how they affect the response can be
seen in a coefficients plot. As seen in the coefficients plots for each response in figure 17
none of the factors is significant for any of the responses, which indicates poor models. All
the interactions factors were left in the model for titre, since the removal of them resulted in a
large drop of the R2-value. The interactions with the largest magnitude were kept in the
models for elongation and tenacity. No outliers where found in any of the models.
Figure 17: Coefficients plots for each response showing the magnitude of each factor and their significance for each
response. The direction of the influence of the factors on the responses is also shown.
The quality of a model can be evaluated with a summary of fit plot. The summary of fit plot
(figure 18) shows that the model for each response is poor which supports earlier claims. The
R2 (green bars) is quite bad for the models except for the model for titre. The reason for the
moderately high value of R2 for the titre model is that all factors including interaction factors
were kept in the model. All the models have negatively Q2
(dark blue bars), which means that
the models have bad predictability. In order for a model to be significant the Q2 should be
greater than 0.1. For a good model the Q2 should be greater than 0.5. The reproducibility
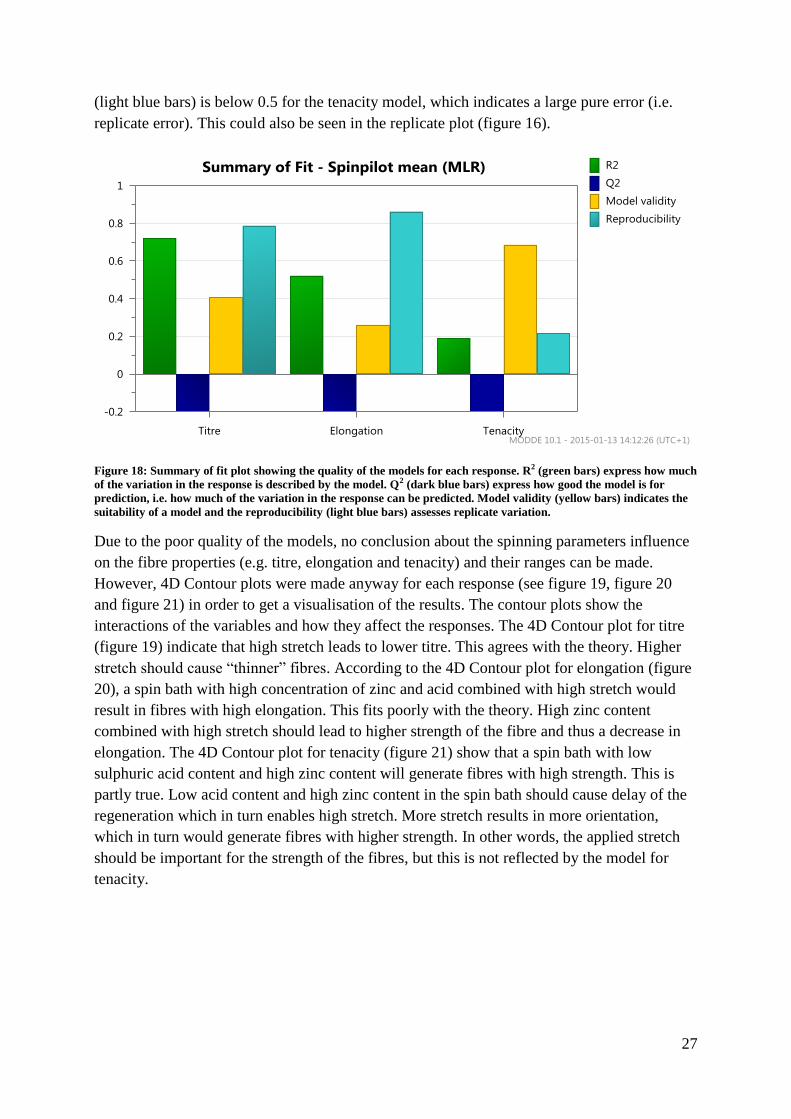
27
(light blue bars) is below 0.5 for the tenacity model, which indicates a large pure error (i.e.
replicate error). This could also be seen in the replicate plot (figure 16).
Figure 18: Summary of fit plot showing the quality of the models for each response. R2 (green bars) express how much
of the variation in the response is described by the model. Q2 (dark blue bars) express how good the model is for
prediction, i.e. how much of the variation in the response can be predicted. Model validity (yellow bars) indicates the
suitability of a model and the reproducibility (light blue bars) assesses replicate variation.
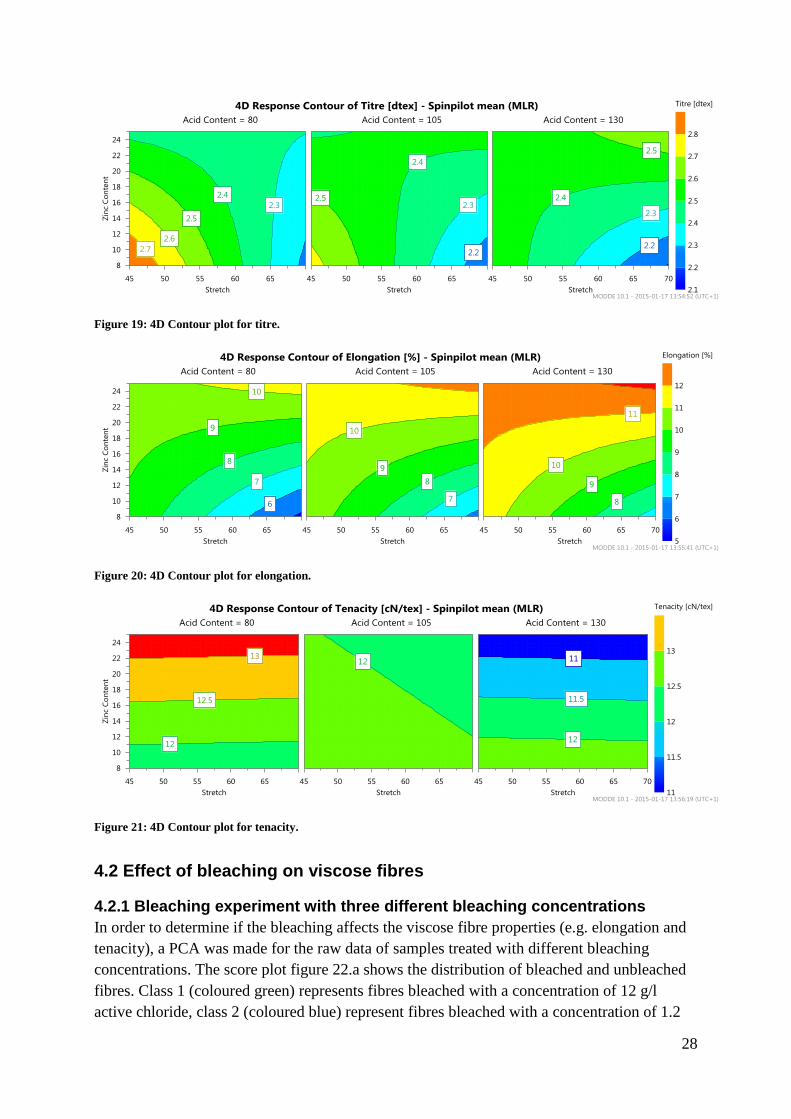
Due to the poor quality of the models, no conclusion about the spinning parameters influence
on the fibre properties (e.g. titre, elongation and tenacity) and their ranges can be made.
However, 4D Contour plots were made anyway for each response (see figure 19, figure 20
and figure 21) in order to get a visualisation of the results. The contour plots show the
interactions of the variables and how they affect the responses. The 4D Contour plot for titre
(figure 19) indicate that high stretch leads to lower titre. This agrees with the theory. Higher
stretch should cause “thinner” fibres. According to the 4D Contour plot for elongation (figure
20), a spin bath with high concentration of zinc and acid combined with high stretch would
result in fibres with high elongation. This fits poorly with the theory. High zinc content
combined with high stretch should lead to higher strength of the fibre and thus a decrease in
elongation. The 4D Contour plot for tenacity (figure 21) show that a spin bath with low
sulphuric acid content and high zinc content will generate fibres with high strength. This is
partly true. Low acid content and high zinc content in the spin bath should cause delay of the
regeneration which in turn enables high stretch. More stretch results in more orientation,
which in turn would generate fibres with higher strength. In other words, the applied stretch
should be important for the strength of the fibres, but this is not reflected by the model for
tenacity.
28
Figure 19: 4D Contour plot for titre.
Figure 20: 4D Contour plot for elongation.
Figure 21: 4D Contour plot for tenacity.
4.2 Effect of bleaching on viscose fibres
4.2.1 Bleaching experiment with three different bleaching concentrations
In order to determine if the bleaching affects the viscose fibre properties (e.g. elongation and
tenacity), a PCA was made for the raw data of samples treated with different bleaching
concentrations. The score plot figure 22.a shows the distribution of bleached and unbleached
fibres. Class 1 (coloured green) represents fibres bleached with a concentration of 12 g/l
active chloride, class 2 (coloured blue) represent fibres bleached with a concentration of 1.2
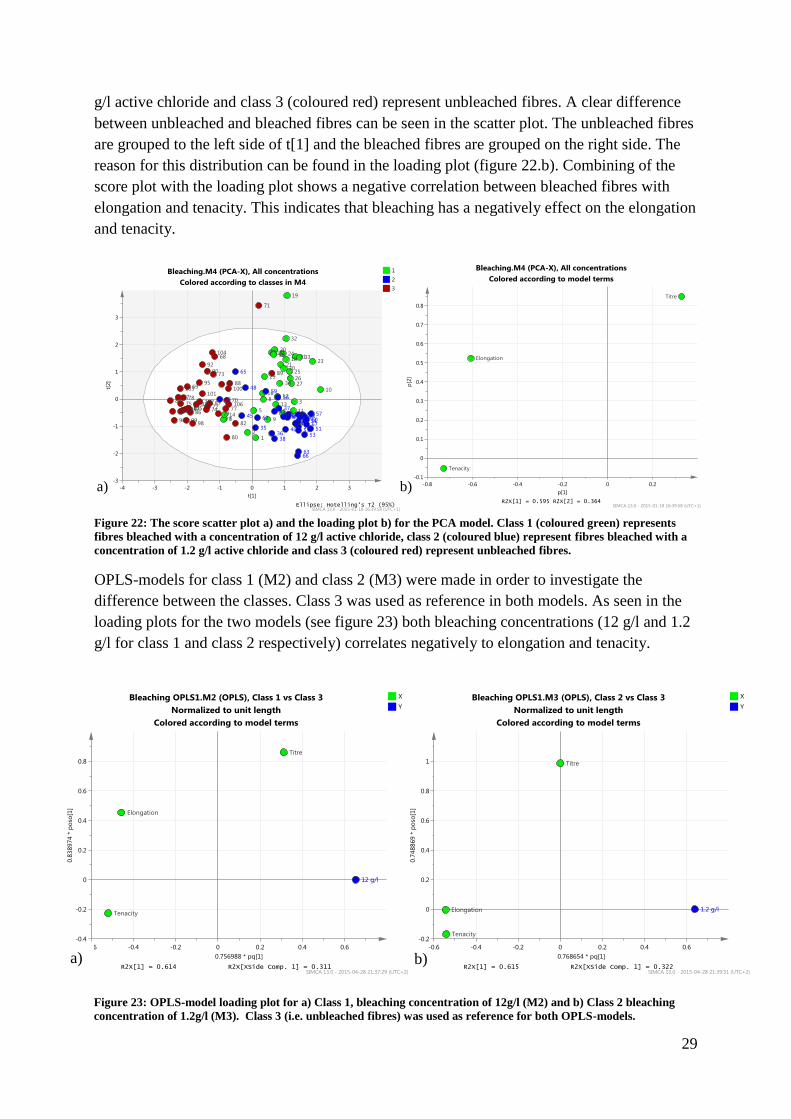
29
g/l active chloride and class 3 (coloured red) represent unbleached fibres. A clear difference
between unbleached and bleached fibres can be seen in the scatter plot. The unbleached fibres
are grouped to the left side of t[1] and the bleached fibres are grouped on the right side. The
reason for this distribution can be found in the loading plot (figure 22.b). Combining of the
score plot with the loading plot shows a negative correlation between bleached fibres with
elongation and tenacity. This indicates that bleaching has a negatively effect on the elongation
and tenacity.
Figure 22: The score scatter plot a) and the loading plot b) for the PCA model. Class 1 (coloured green) represents
fibres bleached with a concentration of 12 g/l active chloride, class 2 (coloured blue) represent fibres bleached with a
concentration of 1.2 g/l active chloride and class 3 (coloured red) represent unbleached fibres.
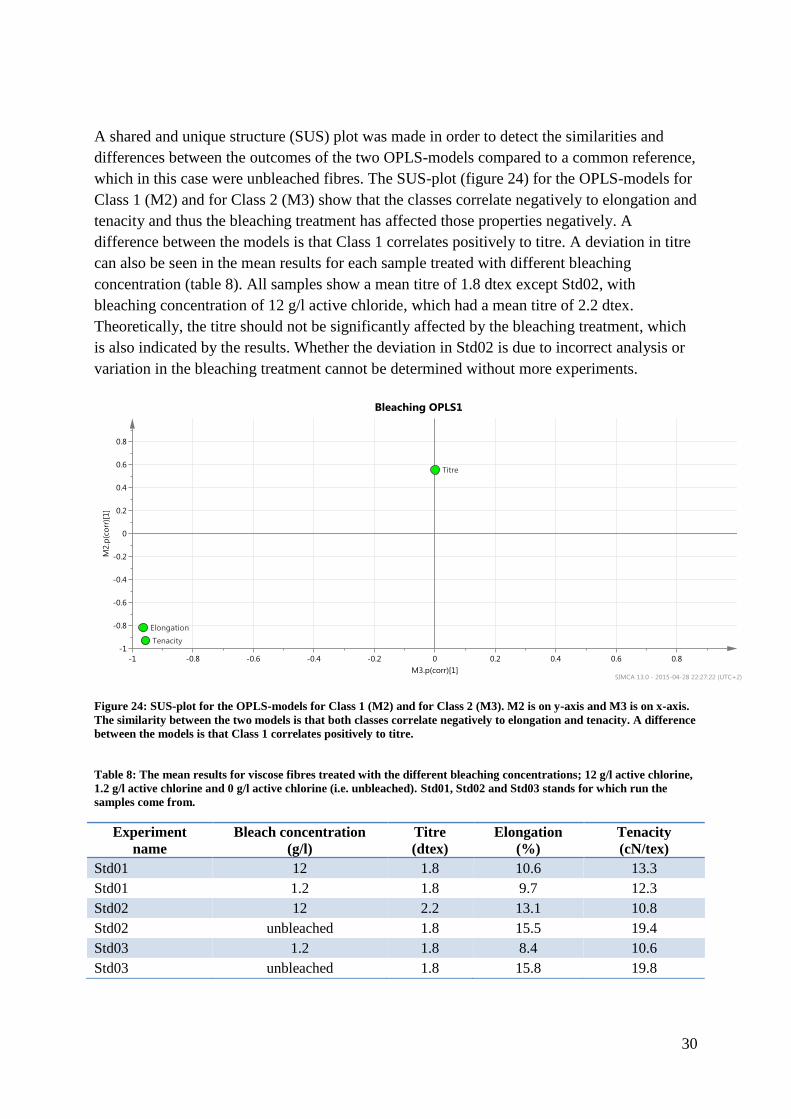
OPLS-models for class 1 (M2) and class 2 (M3) were made in order to investigate the
difference between the classes. Class 3 was used as reference in both models. As seen in the
loading plots for the two models (see figure 23) both bleaching concentrations (12 g/l and 1.2
g/l for class 1 and class 2 respectively) correlates negatively to elongation and tenacity.
a) b)
Figure 23: OPLS-model loading plot for a) Class 1, bleaching concentration of 12g/l (M2) and b) Class 2 bleaching
concentration of 1.2g/l (M3). Class 3 (i.e. unbleached fibres) was used as reference for both OPLS-models.
a) b)
30
A shared and unique structure (SUS) plot was made in order to detect the similarities and
differences between the outcomes of the two OPLS-models compared to a common reference,
which in this case were unbleached fibres. The SUS-plot (figure 24) for the OPLS-models for
Class 1 (M2) and for Class 2 (M3) show that the classes correlate negatively to elongation and
tenacity and thus the bleaching treatment has affected those properties negatively. A
difference between the models is that Class 1 correlates positively to titre. A deviation in titre
can also be seen in the mean results for each sample treated with different bleaching
concentration (table 8). All samples show a mean titre of 1.8 dtex except Std02, with
bleaching concentration of 12 g/l active chloride, which had a mean titre of 2.2 dtex.
Theoretically, the titre should not be significantly affected by the bleaching treatment, which
is also indicated by the results. Whether the deviation in Std02 is due to incorrect analysis or
variation in the bleaching treatment cannot be determined without more experiments.
Figure 24: SUS-plot for the OPLS-models for Class 1 (M2) and for Class 2 (M3). M2 is on y-axis and M3 is on x-axis.
The similarity between the two models is that both classes correlate negatively to elongation and tenacity. A difference
between the models is that Class 1 correlates positively to titre.
Table 8: The mean results for viscose fibres treated with the different bleaching concentrations; 12 g/l active chlorine,
1.2 g/l active chlorine and 0 g/l active chlorine (i.e. unbleached). Std01, Std02 and Std03 stands for which run the
samples come from.
Experiment
name
Bleach concentration
(g/l)
Titre
(dtex)
Elongation
(%)
Tenacity
(cN/tex)
Std01 12 1.8 10.6 13.3
Std01 1.2 1.8 9.7 12.3
Std02 12 2.2 13.1 10.8
Std02 unbleached 1.8 15.5 19.4
Std03 1.2 1.8 8.4 10.6
Std03 unbleached 1.8 15.8 19.8
31
4.2.2 Comparison between bleached and unbleached fibres in the experimental
design
There was also a distinct difference in the fibre properties for unbleached and bleached fibres
for the centre point Exp07 (see table 7) in the experimental design. The titre was relatively
unaffected by the bleaching with a titre for bleached and unbleached fibres of 2.3 dtex and 2.4
dtex respectively (see table 9). The elongation was decreased for bleached fibres with an
elongation of 9.9 % compared to an elongation of 17.7 % for unbleached fibres. The tenacity
was also decreased for bleached fibres with a tenacity of 13.8 cN/tex compared a tenacity of
19.9 cN/tex for unbleached fibres. This shows that the bleaching has affected the viscose
fibres properties negatively. The coefficient of variation is higher for bleached fibres than
unbleached fibres for each response. The larger sample distribution is also an indication that
the viscose fibres have been affected by the bleaching.
Table 9: The mean results for bleached (1.2 g/l active chloride) and unbleached viscose fibres for the centre point in
the full factorial design with run order 7 (see table 7), with the coefficient of variation for titre, elongation and
tenacity.
Titre, dtex CV % Elongation, % CV % Tenacity, cN/tex CV %
Exp07, cp, bleached 2.3 12.4 9.9 17.6 13.8 20.4
Exp07, cp, unbleached 2.4 8.8 17.7 8.4 19.9 6.1
4.3 Conditioning before analysis
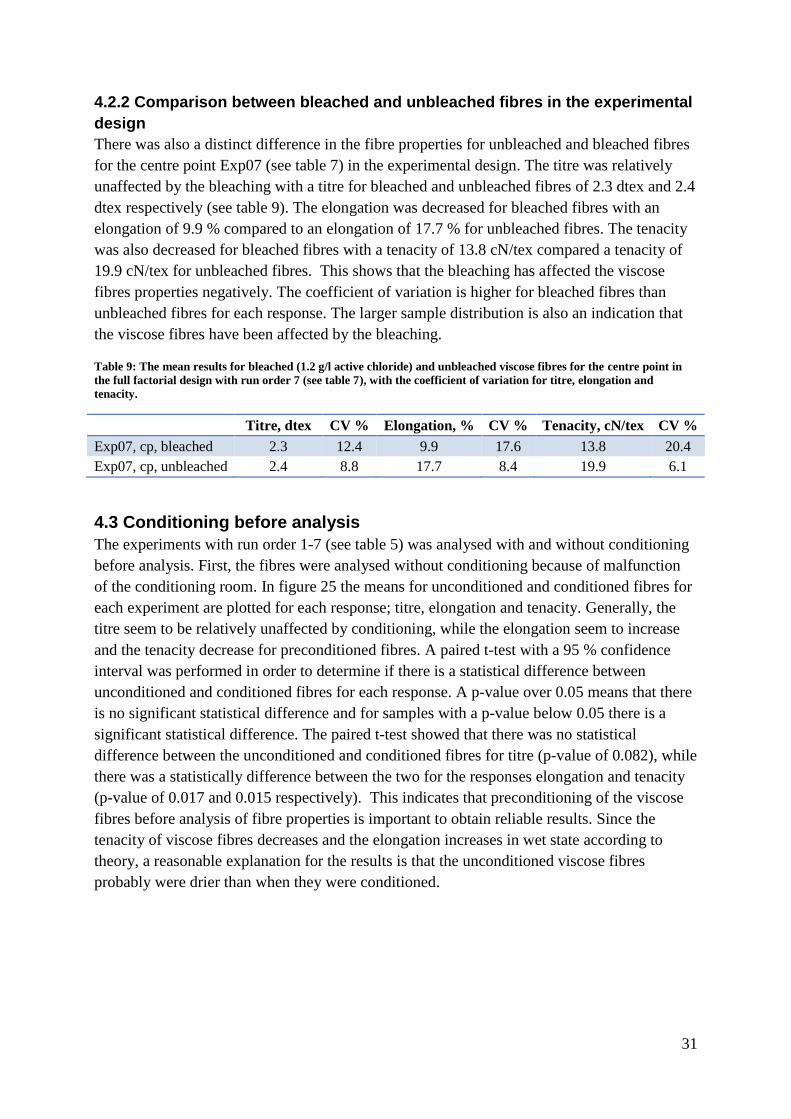
The experiments with run order 1-7 (see table 5) was analysed with and without conditioning
before analysis. First, the fibres were analysed without conditioning because of malfunction
of the conditioning room. In figure 25 the means for unconditioned and conditioned fibres for
each experiment are plotted for each response; titre, elongation and tenacity. Generally, the
titre seem to be relatively unaffected by conditioning, while the elongation seem to increase
and the tenacity decrease for preconditioned fibres. A paired t-test with a 95 % confidence
interval was performed in order to determine if there is a statistical difference between
unconditioned and conditioned fibres for each response. A p-value over 0.05 means that there
is no significant statistical difference and for samples with a p-value below 0.05 there is a
significant statistical difference. The paired t-test showed that there was no statistical
difference between the unconditioned and conditioned fibres for titre (p-value of 0.082), while
there was a statistically difference between the two for the responses elongation and tenacity
(p-value of 0.017 and 0.015 respectively). This indicates that preconditioning of the viscose
fibres before analysis of fibre properties is important to obtain reliable results. Since the
tenacity of viscose fibres decreases and the elongation increases in wet state according to
theory, a reasonable explanation for the results is that the unconditioned viscose fibres
probably were drier than when they were conditioned.
32
Figure 25: The mean analysis results for the experiments with run order 1-7 (see table 5) unconditioned and
preconditioned for each response; a) titre, b) elongation and c) tenacity. Blue diamonds represent the result for
unconditioned samples and red squares represent the result for preconditioned samples. Generally, the titre is
unaffected of conditioning, while the elongation increase and the tenacity decrease for conditioned samples.
5. Conclusions
The results show that the bleaching has affected the elongation and tenacity of the spun fibres
negatively. This is probably caused by degradation of cellulose. Consequently, degradation of
the viscose fibres due to the bleaching treatment is most likely the reason for the poor quality
of the models of the experimental design.
Bleaching of viscose fibres is done in order to obtain whiter fibres and not to influence the
fibre properties (e.g. elongation and tenacity). Since the whiteness of the fibres is not
measured currently at MoRe, the bleaching treatment is not necessary for the quality
evaluation of dissolving cellulose. Furthermore, bleaching with NaOCl can lead to
unpredictable results, which has been shown, due to degradation of cellulose. Consequently,
the bleaching step doesn’t need to be performed in future spinning trials at MoRe, except
when bleached fibres are desirable. This will not only save time but also lower the amount
chemicals needed. If bleaching with NaOCl is performed the pH needs monitored carefully.
Alternatively can another milder bleaching chemical be used e.g. hydrogen peroxide.
The results also showed that the spun viscose fibres should be conditioned before analysis in
order to get a reliable result.
33
5.1 Recommendations
Don’t bleach the spun fibres unless bleached fibres are desirable.
When bleaching viscose fibres control the bleaching conditions e.g. the pH.
Precondition the fibres before analysis of fibre properties (i.e. titre, elongation and
tenacity.
It is unnecessary to dry the spun viscose fibres in an oven. To make it easier and less
time-consuming the spun fibres can be left to dry in the air over night in room
temperature.
In order to obtain a more stable spinning with fewer breaks of the fibres the current
used draw ratio should be reduced.
6. Complementary and future work
To be able to optimize the settings for the spin pilot a new study should be performed without
the bleaching step. This would eliminate the risk of degradation of the cellulose due to the
bleaching agent and thereby give a more truthful result, which then can be used for
optimization. Further studying of the impact of the draw ratio on final fibre properties and the
spinning stability would be beneficial for gaining optimized settings. Another aspect that
would be valuable to evaluate is the acid depletion during spinning. This to ensure that there
is enough acid in the spin bath in order to avoid unwanted disruption in the spinning due to
hard lumps and sticks.
Further work that can be done in order to optimize the spinning process is to investigate the
amount of washing chemicals that is required for a certain amount of spun fibres and thus
enable standardization of the amount of fibre that will be washed and analysed. The
repeatability of the spinning method can be evaluated by comparing the results from the
spinning performed by different people. This, in order to determine if the method gives the
same result regardless of who performs it.
Other things that can be investigated are:
How long viscose dope can be stored without significant changes in the viscose
properties occur.
The particle distribution in pilot made viscose compared with the particle distribution
in fabric made viscose.
34
7. Acknowledgements
I would like to thank all the wonderful people at Domsjö Fabriker and MoRe Research for
their helpfulness and for being friendly. You have made my work on my master’s thesis both
interesting and enjoyable.
Special thanks to,
Dr. Kristina Elg Christofferson and Dr. Anna Svedberg at Domsjö Fabriker for giving me the
opportunity to do this degree project at DomInnova.
My supervisors Sara Hellström, Domsjö Fabriker and Alf Gustafsson, MoRe Research, for all
your help, guidance and support.
Dr. Niklas Kvarnlöf, Karlstad University, for helping me gain a deeper understanding of the
viscose spinning process, answering my questions and also discussions of the final results and
problems that arose.
Dr. Roland Agnemo and Kishore Shouche for taking the time to answer my questions and
supporting me in finding explanations to problems.
Curt Hägglund and Nadine Hollinger at MoRe Research for answering my questions and for
helping with the viscose analysis.
Konrad Elmgren and Åsa Albano at MoRe Research for the help with the viscose fibre
analyses.
Andreas Pollmeier and ENKA for providing the viscose dope used in this project.
Erik Johansson, Umetrics, for the help with the analysis with MODDE and Simca.
Johan Trygg, my supervisor at Umeå University.
and last but not least…
I want to thank my wonderful boyfriend Björn for his help and support.
35
References
[1] Internal document Domsjö Fabriker, ”Företagspresentation Domsjö (eng)”
[2] We make more from the tree (Company Brochure 2012), Publications/About Domsjö
Fabriker
http://www.domsjo.adityabirla.com/
Accessed: 2014-09-09
[3] Treiber, Erich E. 1985. Formation of fibres from cellulose solutions. T.P. Nevell and S.H.
Zeronian. (eds.). Cellulose Chemistry and its applications. 455-479. New York: John Wiley &
Sons.
[4] Sixta, Herbert (eds.). 2006. Handbook of pulp. Volume 1. Weinheim: WILEY-VCH
Verlag Gmlott & Co. KGaA
[5] Internal document Domsjö Fabriker, “Basic education certification – Domsjö wood and
fibre”
[6] Henriksson, Gunnar. 2007. Lignin. Monica Ek. et. al (eds.). Ljungberg textbook. Pulp and
paper chemistry and technology. Book 1. Wood chemistry and wood biotechnology, 125-148.
Stockholm: Fiber and Polymer Technology, KTH.
[7] Lennholm, Helena and Henriksson, Gunnar. 2007. Cellulose and Carbohydrate Chemistry.
Monica Ek. et. al (eds.). Ljungberg textbook. Pulp and paper chemistry and technology. Book
1. Wood chemistry and wood biotechnology, 73-102. Stockholm: Fiber and Polymer
Technology, KTH.
[8] Olsson, Carina and Westman, Gunnar. 2013. Direct Dissolution of Cellulose: Background,
Means and Applications. Theo van de Ven and Louis Godbout (eds.). Cellulose –
Fundamental Aspects. http://www.intechopen.com/books/cellulose-fundamental-
aspects/direct-dissolution-of-cellulose-background-means-and-applications
Accessed: 2014-10-02
[9] Klemm, Dieter. et al. 2005. Cellulose: Fascinating Biopolymer and Sustainable Raw
Material. Angewandte Chemie International Edition. 44: 3358-3393. doi:
10.1002/anie.200460587
[10] Kvarnlöf, Niklas. 2007. Activation of dissolving pulps prior to viscose preparation. PhD
diss., Karlstad University
[11] Sjöström, Eero. 1993. Wood Chemistry: Fundamentals and Applications 2ed. San Diego,
the United States of America: Academic Press, INC
[12] Lindman, Björn. Karlström, Gunnar and Stigsson, Lars. 2010. On the mechanism of
dissolution of cellulose. Journal of Molecular Liquids. 156: 76-81.
doi: 10.1016/j.molliq.2010.04.016
36
[13] O’Sullivan, Antoinette C. 1997. Cellulose: the structure slowly unravels. Cellulose. 4:
173-207.
[14] Teleman, Anita. 2007. Hemicelluloses and Pectins. Monica Ek. et. al (eds.). Ljungberg
textbook. Pulp and paper chemistry and technology. Book 1. Wood chemistry and wood
biotechnology, 103-124. Stockholm: Fiber and Polymer Technology, KTH.
[15] Wikipedia (2014): Lignin.
http://commons.wikimedia.org/wiki/File:Lignin_structure.svg
Accessed: 2014-10-02
[16] Internal document Domsjö Fabriker, “Basic education certification – Domsjö wood
yard and wood room”
[17] Internal document Domsjö Fabriker, “Basic education certification – Domsjö digester”
[18] Internal document Domsjö Fabriker, “Bleaching”
[19] Internal document Domsjö Fabriker, “Basic education certification – Domsjö
bleaching”
[20] Sixta, Herbert (eds.). 2006. Handbook of pulp. Volume 2. Weinheim: WILEY-VCH
Verlag Gmlott & Co. KGaA
[21] Internal document Domsjö Fabriker, “Basic education certification – Domsjö drying
pulp”
[22] Internal document Domsjö Fabriker, “Basic education Domsjö – Evaporation”
[23] Internal document Domsjö Fabriker, “Cooking liquor preparation”
[24] Woodings, Calvin. 2001. A brief history of regenerated cellulosic fibers. Calvin
Woodings. (eds.). Regenerated cellulose fibers. 1-21. Cambridge: Woodhead Publishing Ltd
[25] Wilkes, Andrew. 2001. The viscose process. Calvin Woodings. (eds.). Regenerated
cellulose fibers. 37-61. Cambridge: Woodhead Publishing Ltd
[26] Strunk, Peter. 2012. Characterization of cellulose pulps and the influence of their
properties on the process and production of viscose and cellulose ethers. PhD diss, Umeå
University
[27] Kotek, Richard. 2007. Regenerated Cellulose fibers. Menachem, Levin. (eds.). Handbook
of Fiber Chemistry. 3ed. 667-771. Taylor & Francis group
[28] Swicofil (2014): Rayon viscose.
http://www.swicofil.com/products/200viscose.html
Accessed: 2014-10-02
37
[29] Vroom, R.A. 1963. Kinetic Aspects of the Viscose Rayon Spinning Process.
http://repository.tudelft.nl/view/ir/uuid%3A6bdcf15f-8128-4d7c-a3c8-9894da699e8f/
Accessed: 2014-10-26
[30] Woodings, C. 1995. The development of advanced cellulosic fibres. International
Journal Biological Macromolecules. 17 (6): 305-309
[31] Törnell, B. 1967. Decomposition of Cellulose Xanthate During Spinning of Viscose in
Solutions of Low Acid Content. Svensk papperstidning. 70 (17): 1-7
[32] Törnell, B. 1967. Study of Viscose Spinning. Part 2. Influence of small amounts of zinc
in spinning and a study of complex formation between zinc and xanthate. Svensk
papperstidning. 70 (16): 489-499
[33] Dence, C.W. and Reeve, D.W. (eds.). 1979. Pulp Bleaching: Principles and Practice.
150-153. 397-404. TAPPI PRESS.
[34] Cardamone, J.M and Marmer, W.N. 1995. The whitening of textiles. C.M. Carr (eds.).
Chemistry of the textiles industries. 46-66. Glasgow: Chapman & Hall
[35] Eriksson, L. et al. 2008. Design of experiments: Principles and applications. 3ed.
Umetrics Academy
[36] Eriksson, L. et al. 2006. Multi- and megavariate data analysis, Part 1: Basic principles
and applications. 2ed. Umetrics Academy
[37] Agnemo, Roland; senior consultant, DomInnova. Från viskoslösning till regenererad
fiber [From viscose dope to regenerated fibre], seminar presentation.
[38] Wiklund, S. et al. 2008. Visualization of GC/TOF-MS-Based Metabolomics Data for
Identification of Biochemically Interesting Compounds Using OPLS Class Models.
Analytical Chemistry. 80 (1): 115-122

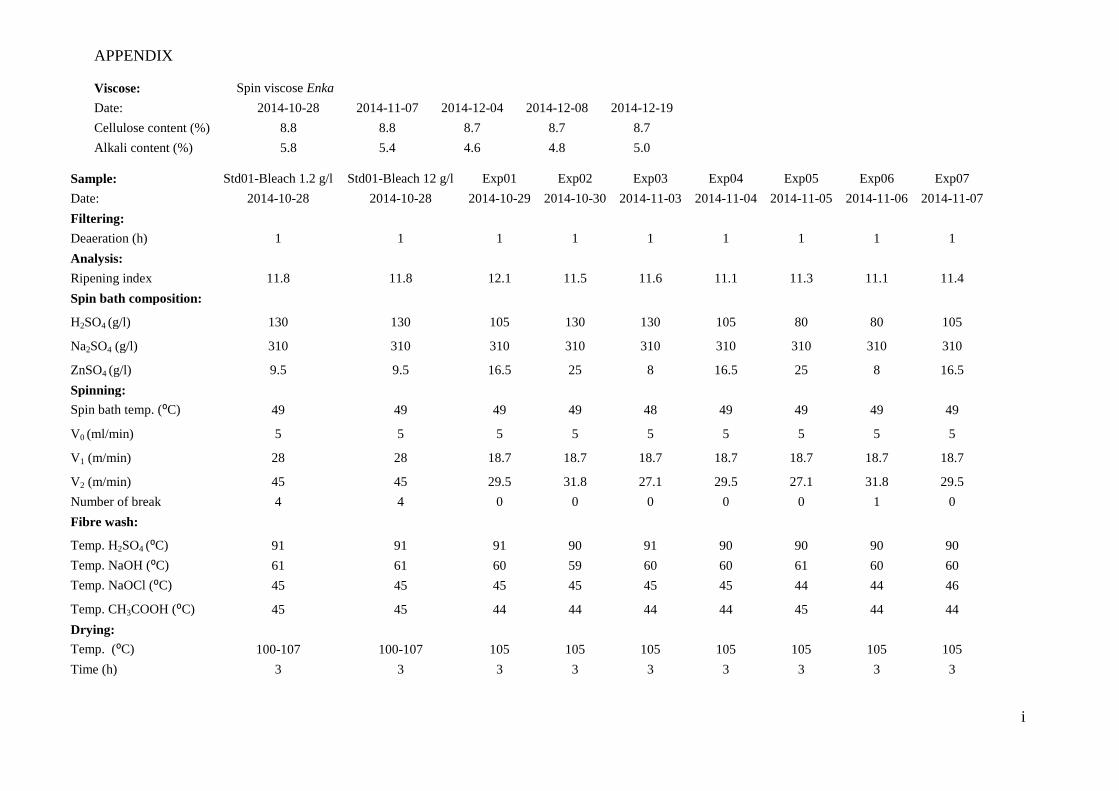
APPENDIX
i
Sample: Std01-Bleach 1.2 g/l Std01-Bleach 12 g/l Exp01 Exp02 Exp03 Exp04 Exp05 Exp06 Exp07
Date: 2014-10-28 2014-10-28 2014-10-29 2014-10-30 2014-11-03 2014-11-04 2014-11-05 2014-11-06 2014-11-07
Filtering:
Deaeration (h) 1 1 1 1 1 1 1 1 1
Analysis:
Ripening index 11.8 11.8 12.1 11.5 11.6 11.1 11.3 11.1 11.4
Spin bath composition:
H2SO4 (g/l) 130 130 105 130 130 105 80 80 105
Na2SO4 (g/l) 310 310 310 310 310 310 310 310 310
ZnSO4 (g/l) 9.5 9.5 16.5 25 8 16.5 25 8 16.5
Spinning:
Spin bath temp. (⁰C) 49 49 49 49 48 49 49 49 49
V0 (ml/min) 5 5 5 5 5 5 5 5 5
V1 (m/min) 28 28 18.7 18.7 18.7 18.7 18.7 18.7 18.7
V2 (m/min) 45 45 29.5 31.8 27.1 29.5 27.1 31.8 29.5
Number of break 4 4 0 0 0 0 0 1 0
Fibre wash:
Temp. H2SO4 (⁰C) 91 91 91 90 91 90 90 90 90
Temp. NaOH (⁰C) 61 61 60 59 60 60 61 60 60
Temp. NaOCl (⁰C) 45 45 45 45 45 45 44 44 46
Temp. CH3COOH (⁰C) 45 45 44 44 44 44 45 44 44
Drying:
Temp. (⁰C) 100-107 100-107 105 105 105 105 105 105 105
Time (h) 3 3 3 3 3 3 3 3 3
Viscose: Spin viscose Enka
Date: 2014-10-28 2014-11-07 2014-12-04 2014-12-08 2014-12-19
Cellulose content (%) 8.8 8.8 8.7 8.7 8.7
Alkali content (%) 5.8 5.4 4.6 4.8 5.0
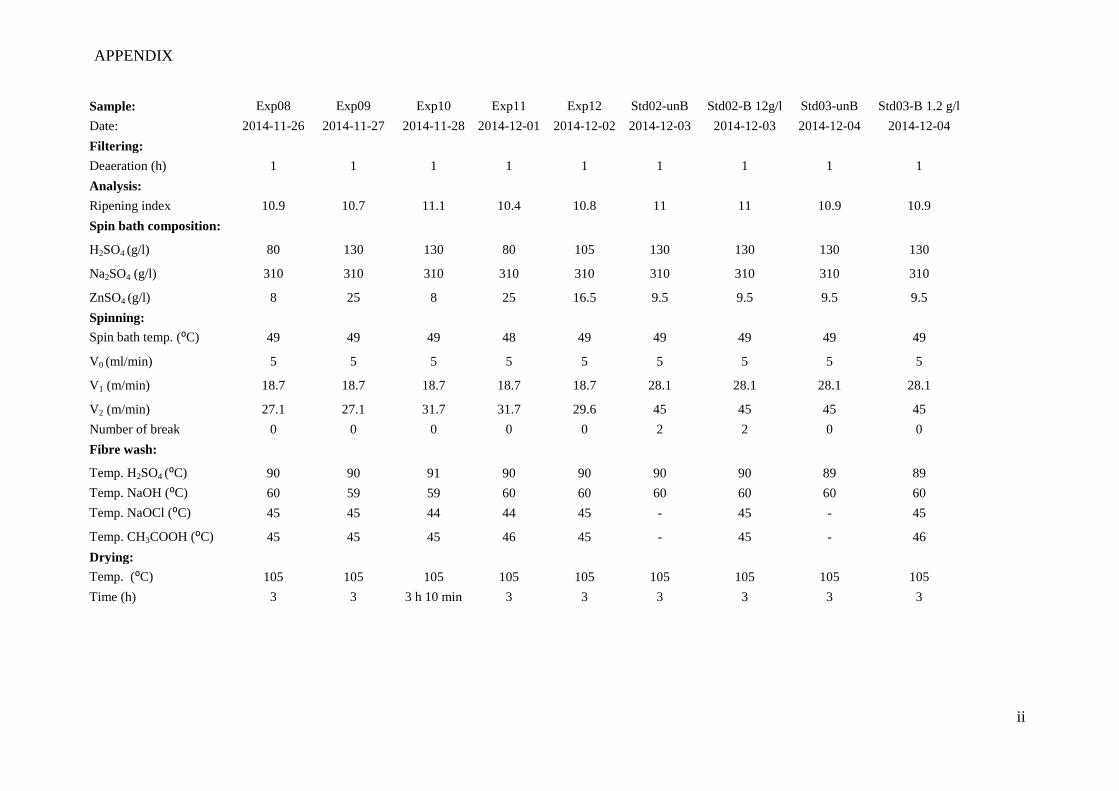
APPENDIX
ii
Sample: Exp08 Exp09 Exp10 Exp11 Exp12 Std02-unB Std02-B 12g/l Std03-unB Std03-B 1.2 g/l
Date: 2014-11-26 2014-11-27 2014-11-28 2014-12-01 2014-12-02 2014-12-03 2014-12-03 2014-12-04 2014-12-04
Filtering:
Deaeration (h) 1 1 1 1 1 1 1 1 1
Analysis:
Ripening index 10.9 10.7 11.1 10.4 10.8 11 11 10.9 10.9
Spin bath composition:
H2SO4 (g/l) 80 130 130 80 105 130 130 130 130
Na2SO4 (g/l) 310 310 310 310 310 310 310 310 310
ZnSO4 (g/l) 8 25 8 25 16.5 9.5 9.5 9.5 9.5
Spinning:
Spin bath temp. (⁰C) 49 49 49 48 49 49 49 49 49
V0 (ml/min) 5 5 5 5 5 5 5 5 5
V1 (m/min) 18.7 18.7 18.7 18.7 18.7 28.1 28.1 28.1 28.1
V2 (m/min) 27.1 27.1 31.7 31.7 29.6 45 45 45 45
Number of break 0 0 0 0 0 2 2 0 0
Fibre wash:
Temp. H2SO4 (⁰C) 90 90 91 90 90 90 90 89 89
Temp. NaOH (⁰C) 60 59 59 60 60 60 60 60 60
Temp. NaOCl (⁰C) 45 45 44 44 45 - 45 - 45
Temp. CH3COOH (⁰C) 45 45 45 46 45 - 45 - 46
Drying:
Temp. (⁰C) 105 105 105 105 105 105 105 105 105
Time (h) 3 3 3 h 10 min 3 3 3 3 3 3
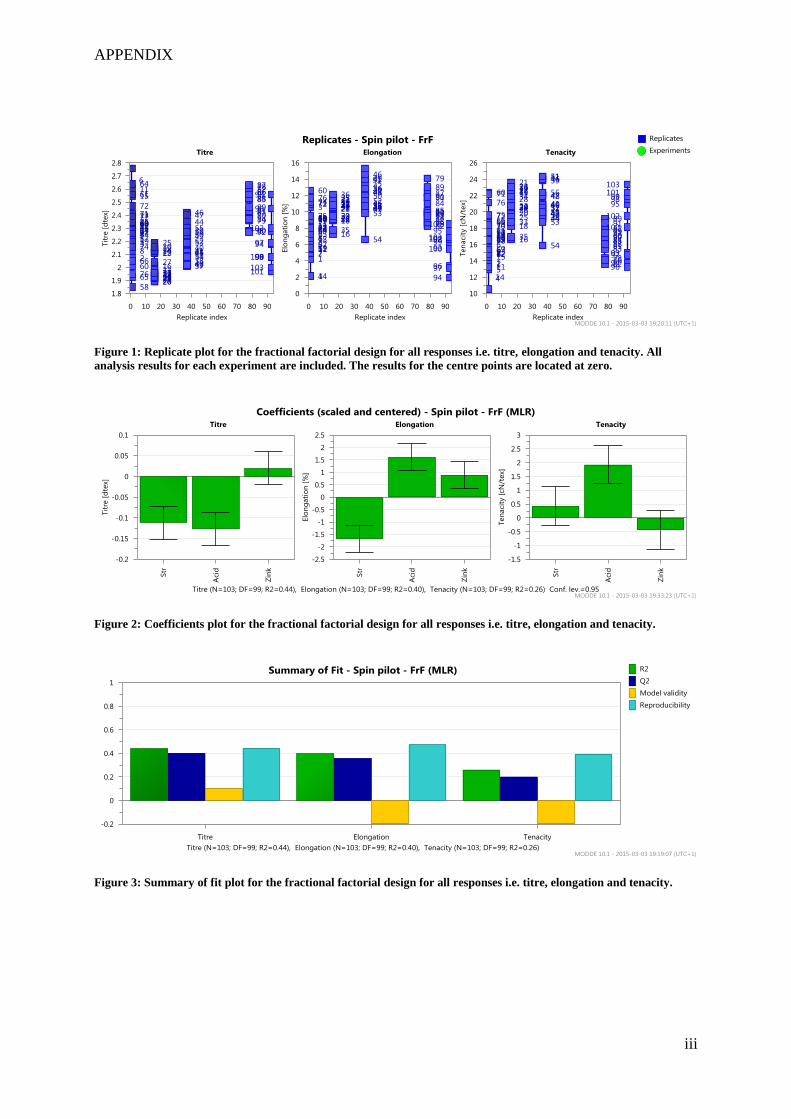
APPENDIX
iii
Figure 1: Replicate plot for the fractional factorial design for all responses i.e. titre, elongation and tenacity. All
analysis results for each experiment are included. The results for the centre points are located at zero.
Figure 2: Coefficients plot for the fractional factorial design for all responses i.e. titre, elongation and tenacity.
Figure 3: Summary of fit plot for the fractional factorial design for all responses i.e. titre, elongation and tenacity.


Department of Chemistry
S-901 87 Umeå, Sweden
Telephone +46 90 786 50 00
Text telephone +46 90 786 59 00
www.umu.se