pilot testing a sorptive biomatric as an mtbe barrier
TRANSCRIPT

Pilot Testing a Sorptive Biomatrix as an MTBE Barrier
Jack SheldonAEHS ConferenceSan Diego, CAMarch 22, 2017

Carbon-based amendments are making a difference!!

• The Site• Microbial Profile• Field Application &
Performance

The Site
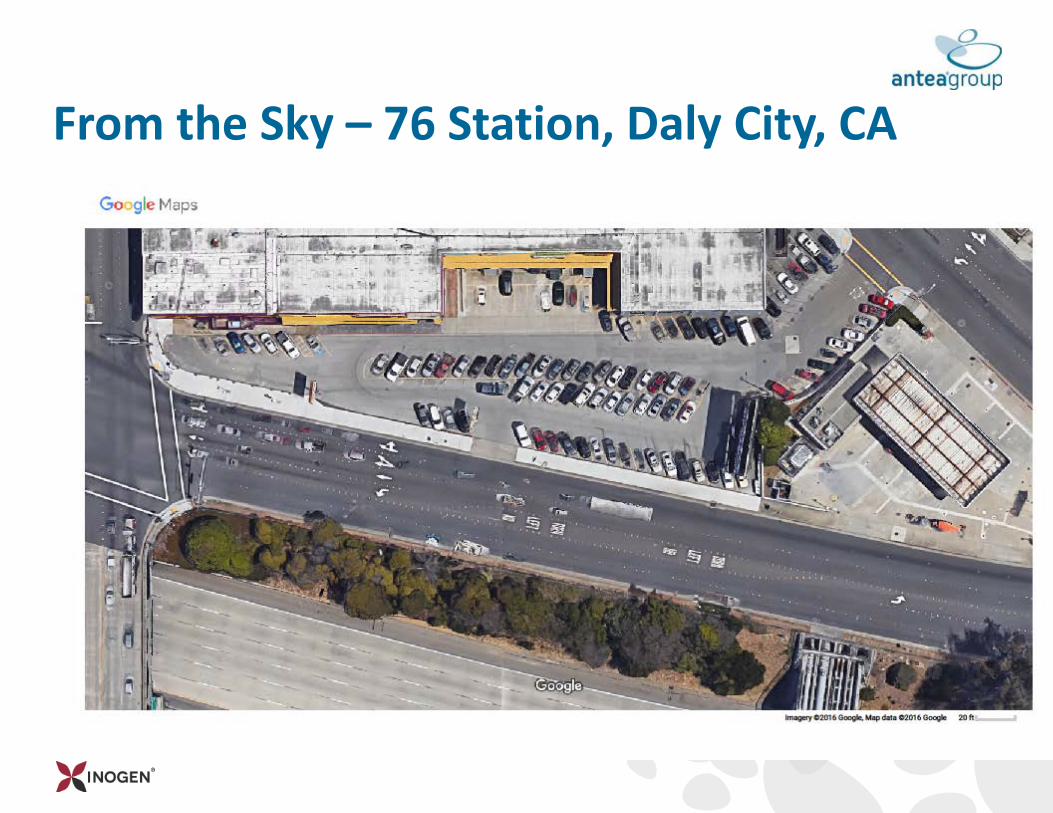
From the Sky – 76 Station, Daly City, CA

The Treatment Area
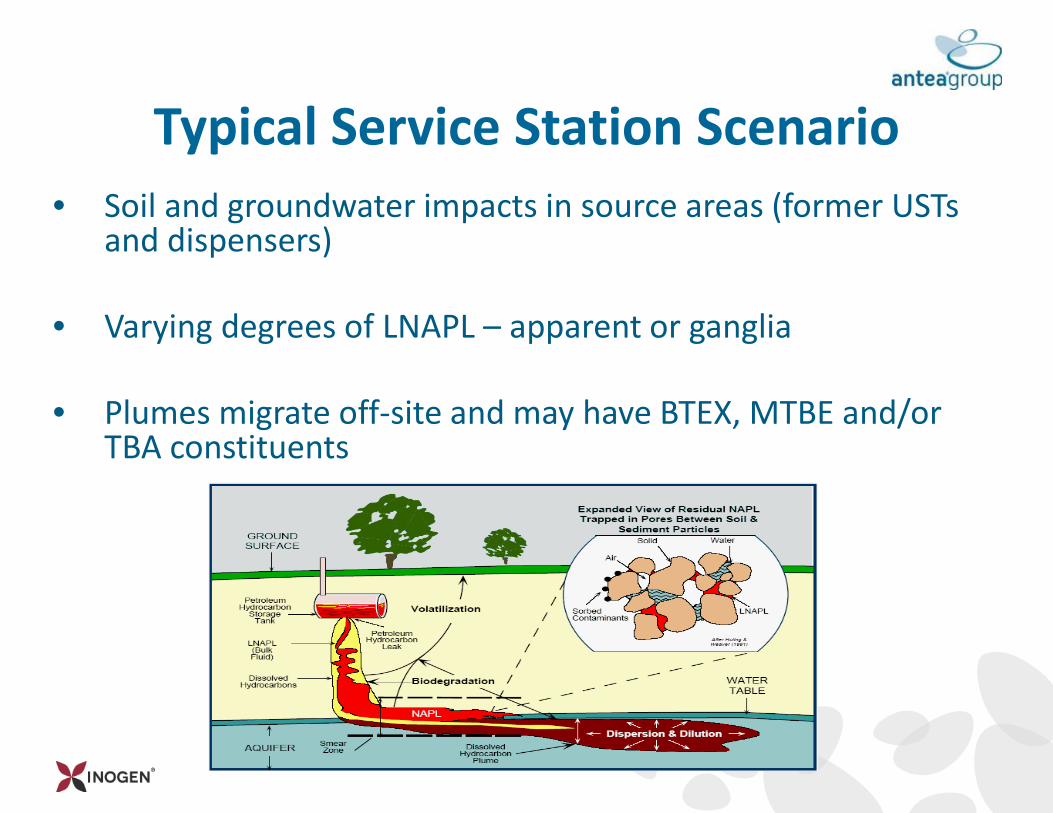
• Soil and groundwater impacts in source areas (former USTs and dispensers)
• Varying degrees of LNAPL – apparent or ganglia
• Plumes migrate off-site and may have BTEX, MTBE and/or TBA constituents
Typical Service Station Scenario

• Operating gas station with prior leaking UST.• Prior remedial efforts to clean up BTEX and TPH-
GRO.• Minimal impacts remain on-site. Off-site
groundwater is the current focus. Minimal soil impact off-site and only 7 lbs. of MTBE mass in groundwater.
• Groundwater at 32 ft. bgs.• San Mateo County Groundwater Protection
Program.
The History

• AS/SVE and MNA important remedies on-site.• Site responded well to increased dissolved
oxygen.• Plume migration through narrow channel and
limited 5 ft. vertical horizon.• Expansion of AS/SVE or switch to P&T for off-
site riddled with logistical issues and costly.
The History – Part 2
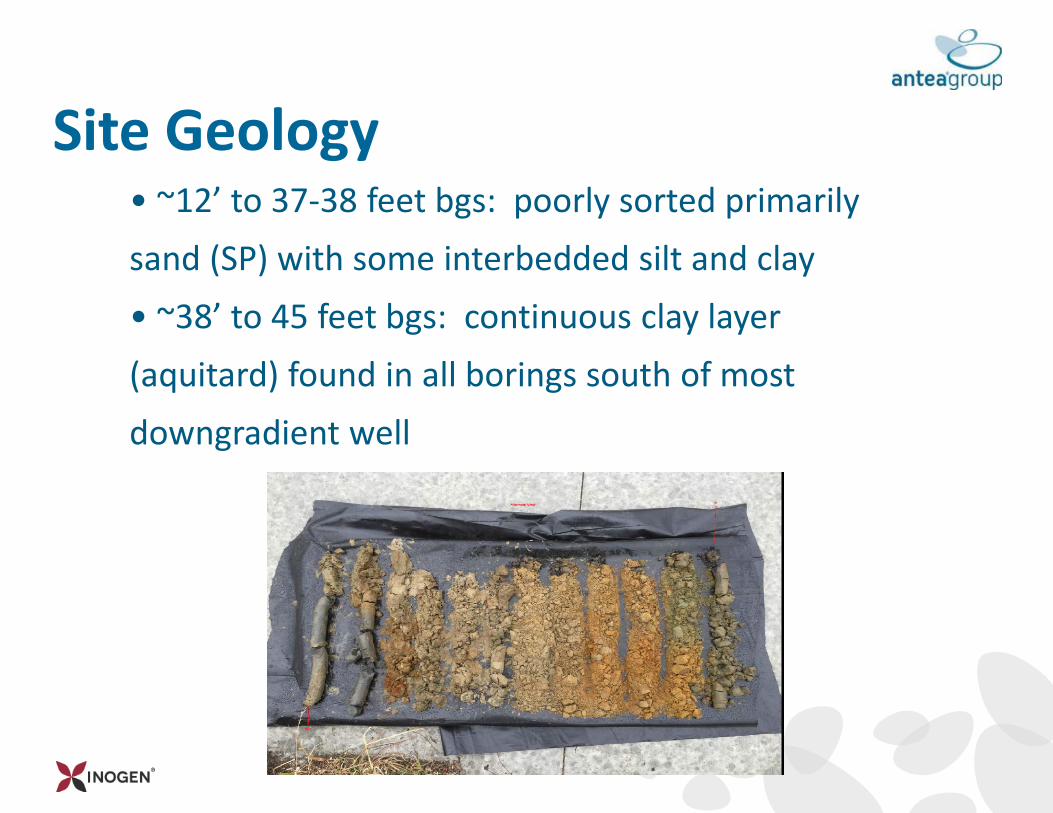
Site Geology• ~12’ to 37-38 feet bgs: poorly sorted primarily sand (SP) with some interbedded silt and clay• ~38’ to 45 feet bgs: continuous clay layer (aquitard) found in all borings south of most downgradient well

Microbial Profile

BioTraps® and Geochemistry
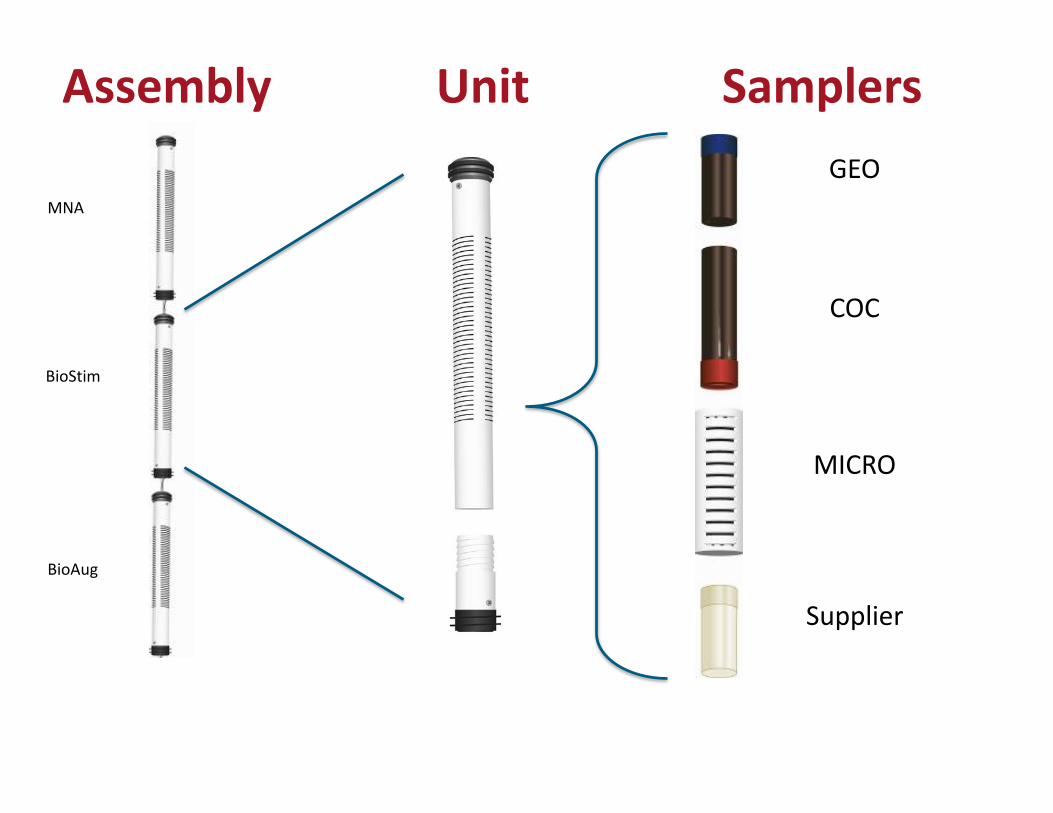
Unit SamplersGEO
COC
MICRO
Supplier
Assembly
MNA
BioStim
BioAug

• MW-8, 10, 11, and 14 used for testing• Water column height dictated specific approach
per well • Sulfate and ORC-A® compared to control• PM-1 organism (MTBE degrader) and MTBE/TBA
gene functions analyzed• 13C labeled MTBE used to show microbial
growth versus actual degradation
Microbial Results
Field Application and Performance
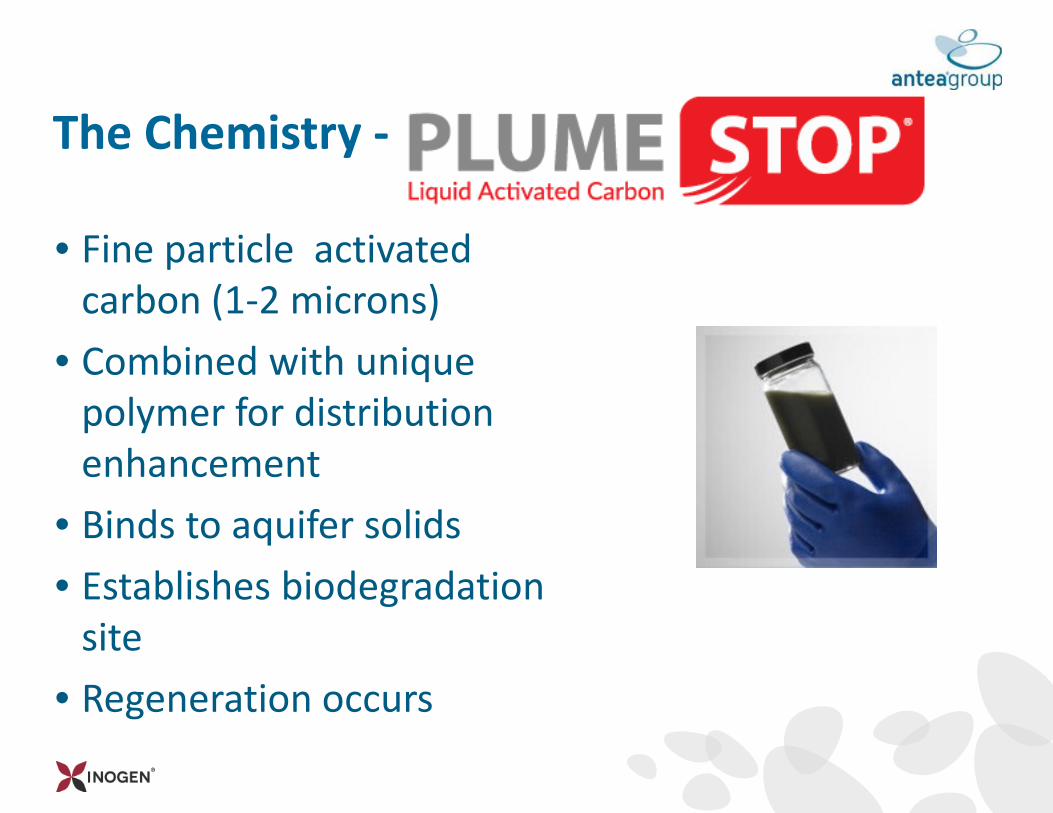
• Fine particle activated carbon (1-2 microns)
• Combined with unique polymer for distribution enhancement
• Binds to aquifer solids• Establishes biodegradation
site• Regeneration occurs
The Chemistry -

PlumeStop® Bench Test
17
Bench test water from MW-24 showed 92% reduction with PlumeStop®.
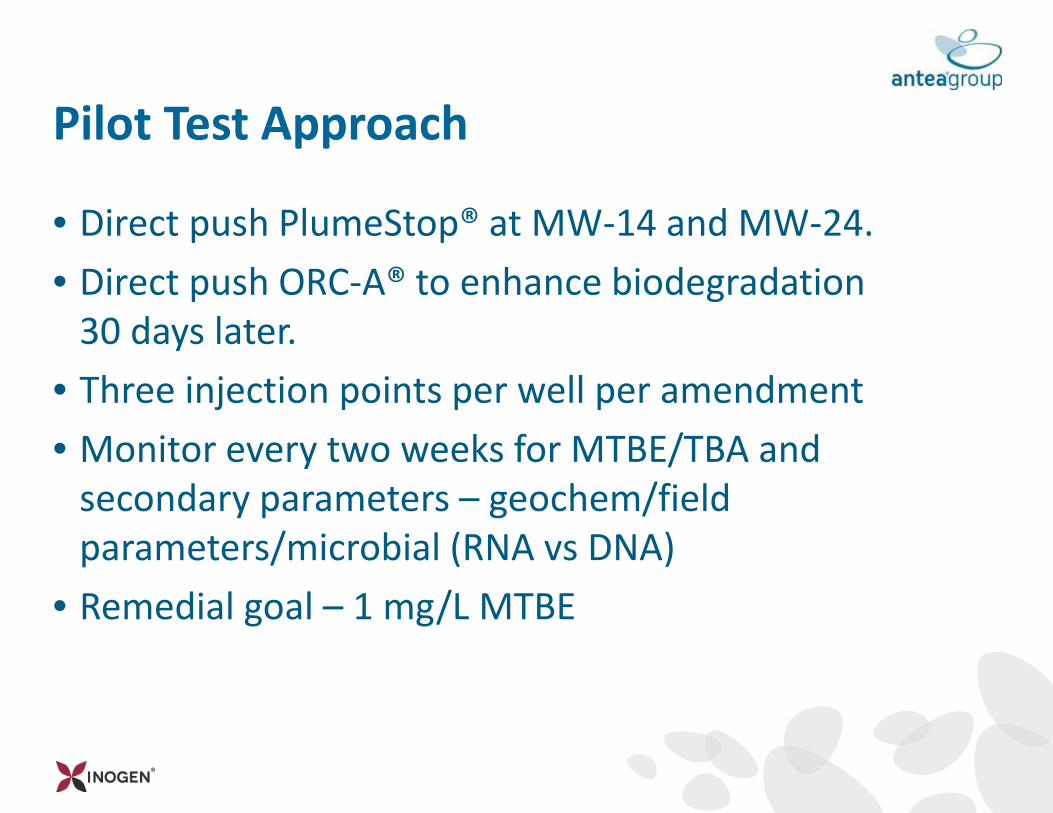
• Direct push PlumeStop® at MW-14 and MW-24.• Direct push ORC-A® to enhance biodegradation
30 days later.• Three injection points per well per amendment• Monitor every two weeks for MTBE/TBA and
secondary parameters – geochem/field parameters/microbial (RNA vs DNA)
• Remedial goal – 1 mg/L MTBE
Pilot Test Approach

• Target interval – 32 -37 ft. bgs MW-14/34 – 39 ft. bgs MW-24 with bottom up approach
• 4 total injection events - several challenges with refusal using direct push and HSA
• Communication/information issues.• Hydropunch and injection tooling used to overcome friction issues• Injection volume – 1047 gal per event at 5,500 mg/L PS + 17 gallons
30% ORC-A® at MW-14• Injection volume – 1438 gal per event at 20,000 mg/L PS + 51
gallons 30% ORC-A® at MW-24• Spacing – 8-10 ft.• Flow/Pressure – 1 -2 gpm/30 - 100 psi (higher observed)
Injection Highlights
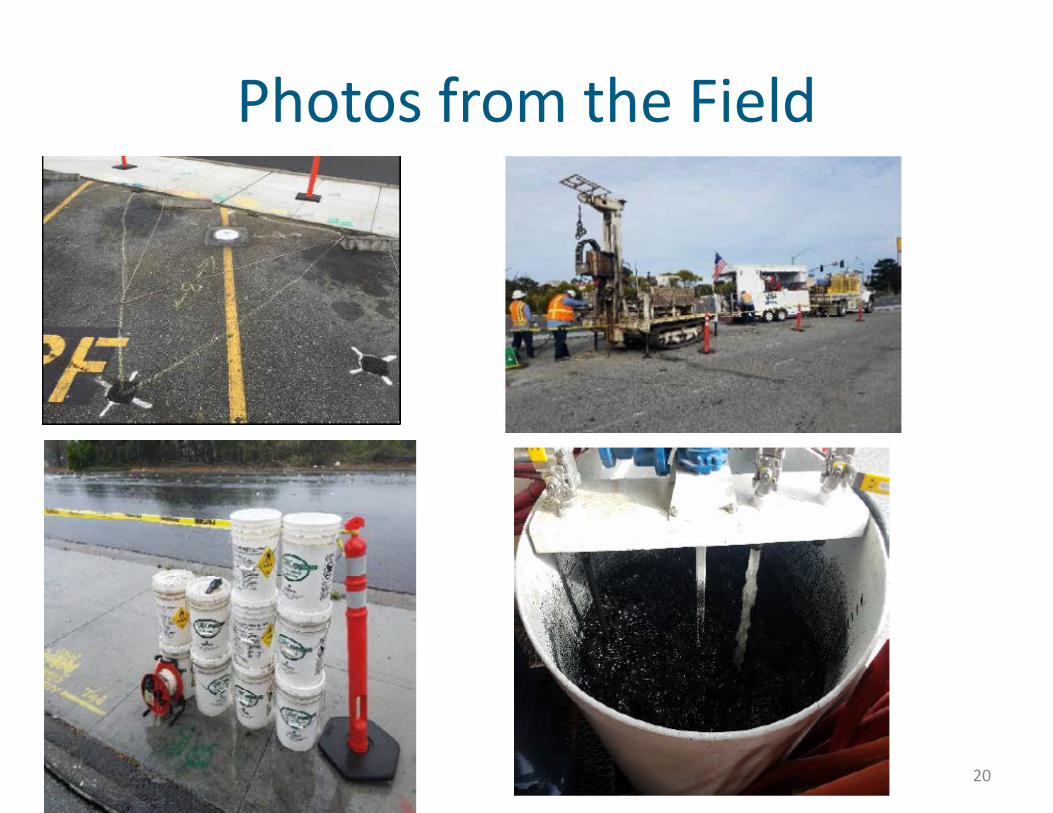
Photos from the Field
20

Critical to Success
21

The Results – MW-14
0
20
40
60
80
100
120
140
160
180
0
1000
2000
3000
4000
5000
6000
7000
8000
1/31/2016 3/21/2016 5/10/2016 6/29/2016 8/18/2016 10/7/2016 11/26/2016
Conc
entr
atio
n (T
BA u
g/L)
Conc
entr
atio
n (M
TBE,
ug/
L)
Date
MW-14MTBE, TBA, versus Time
Former 76 Service Station 11202Daly City, California
MTBE(ug/L)
Plume Stop Injection ORC-A Injection Plume Stop Injection TBA(ug/L)

The Results – MW-24
0
1000
2000
3000
4000
5000
6000
7000
0
2000
4000
6000
8000
10000
12000
14000
16000
18000
20000
4/20/2016 5/10/2016 5/30/2016 6/19/2016 7/9/2016 7/29/2016 8/18/2016 9/7/2016 9/27/201610/17/201611/6/201611/26/2016
Conc
entr
atio
n (T
BA, u
g/L)
Conc
entr
atio
n (M
TBE,
ug/
L)
Date
MW-24MTBE, TBA versus Time
Former 76 Service Station 11202Daly City, California
MTBE(ug/L)
Plume Stop Injection ORC-A Injection TBA(ug/L)

Secondary Results – MW-14
-60
-40
-20
0
20
40
60
80
100
120
140
160
0
0.5
1
1.5
2
2.5
3
3.5
4
1/31/2016 3/21/2016 5/10/2016 6/29/2016 8/18/2016 10/7/2016 11/26/2016
ORP
, mV
Conc
entr
atio
n (D
O, m
g/L)
Date
MW-14DO, ORP, versus Time
Former 76 Service Station 11202Daly City, California
Oxygen, Dissolved(mg/L)
Plume Stop Injection ORC-A Injection Plume Stop Injection Oxidation Reduction Potential(mV)

Secondary Results – MW-24
-250
-200
-150
-100
-50
0
50
100
150
200
250
0
0.5
1
1.5
2
2.5
3
3.5
4
5/15/2016 6/4/2016 6/24/2016 7/14/2016 8/3/2016 8/23/2016 9/12/2016 10/2/2016 10/22/2016
Oxi
datio
n Re
duct
ion
Pote
ntia
l (m
V)
Conc
entr
atio
n (u
g/L)
Date
MW-24DO, ORP versus Time
Former 76 Service Station 11202Daly City, California
Oxygen, Dissolved(mg/L)
Plume Stop Injection ORC-A Injection Oxidation Reduction Potential(mV)

• Direct push injection into sand isn’t always what it appears
• A bioamendment is an important addition to the carbon-based amendment
• With the right microbiology and conditions, substantial reduction in MTBE/TBA concentrations is possible
• 6 ORC-A® and 5 PS points per day is possible• Communicate
Lessons Learned

• Full-scale biobarrier planned.• Dual rows of PlumeStop® with ORC-A®
upgradient side to move oxygen to barrier.• Target MW-14 and MW-24, but add “wing” to
barrier to address well in the street.• Take lessons learned and apply.
Path Forward

Full-scale – 19,000 lbs. PS/4800 lbs. ORC-A®

Jack [email protected]
AnteaGroup @AnteaGroup
Acknowledgements:Dacre Bush, PG, Antea Group (Long Beach)
Craig Sandefur, Dan Nunez - Regenesis (San Clemente)Gregg Drilling
Regenesis Remediation Services (RRS)Microbial Insights
Thank You/Q&A