pima deq 2018-2019 executive summary - final
TRANSCRIPT

EVALUATION OF THE 2018-2019 PIMA COUNTY CLEAN AIR PROGRAM CAMPAIGN
AND CLEAN WATER CAMPAIGN SURVEY
(May 2019)
Executive Summary
Prepared for:
PIMA COUNTY DEPARTMENT OF ENVIRONMENTAL QUALITY
Tucson, Arizona
Prepared by:
FMR ASSOCIATES, INC.
Tucson, Arizona
Copyright, FMR Associates, Inc., 2019

EVALUATION OF THE 2018-2019 PIMA COUNTY CLEAN AIR PROGRAM CAMPAIGN AND
CLEAN WATER CAMPAIGN SURVEY (May 2019)
Executive Summary
Methodology Overview and Tracking – This dual-methodology annual tracking survey, conducted for the Pima County Department of Environmental Quality (PDEQ), is comprised of a 500-person, randomly-selected and statistically-projectable sample of adult (16 or older) residents of Pima County, Arizona. Like the last four surveys, the 2019 survey utilized a split-methodology sample, with 245 Telephone and 255 Internet interviews. Projects conducted before 2015 were all Telephone surveys. The Telephone and Internet survey instruments and screening criteria were identical. Fielding for this project was conducted during May 2019. A Spanish-language version of the final questionnaire design was prepared and made available to Telephone/Internet survey respondents who requested it. All Telephone surveys were fielded among randomly-selected adults (16+) who reside in Pima County. Telephone survey respondents were further randomized by interviewing only “the male or female in your household who is 16 or older and most recently celebrated a birthday.” There was only one Telephone interview conducted per household. Telephone interviews were distributed on the basis of geographic population density in Pima County, with specific steps taken to ensure a proportionate number of interviews (based on population estimates) in each of four zip code-defined survey “regions” (Northwest, Central, South and East). The 2019 Telephone sub-sample is highly representative of geographic sampling quotas. Internet surveys were conducted utilizing a questionnaire administered by FMR Associates and hosted on an independent website. Potential survey respondents were contacted through a third party database Internet panel sample company that emailed invitations to their “opt in” panelists who reside in Pima County zip codes. This project analyzed and tracked the overall effectiveness of the “Clean Air” Program after 29 campaign sessions. For the seventh consecutive year, the project measured and tracked key issues related to stormwater management, land use behaviors and actions impacting stormwater quality for PDEQ’s “Clean Water” Program. Awareness of the Pima County “Clean Air” Program – Compared to last year, awareness of the Pima County “Clean Air” Program is slightly lower (from 46% to 43%). Awareness is balanced across ethnicity or geography (slightly higher in Northwest or East zips) and is highest among women, those 46 or older, 11+ year Pima County residents and higher income households. Program awareness is directly related to the perception of a progressively more severe stormwater pollution problem.

-2-
Awareness of Various Clean Air Events or Activities – In line with past years, more than eight of ten are familiar with at least one event or activity used to promote clean air in the Tucson area (81%). However, awareness is incrementally lower than we found in 2018 (84%) and 2017 (86%). At least three of ten overall are familiar with the following “Clean Air” events/activities:
• “Earth Day Festival and Parade” (57% awareness, nearly unchanged since 2018 [58%]. Geographically, only East region residents are slightly less familiar [52% versus 56%-60% elsewhere].)
• “Bike to Work Day” (52% awareness, down from 56% in 2018. More highly familiar to South or Northwest zip residents.)
• “Walk and Bike to School Day” (46% awareness, up significantly from 31% in 2018 [when it was tested as “Walk and Roll to School Day”]. South region residents are most likely to be familiar with this event.)
• “Bike Fest” (41% awareness, down from 50% in 2018. This event is more familiar to South zip code residents.)
• “Cyclovia” (29% awareness, up from 23%-25% previously. Awareness is marginally lower only in the South region [25% compared to 30%-32% elsewhere].)
New to the current study, 21% indicate an awareness of “The Travel Reduction Program.” These tend to be South or East residents. Clean Air Campaign Event Participation and Actions Taken – Among the 81% of survey respondents familiar with at least one “Clean Air” campaign activity, 15% indicate that they or someone in their household participated in at least one event. This is down slightly from 2017-2018 levels (18% each). Participation is generally consistent regardless of geography (slightly higher in the Northwest zips), and elevated among women, 16 to 35 year-olds and non-Whites. Among the 15% who report past participation in a “Clean Air” event or activity, fully three of four indicate that they have changed (or are considering changing) their daily routines or behaviors to help improve air quality. This is up from 64% from last year, and in line with 2017 findings (74%). Among the combined sample, this means that 9% report a change in their behavior after participating in a “Clean Air” event (compared to 10% in 2018). Who is more likely to indicate a change in behavior after attending a “Clean Air” event? Central or South zip residents and women. Opinion of Activities/Events – Consistent with last year, 86% familiar with at least one “Clean Air” event have a positive opinion of “events and activities that encourage people to use other modes of transportation or work from home instead of driving alone.” This includes nearly one-half who are “very favorable” (47%, down slightly from 49%). And this is the case regardless of geography. For the fifth straight year, less than one of ten (8%) have a negative opinion (to any extent) of air quality related events and activities.

-3-
Steps Taken to Reduce Air Pollution – In line with past years, and allowing for multiple responses, the top five steps taken to help reduce air pollution in the Tucson area include:
• Carpool/Less driving alone (43%, up significantly from 32%-38% in recent surveys. South or East zip residents are more apt to indicate an increase in carpooling or less solo driving.)
• Keep car tuned (41%, up from 34% last year, and the highest mention in recent surveys. There are few differences with respect to geography.)
• Keeping tires properly inflated (40%, up significantly over the last three surveys [31%-35%]. These tend to be East residents, women, 56 to 65 year-olds, Whites and higher income types.)
• Generally reduced driving (35%, down slightly from the prior three years [37%-38%]. More apt to have reduced driving are Northwest or East region residents.)
• Avoid excessive idling (23%, up from 12%-16% in recent surveys. Avoiding excessive idling is lower only in the South region [19% versus 22%-27% in other areas].)
Compared to 2018 findings, more also report they have planted trees (20%, up from 17%) and bought a more fuel efficient car (17%, up from 13%). Others indicate that they have bought bicycles (14%, down slightly from 15% last year), chosen once a week not to drive (12%, down slightly from 13%), using BBQ grill less (10%, up from 7%) and/or using fireplace/wood stove less (7%, down slightly from 8%). Compared to the last two years, fewer are adjusting their vehicle’s emission control equipment (7%, down from 14%). Overall, 15% indicate they have done nothing to reduce air pollution. This is up from the record low 11%-12% mention recorded in 2017-2018, but consistent with 2015-2016 levels (15% each). Once again, these tend to be those who perceive a “minor” air quality problem and residents unfamiliar with the “Clean Air” Program. School Materials Recall Among Children 5-18 – Three of ten overall indicate that they have children between the ages of 5 and 18 living in their household. This is up incrementally from 2017 (28%) and 2018 (29%) levels. South region residents, 16 to 45 year-olds and non-Whites are more likely to report the presence of children in their households. Among these households with children 5 to 18, 38% report that these children have “talked about or brought home materials from school about improving air quality.” This is down from 50%-53% in 2017-2018. Air pollution information recall in the current survey is elevated among Central region residents and those aware of the “Clean Air” Program (43% versus 37% unfamiliar).

-4-
Gasoline-Powered Lawn Mower Usage and Characteristics – Identical to last year, 7% overall indicate they or someone in their household uses a gasoline-powered lawn mower to care for their home property. Usage is slightly lower only in the Northwest zips (4% versus 7%-9% elsewhere), and elevated among men, 16 to 35 year-olds and Hispanics Among these users who know, slightly more say their gas-powered mower has a 4-stroke (43%) than 2-stroke (40%) engine – with average monthly usage of 34 minutes. Statement Evaluations – The following is a summary of the percentage of agreement/disagreement with a series of statements related to program awareness, pollution awareness, topics and general knowledge: PDEQ and Sun Rideshare Awareness –
• You are aware of the Pima County Department of Environmental Quality (PDEQ) (60% agree with this statement, down from 66% last year and the lowest awareness recorded since 2015 [60%]. Awareness in the current study is highest in the Northwest zips and those familiar with the “Clean Air” Program [83% versus 44% unaware].)
• You are aware of the services provided by Sun Rideshare (52% agree, down slightly from 2018 [55%] but consistent with 2017 findings [51%]. Awareness is very consistent across geography and higher among residents familiar with the “Clean Air” Program [64% versus 45% unaware].)
PDEQ Program and Campaign Awareness –
• You have seen or heard information about the importance of keeping your tires properly inflated (82% agree. This is down from the last two surveys [86%-88%], but consistent with 2016 agreement [83%]. East region residents and those aware of the “Clean Air” Program [88% versus 80% unaware] are most apt to agree.)
• You have seen or heard the phrase “Healthy Air Is in Our Hands” (Three of ten agree, down incrementally from 36% in 2016. Awareness is higher among South region residents and those aware of the “Clean Air” Program [44% versus 21%].)
Air Pollution Evaluations –
• You have seen or heard information regarding clean air or air pollution (82% agree, up from 80% in 2018. Agreement is lower only in the East zips [75% versus 81%-85% elsewhere] and higher among those aware of the “Clean Air” Program [92% versus 76% unaware].)
• You are aware that the majority of our air pollution comes from motor vehicle
use (77% agreement, down from 81%-83% in recent years. Northwest residents are more apt to agree. So are those aware of the Pima County “Clean Air” Program [84% versus 72% unaware].)

-5-
• You have seen or heard information that vehicle engine idling causes air pollution (75% agree, down from 88%-90% in 2017-2018. Most likely to agree are residents familiar with the “Clean Air” Program [85% versus 70% unfamiliar]. Geographically, agreement is somewhat lower only in the Central zips [70% versus 75%-80% elsewhere].)
• Because you want to reduce air pollution, you are generally driving less (52% agreement, down from 58% in the last four years. Residents aware of the “Clean Air” Program [58% versus 48% unaware] are most likely to agree. Only in the East zips do residents disagree [53%] more often than they agree [47%].)
Travel Behavior for Shopping – Six of ten overall indicate that they generally drive alone to go shopping. This is up progressively from 2017 (54%) and 2018 (56%) levels, and equals the 2016 study (60%). Fewer also carpool with 1 to 4 other adults (from 30% last year to 25% now). While there has been a healthy uptick is those who walk for shopping (from 3% to 7%), use of other alternative methods is unchanged to lower: bus (4%, down from 6%), bicycle (1%, down from 2%) or motorcycle (unchanged at 1%). Less than 1% overall in the current study say the vanpool with 5 or more other adults or take the streetcar for shopping purposes. Travel Behavior for Leisure Purposes – For leisure purposes (“such as dining out, meeting with friends, going to the movies, going to the gym, etc.”), more now say they generally drive alone (46%) than carpool with 1 to 4 other adults (41%). In 2018, slightly more carpooled (43%) than drove solo (42%). As in past years, fewer ride the bus (4%), walk (2%), motorcycle (2%) or vanpool with 5 or more other adults (1%). Perceived Seriousness of Air Quality Problem – Two of ten perceive that a “major” air quality problem exists in the Tucson area. This is up from 17% last year and consistent with 2017 findings (21%). At the same time, slightly fewer think that air quality is a “minor problem” (from 24% last year to 21% now). In line with recent years, most say that the air quality problem is “moderate” issue (54%), with 5% who are unsure. The perception of a “major” air quality problem is lower only among residents of the Central zips (16% versus 19%-22% elsewhere). Instead, non-Hispanic minorities and residents aware of the “Clean Air” Program (21% versus 17% unaware) are more likely to indicate that Tucson’s air quality is a “major problem.” This is also the case among residents who perceive that Tucson has a progressively more severe stormwater pollution problem. Men, those 66 or older and multi-vehicle households are more likely to say that Tucson has a “minor” air quality problem.

-6-
Work Commuting Behavior – Identical to last year, and allowing survey respondents to select more than one category of response, 38% say that they are employed full-time (30 hours or more each week). Full-time employment is greater in the Central and Northwest areas. Consistent with last year, 12% report working part-time (less than 30 hours each week). Part-time employees are similar regardless of area. Unchanged since 2018, 9% report being unemployed, with little difference based on area of residence. Similar to last year, 27% in the current survey are retired, more often Northwest or South region respondents. In line with 2018 findings, about one of ten are students or homemakers. Among those who work full-time or part-time (50% of the total sample), 21% work exclusively for a home-based business. This is up from 13% last year, but identical to the 2017 study. Of those who work outside the home (79%), 73% work for another company exclusively, while 6% work for both another company and a home-based business. South zip code residents (33% versus 12%-20% in other regions) and those who employed on a part-time basis are more apt to work exclusively for a home-based business. Three of four full-time employees report working a “standard” schedule (8 hour days five days a week), up from last year (69%). Another 6% work 10 hour days, 4 days a week (down from 10% last year), and 5% work a 12 hour day, either 3 or 4 days a week (unchanged from last year). Just 2% report working 80 hours over 9 days with the 10th day off (down from 4%). Similar to last year, 12% indicate some “other” workweek options or say their workweek varies. Central or Northwest area residents are more apt to utilize some type of compressed workweek. Similar to last year, 80% utilize single passenger commuting to work or school. The average frequency of use is 4.6 days, up from 4.2 last year. Only East area residents are somewhat less likely to drive alone at least one day per week (74% versus 78%-83% in other areas). At the same time, Northwest (62%) and Central (57%) residents are most apt to drive alone 5+ days per week. Use of Alternative Work/School Commute Travel Methods – The following is a summary of the usage of alternative modes for commute travel as measured in this survey:
•••• Walk to work or school (Similar to last year [21%], two of ten say they walk to work or school, with a decline in average days [from 2.8 to 2.4 days]. Walking to work or school is more common among South area residents.)
•••• Work at home instead of driving to work (Nearly identical to 2018 findings [19%], 20% telecommute, although frequency of usage has declined slightly [from 3.0 to 2.8 days]. Telecommuting is lower only in the East zips [11% versus 20%-23% in other areas].)
• Carpool/Vanpool (Down from last year [23%], 19% indicate they carpool or vanpool at least one day per week. Average frequency, however, has increased [from 2.6 to 3.1 days]. Northwest area residents are somewhat more apt to carpool at least one day a week.)

-7-
•••• Ride a bike to work or school (Down from last year [17%], but more in line with 2017 findings [10%], 13% indicate riding a bike to work or school. The frequency has also returned to 2017 levels [2.5 days, down from 2.9 last year]. East area residents are more apt to ride a bike to work or school.)
•••• Take the bus to work or school (Bus ridership has again declined [from 14% to 12%], with no change in the average days using this method [2.6]. South area residents are more apt to take the bus.)
•••• Take the streetcar to work or school (Down from last year [11%], but in line with 2017, 4% say they take the streetcar. The frequency of usage has increased [from 2.4 days to 3.2 days].)
•••• Ride a motorcycle to work or school (Similar to last year, 4% indicate riding a motorcycle to work or school, with the frequency increasing to 2017 levels [2.9 days].)
Most Used Mode of Transportation for Work/School Commute – Representing incremental annual growth from 58% in 2015, 68% of commuters now say that single-passenger vehicle commuting is their most-used method of transportation. Consistent with last year, 7% each are either primarily carpooling or telecommuting. Those who carpool for their primary transportation tend to be South or Northwest zip code residents. Telecommuting primaries are more apt to be Northwest area residents. Down slightly from last year (7%), 5% are riding a bike as their primary mode of transportation to work or school, more often South or East area residents. As many are primarily taking the bus (5%, up slightly from 4%) or walking (5%, down from 6%). In lesser numbers, a few take the streetcar (unchanged at 2%) or ride a motorcycle (1%, up from 0%) as their primary mode of commuting. Miles Traveled to Work or School – Consistent with last year, three of ten indicate they have a commute of 5 miles or less. Another 23% say their commute is between 6 and 10 miles (down from 30%), while 17% commute 11 to 14 miles (up from 8%). Similar to last year, 29% travel 15 miles or more. Geographically, East area residents are most apt to have a commute of 15+ miles (46%), while the vast majority of Central zip code residents commute 10 miles or less (71%). Telecommuting – Down just slightly from last year (19%), 17% who work outside the home indicate that they telecommute (“working from home as an alternative to going in to your office or place of business during regular business hours”). Telecommuters are more apt to be Central area respondents (22%). Among telecommuters, 58% say they do so more than once a week, up from 44% last year and 51% in 2017. Another 12% telecommute about once a week (down from 15% last year), and 24% do so 2-3 times a month (up from 17%). Just 6% say they telecommute only once a month (down from 15%).

-8-
Daily Commuter Miles Saved Through Alternate Modes – Based on the combination of results related to the modes of commuter travel and distances traveled with employment estimates (Source: Arizona Office of Employment and Population Statistics), we estimate that the reduction of single-occupant vehicles commuting through the use of alternative methods of travel saves 2,877,389 vehicle miles per day – or 30% of total miles driven/not driven. This is down from a 38% savings in 2018. Why? This is due to a combination of the lower percentage of those who report working outside the home (79%) and, perhaps relatedly, reductions in use (both overall and average days) of some alternative modes. Overall, 10.3% fewer miles are being traveled (from 10,809,324 in 2018 to 9,691,879 now) – in part because of the decrease in non-home-based employees (from 87% to 79%, which results in fewer employed persons who have commute miles to calculate). 2019 Estimated Number of Work/School Miles Saved Through Alternative Modes
Mode
(A) % Take Mode
(B) # Daily
Commuter Trips
(C) Average
Commuter Miles
(D) Total Miles
Traveled
(E)
Miles Driven
(E) Miles Not
Driven
Drive alone 80% 505,417 12.5 6,317,713 6,317,713 -0-
Motorcycle 4% 15,996 9.9 158,360 158,360 -0-
Carpool 19% 80,992 11.3 915,210 326,861 588,349
Bus 12% 43,489 9.3 404,448 11,556 392,892
Bicycle 13% 45,127 8.7 392,605 -0- 392,605
Walk 20% 65,260 6.0 391,560 -0- 391,560
Streetcar 4% 17,773 6.6 117,302 -0- 117,302
Telecommute 20% 77,201 10.6 818,331 -0- 818,331
Compressed workweek 9% 13,996 12.6 176,350 -0- 176,350
TOTALS: -- 865,251 -- 9,691,879 6,814,490 2,877,389
(A) From Table 26. (B) Based on number of work/school commuters in survey, percentage using mode and number of days/week
mode used. (C) From Table 26c. (D) (D) = (B) x (C). (E) Carpool: based on workers average carpool/vanpool of 2.8 (from Table 26b). Bus: based on average of 35
riders/bus. Walk/bicycle/streetcar/telecommute/compressed workweek: no polluting vehicles used.

-9-
Daily Shopping/Leisure Miles Saved Through Alternate Modes – Combining trip frequency/length estimates provided by Pima Association of Governments with the “most used” methods of transportation (Tables 18/19 in our report), we can further estimate daily vehicle miles saved through the use of alternative modes for shopping and leisure purposes. As summarized in the display below, we estimate that the reduction of single-occupant vehicles commuting through the use of alternative methods of travel for shopping saves 571,259 vehicle miles per day, or 29% of total miles driven/not driven (down from 30% in 2018, due primarily to increased levels of single passenger vehicle travel). The number of leisure travel miles saved daily is 2,979,102 – 35% of total miles driven/not driven (down from 37% last year). These compare to a savings of 2,877,389 vehicle miles per day in travel to work or school (or 30% of total miles driven/not driven).
2019 Estimated Number of Shopping Miles Saved Through Alternative Modes
Mode
(A) % Take Mode
Most Often
(B) # Daily
Shopping Trips
(C) Average Shopping
Miles
(D) Total Miles
Traveled
(E)
Miles Driven
(E) Miles Not
Driven Drive alone 60.6% 398,487 5.00 1,207,416 1,207,416 0 Motorcycle 0.6% 398,487 5.00 11,955 11,955 0 Carpool/Vanpool 25.8% 398,487 5.00 514,048 183,589 330,459 Bus 4.0% 398,487 5.00 79,697 2,277 77,420 Walk 6.8% 398,487 5.00 135,486 0 135,486 Bicycle 1.2% 398,487 5.00 23,909 0 23,909 Streetcar 0.2% 398,487 5.00 3,985 0 3,985
TOTALS: -- -- -- 1,976,496 1,405,237 571,259
(A) From Table 18. (B) Source: Pima Association of Governments. (C) Source: Pima Association of Governments. (D) (D) = (A) x (B) x (C). (E) Carpool: based on workers average carpool/vanpool of 2.8 (from Table 26b). Bus: based on average of 35
riders/bus. Walk/bicycle/streetcar: no polluting vehicles used.
2019 Estimated Number of Leisure Miles Saved Through Alternative Modes
Mode
(A) % Take Mode
Most Often
(B) # Daily Leisure Trips
(C) Average Leisure Miles
(D) Total Miles
Traveled
(E)
Miles Driven
(E) Miles Not
Driven X`Drive alone 46.0% 1,518,736 5.78 4,038,015 4,038,015 0 Motorcycle 2.2% 1,518,736 5.78 193,122 193,122 0 Carpool/Vanpool 42.4% 1,518,736 5.78 3,721,997 1,329,285 2,392,712 Bus 4.2% 1,518,736 5.78 368,688 10,534 358,154 Walk 2.4% 1,518,736 5.78 210,679 0 210,679 Bicycle 0.2% 1,518,736 5.78 17,557 0 17,557
TOTALS: -- -- -- 8,550,058 5,570,956 2,979,102
(A) From Table 19. (B) Source: Pima Association of Governments. (C) Source: Pima Association of Governments. (D) (D) = (A) x (B) x (C). (E) Carpool: based on workers average carpool/vanpool of 2.8 (from Table 26b). Bus: based on average of 35
riders/bus. Walk/bicycle/streetcar: no polluting vehicles used.

-10-
Final Air Quality Campaign Observations
Awareness of the Pima County “Clean Air” Program has decreased from 46% in 2018 to 43% this year. Similarly, slightly fewer are familiar with at least one “Clean Air” event (from 84% to 81%). Still, as we have found in past surveys, there continues to be a significant difference in key attitudes and behaviors related to air quality among those aware of the “Clean Air” Program and those unaware (43% and 49%, respectively). This relationship is again readily apparent, as summarized in the comparative displays below. “Clean Air” Program Some key differences: Difference Aware Unaware (43%) (49%) Air Quality Event Awareness
• Travel Reduction Program 2019 +250% 35% 10%
• Bike Fest 2019 +83% 55% 30% 2018 +64% 64% 39%
• Cyclovia 2019 +82% 40% 22% 2018 +48% 31% 21%
• Walk and Bike to School Day 2019 +71% 60% 35% 2018 +110% 42% 20%
• Bike to Work Day 2019 +62% 68% 42% 2018 +56% 70% 45%
• Earth Day Festival & Parade 2019 +52% 73% 48% 2018 +55% 73% 47%
• Participation in a “Clean Air” event 2019 +144% 22% 9% 2018 +108% 25% 12%
���� On average, there is a 106% higher awareness and/or participation in “Clean Air” events or programs among those familiar with the “Clean Air” Program (compared to 80% in 2018).

-11-
“Clean Air” Program Some key differences: Difference Aware Unaware (43%) (49%) PDEQ and Sun Rideshare Awareness
• Aware of PDEQ 2019 +89% 83% 44% 2018 +85% 85% 46%
• Aware of Sun Rideshare services 2019 +42% 64% 45% 2018 +69% 71% 42%
���� On average, there is a 66% greater awareness of PDEQ and Sun Rideshare services among those aware of the “Clean Air” Program (compared to 77% in 2018).
PDEQ Activity Understanding
• Seen or heard information regarding clean air or air pollution 2019 +21% 92% 76% 2018 +16% 86% 74%
• Seen or heard information that vehicle engine idling causes air pollution
2019 +21% 85% 70% 2018 +10% 92% 84%
• Aware that majority of air pollution comes from motor vehicle use
2019 +17% 84% 72% 2018 +16% 88% 76%
• Seen or heard information about the importance of keeping tires properly inflated
2019 +10% 88% 80% 2018 +12% 93% 83%
���� On average, there is a 17% higher understanding of PDEQ activities among those aware of the “Clean Air” Program (compared to 25% in 2018).

-12-
Consistent with past years, we again conclude that these survey findings and tracking results suggest that the “Clean Air” Program increases awareness, belief and actions related to improving air quality. As a result, targeting those unfamiliar with the program continues to be a key recommendation of this project. Those unfamiliar with (or unsure of) the “Clean Air” Program tend to be Central or South area residents, 16 to 35 year-olds, low income households (below $15,000 annually) and part-year or the newest (for less than two years) Pima County residents. As a result, promotional, communication and awareness-building efforts should be targeted towards these groups. The profile of those unfamiliar (younger, lower income and newer residents) is consistent with higher levels of social media consumption. Consequently, we recommend increased development and usage of social media (such as Facebook or Twitter ads, postings, links, etc.) to reach them. Tire Inflation Education Campaign – Compared to last year, somewhat fewer say they “have seen or heard information about the importance of keeping your tires properly inflated” (from 88% to 82%). Despite this dip in general awareness, a record four of ten report that they are keeping their tires properly inflated to help reduce air pollution in the Tucson (up from 34%). What is the direct impact of this action taken to keep tires properly inflated? There are an estimated 670,667 working vehicles (automobiles, vans and trucks of one-ton capacity or less for household use) in Pima County (source: 2017 American Community Survey). According to PDEQ, a vehicle will save 144 gallons of gasoline per year with properly inflated tires. If 40% are keeping their tires properly inflated, this yields an annual reduction of 38,630,419 gallons of gasoline not purchased (along with the pollutants this gasoline would release).

-13-
Stormwater Perceptions and Practices Perception of Where Stormwater That Flows Into Tucson Storm Drains Ends Up – Similar to past years, survey respondents were told that “some streets in the Tucson area are equipped with storm drains.” Immediately after, respondents were asked (to the best of their knowledge) where water that flows into these storm drains ends up. Allowing for multiple answers, ranked responses include:
• River or wash (49%, down from 53% in 2018 [the highest mention to-date]. These tend to be Central residents – with no difference based on the perceived severity of the stormwater pollution problem.)
• Groundwater (15%, unchanged since last year. East zip residents and those who perceive that stormwater pollution is not a problem are more likely to think that water that flows into storm drains ends up in the groundwater.)
• Water treatment plants (12%, up slightly from 10% in 2018. Northwest or East residents and respondents who think Tucson has a “moderate” stormwater pollution problem are more likely to believe that stormwater flows into water treatment plants.)
• Sewage plants (11%, down from 16%-17% the past two years. There are few differences based on geography [slightly lower only in the South zips].)
• Canals (7%, unchanged for the last two surveys. Again, these tend to be South region residents.)
Identical to last year, and regardless of stormwater pollution perception, one of four say they do not know where stormwater that flows into a storm drain ends up. Perceived Value of Various Uses for Areas Near a Wash – Survey participants were also informed that “washes carry stormwater, and the areas near them also serve other purposes.” Using a “1-to-9” scale (where “9” means “highly valuable” and “1” means “low or no value”), respondents were asked to rate the perceived value of six different possible uses for these areas. For each use tested, the incidence of value is directly related to the perception of a more severe stormwater pollution problem in the Tucson area. The two uses of areas near a wash with the highest perceived value include:
• Reduces floods (64% “highly valuable” versus 14% “low/no value,” 6.9 average score on the “1-to-9” scale. These are more likely to be Northwest or East residents.)
• Recharging groundwater supplies (60% “highly valuable” versus 14% “low/no value,” 6.7 average score. Northwest residents are more apt to find this use valuable.)

-14-
A slight majority also perceive some degree of value for these two uses of areas near a wash:
• Relief from heat in a shady area (52% “highly valuable” versus 18% “low/no value,” 6.3 average score. Increased perceived value among East residents.)
• Active recreation, like walking or biking (52% “highly valuable” versus 18% “low/no value,” 6.2 average score. East residents are more likely to indicate increased value.)
About four of ten overall indicate value for these two potential wash uses:
• Viewing flowing water (42% “highly valuable” versus 23% “low/no value,” 5.7 average score. There are fewer differences based on geography [slightly lower only in the South].)
• Providing attractive home and business sites (40% “highly valuable” versus 25% “low/no value,” 5.5 average score. East residents indicate the highest level of perceived value for this wash area use.)
Level of Concern Over Various Risks of Areas Near a Wash – After being informed that “the areas near washes also pose risks to the community,” respondents were asked to indicate their degree of concern for six possible risks on another “1-to-9” scale (where “9” means “very concerned” and “1” means “not concerned”). For each item tested, the degree of concern indicated is directly related to the perception of a progressively more severe stormwater pollution problem.
More than four of ten are “very concerned” about these two risks of areas near a wash:
• Is unattractive and hazardous due to trash dumping (44% “very concerned” versus 26% “not concerned,” 5.7 average score on the “1-to-9” scale. Of increased concern in the South zips.)
• Road closures (41% “very concerned” versus 24% “not concerned,” 5.6 average score. East denizens report increased concern.)
Other potential risks evaluated include:
• Flooding (38% “very concerned” versus 28% “not concerned,” 5.3 average score. Lower only in the Central zips.)
• Erosion or bank collapse (37% “very concerned” versus 29% “not concerned,” 5.3 average score. Some increased concern among South or Northwest residents.)
• Creates a safety issue from homeless camps (36% “very concerned” versus 29% “not concerned,” 5.2 average score. These tend to be Central or South residents.)
• Attracts nuisance wildlife, including mosquitoes (35% “very concerned” versus 33% “not concerned,” 5.1 average score. Least concerned are East residents. On the other hand, South residents express some degree of concern.)

-15-
Green Infrastructures Implemented/Installed at Home or Business – Nearly two-thirds (65%) indicate that landscaping with native plants is the most often implemented Green Infrastructure, up from 52%-55% in recent years. These tend to be Northwest residents and those who perceive a “serious” or “moderate” stormwater pollution problem. About three of ten overall report that these three Green Infrastructures have been implemented at home or their place of business:
• Porous pavements or bricks (33%, up from one of four last year and the highest mention to-date. Again, these tend to be Northwest residents and those who perceive a progressively more severe stormwater pollution problem.)
• Connecting runoff from a roof or paved surface to a basin or to water plants (29%, up from 24%-25% in the last two surveys. Northwest or East residents are more likely to have implemented this Green Infrastructure – with few differences between those who perceive a “serious” [33%] or non-existent [28%] stormwater pollution problem.)
• Landscaped depressions that collect stormwater (28%, highly consistent with the last two years [28%-29%]. Landscaped depressions are more common in the East zips and among residents who perceive at least a “moderate” stormwater pollution problem.)
Other Green Infrastructures implemented at home or business include:
• Natural areas protected from clearing and grading (24%, up progressively from 15% in 2016. Implementation is lower only in the Central zip codes [16% versus 27%-31% elsewhere]. This practice is utilized regardless of stormwater pollution problem perception.)
• A trench that is filled with gravel to collect stormwater (21%, up from 18%-19% in the last two surveys. These tend to be East denizens and those who perceive a “serious” stormwater pollution problem.)
• Water harvesting using rain barrels or cisterns (19%, down slightly from last year [22%]. Northwest residents are more apt to utilized rain barrels or cisterns.)
Awareness of the “Clean Water Starts With Me” Campaign – When asked if they were aware of the “Clean Water Starts With Me” campaign, 41% agree, down progressively from 2017 (55%) and 2018 (50%) levels. Awareness is generally consistent regardless of geography (slightly higher in the East zips) and is elevated among women, 36 to 45 year-olds, non-Whites and residents who perceive that Tucson has a “serious” stormwater pollution problem. There is also significantly higher awareness among those familiar with the “Clean Air” Program (64%) than not (26%).

-16-
Perceived Seriousness of Stormwater Pollution Problem in the Tucson Area – Nine of ten indicate that there is at least a “moderate” problem in the Tucson area “with polluting materials entering storm drains.” This is up from 86%-87% in the last two surveys, including incremental and progressive growth in the percentage who perceive a “serious problem” (from 37% in 2015 to 44% now). The remaining 11% think stormwater pollution is “not a problem,” resulting in a 6.0 average score on the “1-to-9” rating scale (up from 5.9 in 2018). More likely to perceive a “serious” stormwater pollution problem are those in the Northwest or East zips – as well as residents who believe there is a progressively more serious air quality problem in the Tucson area. Rating of Various Contributors to Stormwater Pollution Problem – On the same “1-to-9” scale, these six factors (on average) elicit the highest degree of perceived causation of the stormwater pollution problem in the Tucson area (especially among women and residents progressively more concerned about stormwater pollution):
• Automotive fluids such as oil, gasoline and brake fluid (42% “serious” contributor to stormwater pollution, down from 45% last year – 5.7 average score on the “1-to-9” scale [down from 5.9]. These tend to be Northwest residents.)
• Pesticides, fertilizers and debris from lawns and gardens (42% “serious” contributor to stormwater pollution, up from 37% last year – 5.6 average score [unchanged from last year]. There are fewer differences with respect to geography [slightly higher among Northwest residents].)
• Chemicals and materials from construction sites (40% “serious” contributor to stormwater pollution, down from 43% last year – 5.6 average score [down from 5.8]. Northwest residents are more likely to think construction sites are a “serious” contributor to the stormwater pollution problem in Tucson.)
• Household trash and bulky items like mattresses, sofas and tires (39% “serious” contributor to stormwater pollution, down from 42% last year – 5.6 average score [up from 5.5]. Higher perceived causation in the Northwest zip codes.)
• Household products such as cleaning fluids, detergents, paints, degreasers and bleaches (40% “serious” contributor to stormwater pollution, down from 43% last year – 5.5 average score [down from 5.8]. In addition, one of four now think these products are “not a problem” [up from 18%]. On the other hand, South or Northwest residents are more apt to say household products contribute to stormwater pollution.)
• Chemicals and materials from industrial facilities (39% “serious” contributor to stormwater pollution, down from 46% last year – 5.5 average score [down from 5.9]. What’s more, the percentage who think industrial chemicals/materials are “not a problem” has increased from 19% to 25%. Northwest residents are more likely to consider industrial facilities a “serious” stormwater pollution contributor.)

-17-
Compared to recent surveys, fewer indicate that animal waste from household pets contribute to stormwater pollution to some degree (from 66%-67% to 59% now) – with four of ten who now say it is a non-factor (up from 33%-34%). This results in a 4.3 average score (down from 4.7). East zip code residents are more likely to consider animal waste to be a non-contributor to stormwater pollution. In line with past results, significantly more perceive that copper from brake pads made with copper is “not a problem” (42%) than a “serious” contributor (17%) to Tucson’s stormwater pollution problem (4.2 average score, down from 4.3 and 4.5 in the last two surveys). Government Entity to Call If Witness to Someone Dumping Trash or Chemicals in a Storm Drain – Overall, 28% indicate they are unsure who they would contact if they saw someone dumping trash or chemicals in a storm drain. This is down from the all-time low of 22% recorded last year, but still better than found in prior surveys (30%-33%). Those unsure in the 2019 study tend to be Northwest residents (33% versus 25%-28% elsewhere). Up from 29%-31% in past years, 37% now say they would contact 911/Police department to report a storm drain dumping incident. There are few differences with respect to geography, gender or ethnicity. Others indicate they would contact these government-oriented agencies or departments:
• City government (15%, basically unchanged since last year [16%]. Central residents are more likely to say they would contact City government.)
• County government (12%, down slightly from 14% last year. There are few differences based on geography.)
• Water department (11%, down slightly from 13% last year. Lower only in the Northwest zips [7% versus 11%-14% elsewhere].)
• Sanitation department (9%, basically unchanged since last year [10%]. Geographically, only East residents are less likely to indicate contacting this entity [5% versus 8%-10% everywhere else].)
• Health department (8%, basically unchanged since last year [9%]. Central or East residents are more apt to report a dumping incident to the health department.)
Just 2% overall say they would not report dumping of trash or chemicals in a storm drain. This is down from incrementally from 5% in 2017.

-18-
Final Clean Water Program Campaign Observations
Four of ten Pima County residents (41%) surveyed are aware of the “Clean Water Starts With Me” campaign. This represents progressive decline from 2018 (50%) and 2017 (55%) levels. However, as we have found in past surveys, there continues to be significant positive differences between those aware of the “Clean Water Starts With Me” campaign (41%) and those who are not (59%) with respect to key perceptions and actions related to stormwater pollution. As we have found previously, residents familiar with the “Clean Water Starts With Me” campaign remain far more likely to perceive that Tucson has a “serious” stormwater pollution problem (50% versus 39% of those unfamiliar, 28% higher). In terms of resident perceptions of where stormwater that flows into Tucson storm drains end up, there are few differences (again) in the ordinal ranking of survey responses. The largest share (regardless of campaign awareness) continue to think that stormwater flows in a river or wash (49% overall). About half as many say they “don’t know” where stormwater ends up (25%), with few differences between those aware (24%) or unaware (27%) of the “Clean Water Starts With Me” campaign. What about the possible uses for areas near washes and their potential risks to the community? On average, there are few differences based on campaign awareness – although residents familiar with “Clean Water Start With Me” indicate some increased value in using the area near a wash for active recreation, like walking or biking (55% versus 49% among those unfamiliar). As indicated in the displays below, there are key differences related to the perceived factors that contribute to the stormwater pollution problem and the implementation/ installation of Green Infrastructures at home or business.

-19-
“Clean Water Starts With Me” Some key differences: Difference Aware Unaware (41%) (59%) “Serious” Contributors to Stormwater Pollution
Copper from copper brake pads 2019 +85% 24% 13% 2018 +87% 28% 15%
Construction site chemicals/materials 2019 +31% 46% 35% 2018 +29% 49% 38%
Household products 2019 +25% 45% 36% 2018 +23% 48% 39%
Animal waste from household pets 2019 +22% 22% 18% 2018 +48% 31% 21%
Household trash and bulky items 2019 +19% 43% 36% 2018 +30% 48% 37%
Industrial facility chemicals/materials 2019 +17% 42% 36% 2018 +19% 50% 42%
Pesticides/Fertilizers/Lawn & garden debris 2019 +12% 45% 40% 2018 +15% 39% 34%
Automotive fluids 2019 +10% 44% 40% 2018 +9% 47% 43%
���� There is a 28% higher rating/awareness of “serious” contributors to the stormwater pollution problem in the Tucson area among those aware of the “Clean Water Starts With Me” campaign (compared to 32% last year).
-20-
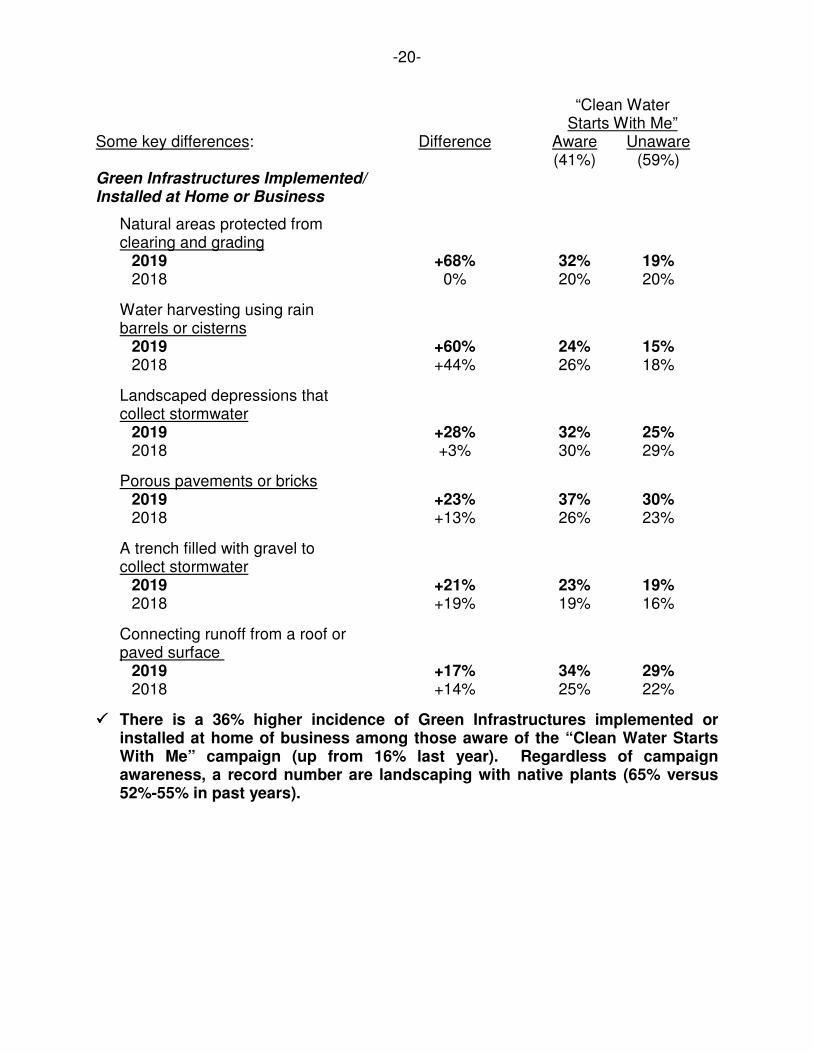
“Clean Water Starts With Me” Some key differences: Difference Aware Unaware (41%) (59%) Green Infrastructures Implemented/ Installed at Home or Business
Natural areas protected from clearing and grading
2019 +68% 32% 19% 2018 0% 20% 20%
Water harvesting using rain barrels or cisterns
2019 +60% 24% 15% 2018 +44% 26% 18%
Landscaped depressions that collect stormwater
2019 +28% 32% 25% 2018 +3% 30% 29%
Porous pavements or bricks 2019 +23% 37% 30% 2018 +13% 26% 23%
A trench filled with gravel to collect stormwater
2019 +21% 23% 19% 2018 +19% 19% 16%
Connecting runoff from a roof or paved surface
2019 +17% 34% 29% 2018 +14% 25% 22%
���� There is a 36% higher incidence of Green Infrastructures implemented or installed at home of business among those aware of the “Clean Water Starts With Me” campaign (up from 16% last year). Regardless of campaign awareness, a record number are landscaping with native plants (65% versus 52%-55% in past years).

-21-
These findings suggest that “Clean Water Starts With Me” campaign awareness does have a positive impact on the perceptions of and willingness to implement Green Infrastructures to reduce the stormwater pollution problem in Tucson. As a result, we suggest targeting those not currently aware of the “Clean Water Starts With Me” campaign for future outreach/education efforts – including Central area residents, men and 46 to 65 year-olds. At the same time, Northwest denizens, 36 to 45 year-olds and the newest Pima County residents (for less than two years) are most likely to say they are “not sure” who they would call to report someone dumping trash or chemicals into a storm drain or wash.