pin asplos tutorial
DESCRIPTION
Pin ASPLOS Tutorial. Kim Hazelwood Vijay Janapa Reddi. About Us. Kim Hazelwood Assistant Professor at University of Virginia Tortola Research Group: HW/SW Collaboration, Virtualization Vijay Janapa Reddi Ph.D. Student at Harvard University VM Optimizations, VM Scalability. Agenda. - PowerPoint PPT PresentationTRANSCRIPT

Pin ASPLOS Tutorial
Kim HazelwoodVijay Janapa Reddi

2 Pin ASPLOS Tutorial 2008
About Us
Kim Hazelwood – Assistant Professor at University of Virginia– Tortola Research Group: HW/SW Collaboration, Virtualization
Vijay Janapa Reddi– Ph.D. Student at Harvard University– VM Optimizations, VM Scalability

3 Pin ASPLOS Tutorial 2008
Agenda
I. Pin Intro and Overview
II. Using Pin in Your Research
III. Hands-On Workshop

Part One: Introduction and Overview
Kim HazelwoodVijay Janapa Reddi

5 Pin ASPLOS Tutorial 2008
What is Instrumentation?
A technique that inserts extra code into a program to collect runtime information
Instrumentation approaches:
• Source instrumentation:
– Instrument source programs
• Binary instrumentation:– Instrument executables directly

6 Pin ASPLOS Tutorial 2008
No need to recompile or relink Discover code at runtime Handle dynamically-generated code Attach to running processes
Why use Dynamic Instrumentation?

7 Pin ASPLOS Tutorial 2008
•Trace Generation
•Branch Predictor and Cache Modeling
•Fault Tolerance Studies
•Emulating Speculation
•Emulating New Instructions
How is Instrumentation used in Computer Architecture Research?

8 Pin ASPLOS Tutorial 2008
How is Instrumentation used in PL/Compiler Research?
Program analysis– Code coverage– Call-graph generation– Memory-leak detection– Instruction profiling
Thread analysis– Thread profiling– Race detection

9 Pin ASPLOS Tutorial 2008
Advantages of Pin Instrumentation
Easy-to-use Instrumentation:• Uses dynamic instrumentation
– Do not need source code, recompilation, post-linking
Programmable Instrumentation:• Provides rich APIs to write in C/C++ your own instrumentation
tools (called Pintools)
Multiplatform:• Supports x86, x86-64, Itanium, Xscale• Supports Linux, Windows, MacOS
Robust:• Instruments real-life applications: Database, web browsers, …• Instruments multithreaded applications• Supports signals
Efficient:• Applies compiler optimizations on instrumentation code

10 Pin ASPLOS Tutorial 2008
Other Advantages
• Robust and stable – Pin can run itself!– Several active developers– Nightly testing of 25000 binaries on 15 platforms– Large user base in academia and industry – Active mailing list (Pinheads)
• 20,000 downloads

11 Pin ASPLOS Tutorial 2008
Using Pin
Launch and instrument an application $ pin –t pintool –- application
Instrumentation engine (provided in the kit)
Instrumentation tool
(write your own, or use one provided in the kit)
Attach to and instrument an application $ pin –t pintool –pid 1234
12 Pin ASPLOS Tutorial 2008
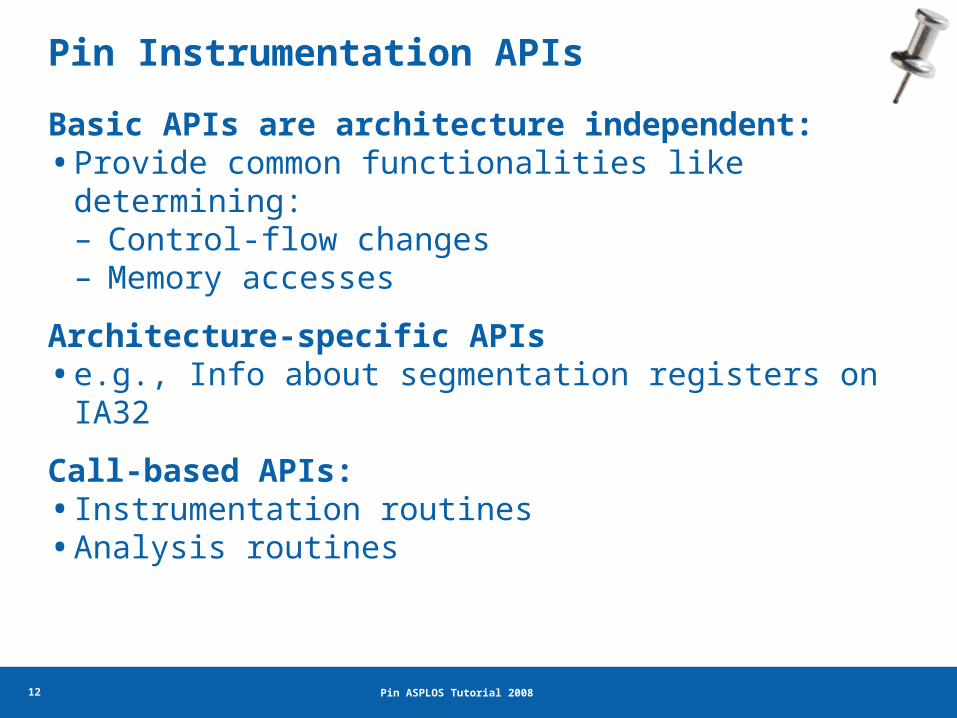
Pin Instrumentation APIs
Basic APIs are architecture independent:• Provide common functionalities like determining:
– Control-flow changes– Memory accesses
Architecture-specific APIs• e.g., Info about segmentation registers on IA32
Call-based APIs:• Instrumentation routines• Analysis routines

13 Pin ASPLOS Tutorial 2008
Instrumentation vs. Analysis
Concepts borrowed from the ATOM tool:
Instrumentation routines define where instrumentation is inserted• e.g., before instruction Occurs first time an instruction is executed
Analysis routines define what to do when instrumentation is activated• e.g., increment counter Occurs every time an instruction is executed

14 Pin ASPLOS Tutorial 2008
Pintool 1: Instruction Count
sub $0xff, %edx
cmp %esi, %edx
jle <L1>
mov $0x1, %edi
add $0x10, %eax
counter++;
counter++;
counter++;
counter++;
counter++;
15 Pin ASPLOS Tutorial 2008
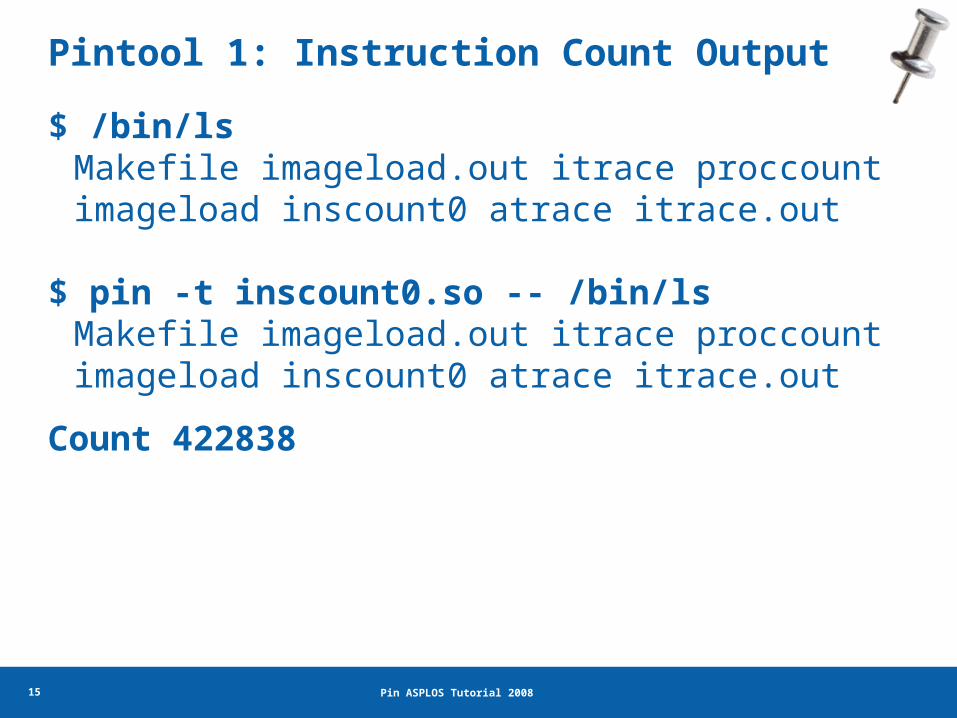
Pintool 1: Instruction Count Output
$ /bin/ls Makefile imageload.out itrace proccount imageload inscount0 atrace itrace.out
$ pin -t inscount0.so -- /bin/ls Makefile imageload.out itrace proccount imageload inscount0 atrace itrace.out
Count 422838

16 Pin ASPLOS Tutorial 2008
ManualExamples/inscount0.cpp
instrumentation routine
analysis routine
#include <iostream>#include "pin.h"
UINT64 icount = 0;
void docount() { icount++; } void Instruction(INS ins, void *v) { INS_InsertCall(ins, IPOINT_BEFORE, (AFUNPTR)docount, IARG_END);}
void Fini(INT32 code, void *v) { std::cerr << "Count " << icount << endl; }
int main(int argc, char * argv[]){ PIN_Init(argc, argv); INS_AddInstrumentFunction(Instruction, 0); PIN_AddFiniFunction(Fini, 0); PIN_StartProgram(); return 0;}

17 Pin ASPLOS Tutorial 2008
Pintool 2: Instruction Trace
sub $0xff, %edx
cmp %esi, %edx
jle <L1>
mov $0x1, %edi
add $0x10, %eax
Print(ip);
Print(ip);
Print(ip);
Print(ip);
Print(ip);
Need to pass ip argument to the analysis routine (printip())

18 Pin ASPLOS Tutorial 2008
Pintool 2: Instruction Trace Output
$ pin -t itrace.so -- /bin/ls Makefile imageload.out itrace proccount imageload inscount0 atrace itrace.out
$ head -4 itrace.out 0x40001e90 0x40001e91 0x40001ee4 0x40001ee5

19 Pin ASPLOS Tutorial 2008
ManualExamples/itrace.cpp
argument to analysis routine
analysis routineinstrumentation routine
#include <stdio.h>#include "pin.H"FILE * trace;void printip(void *ip) { fprintf(trace, "%p\n", ip); }
void Instruction(INS ins, void *v) { INS_InsertCall(ins, IPOINT_BEFORE, (AFUNPTR)printip, IARG_INST_PTR, IARG_END);}void Fini(INT32 code, void *v) { fclose(trace); }int main(int argc, char * argv[]) { trace = fopen("itrace.out", "w"); PIN_Init(argc, argv); INS_AddInstrumentFunction(Instruction, 0);
PIN_AddFiniFunction(Fini, 0); PIN_StartProgram(); return 0;}

20 Pin ASPLOS Tutorial 2008
Examples of Arguments to Analysis Routine
IARG_INST_PTR• Instruction pointer (program counter) value
IARG_UINT32 <value>• An integer value
IARG_REG_VALUE <register name>• Value of the register specified
IARG_BRANCH_TARGET_ADDR• Target address of the branch instrumented
IARG_MEMORY_READ_EA• Effective address of a memory read
And many more … (refer to the Pin manual for details)

21 Pin ASPLOS Tutorial 2008
Instrumentation Points
Instrument points relative to an instruction:
• Before (IPOINT_BEFORE)• After:
– Fall-through edge (IPOINT_AFTER)– Taken edge (IPOINT_TAKEN_BRANCH)
cmp %esi, %edx
jle <L1>
mov $0x1, %edi
<L1>: mov $0x8,%edi
count()
count()
count()

22 Pin ASPLOS Tutorial 2008
• Instruction• Basic block
– A sequence of instructions terminated at a control-flow changing instruction
– Single entry, single exit• Trace
– A sequence of basic blocks terminated at an unconditional control-flow changing instruction
– Single entry, multiple exits
Instrumentation Granularity
sub $0xff, %edxcmp %esi, %edxjle <L1>
mov $0x1, %ediadd $0x10, %eaxjmp <L2>1 Trace, 2 BBs, 6
insts
Instrumentation can be done at three different granularities:

23 Pin ASPLOS Tutorial 2008
Recap of Pintool 1: Instruction Count
sub $0xff, %edx
cmp %esi, %edx
jle <L1>
mov $0x1, %edi
add $0x10, %eax
counter++;counter++;
counter++;
counter++;
counter++;
Straightforward, but the counting can be more efficient

24 Pin ASPLOS Tutorial 2008
Pintool 3: Faster Instruction Count
sub $0xff, %edx
cmp %esi, %edx
jle <L1>
mov $0x1, %edi
add $0x10, %eax
counter += 3
counter += 2basic blocks (bbl)

25 Pin ASPLOS Tutorial 2008
ManualExamples/inscount1.cpp#include <stdio.h>#include "pin.H“UINT64 icount = 0;void docount(INT32 c) { icount += c; }void Trace(TRACE trace, void *v) { for (BBL bbl = TRACE_BblHead(trace); BBL_Valid(bbl); bbl = BBL_Next(bbl)) { BBL_InsertCall(bbl, IPOINT_BEFORE, (AFUNPTR)docount, IARG_UINT32, BBL_NumIns(bbl), IARG_END); }}void Fini(INT32 code, void *v) { fprintf(stderr, "Count %lld\n", icount);}int main(int argc, char * argv[]) { PIN_Init(argc, argv); TRACE_AddInstrumentFunction(Trace, 0); PIN_AddFiniFunction(Fini, 0); PIN_StartProgram(); return 0;}
analysis routineinstrumentation routine

26 Pin ASPLOS Tutorial 2008
Modifying Program Behavior
Pin allows you not only to observe but also change program behavior
Ways to change program behavior:
• Add/delete instructions
• Change register values
• Change memory values
• Change control flow

27 Pin ASPLOS Tutorial 2008
Instrumentation Library
#include <iostream>#include "pin.H"
UINT64 icount = 0;
VOID Fini(INT32 code, VOID *v) { std::cerr << "Count " << icount << endl; }
VOID docount() { icount++; }
VOID Instruction(INS ins, VOID *v) { INS_InsertCall(ins, IPOINT_BEFORE,(AFUNPTR)docount, IARG_END);}
int main(int argc, char * argv[]) { PIN_Init(argc, argv); INS_AddInstrumentFunction(Instruction, 0); PIN_AddFiniFunction(Fini, 0); PIN_StartProgram(); return 0;}
#include <iostream> #include "pin.H" #include "instlib.H"
INSTLIB::ICOUNT icount;
VOID Fini(INT32 code, VOID *v) { cout << "Count" << icount.Count() << endl; }
int main(int argc, char * argv[]) { PIN_Init(argc, argv); PIN_AddFiniFunction(Fini, 0); icount.Activate(); PIN_StartProgram(); return 0; }
Instruction counting Pin Tool

28 Pin ASPLOS Tutorial 2008
Useful InstLib abstractions
• ICOUNT– # of instructions executed
• FILTER– Instrument specific routines or libraries only
• ALARM– Execution count timer for address, routines, etc.
• FOLLOW_CHILD– Inject Pin into new process created by parent process
• TIME_WARP– Preserves RDTSC behavior across executions
• CONTROL– Limit instrumentation address ranges
29 Pin ASPLOS Tutorial 2008
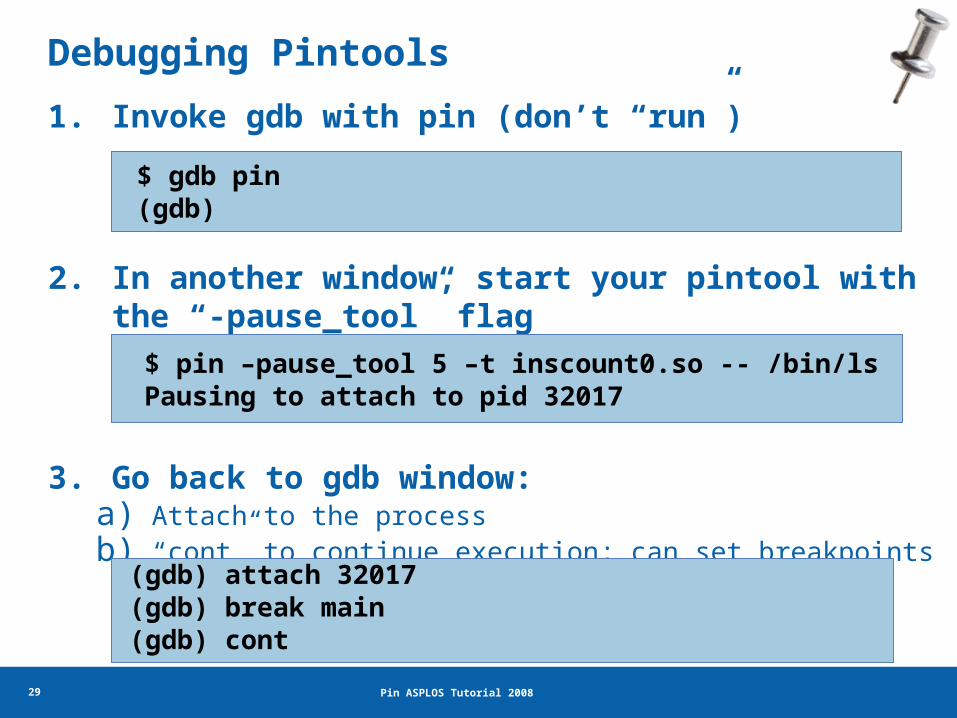
1. Invoke gdb with pin (don’t “run”)
2. In another window, start your pintool with the “-pause_tool” flag
3. Go back to gdb window:a) Attach to the processb) “cont” to continue execution; can set breakpoints as
usual (gdb) attach 32017(gdb) break main(gdb) cont
$ pin –pause_tool 5 –t inscount0.so -- /bin/lsPausing to attach to pid 32017
$ gdb pin(gdb)
Debugging Pintools

Pin Internals
31 Pin ASPLOS Tutorial 2008
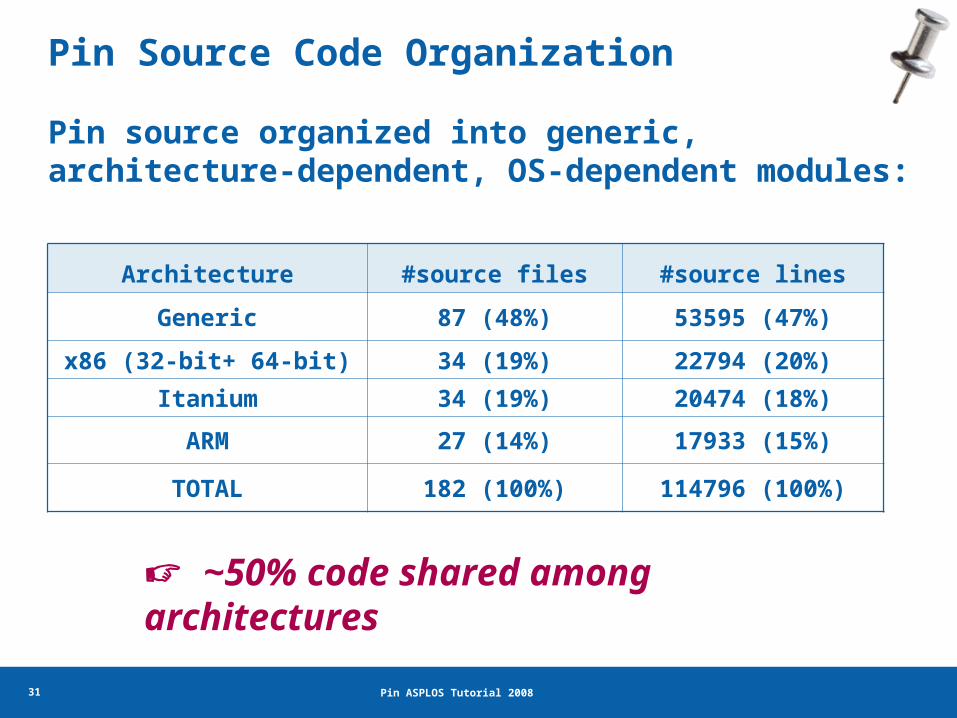
Pin Source Code Organization
Pin source organized into generic, architecture-dependent, OS-dependent modules:
Architecture #source files #source lines
Generic 87 (48%) 53595 (47%)
x86 (32-bit+ 64-bit) 34 (19%) 22794 (20%)
Itanium 34 (19%) 20474 (18%)
ARM 27 (14%) 17933 (15%)
TOTAL 182 (100%) 114796 (100%)
~50% code shared among architectures

32 Pin ASPLOS Tutorial 2008
Pin’s Software Architecture
JIT Compiler
Emulation Unit
Virtual Machine (VM)
Code
Cache
Instrumentation APIs
Ap
pli
cati
on
Operating SystemHardware
PinPintool
Address space

33 Pin ASPLOS Tutorial 2008
Dynamic Instrumentation
Original codeCode cache
Pin fetches trace starting block 1 and start instrumentation
7’
2’
1’
Pin
2 3
1
7
45
6
Exits point back to Pin

34 Pin ASPLOS Tutorial 2008
Dynamic Instrumentation
Original codeCode cache
Pin transfers control intocode cache (block 1)
2 3
1
7
45
67’
2’
1’
Pin

35 Pin ASPLOS Tutorial 2008
Dynamic Instrumentation
Original codeCode cache
7’
2’
1’
PinPin fetches and instrument a new trace
6’
5’
3’trace linking
2 3
1
7
45
6

36 Pin ASPLOS Tutorial 2008
Implementation Challenges
• Linking– Straightforward for direct branches– Tricky for indirects, invalidations
• Re-allocating registers
• Maintaining transparency
• Self-modifying code
• Supporting MT applications…

37 Pin ASPLOS Tutorial 2008
Thread-safe accesses Pin, Pintool, and App– Pin: One thread in the VM at a time– Pintool: Locks, ThreadID, event notification– App: Thread-local spill area
Providing pthreads functions to instrumentation tools
Pin’s Multithreading Support
Pintool
Application
System’s libpthread signal handlersignal handler
set up signal
handlers
Pin’s mini-libpthread
Redirect all other pthreads function calls to application’s libpthread

Optimizing Pintools

39 Pin ASPLOS Tutorial 2008
Total Overhead = Pin Overhead + Pintool Overhead
•Pin team’s job is to minimize this
• ~5% for SPECfp and ~20% for SPECint
• Pintool writers can help minimize this!
Reducing Instrumentation Overhead

40 Pin ASPLOS Tutorial 2008
Pin Overhead
SPEC Integer 2006
100%
120%
140%
160%
180%
200%
perlb
ench
sjen
g
xala
ncbm
k
gobm
k
gcc
h264
ref
omne
tpp
bzip
2
libqu
antu
m mcf
asta
r
hmm
er
Rel
ativ
e to
Nat
ive

41 Pin ASPLOS Tutorial 2008
Adding User Instrumentation
100%
200%
300%
400%
500%
600%
700%
800%
perlb
ench
sjen
g
xala
ncbm
k
gobm
k
gcc
h264
ref
omne
tpp
bzip
2
libqu
antu
m mcf
asta
r
hmm
er
Rel
ativ
e to
Nat
ive Pin
Pin+icount

42 Pin ASPLOS Tutorial 2008
Instrumentation Routines Overhead
Pintool’s Overhead
Frequency of calling an Analysis Routine
Work required for transiting to Analysis
Routine
Reducing the Pintool’s Overhead
Analysis Routines Overhead
+
Work required in the Analysis
Routine
x
Work done inside Analysis Routine

43 Pin ASPLOS Tutorial 2008
Key: Instrument at the largest granularity whenever possible
Trace > Basic Block > Instruction
Analysis Routines: Reduce Call Frequency
44 Pin ASPLOS Tutorial 2008
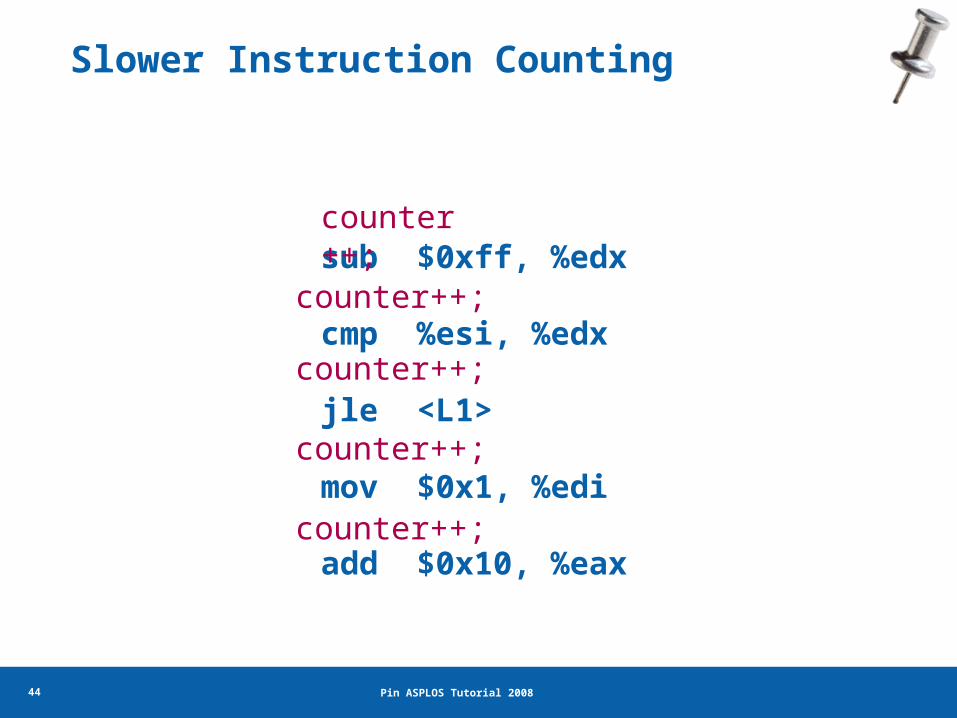
Slower Instruction Counting
sub $0xff, %edx
cmp %esi, %edx
jle <L1>
mov $0x1, %edi
add $0x10, %eax
counter++;counter++;
counter++;
counter++;
counter++;

45 Pin ASPLOS Tutorial 2008
Faster Instruction Counting
sub $0xff, %edx
cmp %esi, %edx
jle <L1>
mov $0x1, %edi
add $0x10, %eax
counter += 3
counter += 2
Counting at BBL level
sub $0xff, %edx
cmp %esi, %edx
jle <L1>
mov $0x1, %edi
add $0x10, %eax
counter += 5
Counting at Trace level
counter-=2
L1

46 Pin ASPLOS Tutorial 2008
Reducing Work in Analysis Routines
Key: Shift computation from analysis routines to instrumentation routines whenever possible

47 Pin ASPLOS Tutorial 2008
Edge Counting: a Slower Version
...void docount2(ADDRINT src, ADDRINT dst, INT32 taken){ COUNTER *pedg = Lookup(src, dst); pedg->count += taken;}void Instruction(INS ins, void *v) { if (INS_IsBranchOrCall(ins)) {
INS_InsertCall(ins, IPOINT_BEFORE, (AFUNPTR)docount2, IARG_INST_PTR, IARG_BRANCH_TARGET_ADDR,IARG_BRANCH_TAKEN, IARG_END);
}}...

48 Pin ASPLOS Tutorial 2008
Edge Counting: a Faster Version
void docount(COUNTER* pedge, INT32 taken) { pedg->count += taken;}void docount2(ADDRINT src, ADDRINT dst, INT32 taken) { COUNTER *pedg = Lookup(src, dst); pedg->count += taken;}void Instruction(INS ins, void *v) { if (INS_IsDirectBranchOrCall(ins)) {
COUNTER *pedg = Lookup(INS_Address(ins), INS_DirectBranchOrCallTargetAddress(ins));
INS_InsertCall(ins, IPOINT_BEFORE, (AFUNPTR) docount, IARG_ADDRINT, pedg, IARG_BRANCH_TAKEN, IARG_END);
} elseINS_InsertCall(ins, IPOINT_BEFORE, (AFUNPTR) docount2,
IARG_INST_PTR, IARG_BRANCH_TARGET_ADDR,IARG_BRANCH_TAKEN, IARG_END);
}…

49 Pin ASPLOS Tutorial 2008
Reducing Work for Analysis Transitions
Key: Help Pin’s optimizations apply to your analysis routines:
– Inlining– Scheduling

50 Pin ASPLOS Tutorial 2008
Inlining
int docount0(int i) {
x[i]++
return x[i];
}
Inlinable int docount1(int i) {
if (i == 1000)
x[i]++;
return x[i];
}
Not-inlinable
int docount2(int i) {
x[i]++;
printf(“%d”, i);
return x[i];
}
Not-inlinable void docount3() {
for(i=0;i<100;i++)
x[i]++;
}
Not-inlinable

51 Pin ASPLOS Tutorial 2008
Conditional Inlining
Inline a common scenario where the analysis routine has a single “if-then”• The “If” part is always executed
• The “then” part is rarely executed
Pintool writer breaks such an analysis routine into two:• INS_InsertIfCall (ins, …, (AFUNPTR)doif, …)
• INS_InsertThenCall (ins, …, (AFUNPTR)dothen, …)

52 Pin ASPLOS Tutorial 2008
IP-Sampling (a Slower Version)
VOID Instruction(INS ins, VOID *v) { INS_InsertCall(ins, IPOINT_BEFORE, (AFUNPTR)IpSample,
IARG_INST_PTR, IARG_END); }
VOID IpSample(VOID* ip) { --icount; if (icount == 0) {
fprintf(trace, “%p\n”, ip); icount = N + rand()%M; //icount is between <N, N+M> }}
const INT32 N = 10000; const INT32 M = 5000;
INT32 icount = N;

53 Pin ASPLOS Tutorial 2008
IP-Sampling (a Faster Version)
VOID Instruction(INS ins, VOID *v) { // CountDown() is always called before an inst is executed INS_InsertIfCall(ins, IPOINT_BEFORE, (AFUNPTR)CountDown,
IARG_END);
// PrintIp() is called only if the last call to CountDown() // returns a non-zero value INS_InsertThenCall(ins, IPOINT_BEFORE, (AFUNPTR)PrintIp,
IARG_INST_PTR, IARG_END); }
INT32 CountDown() { --icount; return (icount==0);}VOID PrintIp(VOID *ip) { fprintf(trace, “%p\n”, ip); icount = N + rand()%M; //icount is between <N, N+M> }
inlined
not inlined

54 Pin ASPLOS Tutorial 2008
Instrumentation Scheduling
If an instrumentation can be inserted anywhere in a basic block:
• Let Pin know via IPOINT_ANYWHERE
• Pin will find the best point to insert the instrumentation to minimize register spilling

55 Pin ASPLOS Tutorial 2008
ManualExamples/inscount1.cpp#include <stdio.h>#include "pin.H“UINT64 icount = 0;void docount(INT32 c) { icount += c; }void Trace(TRACE trace, void *v) { for (BBL bbl = TRACE_BblHead(trace); BBL_Valid(bbl); bbl = BBL_Next(bbl)) { BBL_InsertCall(bbl,IPOINT_ANYWHERE,(AFUNPTR)docount, IARG_UINT32, BBL_NumIns(bbl), IARG_END); }}void Fini(INT32 code, void *v) { fprintf(stderr, "Count %lld\n", icount);}int main(int argc, char * argv[]) { PIN_Init(argc, argv); TRACE_AddInstrumentFunction(Trace, 0); PIN_AddFiniFunction(Fini, 0); PIN_StartProgram(); return 0;}
analysis routineinstrumentation routine

56 Pin ASPLOS Tutorial 2008
Conclusions
A dynamic instrumentation system for building your own program analysis tools
Runs on multiple platforms:
• IA-32, Intel64, Itanium, and XScale
• Linux, Windows, MacOS
Works on real-life applications
Efficient instrumentation (especially with your help!)

Part Two: Using Pin in Your
Research
Kim Hazelwood
Vijay Janapa Reddi

58 Pin ASPLOS Tutorial 2008
Pin Applications
Sample tools in the Pin distribution:• Cache simulators, branch predictors, address
tracer, syscall tracer, edge profiler, stride profiler
Some tools developed and used inside Intel:• Opcodemix (analyze code generated by compilers)• PinPoints (find representative regions in programs
to simulate)• A tool for detecting memory bugs
Companies are writing their own Pintools
Universities use Pin in teaching and research

59 Pin ASPLOS Tutorial 2008
Tools for Program Analysis
Debugtrace – debugging/program understanding aid, can see general call traces, instruction traces, includes reads and writes of registers and memory
Malloctrace – traces of execution of specific functions
Insmix – statistics/characterization
Statica – static analysis of binaries

60 Pin ASPLOS Tutorial 2008
Compiler Bug Detection
Opcodemix uncovered a compiler bug for crafty
Instruction Type
Compiler A Count
Compiler B Count
Delta
*total 712M 618M -94M
XORL 94M 94M 0M
TESTQ 94M 94M 0M
RET 94M 94M 0M
PUSHQ 94M 0M -94M
POPQ 94M 0M -94M
JE 94M 0M -94M
LEAQ 37M 37M 0M
JNZ 37M 131M 94M

61 Pin ASPLOS Tutorial 2008
Thread Checker Basics
Detect common parallel programming bugs:• Data races, deadlocks, thread stalls, threading API
usage violations
Instrumentation used:• Memory operations• Synchronization operations (via function
replacement)• Call stack
Pin-based prototype• Runs on Linux, x86 and x86_64• A Pintool ~2500 C++ lines

62 Pin ASPLOS Tutorial 2008
Thread Checker Results
24
34
2
7 6
17
0
5
10
15
20
25
30
35
40
ammp apsi art equake fma3d mgrid
Nu
mb
er
of
Err
or
Gro
up
s
Potential errors in SPECOMP01 reported by Thread Checker
(4 threads were used)

63 Pin ASPLOS Tutorial 2008
a documented data race in the art benchmark is detected

64 Pin ASPLOS Tutorial 2008
Fast exploratory studies• Instrumentation ~= native execution• Simulation speeds at MIPS
Characterize complex applications• E.g. Oracle, Java, parallel data-mining apps
Simple to build instrumentation tools• Tools can feed simulation models in real time• Tools can gather instruction traces for later use
Instrumentation-Driven Simulation

65 Pin ASPLOS Tutorial 2008
Performance Models
Branch Predictor Models:• PC of conditional instructions• Direction Predictor: Taken/not-taken information• Target Predictor: PC of target instruction if taken
Cache Models:• Thread ID (if multi-threaded workload)• Memory address• Size of memory operation• Type of memory operation (Read/Write)
Simple Timing Models:• Latency information

66 Pin ASPLOS Tutorial 2008
Branch Predictor Model
BP Model
BPSimPin Tool
Pin
Instrumentation Routines Analysis RoutinesInstrumentation Tool
API()
Branch instr infoAPI data
BPSim Pin Tool• Instruments all branches• Uses API to set up call backs to analysis routines
Branch Predictor Model:• Detailed branch predictor simulator

67 Pin ASPLOS Tutorial 2008
BranchPredictor myBPU;
VOID ProcessBranch(ADDRINT PC, ADDRINT targetPC, bool BrTaken) { BP_Info pred = myBPU.GetPrediction( PC ); if( pred.Taken != BrTaken ) { // Direction Mispredicted } if( pred.predTarget != targetPC ) { // Target Mispredicted } myBPU.Update( PC, BrTaken, targetPC);}
VOID Instruction(INS ins, VOID *v) { if( INS_IsDirectBranchOrCall(ins) || INS_HasFallThrough(ins) ) INS_InsertCall(ins, IPOINT_BEFORE, (AFUNPTR) ProcessBranch, ADDRINT, INS_Address(ins), IARG_UINT32, INS_DirectBranchOrCallTargetAddress(ins), IARG_BRANCH_TAKEN, IARG_END);}
int main() { PIN_Init(); INS_AddInstrumentationFunction(Instruction, 0); PIN_StartProgram();}
INST
RU
ME
NT
BP ImplementationA
NA
LY
SIS
MA
IN

68 Pin ASPLOS Tutorial 2008
Branch prediction accuracies range from 0-100%
Branches are hard to predict in some phases• Can simulate these regions alone by fast forwarding to
them in real time
Bimodal In McFarling Predictor McFarling Predictor
Branch Predictor Performance - GCC

69 Pin ASPLOS Tutorial 2008
Performance Model Inputs
Branch Predictor Models:• PC of conditional instructions• Direction Predictor: Taken/not-taken information• Target Predictor: PC of target instruction if taken
Cache Models:• Thread ID (if multi-threaded workload)• Memory address• Size of memory operation• Type of memory operation (Read/Write)
Simple Timing Models:• Latency information

70 Pin ASPLOS Tutorial 2008
CacheModel
CachePin Tool
Pin
Instrumentation Routines Analysis RoutinesInstrumentation Tool
API()
Mem Addr infoAPI data
Cache Pin Tool• Instruments all instructions that reference memory• Use API to set up call backs to analysis routines
Cache Model:• Detailed cache simulator
Cache Simulators

71 Pin ASPLOS Tutorial 2008
CACHE_t CacheHierarchy[MAX_NUM_THREADS][MAX_NUM_LEVELS];
VOID MemRef(int tid, ADDRINT addrStart, int size, int type) { for(addr=addrStart; addr<(addrStart+size); addr+=LINE_SIZE) LookupHierarchy( tid, FIRST_LEVEL_CACHE, addr, type);}VOID LookupHierarchy(int tid, int level, ADDRINT addr, int accessType){ result = cacheHier[tid][cacheLevel]->Lookup(addr, accessType ); if( result == CACHE_MISS ) { if( level == LAST_LEVEL_CACHE ) return; LookupHierarchy(tid, level+1, addr, accessType); }}VOID Instruction(INS ins, VOID *v) { if( INS_IsMemoryRead(ins) ) INS_InsertCall(ins, IPOINT_BEFORE, (AFUNPTR) MemRef, IARG_THREAD_ID, IARG_MEMORYREAD_EA, IARG_MEMORYREAD_SIZE, IARG_UINT32, ACCESS_TYPE_LOAD, IARG_END); if( INS_IsMemoryWrite(ins) ) INS_InsertCall(ins, IPOINT_BEFORE, (AFUNPTR) MemRef, IARG_THREAD_ID, IARG_MEMORYWRITE_EA, IARG_MEMORYWRITE_SIZE, IARG_UINT32, ACCESS_TYPE_STORE, IARG_END);}int main() { PIN_Init(); INS_AddInstrumentationFunction(Instruction, 0); PIN_StartProgram();}
INST
RU
ME
NT
Cache ImplementationA
NA
LY
SIS
MA
IN

72 Pin ASPLOS Tutorial 2008
Performance Models
Branch Predictor Models:• PC of conditional instructions• Direction Predictor: Taken/not-taken information• Target Predictor: PC of target instruction if taken
Cache Models:• Thread ID (if multi-threaded workload)• Memory address• Size of memory operation• Type of memory operation (Read/Write)
Simple Timing Models:• Latency information

73 Pin ASPLOS Tutorial 2008
Simple Timing Model
= instruction count; = # branch mispredicts ; Al = # accesses to cache level l ; = # last level cache (LLC)
misses
Assume 1-stage pipeline• Ti cycles for instruction execution
Assume branch misprediction penalty• Tb cycles penalty for branch misprediction
Assume cache access & miss penalty• Tl cycles for demand reference to cache level l
• Tm cycles for demand reference to memory
Total cycles = Ti + Tb + AlTl + Tm
LLC
l = 1
74 Pin ASPLOS Tutorial 2008
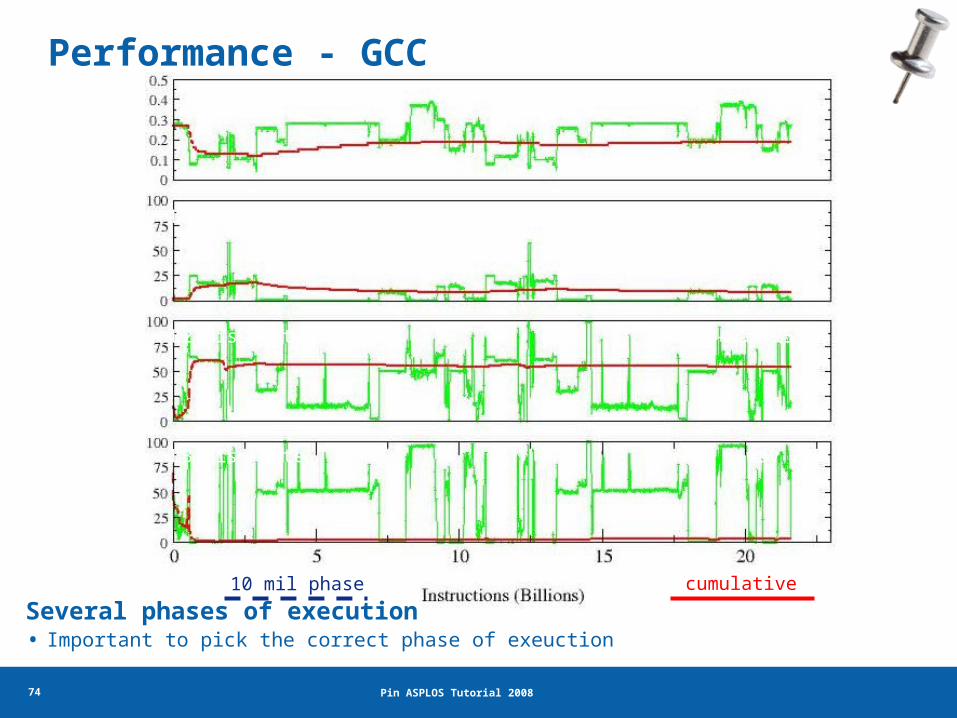
cumulative10 mil phase
IPC
L1 Miss Rate
L2 Miss Rate
L3 Miss Rate
2-way 32KB
4-way 256KB
8-way 2MB
Several phases of execution• Important to pick the correct phase of exeuction
Performance - GCC
75 Pin ASPLOS Tutorial 2008
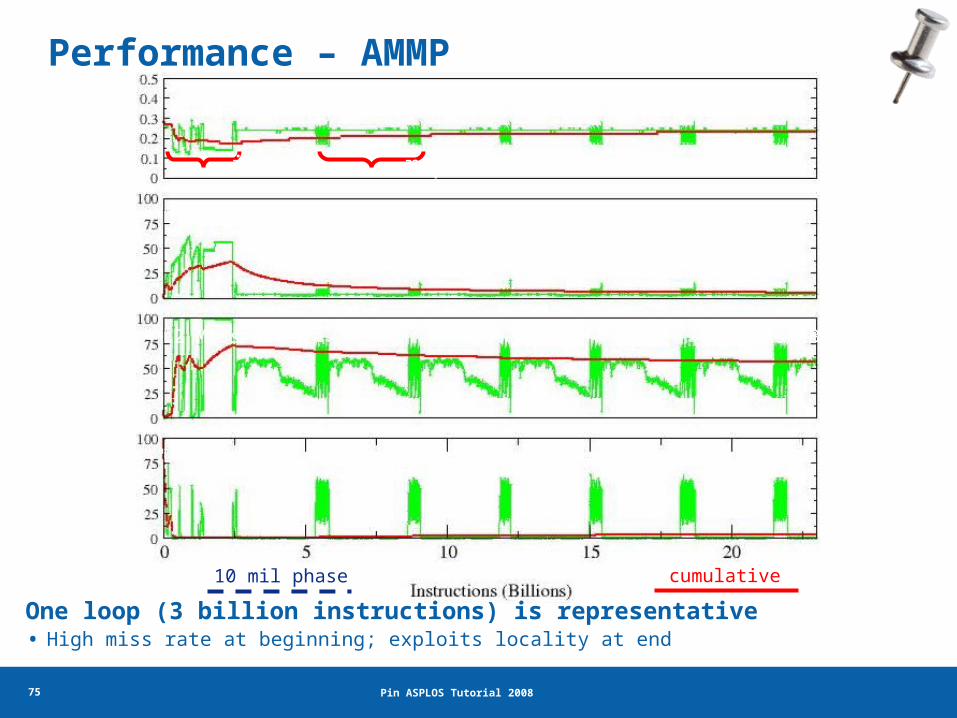
IPC
L1 Miss Rate
L2 Miss Rate
L3 Miss Rate
cumulative10 mil phase
2-way 32KB
4-way 256KB
8-way 2MB
init repetitive
One loop (3 billion instructions) is representative• High miss rate at beginning; exploits locality at end
Performance – AMMP
76 Pin ASPLOS Tutorial 2008
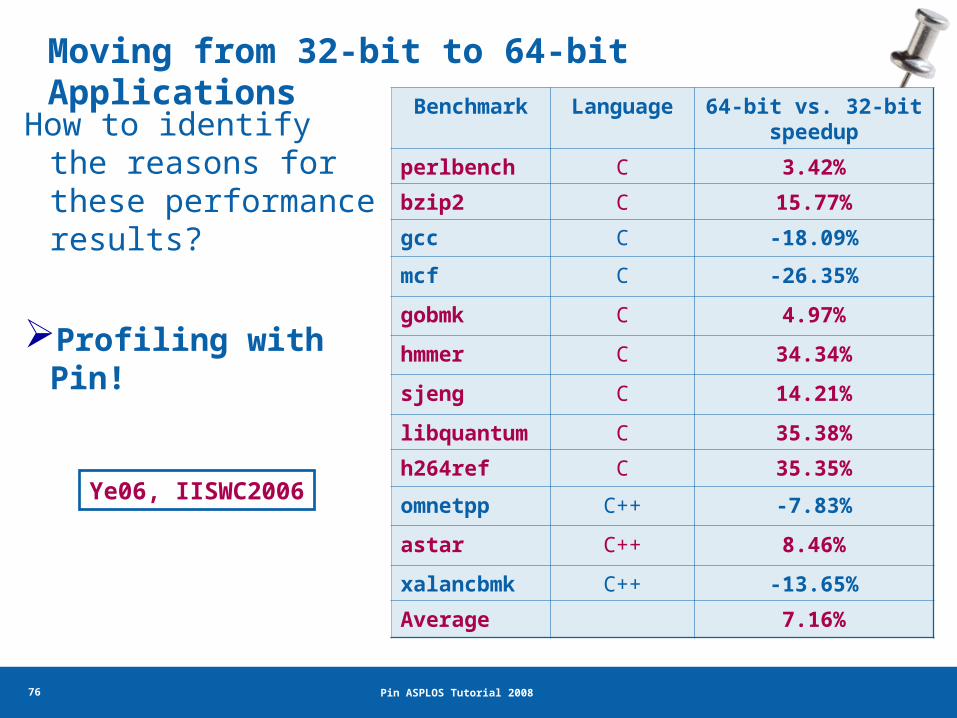
Moving from 32-bit to 64-bit Applications
How to identify the reasons for these performance results?
Profiling with Pin!
Benchmark Language 64-bit vs. 32-bit speedup
perlbench C 3.42%
bzip2 C 15.77%
gcc C -18.09%
mcf C -26.35%
gobmk C 4.97%
hmmer C 34.34%
sjeng C 14.21%
libquantum C 35.38%
h264ref C 35.35%
omnetpp C++ -7.83%
astar C++ 8.46%
xalancbmk C++ -13.65%
Average 7.16%
Ye06, IISWC2006

77 Pin ASPLOS Tutorial 2008
Main Observations
In 64-bit mode:
• Code size increases (10%)
• Dynamic instruction count decreases
• Code density increases
• L1 icache request rate increases
• L1 dcache request rate decreases significantly
• Data cache miss rate increases

78 Pin ASPLOS Tutorial 2008
• Simple compared to detailed models • Can easily run complex applications• Provides insight on workload behavior over their
entire runs in a reasonable amount of time
Illustrated the use of Pin for:• Program Analysis
– Bug detection, thread analysis• Computer architecture
– Branch predictors, cache simulators, timing models, architecture width
• Architecture changes– Moving from 32-bit to 64-bit
Instrumentation-Based Simulation

Pin-based Projects in Academia
Kim HazelwoodVijay Janapa Reddi

80 Pin ASPLOS Tutorial 2008
Detecting Zero-Day Attacks
Problem• Freshly authored malicious code can go undetected by
even the most up-to-date virus scanners
Approach• Using Pin to develop information flow tracking systems
targeting zero-day attacks
Who• David Kaeli @ Northeastern University• Basis for a new start-up company

81 Pin ASPLOS Tutorial 2008
Dytan: A Taint Analysis Framework
• Problem Dynamic taint analysis is defined an adhoc-manner,
which limits extendibility, experimentation & adaptability
• Approach Define and develop a general framework that is
customizable and performs data- and control-flow tainting
• Who J. Clause, W. Li, A. Orso @ Georgia Institute of Technology Int'l. Symposium on Software Testing and Analysis ‘07
82 Pin ASPLOS Tutorial 2008
Security Characterization
Problem• SPAM costs us money and time• Anti-virus software is a resource hog
Approach• Using Pin to characterize SPAM and Anti-virus workloads
Who• David Kaeli @ Northeastern University• Resulted in joint projects with VMWare and Network Engines

83 Pin ASPLOS Tutorial 2008
Workload Characterization
• Problem
Extracting important trends from programs with
large data sets is challenging
• Approach
Collect hardware-independent characteristics across program execution and apply them to statistical data analysis and machine learning techniques to find trends
• Who K. Hoste and L. Eeckhout @ Ghent University

84 Pin ASPLOS Tutorial 2008
Loop-Centric Profiling
• Problem Identifying parallelism is difficult
• Approach Provide a hierarchical view of how much time is spent in
loops, and the loops nested within them using
(1) instrumentation and (2) light-weight sampling to
automatically identify opportunities of parallelism
• Who T. Moseley, D. Connors, D. Grunwald, R. Peri @
University of Colorado, Boulder and Intel Corporation Int'l. Conference on Computing Frontiers (CF) ‘07

85 Pin ASPLOS Tutorial 2008
Supporting Field Failure Debugging
• Problem In-house software quality is challenging, which results
in field failures that are difficult to replicate and resolve
• Approach Improve in-house debugging of field failures by
(1) Recording & Replaying executions
(2) Generating minimized executions for faster debugging
• Who J. Clause and A. Orso @ Georgia Institute of Technology ACM SIGSOFT Int'l. Conference on Software Engineering ‘07

86 Pin ASPLOS Tutorial 2008
Pin-Based Fault Tolerance Analysis
Problem • Simulate the occurrence of transient faults and analyze their
impact on applications• Construction of run-time system capable of providing
software-centric fault tolerance service
Approach• Easy to model errors and the generation of faults and their
impact• Relatively fast (5-10 minutes per fault injection)• Provides full program analysis
Who• Dan Connors, Alex Shye, Joe Blomstedt, Harshad Sane, Alpesh
Vaghasia, Tipp Moseley @ University of Colorado

Exploratory Extensions
Kim HazelwoodVijay Janapa Reddi

88 Pin ASPLOS Tutorial 2008
Common Use of Pin
Trace-drivenFramework
InstructionInformation
Pin Pin Tool

89 Pin ASPLOS Tutorial 2008
Driving Execution using Pin
Execution-drivenFramework
InstructionInformation
Pin Pin Tool
Programcontrol

90 Pin ASPLOS Tutorial 2008
Session Objectives
• Building and Running Pin Tools
• Understanding program execution using Pin
• Putting it all together: Transactional Memory
Machine State
Memory
Program Instruction Stream

91 Pin ASPLOS Tutorial 2008
Structure of a Pin Tool
FILE * trace;
VOID RecordMemWrite(VOID * ip, VOID * va, UINT32 size) { fprintf(trace,"%p: W %p %d\n", ip, va, size); } VOID Instruction(INS ins, VOID *v) { if (INS_IsMemoryWrite(ins)) { INS_InsertCall(ins, IPOINT_BEFORE, AFUNPTR(RecordMemWrite),
IARG_INST_PTR, IARG_MEMORYWRITE_VA,
IARG_MEMORYWRITE_SIZE, IARG_END); }}
int main(int argc, char *argv[]) { PIN_Init(argc, argv); trace = fopen("atrace.out", "w"); INS_AddInstrumentFunction(Instruction, 0); PIN_StartProgram(); return 0; }
Callback Registration
Analysis
Instrumentation
Pin Tool traces Virtual Addresses

92 Pin ASPLOS Tutorial 2008
Architectural State Interposition
• Observe instruction operands and their values– IARG_BRANCH_TAKEN, IARG_REG_VALUE, IARG_CONTEXT, …
• Modify register values
• Save and restore state
• Instruction emulation
Machine

93 Pin ASPLOS Tutorial 2008
Modify Architectural State
• Alter register values via instrumentation – IARG_REG_REFERENCE <register>– PIN_REGISTER *
/* ============= Instrumentation routine ============= */if (INS_IsRDTSC(ins)){ INS_InsertCall(ins, IPOINT_AFTER, (AFUNPTR) DeterministicRDTSC, IARG_REG_REFERENCE, REG_EDX,
IARG_REG_REFERENCE, REG_EAX, IARG_END);}
/* ================ Analysis routine ================ */VOID DeterministicRDTSC(ADDRINT *pEDX, ADDRINT *pEAX) { static UINT64 _edx_eax = 0; _edx_eax += 1;
*pEDX = (_edx_eax & 0xffffffff00000000ULL) >> 32; *pEAX = _edx_eax & 0x00000000ffffffffULL;}
RDTSC-dependentcode execution
rdtsc
Machine
94 Pin ASPLOS Tutorial 2008
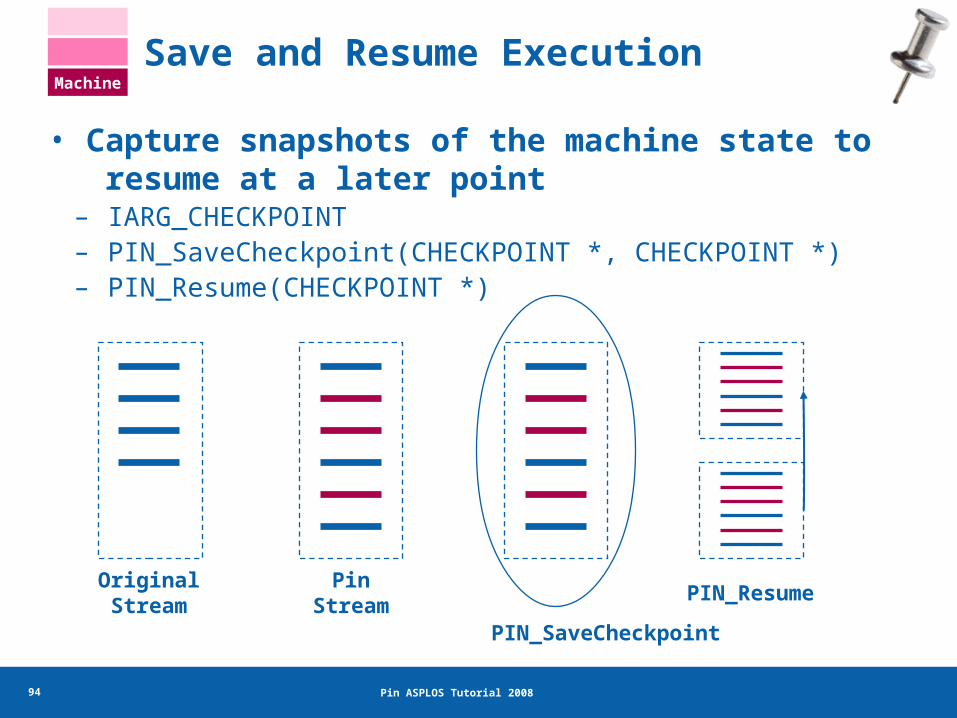
Save and Resume Execution
• Capture snapshots of the machine state to resume at a later point
– IARG_CHECKPOINT– PIN_SaveCheckpoint(CHECKPOINT *, CHECKPOINT *)– PIN_Resume(CHECKPOINT *)
OriginalStream
PinStream
PIN_SaveCheckpoint
PIN_Resume
Machine

95 Pin ASPLOS Tutorial 2008
• IARG_CHECKPOINT– Pin generates a snapshot (includes instrumented state)
• PIN_SaveCheckpoint (CHECKPOINT *src, CHECKPOINT *dst)
– Extract and copy state from handle(src) to local buffer(dst)
/* ========== Instrumentation routine ========== */INS_InsertCall(ins, IPOINT_BEFORE, (AFUNPTR) Save, IARG_CHECKPOINT, IARG_END);
/* ============= Analysis routine ============= */CHECKPOINT ckpt;
VOID Save(CHECKPOINT* _ckpt){ PIN_SaveCheckpoint(_ckpt, &ckpt);}
PinStream
Save()
Save and Resume Execution (2)Machine

96 Pin ASPLOS Tutorial 2008
• PIN_Resume(CHECKPOINT *)– Restore processor state to saved checkpoint– Continue execution
/* =========== Instrumentation routine =========== */INS_InsertCall(ins, IPOINT_BEFORE, (AFUNPTR) Back, IARG_END);
/* ============== Analysis routine ============== */CHECKPOINT ckpt;
VOID Back(){ PIN_Resume(&ckpt);
assert(false); /* PIN_Resume does not return! */}
PinStream
Back()
Save and Resume Execution (3)
Save()
Machine

97 Pin ASPLOS Tutorial 2008
Instruction Emulation
• Emulate the semantics of (new) instructions (1) Locate emu instruction (2) Marshall semantics
(3) Substitute emu function (4) Delete emu instruction
Emu()
…INS_InsertCall(ins, IPOINT_BEFORE, (AFUNPTR) Emu, IARG_LIST, arglist, /* Pass enough information to IARG_END); emulate the ins semantics */
INS_Delete(ins); /* Kill the instruction */…
Machine

98 Pin ASPLOS Tutorial 2008
#include "pin.H"#include "pin_isa.H“
ADDRINT DoLoad(REG reg, ADDRINT * addr) { return *addr;}
VOID EmulateLoad(INS ins, VOID* v) { if (INS_Opcode(ins) == XEDICLASS_MOV && INS_IsMemoryRead(ins) && INS_OperandIsReg(ins, 0) && INS_OperandIsMemory(ins, 1)) { INS_InsertCall(ins, IPOINT_BEFORE, (AFUNPTR) DoLoad, IARG_UINT32, REG(INS_OperandReg(ins, 0)),
IARG_MEMORYREAD_EA, IARG_RETURN_REGS, INS_OperandReg(ins, 0), IARG_END);
INS_Delete(ins); }}
void main(int argc, char * argv[]) { PIN_Init(argc, argv); INS_AddInstrumentFunction(EmulateLoad, 0); PIN_StartProgram();}
/* Emulate load type */op0 <- *op1
Emulating a Load InstructionMachine

99 Pin ASPLOS Tutorial 2008
Memory Behavior
• Memory access tracing– IARG_MEMORYREAD_EA, IARG_MEMORYWRITE_EA, …
• Modify program memory– Pin Tool resides in the process’ address space
Address Space
Operating System
Hardware
Ap
plicati
on
Pin Tool
Compiler
Cod
e C
ach
eAPI
⇒ Change memory directly ( *addr = 0x123 )
Pin
Memory
100 Pin ASPLOS Tutorial 2008
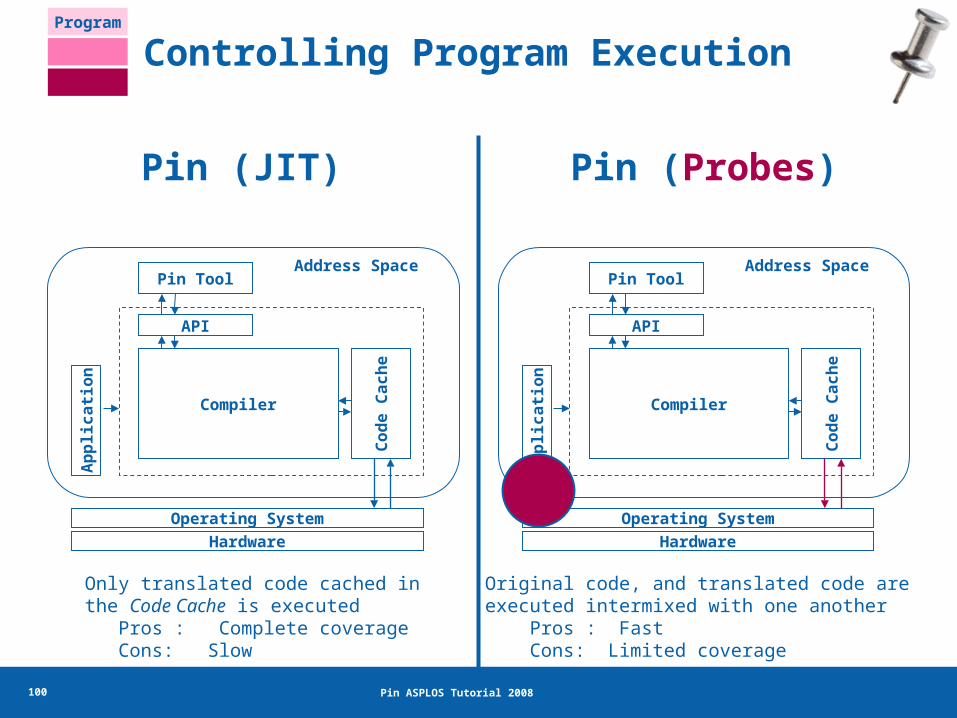
Controlling Program Execution
Address Space
Operating SystemHardware
Ap
plicati
on
Pin Tool
Cod
e C
ach
e
API
Compiler
Address Space
Operating SystemHardware
Ap
plicati
on
Pin Tool
Cod
e C
ach
e
API
Compiler
Only translated code cached in the Code Cache is executed Pros : Complete coverage Cons: Slow
Original code, and translated code are executed intermixed with one another Pros : Fast Cons: Limited coverage
Pin (JIT) Pin (Probes)
Program

101 Pin ASPLOS Tutorial 2008
Executing @ Arbitrary Locations
• JIT-mode (execute only translated code)
– IARG_CONTEXT– PIN_ExecuteAt (CONTEXT *)
ContextPin
Stream
PIN_ExecuteAt
Program

102 Pin ASPLOS Tutorial 2008
Executing @ Arbitrary Locations (2)
• IARG_CONTEXT– Pin generates program’s perception of machine state
• Pin_ExecuteAt (CONTEXT *)
– Continue executing at context state
OriginalStream
Foo:
Bar:
/* ========== Instrumentation routine ========== */if (INS_Address(ins) == 0x40000000 /* Foo: */) INS_InsertCall(ins, IPOINT_BEFORE, (AFUNPTR) Jmp2Bar,
IARG_CONTEXT, IARG_END);
/* ============= Analysis routine ============= */VOID Jmp2Bar(CONTEXT *ctxt){ PIN_SetContextReg(ctxt, REG_INST_PTR, Bar); PIN_ExecuteAt(ctxt);
assert(false); /* PIN_ExecuteAt does not return! */}
Program

103 Pin ASPLOS Tutorial 2008
Changing Program Code (Probe-mode)
• PIN_ReplaceProbed (RTN, AFUNPTR)
– Redirect control flow to new functions in the Pin Tool
• PIN_ReplaceSignatureProbed (RTN, AFUNPTR, …)
– (1) Redirect control flow (2) Rewrite function prototypes(3) Use Pin arguments (IARG’s)
OriginalStream
foo foo’
foo()
(Original) (Replacement)
Program

104 Pin ASPLOS Tutorial 2008
typedef VOID * (*FUNCPTR_MALLOC)(size_t);
VOID * MyMalloc(FUNCPTR_MALLOC orgMalloc, UINT32 size, ADDRINT returnIp) { FUNCPTR_MALLOC poolMalloc = LookupMallocPool(returnIp, size);
return (poolMalloc) ? poolMalloc(size) : orgMalloc(size);}
VOID ImageLoad(IMG img, VOID *v) { RTN mallocRTN = RTN_FindByName(img, "malloc");
if (RTN_Valid(rtn)) {
PROTO prototype = PROTO_Allocate(PIN_PARG(void *), CALLINGSTD_CDECL, "malloc", PIN_PARG(int), PIN_PARG_END());
RTN_ReplaceSignatureProbed(mallocRTN, (AFUNPTR) MyMalloc, IARG_PROTOTYPE, prototype, /* Function prototype */ IARG_ORIG_FUNCPTR, /* Handle to application’s malloc */ IARG_FUNCARG_ENTRYPOINT_VALUE, 0, /* First argument to malloc */ IARG_RETURN_IP, /* IP of caller */ IARG_END); PROTO_Free( proto_malloc ); }}
Replacing malloc() in Application Program

105 Pin ASPLOS Tutorial 2008
• Instrument only specific regions of the source
#include <stdio.h>#include "pinapp.h"
int a[10];int main(){ void * th = PIN_NewThread();
printf("Thread handle %p\n", th); PIN_ExecuteInstrumented(th);
for (int i = 0; i < 10; i++) { a[i] = i; }
PIN_ExecuteUninstrumented(); return 0;}
Pin
PinTool
Source-level ProbingProgram

106 Pin ASPLOS Tutorial 2008
Putting It All Together: TMM
Transactional
Memory Model
– Checkpoint architectural and memory state
– Log memory valuesmodified by transaction
– Verify conflicts across parallel transactions
– Commit or Abort active transaction
Begin Transaction
Finish Transaction
Access Memory
No
Log
Yes
Ab
ort
Conflict?

107 Pin ASPLOS Tutorial 2008
Conflict?
Transactional Memory Model (1)
Finish Transaction
Access Memory
No
Log
Yes
Ab
ort
/* === Instrumentation routine === */
if (RTN_Address(rtn) == XBEGIN) { RTN_InsertCall(rtn, IPOINT_BEFORE, AFUNPTR(BeginTransaction), IARG_THREAD_ID, IARG_CHEKCPOINT, IARG_END);}
/* ====== Analysis routine ====== */
CHECKPOINT chkpt[NTHREADS];
void BeginTransaction(int tid, CHECKPOINT *_chkpt) { PIN_SaveCheckpoint(_chkpt,
chkpt[tid];}
Begin Transaction

108 Pin ASPLOS Tutorial 2008
Conflict?
Transactional Memory Model (2)
Finish Transaction
No
Log
Yes
Ab
ort Begin Transaction
/* ===== Instrumentation routine ===== */
void Instruction(INS ins, void *v) { if (INS_IsMemoryWrite(ins)) INS_InsertCall(ins, IPOINT_BEFORE, (AFUNPTR) LogAndCheck, IARG_BOOL, true, IARG_THREAD_ID, IARG_MEMORYWRITE_EA, IARG_MEMORYWRITE_SIZE, IARG_END);
if (INS_IsMemoryRead(ins) INS_InsertCall(ins, IPOINT_BEFORE, (AFUNPTR) LogAndCheck, IARG BOOL, false, IARG_THREAD_ID, IARG_MEMORYREAD_EA, IARG_MEMORYREAD_SIZE, IARG_END);}
Access Memory

109 Pin ASPLOS Tutorial 2008
Access Memory
Transactional Memory Model (3)
Finish Transaction
No
Log
Yes
Ab
ort Begin Transaction /* ======== Analysis routine ======== */
void LogAndCheck(BOOL iswrite, ADDRINT tid, ADDRINT addr, ADDRINT len) { if ( /* in transaction */ ) { if ( /* is conflict */ ) { /* restore mem with log[tid] */ PIN_Resume(&chkpt[th]); } else { /* record access in log[tid] */ } }}
Conflict?

110 Pin ASPLOS Tutorial 2008
Conflict?
Transactional Memory Model (4)
Access Memory
No
Log
Yes
Ab
ort Begin Transaction
Finish Transaction
/* === Instrumentation routine === */
if (RTN_Address(rtn) == XEND) { RTN_InsertCall(rtn, IPOINT_BEFORE, AFUNPTR(CommitTransaction), IARG_THREAD_ID, IARG_END);}
/* ====== Analysis routine ====== */
void CommitTransaction(ADDRINT th) { /* * free thread’s checkpoint * and memory access log */}

111 Pin ASPLOS Tutorial 2008
Demo of Transactional Memory
Conflict?
Access Memory
No
Log
Yes
Ab
ort
Begin Transaction
Finish Transaction
T1
T2
XBEGIN(); for (uint32_t i = 0; i < MAX; i++) { myarray[i] = 1; } XEND();
XBEGIN(); for (int32_t i = MAX-1; i >= 0; i++) { myarray[i] = 2; } XEND();
T1
T2
Multi-threaded Application Transactional Memory Pin Tool

112 Pin ASPLOS Tutorial 2008
Pin (user-level) PinOS (system-level)
App
Operating System
Hardware
Pin
Operating System
Hardware
Pin Pin the OS!
App
…
App App …
PinOS: A Programmable Framework for Whole-System Dynamic Instrumentation. Prashanth P. Bungale, C. K. Luk. Proceedings of Virtual Execution Environments (VEE 2007)
Pin
Pin Pin

113 Pin ASPLOS Tutorial 2008
Trace Physical and Virtual Addresses
FILE * trace;
VOID RecordMemWrite(VOID * ip, VOID * va, VOID * pa, UINT32 size) { Host_fprintf(trace,"%p: W %p %p %d\n", ip, va, pa, size); } VOID Instruction(INS ins, VOID *v) { if (INS_IsMemoryWrite(ins)) { INS_InsertCall(ins, IPOINT_BEFORE, AFUNPTR(RecordMemWrite),
IARG_INST_PTR, IARG_MEMORYWRITE_VA,
IARG_MEMORYWRITE_PA, IARG_MEMORYWRITE_SIZE, IARG_END); }}
int main(int argc, char *argv[]) { PIN_Init(argc, argv); trace = Host_fopen("atrace.out", "w"); INS_AddInstrumentFunction(Instruction, 0); PIN_StartProgram(); return 0; } PinOS requires
minimal API changes

114 Pin ASPLOS Tutorial 2008
Concluding Remarks
• Dynamic instrumentation framework (Free!)– Transparent across platforms and environments
• Platforms: IA32, Intel64, Itanium, and Xscale• Operating Systems: Linux, Windows, MacOS
• Sample tools (use as templates) – Cache simulators, branch predictors, memory checkers,
instruction and memory tracing, profiling, sampling …
• Write your own tools!
http://rogue.colorado.edu/pin