pinch technology/ process optimization - infohouseinfohouse.p2ric.org/ref/29/28889.pdf · pinch...
TRANSCRIPT

Pinch Technology/ Process Optimization
Volume 7: Case Study - A Wax Extraction Plant
CEC Report CR-105238
Prepared by Linnhoff March, lnc. 9800 Richmond Avenue, Suite 560 Houston, TX 77042 May 1995

REPORT SUMMARY
INTEREST CATEGORIES Industrial Demand-side Planning
KEYWORDS Pinch technology Heat recovery Energy efficiency Heat pumps End use Industry
PINCH TECHNOLOGY/PROCESS OPTIMIZATION Volume 7: Case Study - A Wax Extraction Plant
A wax extraction plant case study demonstrates how process integration or pinch technology can identify practical and cost- effective ways to substantially reduce energy costs. Suggested cost- saving measures include steam and power system improvements, yield improvement, reduction of NOx emissions and optimum heat exchanger network design. Low capital cost projects were identified to improve wax yield by 8%, increase refrigeration capacity by 10% and reduce steam usage by 22%.
BACKGROUND Improved industrial process efficiency is of great importance to electric utilities. It enhances customer competitiveness and profitability, thereby fostering load retention and strategic load growth. By understanding the energy use patterns and options at an industrial site, the utility can work together with its customer to define mutually beneficial investment and operating options. The technique of choice is pinch analysis, an innovative and effective method for analyzing industrial sites. Since 1988, EPRT and member utilities have cosponsored over twenty such studies around the country in various industries, with a high degree of success.
OBJECTIVES To identify opportunities for energy savings using pinch technology; to develop technically and economically viable projects to achieve these targets.
APPROACH Project team was formed consisting of consultants, plant and electric utility representatives. The team visited the plant to define and collect process, utility and economic data. The consultants developed appropriate material, heat and steam balances, and using pinch technology, characterized each refinery's heating and cooling needs. After quantifying the scope of potential

improvements, the site was screened for specific projects based on processing changes, heat recovery and heat pump applications.
RESULTS The study indicates that substantial operating cost savings could be achieved using conventional technologies and investment payback criteria(typical1y two years or less). Projects were identified to reduce energy cost, increase product yield, increase refrigeration capacity and reduce NOx.
EPRI PERSPECTIVE The study shows that process integration or pinch technology is an effective tool to improve industrial energy efficiency. Utilities can use pinch methodology to promote load stability in their service territories. Information on energy use options and interactions and their sensitivity to economic factors can also be used to foster successful demand-side management programs.
EPRI has published additional case studies of pinch technology on a variety of industries. These are documented in reports TR- 101147, Volumes 1 through 5. Other related work is documented in EPRI reports EM-6057, CU-6334, CU-6775, CR105237, and CR105239. An EPRI brochure on pinch technology is numbered BR-102466.
PROJECTS
EPRI Project Manager: K. R. Amarnath Customer Systems Division Contractor: Linnhoff March, Inc
RP3879-4
For further information on EPRI research programs, call EPRI Technical Information Specialists (415) 855-241 1.

1 .\r
PINCH TECHNOLOGY/PROCESS OPTIMIZATION
Volume 7: Case Study - A Wax Extraction Plant
Final Report, November 1994
Prepared by Linnhoff March, Inc. 9800 Richmond Avenue, Suite 560 Houston, TX 77042
Prepared for Electric Power Research Institute 3412 Hillview Avenue Palo Alto, CA 94304

For technical information, contact:
EPRl Chemicals & Petroleum Office 1775 St. James Place, Suite 105
Houston, Texas 77056
Fax: (713) 963-8341 (71 3) 963-9307
For ordering information, contact:
EPRIAMP Customer Assistance Center (ECAC) 1 -800-4320-AMP
Disclaimer of Warranties and Limitation of Liabilities
NEITHER EPRI, ANY MEMBER OF EPRI, ANY COSPONSOR, NOR ANY PERSON OR ORGANIZATION ACTING ON BEHALF OF ANY OF THEM:
(A)MAKES ANY WARRANTY OR REPRESENTATION WHATSOEVER, EXPRESS OR IMPLIED,
(I)WITH RESPECT TO THE USE OF ANY INFORMATION, APPARATUS, METHOD, PROCESS, OR SIMILAR ITEM DISCLOSED IN THIS REPORT, INCLUDING MERCHANTABILITY AND FITNESS FOR A PARTICULAR PURPOSE, OR
(1I)THAT SUCH USE DOES NOT INFRINGE ON OR INTERFERE WITH PRIVATELY OWNED RIGHTS, INCLUDING ANY PARTY'S INTELLECTUAL PROPERTY, OR
(1II)THAT THIS REPORT IS SUITABLE TO ANY PARTICULAR USERS CIRCUMSTANCE; OR
(B)ASSUMES RESPONSIBILITY FOR ANY DAMAGES OR OTHER LIABILITY WHATSOEVER (INCLUDING ANY CONSEQUENTIAL DAMAGES, EVEN IF EPRl OR ANY EPRl REPRESENTATIVE HAS BEEN ADVISED OF THE POSSIBILITY OF SUCH DAMAGES) RESULTING FROM YOUR SELECTION OR USE OF THIS REPORT OR ANY INFORMATION, APPARATUS, METHOD, PROCESS, OR SIMILAR ITEM DISCLOSED IN THIS REPORT.

ABSTRACT
industrial manufacturing facilities in the United States are facing increasing competition in today's global marketplace. In order to protect their industrial manufacturing base, many electric utility revenues have adopted the strategy of providing technical assistance to help selected customers improve their competitive position.
Petrowax Corporation produces high grade waxes for use in a variety of commercial and consumer markets. Petrowax was keen to modernize its facilities in order to reduce operating costs, increase manufacturing flexibility, and to achieve compliance with a NO, abatement order at minimum capital cost.
The present study employed the techniques of Pinch Analysis to identify a comprehensive process improvement strategy that improved wax yield by 8%, debottlenecked refrigeration capacity by I O % , and reduced total steam demand by 22%. Operating margins are projected to improve by over $1 MM/yr. Furthermore, the reduced fuel requirement automatically reduced NO, emissions, enabling compliance with the NO, abatement order without installing expensive end-of-pipe controls.
Past studies undertaken by EPRl in cooperation with member utilities have shown comparable results over a broad range of industries.
... Ill

I

EXECUTIVE SUMMARY
A comprehensive energy study was performed at Petrowax's oil processing facility in Smethport, PA, using process integration techniques based on Pinch Analysis.
Petrowax produces high grade waxes for use in a variety of commercial and consumer products. Waxy crudes and distillates are first fractionated in a vacuum distillation unit (VDU) to separate the oil into several distinct cuts. The VDU bottoms stream is treated with propane in the PDA unit to separate out the asphaltenes (or heavy resin fraction), and the main oil fraction is recovered for further processing. The side cuts from VDU and recovered oil from PDA are then subjected t o solvent extraction using MEK to separate wax from oil. The waxes are purified by bauxite filtration. The residual oils are sold as byproducts to lube oil processors and heating oil dealers, and asphalt is used an-site as fuel.
Plant management had several objectives in mind when commissioning this study:
1.
2.
3.
4.
Improve operating economics - lowe: energy consumption - increased product yield
Debottleneck processing capacity - VDU - MEK refrigeration
Evaluate feasibility of hydrotreating versus bauxite filtration for the wax finishing operation.
Determine the optimum Combined Heat and Power (cogeneration) strategy for this site, paying particular heed to Compliance with rather stringent NOx abatement requirements.
The major findings were as follows:
0 The most economic way to achieve NOx compliance is to shut down two of the four boilers. Firm steam savings of 40,000 Ib/hr are required in order to comfortably operate the plant with the remaining two boilers. The tank
iv
insulation program recommended previously by PCI is a necessary, but not sufficient, part of the required steam savings.
It is possible to reduce the VDU furnace load by 35%, thereby debottlenecking its capacity, through HEN retrofit. As an incidental benefit, the increased heat recovery reduces energy costs by approximately $60 K/yr.
Instead of capturing energy savings, it is possible to translate the reduced VDU furnace heat load into increased throughput or into increased yield. Detailed simulation runs using HYSIM showed that VDU product yield can potentially be increased by about 8% in two alternate ways:
(a) continue to operate the furnace at its current firing rate, and increase reflux ratio proportionately.
(b) lower column operating pressure, and increase steaming rates in the side strippers.
Column hydraulics would have to be checked to make sure that the tower can handle the increased vapor and liquid traffic. HEN retrofit would be an essential pre-condition to yield improvement if the furnace capacity is limiting.
By using wastewater instead of cooling water to absorb VDU waste heat, it is possible to save 10,000 lb/h of steam elsewhere in the plant. Cost savings are $240 K/yr at a payback of less than 1 year.
The MEK refrigeration system capacity can be debottlenecked by about 10%. In addition, steam savings of nearly 20,000 Ib/hr are possible. A key element of the HEN retrofit is an MVR heat pump across the HP flash drum. Although the payback on this project does not meet investment criteria, it is critical to achieving Petrowax's strategic objective of shutting down two of the four existing boilers in order to comply with NOx emission limits.
. The potential for steam savings through heat recovery in the PDA plant is minimal.
. A new hydrotreater to replace the existing bauxite filter system would not be economical, and is not recommended; it would be better to continue with the existing system.
The economics of cogeneration at this site are not good, since the cost of fuel to generate one kwh of power exceeds the sale price of that kwh.
V

f 1
Overall economics for the proposed HEN retrofits are summarized below:
Payback
MEK 4.2
I Tank Insulation I 1.0 I I Total I 2.0 I
The predicted savings represent 22% of total site energy costs. The actual savings will be somewhat higher, if credit is taken for savings in labor, maintenance, etc. from shutting down two boilers.
Accordingly, we suggest that Petrowax pursue a 2-stage revamp strategy.
Staae 1 - VDU HEN Retrofit - VDU yield improvement - Tank insulation
We recommend immediate implementation of these projects because of the outstanding benefits.
Staae 2 - MEK HEN Retrofit
This project requires additional investigation, particularly with respect to funding subsidies that could help reduce the payback. As it stands, the main attraction is that it will enable Petrowax to shut down the two least efficient boilers, thereby reducing NO, emissions by 30-50% without having to install end-of-pipe controls.
vi

I

CONTENTS .
Section Page
1 Executive Summary ................................................................................ iv
1 introduction ......................................................................................... 1-1 Background and Objectives ............................................................................. 1-1 Scope of Work ................................................................................. 1-2
Task I . Data Collection ................................................................ 1-2 Task 2 . Design Basis ................................................................... 1-2 Task 3 . Pinch Analysis ................................................................. 1-3 Task 4 . Project Definition ............................................................. 1-4 Task 5 .. Reports .......................................................................... 1.4
Deliverables .................................................................................... 1-5
2 Study Basis .......................................................................................... 2-1 Process Description .......................................................................... 2-1 CHP System .................................................................................... 2-1 Capital Costs ................................................................................... 2-4
3 Results ................................................................................................ 3-1 Vacuum Distillation ........................................................................... 3-1
Simulation Model and Yield Analysis ............................................... 3-1 Finch Analysis ............................................................................. 3-4
Solvent De-Oiling .............................................................................. 3-9 Propane De-Asphalting .................................................................... 3-20 Wax Finishing ................................................................................ 3-22

CONTENTS
Section Page
Offsites ........................................................................................ 3-23 Combined Heat and Power System .................................................... 3-23
4 Conclusions and Recommendations ........................................................ .4-1
viii
? I
FIGURES .
Figure Page
2.1 2.2 3.1 3.2 3.3 3.4 3.5 3.6 3.7 3.8 3.9 3.1 Oa 3.10b 3 . 1 0 ~
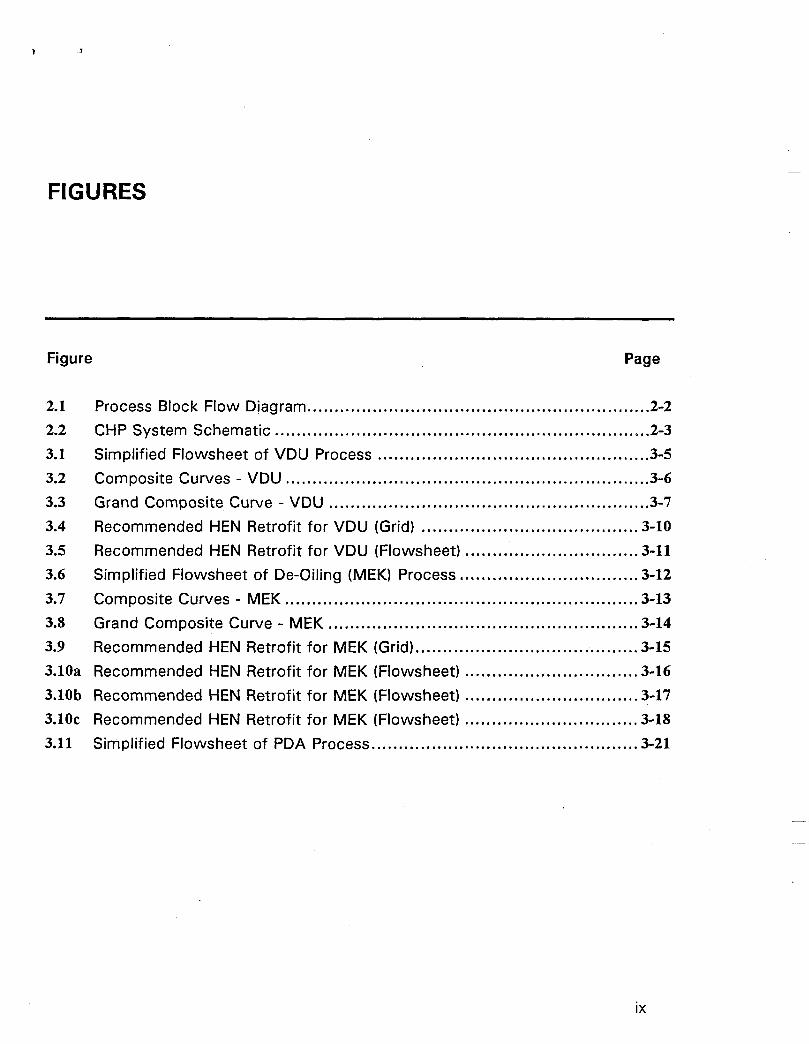
Process Block Flow Diagram ............................................................... 2-2 CHP System Schematic ..................................................................... 2.3 Simplified Flowsheet of VDU Process .................................................. 3-5 Composite Curves . VDU ................................................................... 3-6 Grand Composite Curve - VDU ........................................................... 3-7 Recommended HEN Retrofit for VDU (Grid) ........................................ 3-10 Recommended HEN Retrofit for VDU (Flowsheet) ................................ 3-11 Simplified Flowsheet of De-Oiling (MEK) Process ................................. 3-12 Composite Curves - MEK ................................................................. 3-13 Grand Composite Curve - MEK ......................................................... 3-14 Recommended HEN Retrofit for MEK (Grid) ......................................... 3-15 Recommended HEN Retrofit for MEK (Flowsheet) ................................ 3-16 Recommended HEN Retrofit for MEK (Flowsheet) ................................ 3-17 Recommended HEN Retrofit for MEK (Flowsheet) ................................ 3-18
3.11 Simplified Flowsheet of PDA Process ................................................. 3-21
IX


I I
TABLES
Table Page
3.1 3.2
Summary of VDU Simulation Results ................................................... 3-2 Comparison of Cogeneration Options ................................................. 3-25
X


1 1
LIST OF ABBREVIATIONS
BPD BW Btu CHP cw DT EPRl GCC HEN HMB HP HRSG HVGO
gpm IBP K KW KWH
LPW MEK MM MP(S) MVR MW MWH
Barrels Per Day Boiler Feedwater Makeup British Thermal Units Combined Heat and Power Cooling Water Minimum Approach Temperature in the HEN Electric Power Research Institute, Palo Alto, CA Grand Composite Curve Heat Exchanger Network Heat and Material Balance High Pressure (steam); Horse Power (electricity) Heat Recovery Steam Generator Heavy VGO Gallons per minute (liquid flow) Initial Boiling Point Thousand Kilowatts Kilowatt-hours Low Pressure (Steam) Methyl Ethyl Ketone Million Medium Pressure (Steam) Mechanical Vapor Recompressor Megawatts Megawatt-hours
xi

LIST OF ABBREVIATIONS
NOX PC I PDA PO
R f g SCFD SW TBP VDU VGO
Nitrogen Oxides PCI Engineers Inc, Houston, TX Propane De-Asphalting Press Oil Refrigeration (ammonia) Standard Cubic Feed per Day (gas flow) Slack Wax True Boiling Point Vacuum Distillation Unit Vacuum Gas Oil
xii

I
I INTRODUCTION
As part of its Business Partnership program, Pennsylvania Electric Company (Penelec) sponsored this study to help Petrowax develop a modernization plan for its wax extraction and refining plant in Smethport, PA. The focus of this work was to improve energy efficiency and reduce NOx emissions using the methods of Pinch Analysis. This project was partially funded by EPRI, who also had responsibility for administering and managing this pinch study on behalf of Penelec.
This study was begun in April 1994, and completed in July 1994.
Background and Objectives
Petrowax produces petroleum based wax using crude oils and distillates as raw materials. After wax extraction using MEK solvent, the dewaxed oil is sent to other refineries for further processing.
Petrowax is keen to modernize its production facilities and reduce processing cost per barrel of throughput. The company's first priority is to implement quick payback projects such as insulation of storage tanks, and pick off other such "low hanging fruit". The important considerations are cost and compliance with NOx related regulations. Petrowax is limited on the amount of investment it can make, which will have a major influence on the type of projects that could be considered for implementation. Options include replacing two of the existing boilers with a more efficient gas-fired package boiler as well as third party cogeneration.
Longer term, there are three critical priorities:
a) Improve wax yield by fine tuning VDU operation.
b) Debottleneck MEK unit refrigeration capacity.
c) Replace the bauxite filters with a hydrotreater unit; possibly adapting the existing moth-balled platformer for this purpose.
1-1
\ introduction 1
Consistent with this background, the objectives of the energy study were to determine the optimum steam and power generation strategy for the Smethport site under the following scenario:
Modified process - MEK unit debottlenecked, bauxite filters replaced by hydrotreating, and vacuum distillation unit operated at maximum yield.
Reduction in process steam demand through heat integration (pinch analysis), tank insulation, and possible replacement of steam by electricity in certain applications.
0 Compliance with existing and expected future NOx emissions regulations.
Capital investment limit, as specified by Petrowax.
The study report should be sufficiently comprehensive and detailed for Petrowax to make a sound decision on how to proceed forward with the modernization program.
Scope of Work
Linnhoff March, Inc. was contracted to provide the following services:
A. Task I - Data Collection
Visit the Petrowax plant to develop an understanding of the facilities available on the site and how they can be best utilized for plant modernization. This task included discussing economic and other constraints to be taken into account in the analysis, and defining the data that needed to be collected and/or verified by Petrowax.
B. Task 2 - Design Basis
During this same site visit, LMI was to obtain or develop the following information to be used as the Design Basis:
a. Process flow diagrams for the existing facilities, including proposed process modifications.
b. Develop Heat and Material balance models of both the process and the CHP system using appropriate software tools.
1 -2

, i l I lntroduction
c. Initial estimates of the size and/or overall heat transfer coefficients for each heat exchanger.
d. The relationship between exchanger capital cost and heat transfer area for each type of exchanger.
e. Representative 1 2-month steam/power consumption profile.
f. The marginal cost of site utilities.
C. Task 3 - Pinch Analysis
1. Perform a Pinch Analysis of the VDU and MEK units as follows:
a. Extract the heat load, temperature and heat transfer information, together with heating and cooling costs in the form required for a pinch analysis.
b. Determine the optimum extent of heat integration for the plant using pinch analysis.
c. Construct hot and cold composite curves, and the grand composite curve, for the plant.
d. Evaluate economically optimized heating and cooling duties for the plant, from these, define the potential for energy savings by passive heat integration.
e. Establish targets for steam and fuel consumption in the process.
f. Identify pinch violations in the plant's existing Heat Exchanger Network (HEN). Design a Heat Exchanger Network (HEN) retrofit that satisfies the pinch energy targets.
g. Determine the steam savings possible from optimum tank insulation.
h. Review with Petrowax the proposed optimization concepts and obtain feedback on constraints and operability, layout, or product quality. Revise projects accordingly.
i. Assess the combined heat and power potential at the site based on rates provided by Penelec. For possible combined heat and power applications, indicate the potential capacity
1-3

Introduction
2.
D.
1.
2.
3.
E.
1.
2.
3.
(kW), the potential annual energy production (kWh) and an estimate of the generator installation costs.
1. Assess the impact of proposed projects on NOx emissions.
Submit a draft report summarizing Task 3 activities for review by EPRI, Penelec, and the host site. Interim project reviews shall be held as appropriate to keep all parties appraised of the study's progress.
Task 4 - Project Definition
As a result of performing the pinch analysis and discussing with all of the participants, develop a list of recommendations for capital projects and/or process changes that meet the operating and economic criteria established by the plant.
Identify capital projects including preliminary estimates of equipment sizes, costs, and general process configuration, but short of detailed engineering design.
Prepare a non-proprietary draft report documenting generic conclusions of all the work performed to date.
Task 5 - Reports
Give a detailed presentation of the results of the analysis to plant pers-onnel, EPRI, and Penelec.
Following approval of the draft, non-proprietary (generic) reports by Penelec and EPRI project managers, submit a final report suitable for widespread distribution.
Prepare an "innovator" to publicize the key results from the study.
Petrowax's responsibilities on this project consisted of:
A. Providing flow sheets, diagrams, or other information necessary to carry out the analysis.
B. Measuring or verifying key data to the best of their ability.
1-4

a 4 I introduction
Deliverables
1. Process Heat and Material Balance simulation model (electronic copy only).
2. S t e a d p o w e r system simulation model (electronic copy only).
3. Report.
4. Innovator.
1-5


2 STUDY BASIS
The Smethport plant uses a solvent dewaxing process to produce several grades of wax from heavy crude oil and distillates. The plant operates continuously, 24 hours per day, with an average full-rate onstream time of 8000 hours per year.
Process Description
An overall block flow diagram of the process is shown in Figure 2-1.
Crude oil feedstock is fractionated into four main cuts by vacuum distillation. These are called 127P, 140P, 152P, and 160P. Vacuum tower bottoms go to a propane de-asphalting unit for removal of asphalt, and recovery of the heavy waxy distillate. Dewaxing of the four oil cuts from the VDU and recovered distillate from the PDA unit is accomplished by mixing the oils with MEK, which has a high solubility for oil but low solubility for wax. The wax-solvent-oil solution is chilled to precipitate out the wax, and filtered. MEK solvent is recovered from the oil and the wax, by steam stripping, and reused. The lube oils and waxes are further purified by bauxite filtration, and sold for specialized markets.
Heat and material balance simulation models were developed for both the VDU and MEK plants. Both the VDU and MEK process simulations were done using HYSIM. The simulation models gave reasonably good agreement with measured plant data, and were used as the basis for subsequent pinch analysis and project design.
CHP System
The plant Combined Heat and Power (CHP) system is depicted schematically in Figure 2-2. It consists of 4 steam boilers, all operating at 240 psig:
There are 3 steam headers - 240 psig, 140 psig, and 25 psig. A number of small backpressure steam turbines are used to drive process pumps and
2- 1

Y N
r Dewaxed Oil VGO
I I I . . . Crude LTu 3 Side
Crude Oil Feedstock VDU
Waxes
Vac. Bottoms
+ - Resin Deresined oil
(asphalt)
Figure 2-1 Process Block Flow Diagram
treating (new)

) . . I 1
Study Basis
I
1 BFW
240 Ib IT J.
Desuperheat >
140 Ib
Desuperheat
25 Ib 1-
I
ii V
Flash LOSSES Tank
Direct to Process
Direct to Process
Direct to Process
' Condensate
-= BFW makeup
Figure 2-2 CHP System Schematic
2-3
> r d ,
Study Basis
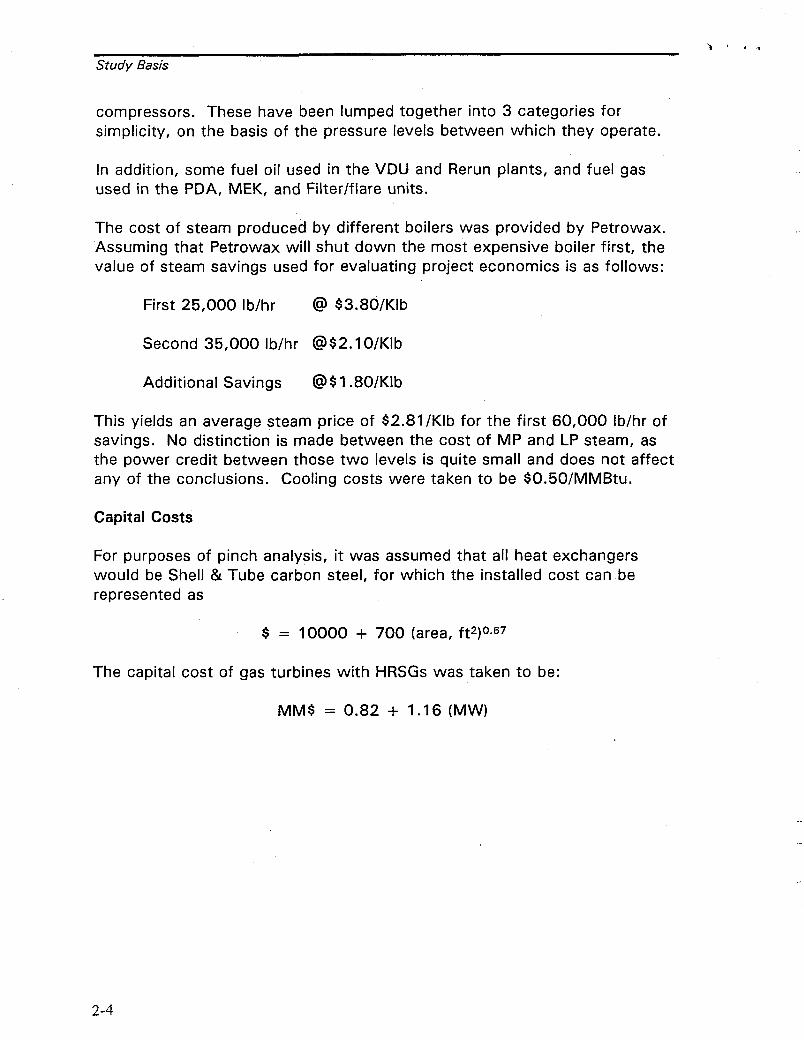
compressors. These have been lumped together into 3 categories for simplicity, on the basis of the pressure levels between which they operate.
In addition, some fuel oil used in the VDU and Rerun plants, and fuel gas used in the PDA, MEK, and Filter/flare units.
The cost of steam produced by different boilers was provided by Petrowax. Assuming that Petrowax will shut down the most expensive boiler first, the value of steam savings used for evaluating project economics is as follows:
First 25,000 Ib/hr @ $3.80/Klb
Second 35,000 Ib/hr QS2.1 O/Klb
Additional Savings @ S I .80/Klb
This yields an average steam price of $2.81/Klb for the first 60,000 Ib/hr of savings. No distinction is made between the cost of MP and LP steam, as the power credit between those two levels is quite small and does not affect any of the conclusions. Cooling costs were taken to be $0.5O/MMBtu.
Capital Costs
For purposes of pinch analysis, it was assumed that all heat exchangers would be Shell & Tube carbon steel, for which the installed cost can be represented as
$ = 10000 + 700 (area, ft2)0-67
The capital cost of gas turbines with HRSGs was taken to be:
MMS = 0.82 + 1.16 (MW)
2-4

3 RESULTS
The plant analysis was broken down into several distinct tasks, which will be described in turn.
Vacuum Distillation Unit
Simulation Model and Yield Analysis
In order to study possibilities for yield improvement, a simulation model was developed using HYSIM. The stream cutkharacterization was performed based on the D1160-ATM profile provided by Petrowax, and the calculated pseudo-component properties were fed into the simulator.
The model was validated by comparing simulation output with several sets of plant data. Very good agreement was obtained with process flow rates and compositions, except that we could not get an exact match on the column temFerature profile.
The results of three significant runs are summarized in Table 3-1.
Case 1: Base case, current operation
Case 2: Increase reflux ratio
Case 3: Reduce column pressure
Case 2 represents the maximum yield increase possible (8.5%) at the given column pressure conditions while maintaining present product quality specifications. This benefit is achieved at the cost of 3.0 MMBtu/h increased heat input to the base of the column. Since this heat must be supplied at a high enough temperature to strip off the desirable fraction, one would have to increase fuel to the furnace. If the additional duty is supplied through the furnace, the outlet temperature will be 910OF. It will be necessary to verify whether this is feasible, both with regard to possible
3-1

1 ' I '
Results
Case 1 (Base)
Table 3-1 Summary of VDU Simulation Results
Case 2 (Increase Reflux &
Stm)
A Heating Duty (MMBtu/h)
127 prod. f low (B/D)
I
A Cooling Duty (MMBtu/h) I 0 1.547 I 0 3.00
25 1 275
140 prod. f low (B/D) 705 61 5 I 152 prod. f low (B/D)
160 prod. f low (B/D)
Total product f low (B/D)
439 529
80 205
1475 1624
I 127 product
1 (5/95%loF I
152 product
(5/95%)OF
1 140 product
(5/95%)"F '
160 product
(5/95 %) O F
7 5 7/8 7 5
844/970
7 7 2/8 73
845/970
I Case 3 (Column
High vac
0.8571 1.161
'J
6291 519 I 210
1620
641 /79 1
77 1 /873
845/970
93 7/ 1 090
~
Note: Feed rate is the same in all cases; product f low rates have been scaled to show relative magnitude only in order to protect confidential client information.
3 -2

thermal cracking, and equipment limitations (eg. tower hydraulics). Case 3 represents an attempt to offset the energy penalty in Case 2 by reducing column operating pressure from 1.34 psia to 0.8 psia (40 MM Hg). In this case, a yield increase of 8 % is possible with an energy (furnace duty) penalty of only 1.22 MMBtu/h. The energy penalty in the jet systems associated with increasing the vacuum was not considered, however.
To summarize, it appears that yield increases of up to 8-9% are indeed possible, but a number of practical issues remain to be investigated and resolved before a firm conclusion can be reached.
The following observations and comments may be useful in this regard:
(a) The TBP curves provided by Petrowax (32OOF at IBP and 66OOF a t 80%) indicate the presence of low molecular weight compounds. This could be due to feed cracking in the furnace. Operation a t higher vacuum will tend to minimize such cracking.
(b) Furnace operation could be improved by adding instrumentation for monitoring tube-skin temperatures, tube flow rate, and pressure drop.
(c) Good temperature and pressure measurements on the draw trays are essential to validating the simulation model and understanding column performance, and should be given priority.
(d) Most lube oil vacuum columns operate at a pressure drop of 20 - 30 mm Hg. The actual AP is considerably higher, indicating possible fouling (coking) or other mechanical pinches in the column, and may account for some of the discrepancies between simulated and measured data.
Finally, it should be noted that the energy intensity of PDA is almost 2 orders of magnitude higher than VDU, when expressed as Ib of steam per bbl of feed. Thus, increasing VDU yield will actually result in steam savings in the PDA plant, as illustrated below (feed flow rate normalized to 1800 BPD to protect confidential information):
3 -3

i ' 1 v
Results
VDU bottoms flow, BPD
Current Proposed VDU feed rate, BPD 1,800 1,800
324 180
I I
VDU product yield, % 82 90
Furnace Heat Duty, MMBtu/h 8.6 11.6
Total Steam Usage, Ib/h
Energy Intensity, MMBtu/bbl
- VDU (steam & fuel)
2,700 2,700
0.1507 0.1907
- PDA (steam) 1.29
I
Total Energy Consumption, MMBtu/h I
1.29
- VDU 11.3 14.3
In short, the energy cost of 3 MMBtu/hr due to increasing VDU yield is more than offset by reduced steam cost in the PDA plant.
- PDA
- Combined
- Savings (avg)
Pinch Analysis
17.4 9.7
28.7 24.0
0 4.7
A simplified version of the existing flowsheet is shown in Figure 3-1. The simulation data for the base case were considered representative of current operations and therefore used as the basis for pinch analysis.
The stream data for pinch analysis are considered confidential by Petrowax, but the composite and grand composite curves are shown in Figures 3-2 and 3-3.
3 -4

p l f )
Results
I--
0 U P T
f
v) v- c
0 0 m m
3-5

i ' I ., Results
E 3 m .I-
I I I I I 0 0 0 0 0 I
W In d 0 0 0 0 0 0 0
cv I
9 '0 cv
9 'Eo F
9 F
9 'd .r
9 '(v
.9 Eo
.9 W
c\l I a J
m u
3 -6

J i ' i
Results
I L
/
\
m a I E m o u 9) M a 3 6
3 -7

The corresponding "stand-alone" utility targets and potential cost savings are:
MMBtu/h Oil LPS cw Air
Existing (base case) 8.60 -0.96 10.03 0.48
Target @ DT=80 5.51 0 7.92 0.48
Savings 3.09 -0.96 2.11 0 (36%) n/a (27%) 0
Utility cost K$/yr
218
160
58
(27%)
As far as energy savings go, the impact on the CHP system is fairly minimal. It can be seen, though, that through proper process integration, the furnace can be debottlenecked by 3 MMBtu/h, which is almost exactly the amount of extra heat required to obtain a yield increase of 8% (per section 3.1 .I).
Design
Savings
The VDU process GCC shows clearly that on a stand-alone basis, a large amount of heat at fairly high temperatures (300-450'F) must be dumped into cooling water. At the same time, there are other processes at the site where steam is being used to supply fairly low level heat. This suggests opportunities for inter-unit heat integration.
5.55 0 0 0 127
3.05 8.37 10.03 0.48 300
The most obvious and convenient use for surplus VDU heat is for wastewater heating, which currently requires 10,000 Ib/hr steam. If this is done, almostthe entire cooling water duty in VDU can be eliminated, and nearly 9000 Ib/hr of LP steam saved. When cross-unit heat integration is employed, the combined savings are significantly greater, as follows:
(35%) I
I MMBtu/h I cost
I I (70%)
I oil I LPS I cw I Air 1 KS/vr
Existing I 8.60 I 8.37 I 10.03 I 0.48 I 427 I I I I I
Note that direct process steam consumption has been excluded from the foregoing cost comparison, as it does not change.
Several retrofit strategies are possible - eg. minimize repiping, maximize operating flexibility, optimize utilization of existing HX surface, etc. The
3 -8

, I ) I
Results
recommended retrofit design is shown in grid diagram format in Figure 3-4, and as a flowsheet schematic in Figure 3-5. It seeks to minimize changes to the existing system, and consists of:
0 repiping 4 interchangers 0 switching 5 coolers from cooling water to wastewater
It should be noted that the recommended retrofit does not involve purchase of any new equipment, just redeployment of existing equipment. Furthermore, four of the existing heat exchangers would be rendered surplus, and become available for use in other services. Capital costs are difficult to estimate, since they will involve mainly piping and controls, but are estimated to be less than $300K, for a I-year payback.
Solvent De-Oiling (MEK)
The MEK unit is the single largest process steam user. As such, it was the principal focus of pinch analysis. A simplified flowsheet of the process is shown in Figure 3-6. The corresponding composite and grand composite curves are shown in Figures 3-7 and 3-8.
This process is characterized by a double pinch - one at about 25OOF and another at about 205OF, which makes for a rather difficult design. The existing heat recovery scheme involves a considerable amount of "cross- pinch" heat transfer, and fails to fully utilize the high grade heat available in the HP flash vapor. In the proposed retrofit, two small but significant process modifications have been incorporated which make the heat recovery task a lot easier:
(a) The LP flash temperature has been reduced in order to shift available heat from LP to HP flash vapors.
(b) A heat pump is proposed for upgrading the temperature of HP flash vapor by 38OF.
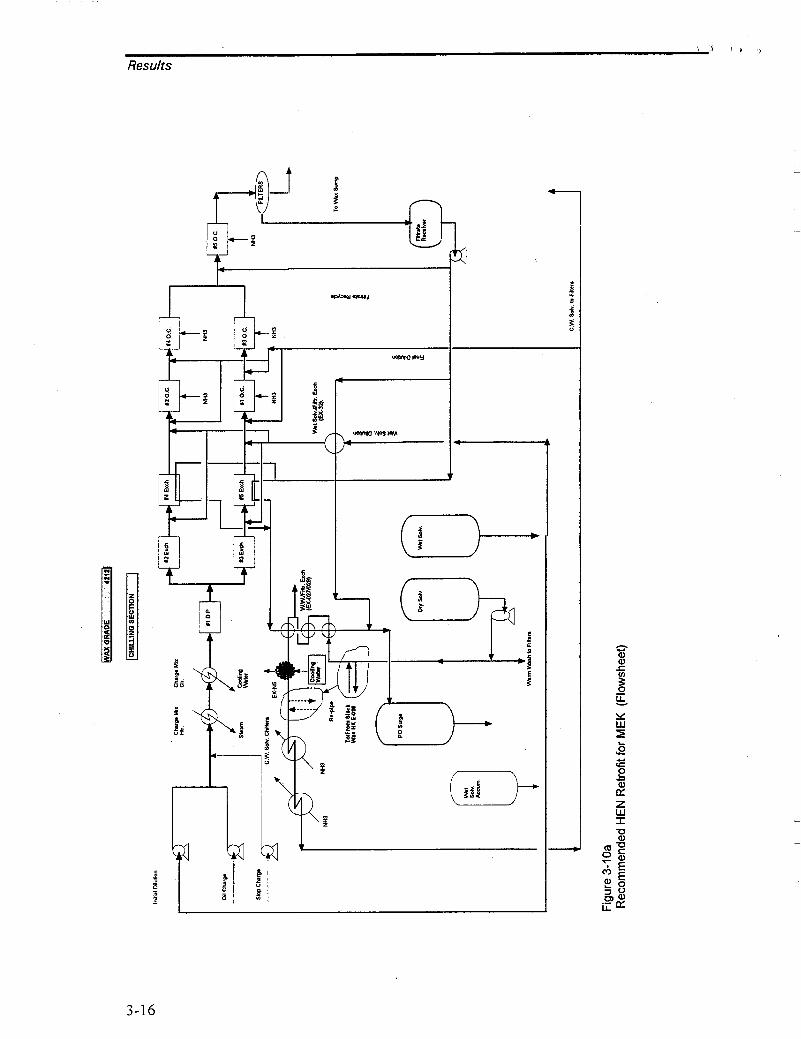
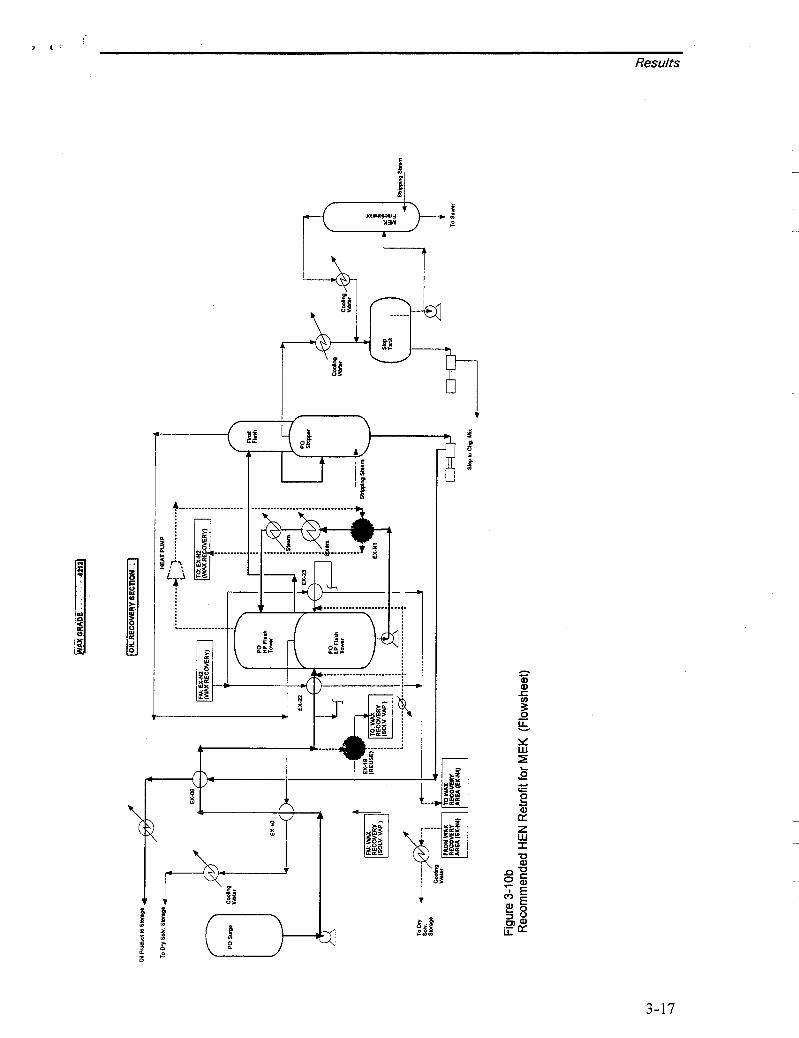
The proposed HEN retrofit is depicted schematically in Figure 3-9 as a grid diagram. The corresponding flowsheet is shown in Figures 3-10a, b and c.
3 -9

I ) I 7
Results
0 0 m
I I I I I I I I I I I I
I I I I
I I I
I
I I ; 0 I I
I 0 I I I
I I
I
I I I I I I I I I I I I
'?I I I I I I I I I I I I
i- - - -
I I
I- -- I
I
I I I I I
I I
I
I
I
I
I I
m m
I I I I
I I I 1
I I
I I I
I I I I
I I
I I
I
I I
I I I I
I I
I
I I I I
' I I I I I I I I I I I I
I I I I I I I I
I I
I I I I
I I
I I
I I
I I
I
I I I I
I I I I I I I I I I I I I I I I I I
I I I 0 1 rrjl I d ; R i I Tu, I------- l
I I
I I I I I I I I
a x I
U I
I I I I I
I I I I I I I I I
I I I I I I I I I 1 1
I
I I L O I I I
h a .rl
8 v
& 0 w
a * a J l a
3-10

, 1 ) x Results
b Y-
3-1 I

w c t 3
Dry Solvent
Tank 4
* LP Flash
196'
d 6 0 Storage
9 I ' HP
Flash I slackwax
sw Stripper
Figure 3-6 Simplified Flowsheet of De-Oiling Process

W I c w
(c) Linnhoff March Petrowax MEK Unit:4212 Major Streams -Existing Network
SUPERTARGET V3.006 SN1020
Composite Curves (Real temperatures) DT=40.00F
Temperature [F]
400-
350-
300-
250-
08,Feb,95 11 :59 File:MEK422 .ST2
I I I I I I I
I I I I I I I
Enthalpy [Btu/hr] 0.00E00 1.00E07 2.00E07 3.00E07 4.00E07 5.00E07 6.00E07 7.00E07 8.0
Figure 3-7 Composite Curves - MEK
07

w I c P
(c) Linnhoff March SUPERTARGET V3.006 SN1020 02,Nov,94 13:32 Petrowax MEK Unit:4212 Major Streams -Existing Network File:MEK422 .ST2
Interval Temperature [F]
Process Utility Grand Composite Curve (Shifted temperatures) DT=40.00F
450-
400-
350-
300-
250-
200-
150-
100-
50-
0- 0.0
I I I I I
HP steam
LP steam
- Cooling water
Refrigeration
5.0dE06 1 .OdE07 1 &E07 2.0dE07 2.5dE07 3 .O Enthalpy [Btulhr]
Figure 3-8 Grand Composite Curve - MEK
07
I

(c) Linnhoff March Petrowax MEK Unit:4212 Heat Pump WARNING: OBJECTS MARKED WITH ** NEED ATTENTION
SUPERTARGET VB3.01 SN1020
Global DTmin = 10.0 [fl
02,Nov.94 17:06 File:MEK42HP1 .ST2
Page 111
73. ’ E32 ‘et Solvent Dilution
ry Solvent Chilling
:ed Mix Chilling
Flash Vapors
P Flash Vapors
il Product
H:1166624.0 37.
E26-
41.
100.
100.
150.
D
4 N2 H:23M:
E6
8.0 100.
170
olvent Vapors
lax Product
14.4
t--
iltrate Heating
.O. Feed
IP Flash Feed
.W. Remelt
‘eboiler Feed
vaporator Feed
:ooling Water
H:4225603.0
Figure 3-9 Recommended HEN Retrofit for MEK (Grid)
% i 0 , Results
3-16
I B t ' '
Results
3-17

2 ' 9 I
Results
J
3-18

~~~
Results
MMBtu/h ' MPS LPS CW Rfg
20.22 3.1 22.8 12.6
4.55 2.35 9.4 11.3
15.7 0.75 13.4 1.3
(77%) (24%) (58%) (10%)
Overall utility cost savings are:
cost KWyr
988
536
452
(45%)
Existing 3.97
Proposed I 3.97 I
I o Savings - actual
Direct process steam consumption for stripping has been excluded from utility steam duties.
The recommended retrofit was developed using a "minimum repipe" philosophy. In other words, existing matches were left intact as much as possible even if they were not optimally placed. New exchangers were added, or existing units redeployed, only when absolutely essential to achieve the desired savings.
The new HEN has the following features:
2 existing exchangers redeployed
5 new exchangers, named N1 through N5 1 shell added to existing unit E-26
All other exchangers left in place, as is, with a minor repipe on E- 26 9
1 new MVR heat pump
It should be noted that alternate schemes of a comparable nature could also have been developed. For example, one could do a bit more heat recovery by spending more capital. One could explore the tradeoffs between piping cost versus new exchangers purchase cost, and so on. The proposed design has considered known site constraints in so far as possible within the time and budget limitations of the study workscope. However, a more rigorous and detailed "project-oriented" analysis is recommended prior to proceeding with implementation.
3-19
/ J 1 7 ,
Results
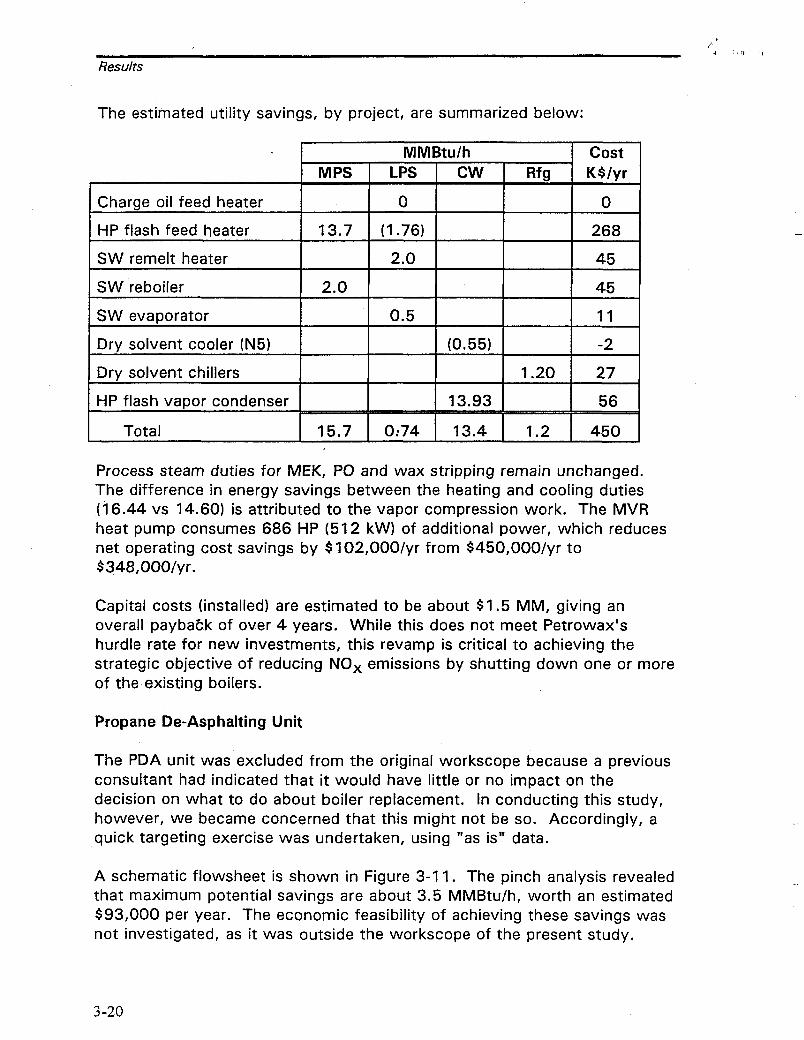
The estimated utility savings, by project, are summarized below:
MMBtu/h cost I MPS I I LPS I I cw I Rfg K$/yr
I Charge oil feed heater I I HP flash feed heater I 13.7
I SW remelt heater I
1 Dry solvent chillers I
0 1 I o (1.76) 268
2.0 45
45
0.5 11
(0.55) -2
1.20 27
Process steam duties for MEK, PO and wax stripping remain unchanged. The difference in energy savings between the heating and cooling duties (16.44 vs 14.60) is attributed to the vapor compression work. The MVR heat pump consumes 686 HP (512 kW) of additional power, which reduces net operating cost savings by $102,00O/yr from $450,00O/yr to $348,00O/yr.
Capital costs (installed) are estimated to be about $1.5 MM, giving an overall payback of over 4 years. While this does not meet Petrowax's hurdle rate for new investments, this revamp is critical to achieving the strategic objective of reducing NOx emissions by shutting down one or more of the existing boilers.
Propane De-Asphalting Unit
The PDA unit was excluded from the original workscope because a previous consultant had indicated that it would have litt le or no impact on the decision on what to do about boiler replacement. In conducting this study, however, we became concerned that this might not be so. Accordingly, a quick targeting exercise was undertaken, using "as is" data.
A schematic flowsheet is shown in Figure 3-1 1. The pinch analysis revealed that maximum potential savings are about 3.5 MMBtu/h, worth an estimated $93,000 per year. The economic feasibility of achieving these savings was not investigated, as it was outside the workscope of the present study.
3-20

I 1 1 , 7
Results
E ti
Y- o
3-2 1

The main conclusion for present purposes was that the potential steam savings in PDA are small compared to total site steam consumption, and therefore a future HEN retrofit will not impact the design of the CHP system.
Wax Finishing
The existing wax purification process involves bauxite filtration, with total utility costs estimated to be between $300-350 K/year.
The possibility of replacing this process with a new hydrotreater was investigated. Two options were considered:
Purchase/build new unit Retrofit existing moth balled platf ormer
For a wax hydrofinishing rate matched to current operations, capital and operating costs were obtained from the literature, as follows:
Capital Cost (new): $2.7 - 4.2 M M
Operating Costs
With a payback on expected savings over 10 years, this does not seem attractive. The second alternative, involving reuse of the existing platformer, fared no better. According to vendors who specialize in this technology, it would be impractical to retrofit the existing platformer equipment.
I
Finally, it will be necessary in both cases to build a small hydrogen plant on site to ensure a secure supply. Assuming a 1 MM SCFD plant capacity, the capital cost would be about $3 MM. The impact on site utilities would be minimal.
To summarize, the operating costs for a hydrofinishing process would be roughly comparable to the existing bauxite filtration process. The minimum total capital investment required will be about $6.5 MM. Clearly, the
3 -22

justification for a new hydrotreater would have to be some compelling reason other than economics (eg. quality, environmental compliance, etc.).
Therefore, for purposes of the CHP analysis, it has been assumed that Petrowax will continue to operate the bauxite filtration process for the foreseeable future.
Offsites
A detailed analysis of tank insulation was conducted during a previous study by PCI. Their report was reviewed by Petrowax, and nine tanks were selected for insulation, with estimated savings of 9.2 MMBtu/h.
Additional LP steam savings of 8.4 MMBtu/h were achieved by utilizing process waste heat from VDU to heat up wastewater from 75O to 125OF, as described previously in sections 3.1.2 and 3.2.
Combined Heat and Power System
One of the principal motivations for this study was to determine the optimum CHP system configuration for the Smethport site, assuming that high payback heat recovery projects within the process would be implemented. In particular, management wished to explore the economics of alternate cogeneration strategies.
Total average steam savings from the recommended revamp projects are about 40,00O,Ib/hr, which is more than the current load on the two least efficient boilers. Thus, it would be safe to conclude that they can be shut down during normal operation, and brought into service only during emergencies, such as periods of extreme cold weather. We shall call this case "option zero".
Approximate economics for average operation under Option Zero are as follows :
I CHP Capital Cost = l o 1 I I Base Case Enerav Cost = 14.132 I V . I 1 Option Zero Enerav Cost = I 2.907 I
I Heat DumD debit = 1 0.102 I I Net Savings = I $1.123 MM/yr I
All cogeneration options must be compared against this option zero.
3-23

'U >
Results
Capital Cost = Average Energy Cost = Payback vs Option Zero =
Three potential cogeneration scenarios were evaluated in detail. However, these details cannot be revealed here as they are considered confidential. Instead, a summary of the results and major conclusions is provided.
$2.2 MM $2.94 MM/yr negative
ODtion 1 : Minimum Investment Keeping in mind that the incremental cost of purchased power is $25/MWH, and that the credit for power exported to Penelec is $21/MWH, the first strategy was to minimize power import without going into export mode. A 1.13 M W gas turbine (Solar Saturn 20) with an unfired HRSG was selected for evaluation. Approximate economics are as follows:
Capital Cost = Averaae Enerav Cost =
$25.2 MM (installed) $3.51 MM/w
ODtion 2: Replace Boilers with GT and Unfired HRSG In this scenario, it will be necessary to purchase significant amounts of gas, and export surplus power to Penelec, ranging from 16.25 - 18.50 MW. A 21 M W turbine is required. Approximate economics are:
GT Capital Cost = Average Energy Cost = Payback vs Option Zero =
$10.8 MM (installed) $3.77 MM/yr negative
I Payback vs Option Zero = I negative I ODtion 3: Redace Boilers with GT and Fired HRSG The gas turbine size is smaller than in Option 2, because fired HRSGs produce relatively more steam. The power export to Penelec will be about 6.6 MW. Once again the economics are unfavorable.
The three cogeneration options are compared against Option Zero in Table 3-2. None of them showed favorable economics. This is because gas costs are relatively high at $3.14 per MMBtu, and electrical export credits are low.
A quick calculation makes this abundantly clear. Assuming a heat rate of 10,000 Btu/kwh, the power export credit is 2.1 C/kwh, whereas the cost of gas is 3.2C/kwh. Under this economic environment, cogeneration cannot possibly be attractive.
3 -24

Results
Table 3-2 Comparison of Cogeneration Options
ODtion Number 1 2 3
Coal Boilers in operation #I ,#2 #I ,#2 No No
8.6 GT Size, M W 0 1 .I3 21
none unfired unfired fired HRSG Type
Capital Cost, MMS 0 2.2 25.2 10.8
Energy Cost, MMS/yr
Fuel
Electricity
2.1 1 6.05 12.541 3.51
4.48 (0.71 1 3.77
2.36 0.58 2.94
0.80 2.91
Savings, MMSIyr nla -0.03 -0.60 -0.86
3 -25


CONCLUSIONS AND RECOMMENDATIONS
The main conclusions of this study are as follows:
It is possible to boost VDU wax yield by about 8% points by making relatively minor modifications to VDU tower operation. Increased energy cost in VDU is offset by additional heat recovery, and reduced energy cost in PDA area.
The MEK refrigeration capacity bottleneck can be relieved by about 10% through the recommended HEN revamp.
Economics of replacing the existing bauxite process with a hydrotreater are not good.
Economics of cogeneration involving gas turbines are not good.
By implementing the recommended HEN retrofit in VDU and MEK process areas, steam savings of about 40,000 Ib/hr are possible. This will enable shut down of boilers #3 and 4, and reduce NOx emissions by 30-50%.
Economics for the proposed HEN retrofit are approximately as follows:
4- 1

( 1 Y 5 Conclusions and Recommendations
It is recommended that Petrowax proceed forward with implementation of the revamp in two stages:
Stage 1 - VDU HEN retrofit - VDU yield improvement - Tank insulation
Stage 2 - MEK HEN retrofit
While the stand-alone economics of MEK revamp are not very attractive, this project is essential in order to enable shutting down boilers #3 and 4 and achieve low-cost NO, reduction.
4-2