pineapple chips business efficiency analysis in …
TRANSCRIPT

Agro Ekonomi Vol. 27/No. 1, Juni 201664
PINEAPPLE CHIPS BUSINESS EFFICIENCY ANALYSIS IN KAMPAR REGENCY RIAU PROVINCE USING DATA ENVELOPMENT ANALYSIS
(DEA) METHOD
Analisis Efisiensi Bisnis Keripik Nenas Di Kabupaten Kampar Provinsi Riau Menggunakan Metode Data Envelopment Analysis (DEA)
Riska Dian Oktari1, Lestari Rahayu Waluyati2, Any Suryantini2,1Graduate Student of Agricultural Economics, Faculty of Agriculture, UGM
2Lecturers, Faculty of Agriculture UGM, YogyakartaJl. Flora, Bulaksumur, Yogyakarta 55281
Diterima tanggal : 15 Maret 2016; Disetujui tanggal : 17 April 2017
ABSTRACTPineapple chips is a processed product made of pineapple produced in Kampar Regency. Efficient pineapple chips processing will produce both an added value and high profit. The purpose of this research was to determine the level of relative efficiency of pineapple chips business in Kampar Regency in Riau Province. The level of efficiency achieved is a reflection of the quality of good performance. This research used Data Envelopment Analysis (DEA) method to measure the level of efficiency. An analysis using Data Envelopment Analysis (DEA) method with Constant Return to Scale (CRS) assumption through input oriented approach was done to understand the levels of the pineapple chips producers relative efficiency. The research result showed that Most of the pineapple chips producers in Kampar Regency had not been efficient in relative terms, in which from the total of 21 pineapple chips producers, 8 producers were efficient (38,10%) and 13 producers had not been efficient (61,90%). The efficient producers should be a reference for inefficient producer in using inputs. By referring to the efficient producers, it is expected that the inefficient producers could use the input optimally so that the processing pineapple chips business could reach an efficient condition.
Keywords: Data Envelopment Analysis, Pineapple Chips, Relative Efficiency
INTISARIKeripik nenas merupakan produk dari olahan nenas yang diproduksi di Kabupaten Kampar. Pengolahan keripik nenas yang telah efisien akan menghasilkan nilai tambah dan keuntungan yang tinggi. Tujuan dari penelitian ini adalah untuk mengetahui tingkat efisiensi relatif bisnis keripik nenas di Kabupaten Kampar di Provinsi Riau. Tingkat efisiensi yang dicapai adalah cerminan kualitas kinerja yang baik. Penelitian ini menggunakan metode Analisis Data Envelopment Analysis (DEA) untuk mengukur tingkat efisiensi. Analisis dengan metode Data Envelopment Analysis (DEA) dengan asumsi Constant Return to Scale (CRS) melalui pendekatan input oriented dilakukan untuk mengetahui tingkat efisiensi relatif pengrajin keripik nenas. Hasil penelitian ini menunjukkan bahwa sebagian besar produsen chip nanas di Kabupaten Kampar belum efisien secara relatif, dimana dari total 21 produsen chip nenas, terdapat 8 produsen yang efisien (38,10%) dan 13 produsen yang belum efisien (61,90%). Produsen yang efisien harus menjadi acuan bagi produsen yang tidak efisien
brought to you by COREView metadata, citation and similar papers at core.ac.uk
provided by Agro Ekonomi

65Agro Ekonomi Vol. 27/No. 1, Juni 2016
dalam menggunakan input produksi. Dengan mengacu pada produsen yang sudah efisien, diharapkan produsen yang tidak efisien bisa menggunakan input produksi secara optimal sehingga usaha pengolahan keripik nenas bisa mencapai kondisi yang efisien.
Kata Kunci : Data Envelopment Analysis, Efisiensi Relatif, Keripik Nenas
can be both consumed as a fresh fruit and also as raw materials in food industry. The benefits of pineapple for the human body are helping to soften food in the ulcer, reducing weight, cure skin inflammation, and strengthening the immunity.
Pineapple is rich of minerals needed by the human body such as potassium, chlorine, sodium, phosphorus, magnesium, sulfur, calcium, iron and iodine. Vitamins contained in pineapples are vitamins A, B, C and E. The presence of bromelain iron in raw pineapple extract made pineapple as a good anti-inflammatory (Nainggolan, 2006).
P i n e a p p l e c a n b e u s e d a s supplementary nutritional fruit for good personal health (Hemalatha and S. Anbuselvi, 2013). The edible parts of the pineapple fruit (pulp and core) are rich in soluble carbohydrates and relatively poor in antioxidants and minerals. However, as these fruit tissues are also relatively poor in dietary fiber, the unstirred water layer effect is not expected to occur when pineapple is ingested alone. Therefore, the absorption of minerals and antioxidants would probably be higher due to the lack of interference by the dietary fiber. This fruit in natura is classified as having a low dietary glycemic
INTRODUCTIONFresh fruits production have great
prospect to develop, considering the increase of population and society’s awareness of the importance to consume healthy fruits. Indonesia’s natural resources really supports the development of tropical fruits production because of the climate suitability along with enough land availability. So far, the role of Indonesian fruits is not significant in increasing the income, even though actually the demand for fruits is pretty high for fresh fruits consumption as well as for agroindustrial raw materials.
Fruit plant commodities have a big role to human health, because fruits contain vitamins and minerals needed by the human body. Beside having important nutrient content and nutrients, the development of fruits commodity has good prospect because it can support efforts to increase farmer’s income, poverty alleviation, community nutrition improvement and expansion of job opportunity (Noorlatifah and Hamdani, 2012).
One of the agricultural commodities that has the potency to be developed in agroindustry is pineapple. Pineapple (Ananas comosus) has two benefits; it

Agro Ekonomi Vol. 27/No. 1, Juni 201666
load (GL = 7), because the usual portion (100 g) contains a low concentration of available carbohydrates (11 g) and a high moisture content (90% approximately). The nutritional composition of the shell and core shows that they cannot be disregarded as a source of a high quality fiber for use in food industry (Kumar et.al., 2016).
Fresh pineapple has a short shelf life that lasts only about 4-6 days (Hajare et al, 2006). One effort that can be done to overcome these problems is to increase the activities of agricultural processing industries. Through agricultural industrialization, it is expected that in addition to increasing value added, it will also increase demand for agricultural commodit ies as raw materials for processing industries Agricultural products (Nurmedika et.al., 2013).
The prospect of pineapple commodity is huge, especially when the pineapple is processed into canned food such as pineapple jam, pineapple syrup and pineapple fruit syrup. And of course will also impact on the development of industry in the form of agricultural processing industry. Several countries importing agricultural processing products include: France, Germany, and the United States. Although pineapple-producing areas have spread evenly in Indonesia but currently only able to export a small part of the world’s needs, which is only 5%. Of course this will be a good prospect for
the Indonesian economy (Noorlatifah and Hamdani, 2012).
Processing various pineapple products can be done both in household scale industries (home industry) and large industry. For a household scale, the technology that is used is simple and does not cost much, but it must meet the quality requirements that have been set. This industrial scale is suitable to be applied in the rural communities living around the pineapple production centre, because it can help the household economy.
Agroindustry is important to increase the added value, especially during the abundant production and low price of the product, also for the damaged or low quality product, hence this is the right time to process it further. Agroindustry activity is considered to increase the added value. The added value obtained is the difference between the value of the commodities that are treated at a certain stage with the value of sacrifice used during the production process takes place. Furthermore, the added value shows the remuneration for capital, labor, corporate management. One use of calculating value added is to measure the amount of service to the owner of the production factor. Essentially value added is the value of production with raw materials and supporting materials used in the production process (Langitan, 1994 cit. Rahman, 2015).
In a production process, the business scale (“returns to scale”) describes the

67Agro Ekonomi Vol. 27/No. 1, Juni 2016
response of the output to the proportional change of all inputs. By knowing the scale of the business, the entrepreneur may consider whether or not a business should be developed further. If the scale of the business with increasing returns to scale (IRTS) should be expanded to lower the average cost of production so that the profit is increased. If the business scale conditions with constant returns to scale (CRTS), then the business expansion does not affect the average production cost. Whereas if the scale of the business with the increase in yield is reduced then the expansion of the business will result in an increase in the average production cost (Chand and Kaul, 1986 cit. Tajerin and Noor, 2003).
Factors affecting the determination of the selling price are internal factors such as the cost and quality of goods or services or outside the company such as market demand and supply, market type, government policy and competitors (Hapsari et al., 2008).
According to Imran et.al (2014) research about Value Added Analysis of Cassava Chips in SME “Chips Barokah” Bonebolango District . The research results showed that profit received from the business of processing cassava into cassava chips in five cassava production processes in SMEs “ Barokah Chips “ is Rp . 6.1155 million for a month , and value -added business perbahan enjoyed raw chips for SMEs Barokah 37.555/kg , this added value
is the result of profit and the rest of the labor income reached 1.925 million.
Maulidah and F. Kusumawardani (2011) research aims to calculate the amount of added value produced by processed agroindustry UD Cemara Sari and analyze the optimal combination of processed agroindustry of star fruit UD Cemara Sari with limited input available. The analytical method used is the added value of Hayami method and linear programming (linear programming). Linear program analysis shows that the maximum profit can be obtained with a combination of different processed products with a combination of products made by the company.
The small scale of community business is caused by limited capital ownership resulting in low income received. The level of income is related to the optimal level of profit, so it is related to the effort of achieving the optimal profit, it must be understood the technical and economic aspects of production (Mandaka and Hutagaol, 2005).
Kampar Regency is one of the pineapple production centres in Riau; this is supported by the condition of the areas, which are peat lands, which are suitable for the development of pineapple commodities. According to Statistics Indonesia of Kampar Regency in 2014, the amount of pineapple families reached 8.601.519 with production of 20.179.000 kg, in the productivity level of 2,35 kg for pineapple

Agro Ekonomi Vol. 27/No. 1, Juni 201668
family. Abundant pineapple production and the nature of the pineapple fruit that easily damaged encouraged people to process pineapples into pineapple chips.
Since 2002 the people in the village had produced pineapple chips and to date there are 12 small industries of pineapple chips. Pineapple chip can create added value quite significantly. For every 35 kg the farmer can get Rp 250,000 in return while to the chop producer compared to only Rp 157,500 if it sells fresh pineapple (Rosnita et.al., 2014).
The measurement of the productive efficiency in agricultural production is an important issue from the standpoint of agricultural development in developing countries since it gives pertinent information useful for making sound management decisions in resource allocation and for formulating policies and institutional improvements. In the productive efficiency arena, we are familiar with three types of efficiency, namely, technical, allocative and economic efficiencies (Alam et.al., 2005).
When one talks about the efficiency of a firm, one usually means its success in producing as large as possible an output from a given set of inputs. Economic efficiency is generally defined as the ability of a production organisation or any other entity, for instance, a farm to produce a well- specified output at the minimum cost. Farrell (1957) cit. Alam et.al. (2005) proposed that economic or
overall efficiency of a farm consists of two components: technical efficiency, which reflects the ability of a farm to obtain maximal output from a given sets of inputs under certain production technology, and allocative efficiency, which reflects the ability of a farm to use the inputs in optimal proportion, given their respective prices. If a farm has achieved both technically and allocatively efficient levels of production, then the farm is economically efficient.
Pineapple chips producers need to pay attention to the use of raw materials and auxiliary materials efficiently in order to get maximum profit in developing their business.
According to Rosnita et.al. (2014), the production cost of pineapple chips business including pineapple raw materials cost, supplementary raw materials cost, labor cost, equipment depreciation cost, packaging cost, electricity and transportation cost. The average production cost of pineapple chips business is Rp.15.514.749 by using 1 machine; Rp. 34.199.267 by using 2 machines; Rp. 62.515.120 by using 3 machines; and Rp. 57.478.340 by using 4 machines. The biggest component of the production cost is the pineapple raw materials cost, followed by labor cost. The enterpreneur’s gross income ranges from 21 billions rupiah per month (for 1 unit machine) up to 100 billions rupiah per month (for 4 unit machines), depended on number of machine unit used by the

69Agro Ekonomi Vol. 27/No. 1, Juni 2016
enterpreneurs. The enterpreneur’s net income ranges from 6 billions rupiah up to 39 billions rupiah per month. The added value per unit machine is 9 billions rupiah or 38 thousands rupiah per kilogram. The higher the production capacity trend, the more efficient and the higher business vaue added.
This research used Data Envelopment Analysis (DEA) method to measure the level of efficiency. The purpose of this research was to determine the level of relative efficiency of pineapple chips business in Kampar Regency in Riau Province. The level of efficiency achieved is a reflection of the quality of good performance (Sutawijaya and Lestari, 2009).
Data Envelopment Analysis (DEA) Concept
According to Prasetyo (2008), DEA methodology is a non-parametric method that uses linear programming models to calculate the output and input ratio for all units that are being compared. First introduced by Charnes, Cooper, and Rhodes (CCR) in 1978. This method does not require the production function and the results of the calculations referred to as relative efficiency value. So it can be said that DEA is a method not model. Data Envelopment Analysis is a multifactor method of analysis to measure the efficiency and effectiveness of a homogeneous Decision Making Unit (DMU) group.
DEA method is a nonparametric frontier method that uses a l inear programming model to calculate the ratio of output and input ratios for all units compared in a population. The purpose of the DEA method is to measure the level Efficiency of the decision-making unit relative to a similar bank when all of these units are at or below its efficient frontier “curve”. So this method is used to evaluate the relative efficiency of some objects (performance benchmarking) (Abidin, Z and Endri, 2009).
Maharani (2014) stated that DEA (Data Envelopment Analysis) method is a linear program based technique to measure the efficiency of the organizational unit called Decision Making Units (DMU). With this method, DMU is compared directly with each other (homogeneous), as well as input and output that can have different measurement units. The other advantages of the DEA method is the ability to handle multiple inputs and multiple outputs, does not need to know the relations between input and output, can be used with input and output data from different units, as well as the things that are being compared can be seen directly from the resulting processed output.
DEA method calculates technical efficiency for all units. The efficiency score for each unit is relative, depending on the efficiency level of the other units in the sample. Each unit in the sample is
Agro Ekonomi Vol. 27/No. 1, Juni 201670
considered to have a non-negative level of efficiency, and a value between 0 and 1 with the provision of one indicating perfect efficiency. Furthermore, units of this one value are used in making envelope for efficiency frontier, while other units in envelope indicate inefficiency level (Abidin, Z and Endri, 2009).
According to Cooper et al (2011) cit Saleh (2012), Data Envelopment Analysis (DEA) method is divided into two models, which are:1. CCR model of DEA was the most
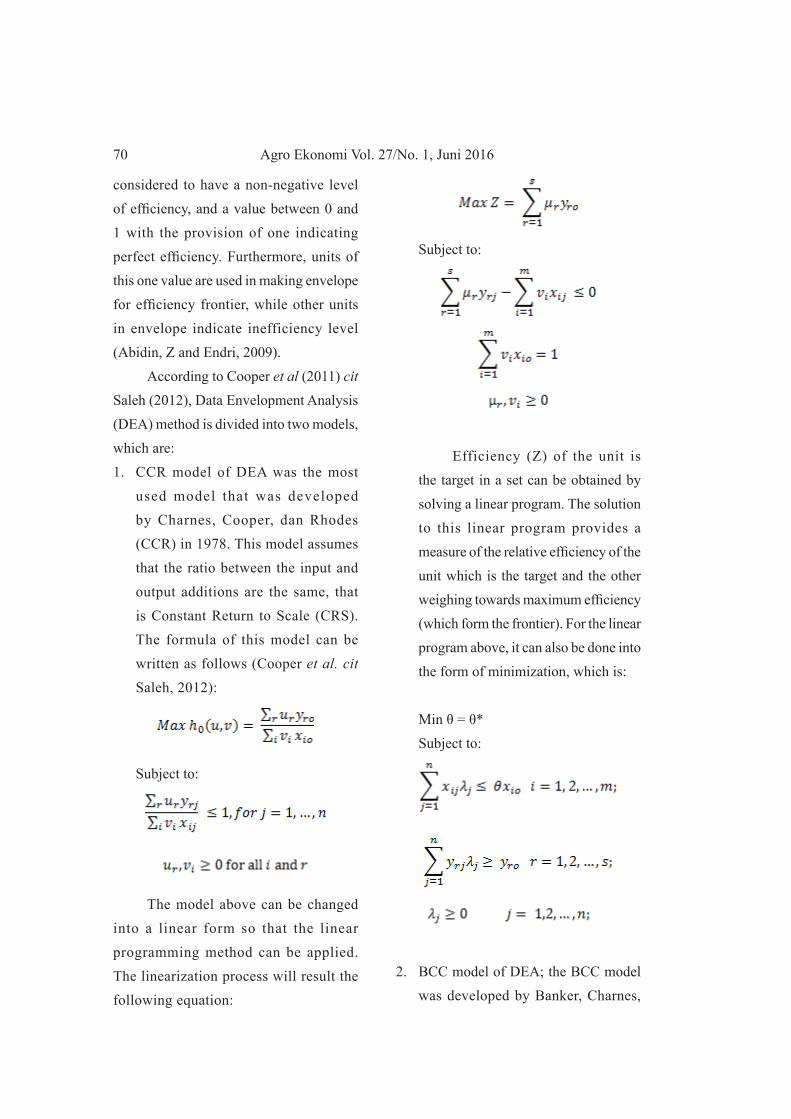
used model that was developed by Charnes, Cooper, dan Rhodes (CCR) in 1978. This model assumes that the ratio between the input and output additions are the same, that is Constant Return to Scale (CRS). The formula of this model can be written as follows (Cooper et al. cit Saleh, 2012):
Subject to:
The model above can be changed into a linear form so that the linear programming method can be applied. The linearization process will result the following equation:
Subject to:
Efficiency (Z) of the unit is the target in a set can be obtained by solving a linear program. The solution to this linear program provides a measure of the relative efficiency of the unit which is the target and the other weighing towards maximum efficiency (which form the frontier). For the linear program above, it can also be done into the form of minimization, which is:
Min θ = θ*Subject to:
2. BCC model of DEA; the BCC model was developed by Banker, Charnes,

71Agro Ekonomi Vol. 27/No. 1, Juni 2016
and Cooper (BCC) in 1984 allowing for Variable Returns to Scale (VRS) and measuring only the technical efficiency of each DMU. Assumption of the BCC model is that the ratio between the input output additions are not the same (variable returns to scale). BCC model BCC was obtained by adding restrictions (Cooper et al cit Saleh, 2012):
Both of the models above will provide the optimal solution θ* for decision making unit. The value of θ is always less than or equal to 1. The value of efficiency that is obtained from the BCC model is the value of pure technical efficiency. CCR model simultaneously evaluating the scale efficiency and technical efficiency in aggregate. While BCC model separates the evaluation of technical efficiency and scale efficiency.
METHODSData and Method of Collecting Data
Selection of location was done in purposive that was selecting location intentionally based on certain considerations from the researchers (Soewadji, 2012). The research was conducted in Tambang Sub-district, Kampar Regency, Riau Province, where the determination of the location
based on the consideration that Tambang Sub-district is the largest pineapple producing area in Kampar regency and location centre of the manufacture of pineapple chips. Method of collecting data was done with census method, which is research data that is collected from the entire target population (Purwanto, 2012). The total population that was taken was 21 pineapple chips producers in Tambang Sub-district, Kampar Regency.
Method of AnalysisThe basic method that was used
in this research was descriptive method. Descriptive analysis is an analysis that aims to systematically and accurately describe the facts and characteristics of the population or a particular field which attempts to describe a situation or event (Soewadji, 2012).
Method of data analysis that was used was DEA (Data Envelopment Analysis) method to measure the relative efficiency of pineapple chips industry in Kampar Regency, which is a non-parametric method that uses linear programming models to calculate the ratio of output and input comparison for all units that are being compared. DEA is a multifactor method of analysis for measuring the efficiency and effectiveness of a homogeneous Decision Making Unit (DMU) group, which were the pineapple chips producers in Kampar Regency.

Agro Ekonomi Vol. 27/No. 1, Juni 201672
This research used a model that was developed by Charnes, Cooper and Rhodes (CCR) with Constant Return to Scale (CRS) assumption that there is presence of linear relations between input and output, with each addition of an input will result in proportional and constant addition of output (Prasetyo, 2008). The measurements that were used were input oriented, where the efficient producers means they use the input optimally in generating the output. The pineapple chips producers were effective if the relative efficiency rate was of 100% or 1, while the producers were inefficient if the relative efficiency rate was less than 100%.
Input variables were variables that affect the output. The variables that each used by the DMU were as follows:1. Input variables which were:
a. Total cost (Rp/month)b. Amount of pineapple (kilogram/
month)c. Amount of cooking oil (liter/
month)d. Amount of salt (package/month)e. Amount of baking soda (kg/month)
2. Output variables were production (kg) and the profits of pineapple chips (Rp).
The calculation of data with DEA method to measure the relative efficiency of pineapple chips industry was using DEA Solver software LV (V3). Data analysis was using DEA-CCR Constant Return to Scale
(CRS) approach with input orientation which results in relative efficiency rate of value 0 to 1.
RESULTS AND DISCUSSIONP i n e a p p l e C h i p s P r o d u c e r s Characteristics
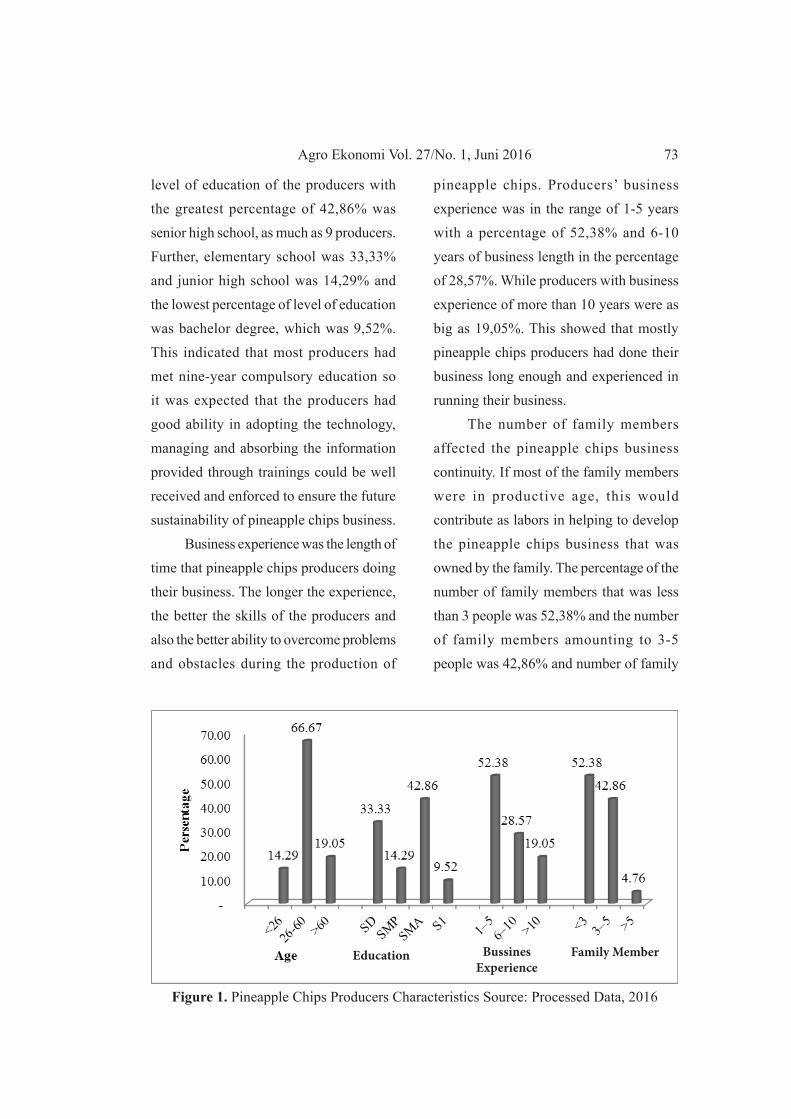
The age of producer was associated with the physical ability to work and the way of thinking and affecting the producer skills in managing the pineapple chips business. Producers age grouping were on age (<26), age (26-60) and age (> 60). In Figure 1 it can be seen that as many as three producers or 14,29% were in the group of less than 26 years old. Producers with ages ranging from 26 to 60 years old were as many as 14 producers (66,67%) while the remaining 4 the producers or 19,05% were in the age group of over 64 years old. This showed that the pineapple chips producers in Tambang Sub-district Kampar Regency still had the physical ability and good way of thinking in doing their business.
The level of education of the pineapple chips producers affected the ability to absorb or receive the information and technology for the development of pineapple chips business to a better future. The higher one’s education was, the higher the ability to adopt technology that can support their business. The education levels of the producers included elementary school, junior high school, senior high school, as well as bachelor degree. The
73Agro Ekonomi Vol. 27/No. 1, Juni 2016
level of education of the producers with the greatest percentage of 42,86% was senior high school, as much as 9 producers. Further, elementary school was 33,33% and junior high school was 14,29% and the lowest percentage of level of education was bachelor degree, which was 9,52%. This indicated that most producers had met nine-year compulsory education so it was expected that the producers had good ability in adopting the technology, managing and absorbing the information provided through trainings could be well received and enforced to ensure the future sustainability of pineapple chips business.
Business experience was the length of time that pineapple chips producers doing their business. The longer the experience, the better the skills of the producers and also the better ability to overcome problems and obstacles during the production of
pineapple chips. Producers’ business experience was in the range of 1-5 years with a percentage of 52,38% and 6-10 years of business length in the percentage of 28,57%. While producers with business experience of more than 10 years were as big as 19,05%. This showed that mostly pineapple chips producers had done their business long enough and experienced in running their business.
The number of family members affected the pineapple chips business continuity. If most of the family members were in productive age, this would contribute as labors in helping to develop the pineapple chips business that was owned by the family. The percentage of the number of family members that was less than 3 people was 52,38% and the number of family members amounting to 3-5 people was 42,86% and number of family
Figure 1. Pineapple Chips Producers Characteristics Source: Processed Data, 2016
Bussines Experience
Family MemberEducation
Agro Ekonomi Vol. 27/No. 1, Juni 201674
Pineapple Chips Business Relative Efficiency
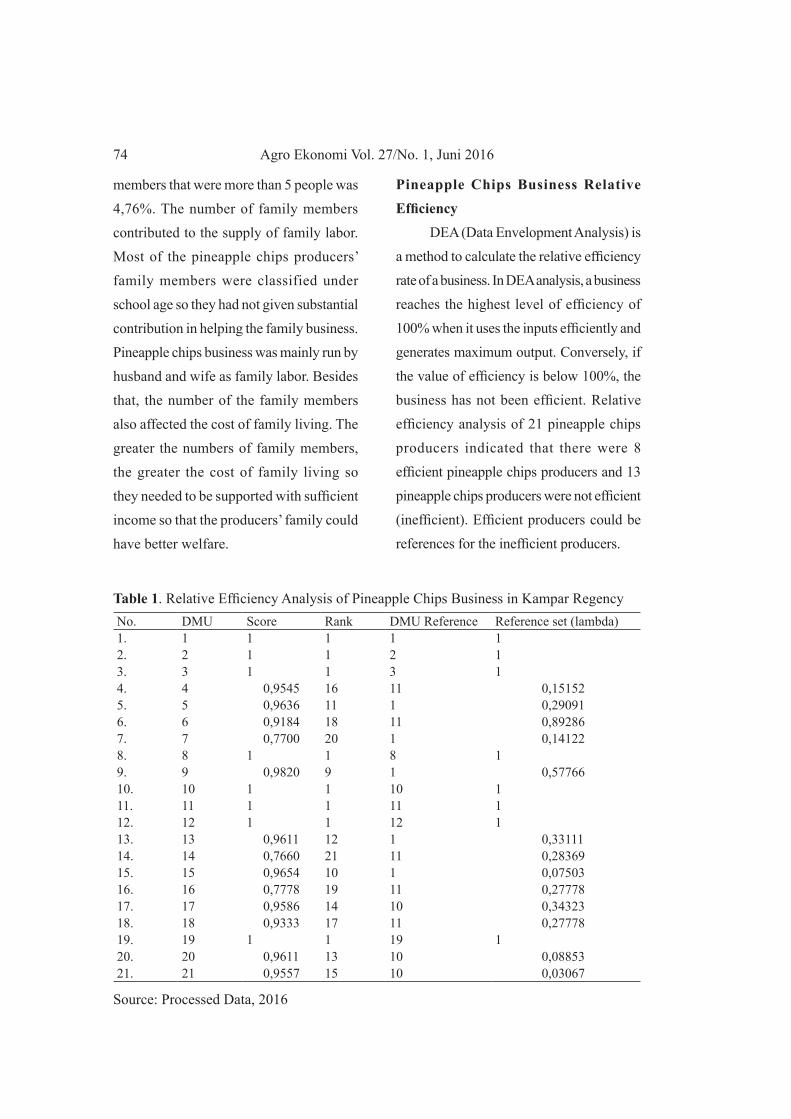
DEA (Data Envelopment Analysis) is a method to calculate the relative efficiency rate of a business. In DEA analysis, a business reaches the highest level of efficiency of 100% when it uses the inputs efficiently and generates maximum output. Conversely, if the value of efficiency is below 100%, the business has not been efficient. Relative efficiency analysis of 21 pineapple chips producers indicated that there were 8 efficient pineapple chips producers and 13 pineapple chips producers were not efficient (inefficient). Efficient producers could be references for the inefficient producers.
Table 1. Relative Efficiency Analysis of Pineapple Chips Business in Kampar RegencyNo. DMU Score Rank DMU Reference Reference set (lambda)1. 1 1 1 1 12. 2 1 1 2 13. 3 1 1 3 14. 4 0,9545 16 11 0,15152 5. 5 0,9636 11 1 0,29091 6. 6 0,9184 18 11 0,89286 7. 7 0,7700 20 1 0,14122 8. 8 1 1 8 19. 9 0,9820 9 1 0,57766 10. 10 1 1 10 111. 11 1 1 11 112. 12 1 1 12 113. 13 0,9611 12 1 0,33111 14. 14 0,7660 21 11 0,28369 15. 15 0,9654 10 1 0,07503 16. 16 0,7778 19 11 0,27778 17. 17 0,9586 14 10 0,34323 18. 18 0,9333 17 11 0,27778 19. 19 1 1 19 120. 20 0,9611 13 10 0,08853 21. 21 0,9557 15 10 0,03067
Source: Processed Data, 2016
members that were more than 5 people was 4,76%. The number of family members contributed to the supply of family labor. Most of the pineapple chips producers’ family members were classified under school age so they had not given substantial contribution in helping the family business. Pineapple chips business was mainly run by husband and wife as family labor. Besides that, the number of the family members also affected the cost of family living. The greater the numbers of family members, the greater the cost of family living so they needed to be supported with sufficient income so that the producers’ family could have better welfare.

75Agro Ekonomi Vol. 27/No. 1, Juni 2016
In Table 1 the results of the relative efficiency analysis can be seen, where producers (DMU) 14 had 0,7660 score with relative efficiency rate below 100% or 1 so that the producers were inefficient. The reference of producer 14 to be efficient was producer 11 with a lambda score of 0,28369. This meant that producer 14 would be efficient if the using of the inputs was 0,28369 times the producer 11. As well with the other inefficient producers could refer to each lambda score reference respectively. Pineapple chips producers who had been efficient in which the value of the relative efficiency was 100% or 1 might retain the use of each inputs for the sake of better business continuity in the future.
From the analysis it can be seen that the DMU 11 was a producer who became the reference for a lot of other
inefficient producers. If seeing from the characteristics of the respondents, producer 11 was 39 years old, a senior high school graduate, with 12 years of business length. Based on the background of the business, producer 11 had enough experience in doing the processing of pineapple chips so that they could use inputs efficiently and could receive information and adopted the technology well.
In Table 2, it could be seen the DMU that had relative efficiency score of less than 100% so that the DMU was not efficient. The input usage in pineapple chips business consists of the total cost, the amount of raw materials of pineapple, the amount of cooking oil, the amount of salt and the amount of baking soda. Inefficient DMU used the inputs excessively so they should reduced it
Table 2. Input reducing for Inefficient DMU of Pineapple Chips Business in Kampar Regency
No. I n e f f i c i e n t DMU
Amount of input should be reduced
Total Cost (Rp) P i n e a p p l e (kg)
Cooking Oil (liter)
S a l t (package)
Baking Soda (kg)
1. 4 1.672.581,98 14,55 54,30 0,36 0,222. 5 2.836.355,89 58,18 105,39 3,43 0,043. 6 8.389.506,36 205,71 168,47 4,90 0,154. 7 4.235.111,64 276,04 79,57 7,86 0,215. 9 357.976,76 14,38 74,56 0,29 0,016. 13 1.396.919,17 46,68 4,36 3,95 0,037. 14 1.742.741,24 187,23 48,52 4,68 0,148. 15 899.869,71 11,06 35,90 0,79 0,019. 16 3.585.960,80 266,67 100,76 5,33 0,4010. 17 2.627.091,98 66,27 141,67 2,33 0,9911. 18 1.116.803,28 66,67 107,56 1,33 0,1612. 20 1.245.895,57 12,46 39,23 0,60 0,1913. 21 1.077.318,99 14,19 41,70 0,35 0,21
Source: Processed Data, 2016

Agro Ekonomi Vol. 27/No. 1, Juni 201676
in accordance with the recommended amount so that the producers could be efficient and develop better pineapple chips in the future.
CONCLUSION AND SUGGESTION Most of the pineapple chips
producers in Kampar Regency had not been efficient in relative terms, in which from the total of 21 pineapple chips producers, 8 producers were efficient (38,10%) and 13 producers had not been efficient (61,90%). The efficient producers should be a reference for inefficient producer in using inputs. By referring to the efficient producers, it is expected that the inefficient producers could use the input optimally so that the processing pineapple chips business could reach an efficient condition.
REFERENCESAbidin, Z & Endri. 2009. Kinerja Efisiensi
Teknis Bank Pembangunan Daerah: Pendekatan Data Envelopment Analysis (DEA). ABFI Institute Perbanas. Jurnal Akuntansi Dan Keuangan, Vol 11, No.1 : 21-29.
Alam M. A., K. M. Mostafizur Rahman and M. A. Quddus. 2005. Measurement Of Economic Eff i c i ency Of Producingfish In Bangladesh With Translog Stochastic Cost Frontier. Bangladesh J. Agric. Econs XXVIII, 1&2 (2005) 33-48.
Badan Pusat Statistik (BPS). 2014. Kampar dalam Angka . BPS Kabupaten Kampar. Bangkinang.
Hajare, S. N., V. S. Dhokane., R. Shashidhar., S. Saroj., A. Sharma & J. R. Bandekar. 2006. Radiation Processing of Minimally Processed Pineapple (Ananas comosus Merr.): Effect on Nutritional and Sensory Quality. Journal Of Food Sciense. Vol. 71. Nr 6, 2006: 501-505.
Hapsari, H., E. Djuwendah & T. Karyani. 2008. Peningkatan Nilai Tambah dan Strategi Pengembangan Usaha Pengolahan Salak Manonjaya. Jurnal Agrikultura. Volume 19, Nomor 3: 208-215.
Hemalatha R and S. Anbuselvi. 2013. Physicohemical constituents of pineapple pulp and waste. Journal of Chemical and Pharmaceutical Research 5(2):240-242.
Imran, S., A. Murtisari & N. K. Murni. 2014. Analisis Nilai Tambah Keripik Ubi Kayu di UKM Barokah Kabupaten Bone Bolango. Jurnal Perspektif Pembiayaan dan Pembangunan Daerah. Vol. 1, No. 4: 207-212.
Kumar K, Suresh Chandra, Vishal Kumar and Prince. 2016. Medico-nutritional importance and value added products
77Agro Ekonomi Vol. 27/No. 1, Juni 2016
of pineapple. South Asian J. Food Technol. Environ. 2(1):290-298.
Maharani, S., Dania, W. A. P., & Effendi, M. 2014. Analisis Efisiensi Produk dengan Metode Data Envelopment Analysis (DEA) (Studi Kasus pada UD Sabar Jaya Malang). Jurusan Teknologi Industri Pertanian. Fakultas Teknologi Pertanian. Universitas Brawijaya.
Mandaka, S & M. P. Hutagaol. 2005. Analis is Fungsi Keuntungan, Efisiensi Ekonomi dan Kemungkinan Skema Kredit Bagi Pengembangan Skala Usaha Peternakan Sapi Perah Rakyat Di Kelurahan Kebon Pedes, Kota Bogor. Jurnal Agro Ekonomi, Volume 23 No. 2: 191-208.
Maulidah, S & F. Kusumawardani. 2011. Nilai Tambah Agroindustri Belimbing Man(Averrhoa carambola L.) dan Optimalisasi Output Sebagai Upaya Peningkatan Pendapatan. Agrise Volume XI, No. 1: 19-29.
Nainggolan, R.A. 2006. Jus dan Diet. PT. Agromedia Pustaka. Jakarta.
Noorlatifah & Hamdani. 2012. Struktur Biaya dan Penerimaan Usahatani Nanas Madu (Ananas sativus) di Kecamatan Basarang Kabupaten Kapuas. Jurnal Agribisnis Pedesaan Volume 02, Nomor 01: 1-10.
Nurmedika., M. Marhawati & M. N. Alam. 2013. Analisis Pendapatan dan Nilai Tambah Keripik Nangka Pada Industri Rumah Tangga Tiara Di Kota Palu. Agrotekbis 1 (3): 267-273.
Prasetyo, S. B. 2008. Analisis Efisiensi Distribusi Pemasaran Produk dengan Metode Data Envelopment Analysis (DEA). Jurnal Penelitian Ilmu Teknik Vol.8, No.2 Desember 2008 : 120-128.
Purwanto. 2011. Statistika untuk Penelitian. Pustaka Pelajar. Yogyakarta.
Rahman, S. 2015. Analisis Nilai Tambah Agro indus t r i Chips Jagung . Indonesian Food Technologists. Univers i tas I s lam Makassar. Makassar. Jurnal Aplikasi Teknologi Pangan 4 (3): 108-111.
Rosnita, Roza Yulida, Susy Edwina, Evy Maharani, Didi Muwardi and Arifudin. 2014. Analysis of Pineapple Chips Agroindustry in Kualu Nenas Village Kampar District. International Journal on Advanced Science Engineering Information Technology 4 (3) : 65-71.
Saleh, Y., Mulyo, J. H. & Waluyati, L. R. 2012. Efisiensi Lembaga Keuangan Mik ro Agr ib i sn i s Gabungan Kelompok Tani Dalam Pengembangan Usaha Agribsinis

Agro Ekonomi Vol. 27/No. 1, Juni 201678
Pedesaan: Studi Kasus Di Kabupaten Bantul. Jurnal Agroekonomi Volume 30 Nomor 2 Oktober 2012.
Soewadji. M. A., J. 2012. Pengantar Metodologi Penelitian. Mitra Wacana Media. Jakarta.
Sutawijaya, A & E. P. Lestari. 2009. Efisiensi Teknis Perbankan Indonesia Pasca krisis Ekonomi: Sebuah Studi Empiris Penerapan Model DEA.
Jurnal Ekonomi Pembangunan Vol. 10, No.1: 49-67.
Tajerin & M. Noor. 2003. Pendugaan Fungsi Keuntungan dan Skala Usaha Budidaya Pembesaran Ikan Bandeng Di Kecamatan Palang Kabupaten Tuban Jawa Timur. Jurnal Ekonomi Pembangunan Kajian Ekonomi Negara Berkembang Vol. 8 No.2: 123-135.