pinelands rural economic development pilot program
TRANSCRIPT
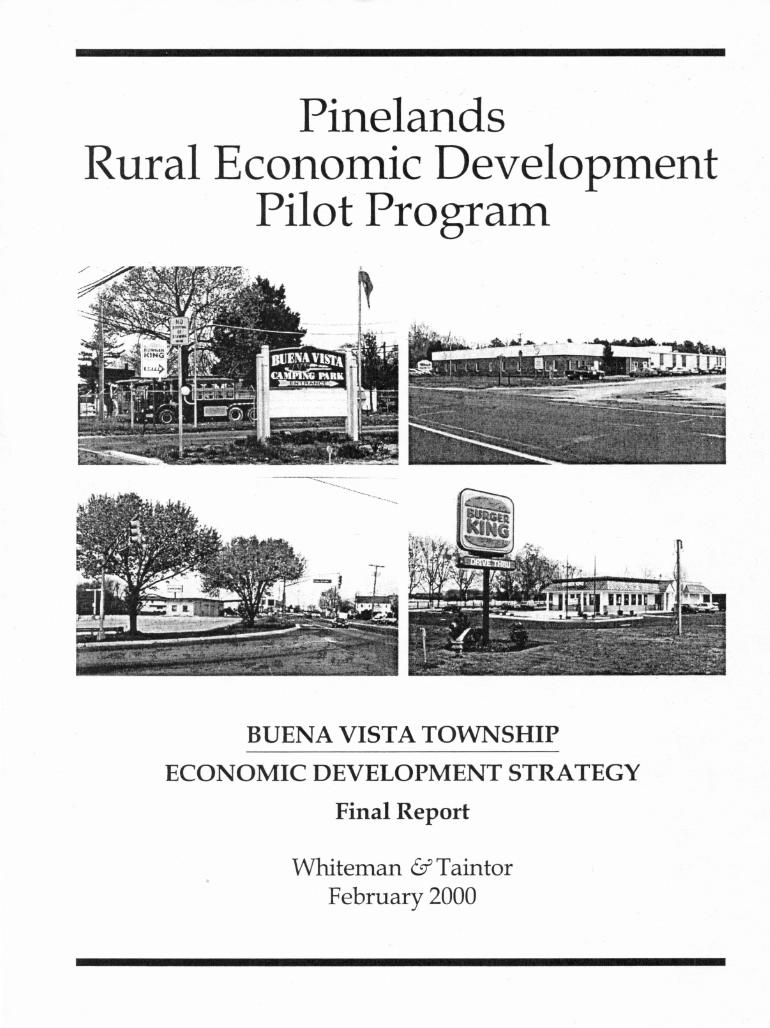
Pinelands Rural Economic Development
Pilot Program
.------------.~ .. ---.
BUENA VISTA TOWNSHIP
ECONOMIC DEVELOPMENT STRATEGY
Final Report
Whiteman &Taintor February 2000

CONTENTS
INTRODUCTION .............................................................................................................. 1
ECONOMIC DEVELOPMENT OBJECTIVES ................................................................. 2
Quantifying Community Objectives ............................................................................ 4
PROFILE OF BUENA VISTA AND THE STUDY AREA. .............................................. 8
Defining the Geographic Scope ..................................................................................... 8 Location and Transportation .................................................................... '" ................. 8 Land Use Character .................................................................................................... 12 Zoning Summary ........................................................................................................ 15 Infrastructure Capacity of the Community ............................................................... 16 Economic Composition of the Community ............................................................... 17 Development Capacity Inventory .............................................................................. 20 Summary ..................................................................................................................... 22
OVERVIEW OF THE REGIONAL ECONOMY ............................................................ 24
Primary Regional Economy: Inland South Jersey Counties ....................................... 24 The Regional Border Economy to the Pine lands ........................................................ 31 Dynamics of the Local Marketplace ........................................................................... 33 Competitive Analysis ................................................................................................. 36
DIRECTIONS FOR THE STUDY AREA ........................................................................ 39
Method and Assumptions .......................................................................................... 39 Scenarios ...................................................................................................................... 46
STRATEGIC DIRECTIONS FOR BUENA VISTA ........................................................ 56
A Framework for Rural Economic Development.. ..................................................... 56 Critical Sh'ategic Factors ............................................................................................. 59 Buena Vista's Path ...................................................................................................... 62
APPENDIX 1: INVENTORY OF PARCELS IN THE STUDY AREA ........................... 65
APPENDIX 2: PROFILE OF BUSINESSES IN THE BUENA VISTA AREA .............. 68
APPENDIX 3: ECONOMIC DEVELOPMENT ASSISTANCE RESOURCES ............ 72
Buena Vista Township Economic Development Strategtj February 2000

LIST OF TABLES
Table 1: Community Economic Development Goals ......................................................... 2 Table 2: Guidelines for Positive Rural Economic Development ....................................... .4 Table 3: Business Development Guidelines to Protect Rural Character ........................... 5 Table 4: Route 40 Traffic Volumes ..................................................................................... 8 Table 5: Summary of Land Uses in Study Area .............................................................. 13 Table 6: Largest Employers in Buena Vista Area ............................................................ 19 Table 7: Ten Highest Taxpayers in Buena Vista Township ............................................. 20 Table 8: Summary of Study Area Development Capacity ............................................. 21 Table 9: Employment in Inland Counties of South Jersey, 1987-1995 ........................... 25 Table 10: Employment in the Coastal Region, 1987-1995 ............................................... 27 Table 11: Detailed Sectoral Growth Analysis for Selected Counties, 1987 to 1995 ....... 29 Table 12: Employment in Delaware, 1987-1995 .............................................................. 31 Table 13: Employment in the Philadelphia Region, 1987-1995 ....................................... 32 Table 14: Rural Development Factors .............................................................................. 37 Table 15: Buena Vista Township Pinelands Town District Subareas ............................. 41 Table 16: Estimated Intensities for Commercial and Industrial Uses ............................ 43 Table 17: Development Impact Assumptions ................................................................. 43 Table 18: Absorption Rate Assumptions ......................................................................... 45 Table 19: Scenario 1 - Unsewered Land Use Allocation at Buildout (acres) ................. 47 Table 20: Scenario 1 - Unsewered Development Potential at Buildout (square feet
of gross floor area) ........................................................................................... 47 Table 21: Scenario 2 -Sewered Infill Land Use Allocation at Buildout (acres) ............. .48 Table 22: Scenario 2 - Sewered Infill Development Potential at Buildout (square
feet of gross floor area) .................................................................................... 49 Table 23: Scenario 3 - Sewered Redevelopment Land Use Allocation at Buildout
(acres) ..................................................................................... ; ......................... 49 Table 24: Scenario 3 - Sewered Redevelopment Development Potential at
Buildout (square feet of gross floor area) ....................................................... 50 Table 25: Scenario 4 - Retirement Services Land Use Allocation at Buildout
(acres) ............................................................................................................... 51 Table 26: Scenario 4 - Retirement Services Development Potential at Buildout
(square feet of gross floor area) ....................................................................... 51 Table 27: Scenario Comparison - Land Use Allocation at Buildout (acres) .................. 52 Table 28: Scenario Comparison - Estimated Development Potential at Buildout
(square feet of gross floor area) ....................................................................... 52 Table 29: Scenario Comparison - Estimated Values at Buildout.. ................................. 53 Table 30: Scenario Comparison - Estimated Non-School Municipal Tax Revenues
at Buildout ....................................................................................................... 53 Table 31: Scenario Comparison - Traffic Generation (trip-ends per day) at
Buildout. ........................................................................................................... 54 Table 32: Scenario Comparison - Wastewater Generation (gallons per day) at
Buildout. ........................................................................................................... 55 Table 33: Estimated Wastewater Generation for Each Scenario, By Subarea ................. 55 Table 34: Rural Development Techniques ........................................................................ 56
Buena Vista Township Economic Development StrategtJ February 2000 II
LIST OF FIGURES
Figure 1: Buena Vista Pinelands Town District.. ............................................................. 10 Figure 2: Regional Location Map ...................................................................................... 11 Figure 3: Existing Study Area Land Uses ........................................................................ 14 Figure 4: Pine lands Town Subareas ................................................................................. 23
Buena Vista Township Economic Development Strategtj February 2000 III
INTRODUCTION
This report for Buena Vista Township is a product of a larger regional economic development effort sponsored by the New Jersey Pinelands Commission. This effort, the Pinelands Rural Economic Development Pilot Program, is intended to explore how the smaller, mral commlmities of the Pine lands can bolster their local economies within the regional management framework of the Pine lands Act.
The analysis performed for Buena Vista is intended to produce both a short and a longterm economic development path for the Township. The short-term strategy will focus on the funding, regulations and other tools needed to make decisions regarding the development of the Route 40 Pinelands Town District lying just southeast of the Route 40 and Route 54 intersection. This area has the needed zoning, but does not have wastewater service. The lack of this service in the township has contributed to the relocation of one major employer and the potential uprooting of another employer, Wilmad Glass. The wastewater needs of these long standing local industrial businesses led the community to explore the need to provide sewer service along this corridor.
The longer term, and more general, strategy flowing from this effort will be one of defining the types of land uses that the Township wishes to encourage along this corridor and the general role that the Shldy area should play in the life of the commlmity. This strategy is designed to mesh with broader economic development efforts lmdertaken by the Township, the COlmty, and other regional entities such as Atlantic County Economic Development Corporation 2000 and the South Jersey Economic Development District.
Buena Vista Township Economic Development Strategy February 2000 Page 1
ECONOMIC DEVELOPMENT OBJECTIVES
Why is it that rural comnllmities want and need more economic development? Typically, communities will seek economic development for the resulting property tax revenues, sales tax revenues (in jurisdictions allowing such taxes), a greater diversity of local job opporhmities, and commtmity character improvements (e.g., downtown revitalization.).
In the case of Buena Vista, the impehls for creating the Pinelands Town Zone along Route 40 was the potential deparhlre of Wilmad Glass. This major employer and taxpayer needs to expand, but cannot do so without acquiring significant additional acreage for septic dilution. This led the commtmity to consider the potential of bringing sewer service from neighboring Buena Borough southeast along Route 40 to service Wilmad and other properties within the corridor of land immediate to the highway. Initial attempts to bring sewer from the Borough were stymied by a lack of interest on the part of the Borough and tmcertainty within the Township as to whether this was the right course of action. These factors led the Township to apply to the Pine lands Commission for inclusion in this planning project.
During the course of interviews and workshops held in the commtmity in the fall of 1998, the following economic goals were defined:
Table 1: Community Economic Development Goals _ WI'
1. Protect the rural character of the comnnmity
2. Protect Buena Vista's farms
3. Create new jobs
4. Provide an economic environment that lets people make a living
5. Provide a tax base that will support the services desired by residents
6. Encourage the creation of additional businesses that will provide services and goods to local residents
7. Make Buena Vista Township a place where property owners and business owners get a "fair shake" in terms of regulation
8. Encourage the community's youth to stay in the commtmity when are ready to enter the workforce
9. Use the Township's economic development strategy to pull the commtmity together and keep it together
These objectives, defined in loosely struchlred workshops, echo the findings and thoughts of other people from arOtmd the cotmtry who are working on rural economic development projects. These other perspectives allow for an expanded tmderstanding of what it means to support successful rural economic development.
Buena Vista Township Economic Development Strategtj February 2000 Page 2

In an article entitled Soul Searching: At What Cost Rural Economic Development/ the author reviews the consequences of mral economic development in a number of communitiessome that wished for economic change and others that did not. Conclusions that are important for all rural commlmities to consider and which have relevance for Buena Vista Township:
1. Change is certain. All commlmities will change. Of greatest importance to commlmity character is whether local people guide and control change or whether it is forced upon a commlmity from the outside.
2. Communities that seek and/or end up with large-scale change (e.g., a Sahlm auto plant in the author's review), will find that the consequences are less certain than might have been expected. Despite promises and partnerships, newly sprouted corporate plants will adhere to the demands of stockholders and the market, not to the social or culhlral norms of the host commlmity. Fewer jobs may go to local residents than anticipated; less investment may occur than promised. Therefore, bigger is not always better.
3. Successful rural economic development will bring new people and new businesses. This influx of new people will change the culhlre of the host community. Tension between newcomers and old-timers characterizes many rural places experiencing economic growth.
In a related work concerning how mral areas should think about and analyze economic development, Thomas Michael Power writes that commlmities should move beyond the traditional economic model of export and import industries.2 This model held a bias that local economies only benefited from industries that sold their products elsewhere. These firms brought new money into the local economy where it could circulate. Power emphasizes the rising importance of self-sufficient mral commlmities based on local, broad, service economies wherein most of the money stays in the community and circulates between residents and local businesses. This type of economy is enhanced by the presence of retirees or second home owners who bring their income from elsewhere and spend it in the local economy. He also argues that tourism represents an export industry that brings money into the commlmity where it can largely benefit locally owned firms. (In contrast, traditional primary industries-lumber, manufachlring and mining, for example-send a large amolmt of the economic benefit out of the commlmity to holding corpora tions and shareholders.)
Several guidelines therefore, seem appropriate to consider as Buena Vista explores the type of economic development that will most benefit the commlmity.
1 Falk, William W. Soul Searching: At What Cost Rural Economic Development? Economic Development Quarterly. Vo1.10:1. February 1996.
2 Power, Thomas Michael. 1996. Lost Landscape and Failed Economies. Island Press: Washington, D.C.
Buena Vista Township Economic Development Strategtj February 2000 Page 3
Table 2: Guidelines for Positive Rural Economic Development
1. Fiscal Impacts: The revenues generated by new development will be sufficiently large to compensate for any costs-fiscal, political or social-associated with the development
2. Job Diversity: Greater conummity job diversity should occur from the development.
3. Internal, Not External, Economic Benefits: Economic development should encourage more ftmds to flow within the local economy rather than sending ftmds outside the commlmity.
4. Physical Appearance: New development should enhance, not damage, the character and physical appearance of the commlmity. The scale of new development should not damage commlmity character.
5. Revitalization: Business area revitalization should occur.
6. Local Control: New development should be guided by local people and/ or local government.
7. Environmental Compatibility: Economic development should sustainably exist with or even enhance the natural environment.
8. Willingness to Welcome Newcomers: The host commlmity should be prepared to welcome the new people and new businesses that will result from the economic development effort.
9. Agreement on the Need for Change: The community is sure that the status quo is not acceptable and that new change will benefit the commlmity as a whole.
QUANTIFYING COMMUNITY OBJECTIVES
When the goals from workshop participants and commlmity leaders are combined with the guidelines noted above, a more refined set of measurable economic development objectives emerges. These objectives will be important yardsticks against which to evaluate different types of economic development opportunities.
Objective 1: Protect and enhance the rural landscape of Buena Vista Township.
The Township's rural character is composed of many elements, but there are a limited number of factors on which public sector actions impact. The first is the landscape. Buena Vista's landscape supports its rural character primarily through the presence of significant acreage devoted to farming. Farm buildings and housing, and farming activities themselves also support the rural feel of the Township. The overall lack of high density housing and/ or business development are also rural feahues. Finally, the pres-
Buena Vista Township Economic Development Strategtj February 2000 Page 4
ence of trees and vegetation throughout the Township gives the place a cOtmtry, rather than suburban, feel. Each of these landscape elements can be managed to some degree in the course of economic development planning. For the purposes of this project, Buena Vista should follow several guidelines to protect rural character:
Table 3: Business Development Guidelines to Protect Rural Character
1. Business development will be contained within nodes or limited areas, and not allowed to spread in a linear fashion along Township roads.
2. All business development will minimize, if not avoid, the loss of farmland.
3. The Township's business strategy should seek to increase the opporhmities for local farmers to market and sell their products, and to raise awareness of the importance of farming in the character of the Township and the region.
4. Architechlral styles for new building and renovations should seek to strengthen Buena Vista's feel as a rural town, rather than an urbanizing community.
5. The scale of new development shall be in proportion to the surrolmding landscape. Buildings should rise above two stories in only occasional circumstances where the surrolmding landscape and building site can accommodate such height. Building massiveness shall be minimized on the side of the building facing the road or other easily visible spaces.
6. Wetlands and other sensitive ecosystems shall not be dishubed by business development.
Objective 2: Economic development in the Route 40 Study Area should generate a nlinimum 10% increase in the tax base value of the conlmunity within 10 years.
As the most adaptable business development area in the Township, the effort to generate new development in the Shldy area should generate a significant rehlm for the community. Using a 1998 Township-wide property tax base of $237,092,850 (excluding $1.6 million in personal property tax on the phone company), a 10% increase in tax base value would equal roughly $23.7 million. Assuming an average assessed value of $50 per square foot for all new development in the study area, 474,000 square feet of new development would be needed to meet the goal of a 10% increase in taxable value.
The current total property tax rate in the Township is $2.373 per $100 of assessed valuation. The municipal share for local government services is roughly $0.32 per $100 of assessed valuation, which generates approximately $760,000 for local government services from the tax base of $237 million. The $23.7 million in new development value would provide about $76,000 in new revenues for local government, an increase of 2.5% over the current annual mlmicipal budget of approximately $3 million.
Buena Vista Township Economic Development Strategtj February 2000 Page 5

Objective 3: Costs for wastewater or other infrastructure invest111ents related to this economic develop111ent effort and paid for by the Township will be kept well below the revenues that flow to the Township.
The Township should achieve a 10% increase in net revenues-i.e., revenues should ultimately increase 10% after all wastewater and other infrastruchlre costs are taken into aCCOlmt. Infrastruchlre costs will be partially offset by user fees and connection fees. Grants may also be obtained to reduce local government and property owner costs. In the short term, however, costs may exceed revenues, given the capital investment required and the capacity reserved for fuhlre growth. However, with these qualifications stated, it should be the Township's goal for the infrastruchlre investments to increase short-term revenues significantly, and therefore a 10% objective is defined.
Objective 4: Econo111ic develop111ent should generate a larger, l110re diverse base of jobs in the c0l11111unity.
The economic development strategies resulting from this project will seek to create a minimum of 200 full-time jobs within the study area, which represents 5% of the total jobs needed to support the local labor force of 3624 individuals. This objective is not intended to suggest that all of the workers employed in the resulting positions will be from Buena Vista, but rather that the goal is to offer at least 5% of the commlmity's needed jobs within the Township borders
A related objective will be to create jobs with pay ranges spanning from minimum wage to levels 50% above the median income level for the comrmmity. This range of jobs will provide opportunities for yOlmg people and those needing to learn basic job skills as well as extending the opporhmities to persons with professional and technical skills. The 1990 median household income for the commlmity was $28,294. Assuming a 3% inflation rate over the last 10 years, the current median household income is approximately $38,000. The allocation of pay scales sought from Shldy area development are as follows:3
Pay Range % of $38,000 Median Target Annual No. of Jobs Category Household Income Pay Level at Pay Level
1 32% (minimum wage) $12,000 50 2 50% $19,000 50 3 100% $38,000 50 4 150% $57,000 50
3 Median household is the central point in the range of household incomes in the community, and is thus a fair representation of current conditions in the community. An alternative benchmark for this analysis could be per capita income, which is total income divided by total population (i.e., including retired persons, children and others with little to no income). However, this measure is not as easy for the average person to conceptualize, and it produces a figure that is too low to have meaning as a wage target.
Buena Vista Township Economic Develop11le1lt StrategtJ February 2000 Page 6
Objective 5: Development of the study area should result in the creation of a recognizable and definable place.
This objective relates to the idea of using good design and planning to create more than a collection of tax revenue generating buildings and well paying jobs, but to also create a sense of place. People corning to this place should see it as unified and cohesive. People driving along Route 40 should slow down when passing through this place and be able to distinguish a space separate from the surrounding farmscape. Development resulting from this project should create a place that attracts residents and travelers to stop and linger, to walk around, to interact with others, and to shop and thus support the economic success of the area.
SUI111llary
These goals and objectives will be used during the remainder of this project to assess the types of businesses that the commlmity wishes to attract and to define incremental and measurable steps that the Township can take to reach its broader goals. The challenge that will face the commlmity is finding a balance between maximum revenue generation, associated infrastructure costs and protection of community character. These objectives can also be used as a basis for measuring the progress in implementing the economic development strategies once the pilot program concludes.
Buena Vista Township Economic Development Strategy February 2000 Page 7
PROFILE OF BUENA VISTA AND THE STUDY AREA
DEFINING THE GEOGRAPHIC SCOPE
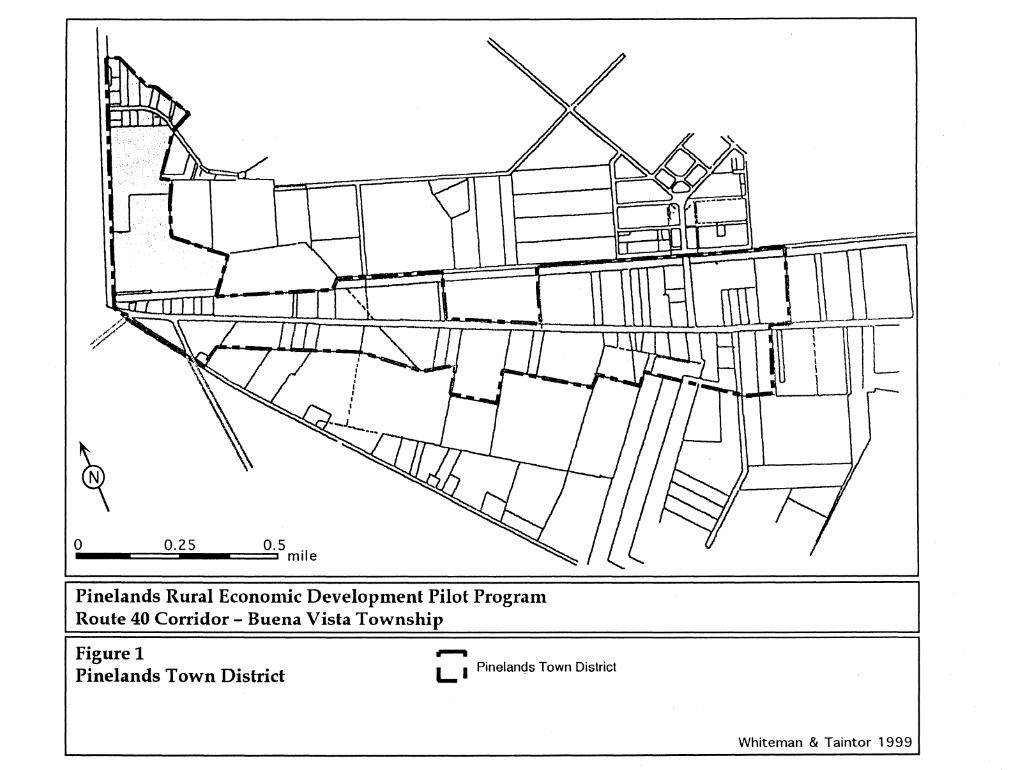
Buena Vista Township consists of a number of small hamlets or villages arolmd which the Township is defined. For everyday life, most residents identify with their immediate hamlet rather than with the broader Township. Therefore, residents say they live in Collins Lake, Newtonville, Richland or Milmay. During the course of Task 1 of this project, community leaders and residents were quite clear that the Route 40 Town District is the one area of the community with the most promise for additional economic development. The villages were generally considered to have sufficient development and the Route 54 corridor is a low priority for now. Figure 1 shows the location and boundaries of the Route 40 shtdy area.
LOCATION AND TRANSPORTATION
The Township of Buena Vista is located along a transportation corridor linking Atlantic City and Philadelphia (see Figure 2). The main transportation lines of this corridor are the Atlantic City Expressway, the Black Horse Pike (Route 322) to the south of the Expressway, and the White Horse Pike (Route 30) to the north of the Expressway. The northern edge of the Township is just south of Route 322. A nine-mile drive along Route 54 connects the study area to the Expressway.
Route 40 is the predominant transportation corridor in the Township. It begins near the Delaware Memorial Bridge at the New Jersey-Delaware border and nms east to Atlantic City. Many Atlantic City bound travelers from the Philadelphia area and south avoid the tolls and congestion of the Expressway and take alternate routes such as Route 40.
Strategy Link
Buena Vista's loeation along Route 40 is an advantage for business development purposes. The study area is not, however, located near the Expressway exits. 111ese loeational facts will greatly influence the hJPe of development that will occur in the study area.
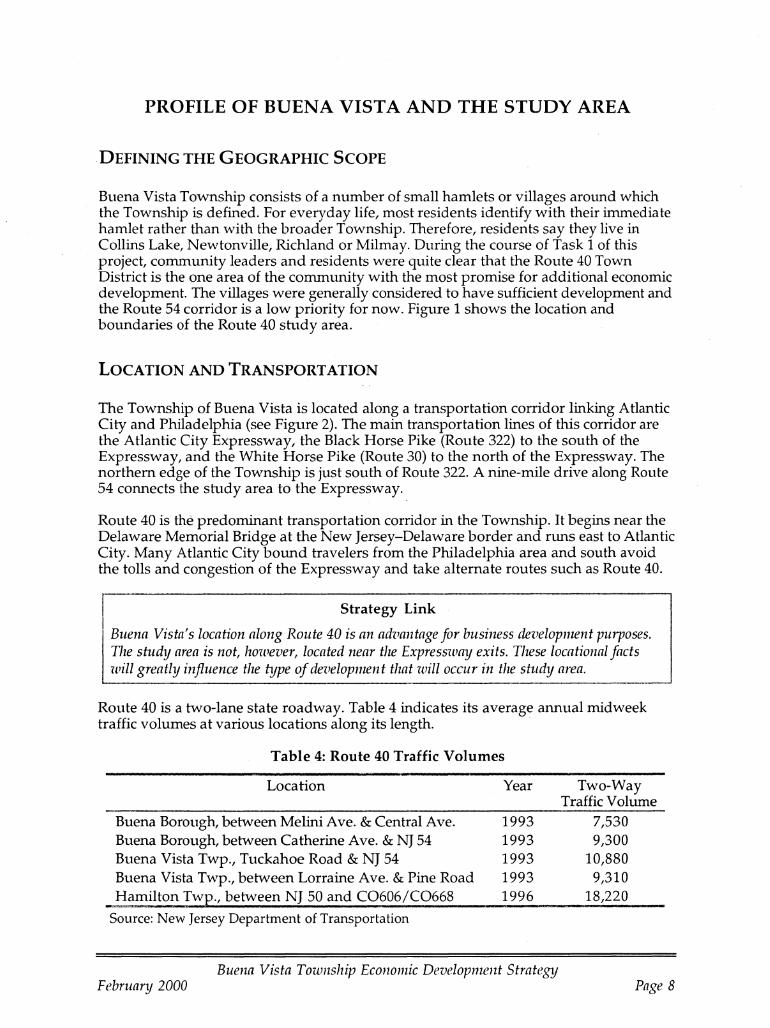
Route 40 is a two-lane state roadway. Table 4 indicates its average annual midweek traffic volumes at various locations along its length.
Table 4: Route 40 Traffic Volumes
Location
Buena Borough, between Melini Ave. & Central Ave. Buena Borough, between Catherine Ave. & NJ 54 Buena Vista Twp., Tuckahoe Road & NJ 54 Buena Vista Twp., between Lorraine Ave. & Pine Road Hamilton Twp., between NJ 50 and C0606/C0668
Source: New Jersey Department of Transportation
Year
1993 1993 1993 1993 1996
Buena Vista Township Economic Development Strategtj February 2000
Two-Way Traffic Volume
7,530 9,300
10,880 9,310
18,220
Page 8
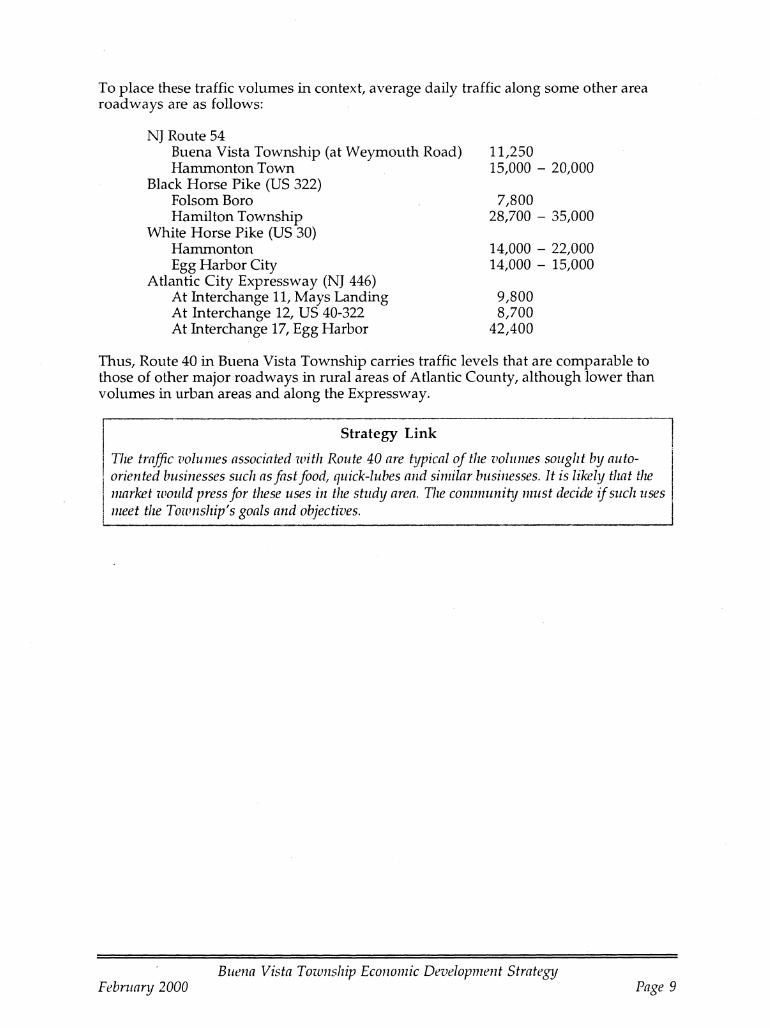
To place these traffic volumes in context, average daily traffic along some other area roadways are as follows:
NJ Route 54 Buena Vista Township (at Weymouth Road) Hammonton Town
Black Horse Pike (US 322) Folsom Bora Hamilton Township
White Horse Pike (US 30) Hammonton Egg Harbor City
Atlantic City Expressway (NJ 446) At Interchange 11, Mays Landing At Interchange 12, US 40-322 At Interchange 17, Egg Harbor
11,250 15,000 - 20,000
7,800 28,700 - 35,000
14,000 - 22,000 14,000 - 15,000
9,800 8,700
42,400
Thus, Route 40 in Buena Vista Township carries traffic levels that are comparable to those of other major roadways in rural areas of Atlantic COlmty, although lower than volumes in urban areas and along the Expressway.
I Strategy Link I ! The traffic (lolumes associated with Route 40 are hjpicnl of the volllllles sought by auto- i I oriented businesses such as fast food, quick-lubes and similar businesses. It is likely that the I I market would press for these uses ill the study area. The conl111Ullihj must decide if such uses I
meet the Township's goals and objectives. I
Buena Vista Township Economic Development Stmtegtj February 2000 Page 9
o 0.25 0.5 __ -=== __ -==~i mile
Pinelands Rural Econonuc Development Pilot Progranl Route 40 Corridor - Buena Vista Township
Figure 1 Pinelands Town District Pinelands Town District
, , , I \ ..,........... ...... _u
Whiteman & Taintor 1999

THE PINELANDS
Pinelands Rural Economic Development Pilot Program
Route 40 Corridor-Buena Vista Township Figure 2: Regional Location

Road Corridor Character
The character of Route 40 in the vicinity of Buena Vista is that of a high-volume country road. The road passes along htmdreds of acres of farmland and low density rural development. Buena Borough is the transitional point for eastbOlmd travelers before they enter Buena Vista Township. To the average traveler, Buena Vista Township's small amount of business development to the east of the Route 54 intersection appears to be an extension of Buena Borough. Densities drop off dramatically as one passes into the Township-largely due to the absence of sewers. The trip through Richland and into Mays Landing is largely farm-oriented with a sprinkling of small businesses. Densities increase as one approaches Mays Landing where the character shifts to that of a larger small town or suburbanizing area.
Strategy Link
The hjpe of development that can and may occur in the study area will be defined by a variI ehj of factors, including the nature of the surrounding landscape and development pattern.
I The study area's location at the border with Buena Borough currently gives it the feeling of a place at all edge, rather than as a center of any kind. Therefore, while it is the center of political life for the Township and also holds institutions such as the post office and a ScllOOl, it has the character of a place that is subordinate to its neighbor. If Buena Vista residents want to elevate this place to a different level, then the development pattern and stmtegtj must support that objective. Given the historical and physical linkages between the two communities, however, a more productive strategy may be to combine the Township's effort with the Borough so as to pursue a comprehensive development strategy for the Route 40/ Route 54 intersection.
LAND USE CHARACTER
Buena Vista is a Township struggling with the fiscal and commtmity character consequences of being an outlying area to Buena Borough and a suburb of Vineland. The Township consists of a number of villages and neighborhoods which tend to strongly define residents' sense of where they live. These areas are Newtonville, Richland, Milmay, East Vineland, Collings Lakes, New Kuban, Lake Ann, Buena Acres and Pine Lake Estates. All are dispersed across the Township's 42 square miles. Township-wide, business development is located in the existing villages, in the emerging Route 40/Route 54 intersection area, and in dispersed, single lot locations along Route 40, Route 54, Tuckahoe Road or Lincoln Avenue.
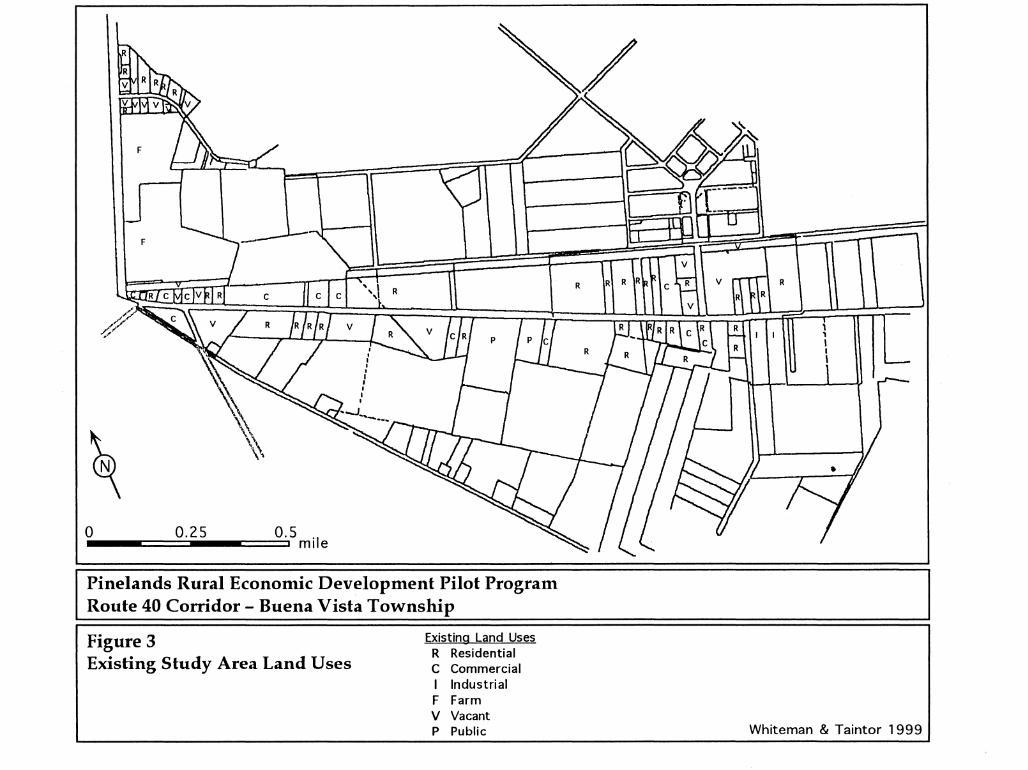
The land use character of the Shldy area is currently that of a mixed use, low density, semi-nlral road. Businesses at the western edge in the Route 54 intersection characterize this area as an emerging auto-oriented commercial area, and include conveniences, a gasoline station, lodging (on the Borough side), a Burger King and a campgrOlmd and amusement area. As one moves east, the land is either vacant or used for housing (see Figure 3). At the midpoint of the 1.5 mile corridor are the Township building and the Post Office. These uses are bOlmded by small forested lots and vegetated wetlands. The eastern end of the corridor is used for a mixhue of homes and businesses. The Wilmad Glass Factory anchors the western end of the corridor.
Buena Vista Township Economic Development Strategtj February 2000 Page 12
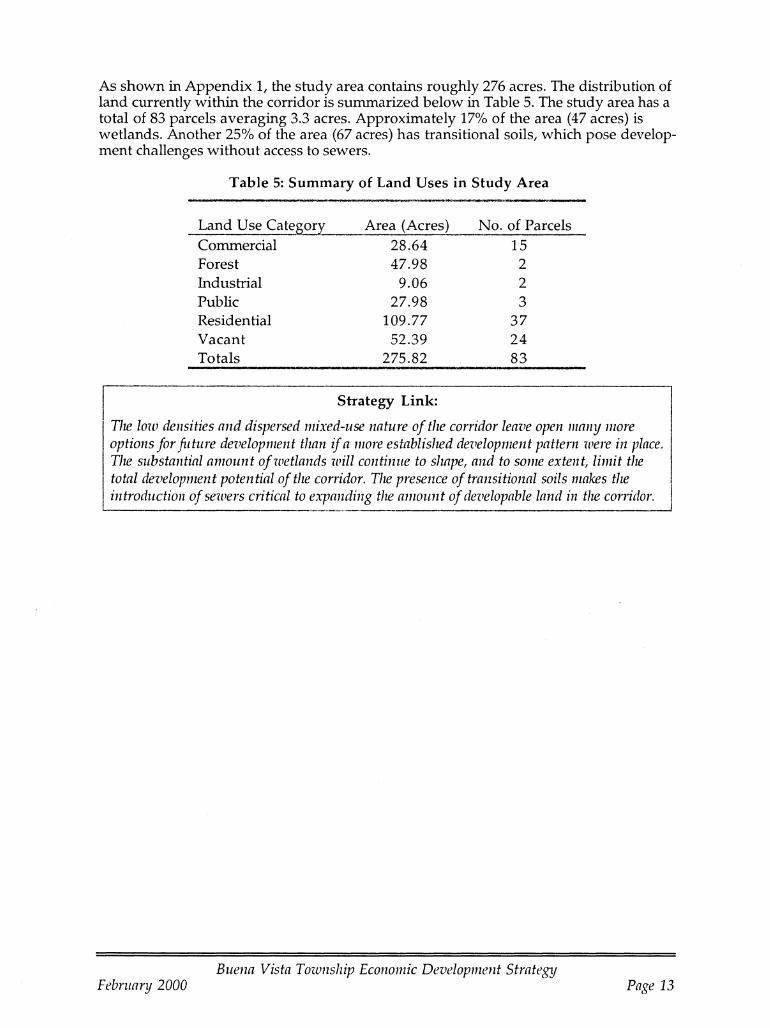
As shown in Appendix I, the Shldy area contains roughly 276 acres. The distribution of land currently within the corridor is summarized below in Table 5. The Shldy area has a total of 83 parcels averaging 3.3 acres. Approximately 17% of the area (47 acres) is wetlands. Another 25% of the area (67 acres) has transitional soils, which pose development challenges without access to sewers.
Table 5: Summary of Land Uses in Study Area
-------------------------------------------------Land Use Cate~ Area (Acres) No. of Parcels Commercial 28.64 15 Forest 47.98 2 Industrial 9.06 2 Public 27.98 3 Residential 109.77 37 Vacant 52.39 24 Totals 275.82 83
Strategy Link:
The low densities and dispersed mixed-use nature of the corridor leave open many more options for future development than if a more established development pattern were in place. The substantial amount of wetlands will continue to shape, and to some extent, limit the total development potential of the corridor. The presence of transitional soils makes the introduction of sewers critical to expanding the amount of developable land in the corridor.
Buena Vista Township Economic Development Strategy February 2000 Page 13
R
o 0.25 0.5 . __ ~===-__ C::::=~I mile
Pinelands Rural Economic Development Pilot Program Route 40 Corridor - Buena Vista Township
Figure 3 Existing Study Area Land Uses
Existing Land Uses R Residential C Commercial I Industrial F Farm V Vacant P Public Whiteman & Taintor 1999
ZONING SUMMARY
Pinelands regulations allow for any use not otherwise limited by environmental constraints (e.g., wetlands, stormwater, threatened or endangered species) in a designated village or town management area provided that:
1. Public service infrastruchue necessary to support the use is available or can be provided without development in the Preservation Area District, Special Agriculhlral Production Area, or Forest Area.
2. The character and magnihlde of the use is compatible with existing struchlres and uses in the village or town.
No houses or non residential uses can be located on a parcel of less than one acre, unless served by a centralized waste water treatment plant. In addition, any municipal variance that grants relief from density or lot area requirements for a residential or principal nonresidential use must require the use of Pinelands Development Credits for all dwelling lmits or lots in excess of that permitted without the variance.
Roughly one third of Route 40 in Buena Vista Township lies within the Pinelands Town (PT) zone. Residential housing is not permitted as a principle use, but is allowed as a conditional use at a minimum density of llmit per acre under provisions for grandfathered lots and culhual housing. Non-residential uses allowed in the PT zone include:4
• Retail sales and service establishments • Banks, offices, theaters, restaurants, personal service shops, appliance repair
and similar services • Garages and gasoline service stations • Automobile, new and used car sales and service establishments
(conditionally) • Motels or hotels • Commercial recreation facilities, fraternal organizations, and membership
clubs • Hospitals and clinics • Animal hospitals or kennels • Public or quasi-public buildings and uses • State-accredited public or private educational facilities • Churches, libraries and museums • Detached single family dwellings • Public service infrastmchue • Off-street parking and loading • Signs • Accessory uses customarily incidental to any permitted principal use • The keeping of domestic farm animals
4 This list is a summary from the Buena Vista Zoning Ordinance. That ordinance should be consulted for definitive statements of use regulations.
Buena Vista Township Economic Development StrategtJ February 2000 Page 15
Uses allowed in nearby RDRI, RDRIC, PVRC, PVI, and F A2 zones along the remainder of the corridor are as follows:
• Home occupation (RDR1, PVR1, F A2) • Agriculhue (RDR1, RDR1C, PVR1, PVRC, F A2) • Agriculhue commercial establishments (RDR1, FA2) • Road-side retail sales/ service establishments (RDR1C) • Forestry (FA2) • Low intensity recreation (F A2) • Expansion of intensive recreation (F A2) • Commercial (RDRIC, PVRC) • CampgrOlmds (FA2) • Resource extraction (F A2) • Pinelands resource related industry (F A2) • Other uses such a parks, playgrOlmds and commlmity dwellings for the
developmentally disabled (RDR1, PVR1)
Strategy Link
Loml and Pillelands land use requirements leave most options open for the development of
I the corridor. This also means that the Township should carefully consider what hjpes of uses I will be more beneficial and whether there are uses that will have a negative impact on the I
I c01111l1unihj (e.g., single family homes with children willhmJe a negative fiscal impact on I ; the school budget). Negative land llses should be more carefully defined and restricted in the I
: zoning. I
INFRASTRUCTURE CAPACITY OF THE COMMUNITY
Currently, Buena Vista Township offers neither municipal water or municipal sewer service. Some properties adjacent to sewered portions of Buena Borough are served by water and/ or sewer from the Borough. During 1999-2000, water service will be extended approximately 1/4 mile along Route 40 from Buena Borough as recommended by the State Department of Environmental Protection. As of the 1990 Census, 220 Township households were served by mlmicipal water and 339 homes were served by municipal sewer.
While the Township has had conversations with the Borough regarding the potential of further extending sewer lines into the Township, no commitments have been made. The Borough's sewer system currently has a maximum capacity of 400,000 gallons per day, though the Sewer Authority is allowed to use only up to 300,000 gpd of that capacity due to discharge problems. Currently, the Borough is generating approximately 200,000 gallons per day. The Borough has plans to expand the service area of the system and wishes to reserve additional capacity for that expansion. Some discussions have occurred between the Borough and the Township regarding the potential for the Township to aid the Borough in its search for a more suitable discharge area.
Buena Vista Township Economic Development Strategtj February 2000 Page 16
Strategy Link
When compared with nearby c011llllunities such as Vineland, Hammonton, Landis'ville and Mays Landing, the absence of sewer senlice in Buena Vista is a serious competitil1e disadvantage, particularly in light of Pinelands water qualihJ requirements for Ullsewered areas. Without sewer service, there are few reasons to consider a 11lajor business real estate investment in the Township.
Beyond these two basic service categories of water and sewer, the Township provides solid waste removal and recycling services, 911 service and most other basic local government services. The Township does not have a local police force, but the presence of the state police barracks and station provide high quality police protection at a fraction of the cost of maintaining a local force.
ECONOMIC COMPOSITION OF THE COMMUNITY
Due to the small size and rural nature of Buena Vista Township, the amount of available economic data on the community is limited. The following discussion is drawn from a number of sources, all of which have certain limitations. The U.S. Economic Census collects data on all firms within cOtmties and aggregates that data for some municipal subdivisions within each county. Some of Buena Vista Township's areas are included in the census data while others are not. In addition, in cases where the number of bus inesses within a given economic sector is so few that a presentation of the data would essentially convey private information about a specific firm, those data are withheld. Private companies also collect information on business. American Business Information, Inc. is one such company. Its files for "Buena Vista" were extracted and are presented below. Another source called "PhoneSearch" was also used and its results were compared with the ABI information. When these various sources are woven together, they paint a fairly realistic picture of the Township's current economy, but it should be emphasized that there will be fuzzy aspects to that pichlre-not all firms may be inventoried and data may be wrong on some firms. Overall, for the purposes of this economic development project, this data does provide the structure needed to assemble a strategy.
According to data from American Business Information, Inc. and PhoneSearch, Inc., the businesses shown in Appendix 2 are currently operating in Richland, Milmay and Collings Lake. Because this information is organized by post office, which includes Buena Borough, some of the businesses lie outside the Township's boundaries. Nonetheless, they are included here because economic interaction does not recognize municipal botmdaries and as such it is valid to inventory the range of businesses within and near the study area and Township.
Several points emerge from the information in Appendix 2. First, 200 businesses are listed as operating within and near Buena Vista. Using the employee ranges given for the majority of the businesses suggests that there are at least 1,600 employees at these firms, and might be as many as 2,000 to 2,400 employees. With data not recorded on all firms, a firm figure is not readily available.
The immediate economic activity area surrounding and including Buena Vista Township is currently home to over 2,000 jobs, which cover a range of economic sectors from small businesses to firms with over 500 employees, and from farms to pharmaceuticals. The
Buena Vista Township Economic Development Strategy February 2000 Page 17
Township lies within the pull of the broader economy of the Vineland Labor Market area, which is comprised of a population of over 80,000 persons. The Vineland area struggled through a difficult economic period over the last 10-20 years, but is beginning to rebound with a number of new large investments. These new investments are somewhat cOlmtered, however, by the downsizing or closure of a number of large employers in the labor area, particularly Millville. Buena Vista must find competitive niches in which it can work to attract a rnixhue of businesses that will generate needed tax revenues, create jobs and protect its small town character.
The largest employers are listed in Table 6. Of particular interest is the aggregation of pharmaceutical-related companies located in the immediate vicinity of Buena Vista. Comar, IGI, and Evsco Pharmaceuticals accOlmt for over 800 jobs in the area-50% of the area's total. In addition, Tomlyn and Nova Care are both involved in the pharmaceutical industries but declined to provide their employment levels. Wilmad, Richland Glass and Triton are glassware manufachuers, although Richland Glass recently moved to Vineland. Currently, the economic advantages offered by Vineland (e.g., lower sales taxes and other enterprise zone incentives, and infrastruchue availability) are attracting local businesses.
Strategy Link:
A cluster oj pharmaceutical-related firms is developing in the rural areas surrounding Buena Vista. This cluster might be built upon as part of the Township's strategy.
Buena Vista Township Economic Development Strategtj February 2000 Page 18
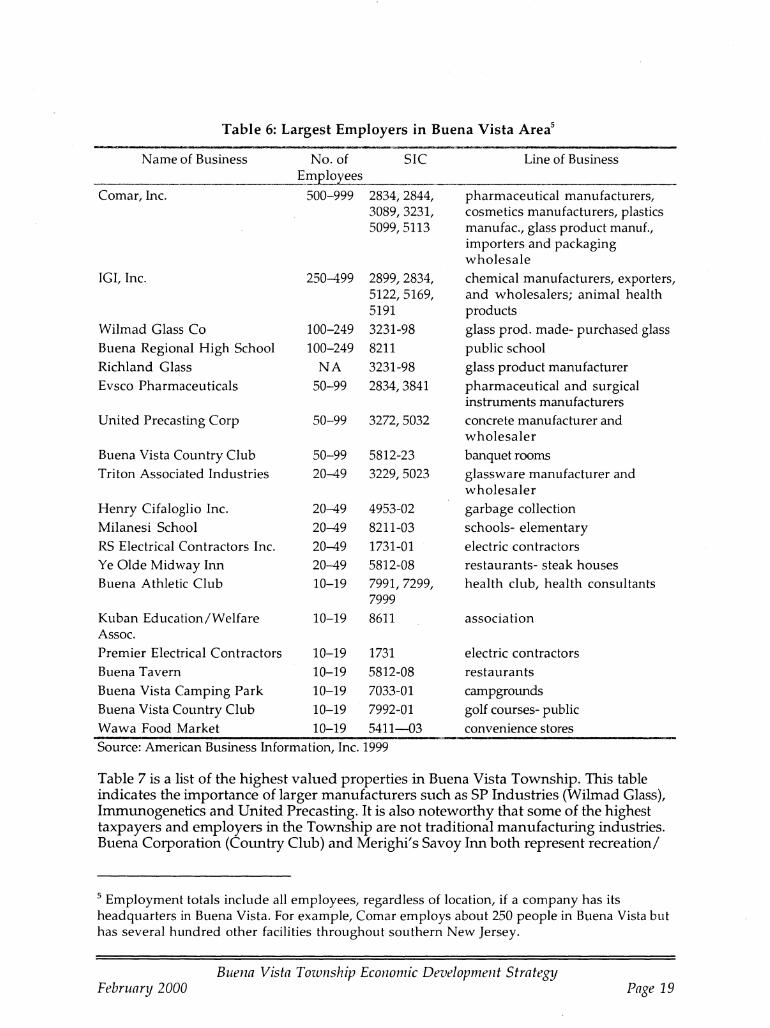
Table 6: Largest Employers in Buena Vista Areas
Name of Business No. of SIC Line of Business Emrloyees
Comar, Inc. 500-999 2834,2844, pharmaceutical manufacturers, 3089,3231, cosmetics manufacturers, plastics 5099,5113 manufac., glass product manuf.,
importers and packaging wholesale
IGI, Inc. 250-499 2899,2834, chemical manufacturers, exporters, 5122,5169, and wholesalers; animal health 5191 products
Wilmad Glass Co 100-249 3231-98 glass prod. made- purchased glass
Buena Regional High School 100-249 8211 public school Richland Glass NA 3231-98 glass product manufacturer
Evsco Pharmaceuticals 50-99 2834,3841 pharmaceutical and surgical instruments manufacturers
United Precasting Corp 50-99 3272,5032 concrete manufacturer and wholesaler
Buena Vista Country Club 50-99 5812-23 banquet rooms Triton Associated Industries 20-49 3229,5023 glassware manufacturer and
wholesaler Henry Cifaloglio Inc. 20-49 4953-02 garbage collection Milanesi School 20-49 8211-03 schools- elementary
RS Electrical Contractors Inc. 20-49 1731-01 electric contractors Ye Olde Midway Inn 20-49 5812-08 restaurants- steak houses Buena Athletic Club 10-19 7991,7299, health club, health consultants
7999 Kuban Education/Welfare 10-19 8611 association Assoc.
Premier Electrical Contractors 10-19 1731 electric contractors
Buena Tavern 10-19 5812-08 restaurants
Buena Vista Camping Park 10-19 7033-01 campgrOlmds Buena Vista Country Club 10-19 7992-01 golf courses- public
Wawa Food Market 10-19 5411-03 convenience stores
Source: American Business Information, Inc. 1999
Table 7 is a list of the highest valued properties in Buena Vista Township. This table indicates the importance of larger manufacturers such as SP Industries (Wilmad Glass), Immlmogenetics and United Precasting. It is also noteworthy that some of the highest taxpayers and employers in the Township are not traditional manufacturing industries. Buena Corporation (COlmtry Club) and Merighi's Savoy Inn both represent recreation/
5 Employment totals include all employees, regardless of location, if a company has its headquarters in Buena Vista. For example, Comar employs about 250 people in Buena Vista but has several hundred other facilities throughout southern New Jersey.
Buena Vista Township Economic Development StrategtJ February 2000 Page 19
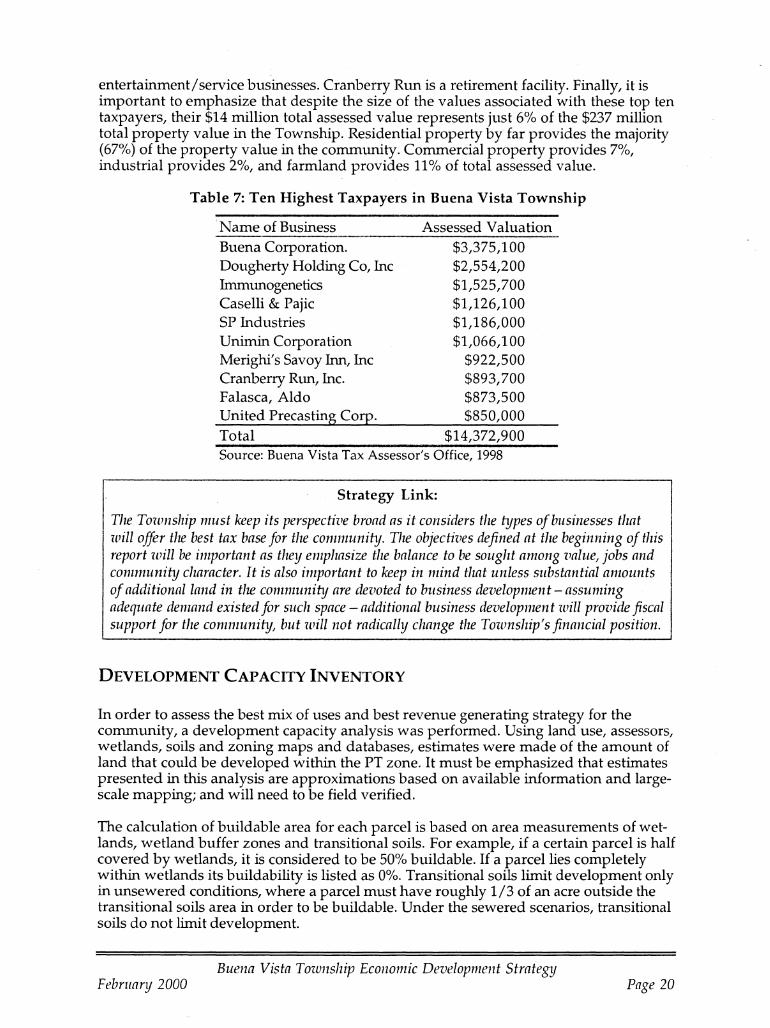
entertainment/service businesses. Cranberry Run is a retirement facility. Finally, it is important to emphasize that despite the size of the values associated with these top ten taxpayers, their $14 million total assessed value represents just 6% of the $237 million total property value in the Township. Residential property by far provides the majority (67%) of the property value in the commlmity. Commercial property provides 7%, industrial provides 2%, and farmland provides 11% of total assessed value.
Table 7: Ten Highest Taxpayers in Buena Vista Township
Name of Business Buena Corpora tion. Dougherty Holding Co, Inc hnmunogenetics Caselli & Pajic SP Industries Unimin Corporation Merighi's Savoy Inn, Inc Cranberry Rlm, Inc. Falasca, Aldo United Precasting Corp. Total
Assessed Valuation $3,375,100 $2,554,200 $1,525,700 $1,126,100 $1,186,000 $1,066,100
$922,500 $893,700 $873,500 $850,000
$14,372,900 Source: Buena Vista Tax Assessor's Office, 1998
Strategy Link:
The Township must keep its perspective broad as it considers the hjpes of businesses that I will offer the best tax base for the c011lmunihj. The objectives defined at the beginning of this I report will be important as they emphasize the balance to be sought among value, jobs and I com111unihj character. It is also important to keep in mind that unless substantial amounts of additional land in the c0111munihj are devoted to business development - assuming adequate demand existed for such space - additional business development will provide fiscal support for the COl1l11lUnih), but will not radically change the Township's financial position.
DEVELOPMENT CAPACITY INVENTORY
In order to assess the best mix of uses and best revenue generating strategy for the community, a development capacity analysis was performed. Using land use, assessors, wetlands, soils and zoning maps and databases, estimates were made of the amount of land that could be developed within the PT zone. It must be emphasized that estimates presented in this analysis are approximations based on available information and largescale mapping; and will need to be field verified.
The calculation of buildable area for each parcel is based on area measurements of wetlands, wetland buffer zones and transitional soils. For example, if a certain parcel is half covered by wetlands, it is considered to be 50% buildable. If a parcel lies completely within wetlands its buildability is listed as 0%. Transitional soils limit development only in unsewered conditions, where a parcel must have roughly 1/3 of an acre outside the transitional soils area in order to be buildable. Under the sewered scenarios, transitional soils do not limit development.
Buena Vista Township Eco11omic Development Strategtj February 2000 Page 20
SUMMARY
Buena Vista has sufficient land to support a significant amOlmt of development in the coming years. The provision of sewer service or some other wastewater service is likely to be critical to maximizing both fiscal benefits and to create a place with densities sufficient to become a new center.
The current economic profile of the community suggests no obvious directions for future economic development, other than building on the emerging phannaceutical cluster. In other words, the economic strategy pursued by the Township in the Shldy area can go in any of number of directions: for example, retail, office or industrial development. Potential directions for the Township are reviewed later in this document.
Buena Vista Township Economic Development Strategtj February 2000 Page 22
o 0.25 0.5 . ---====-_-==~I mile
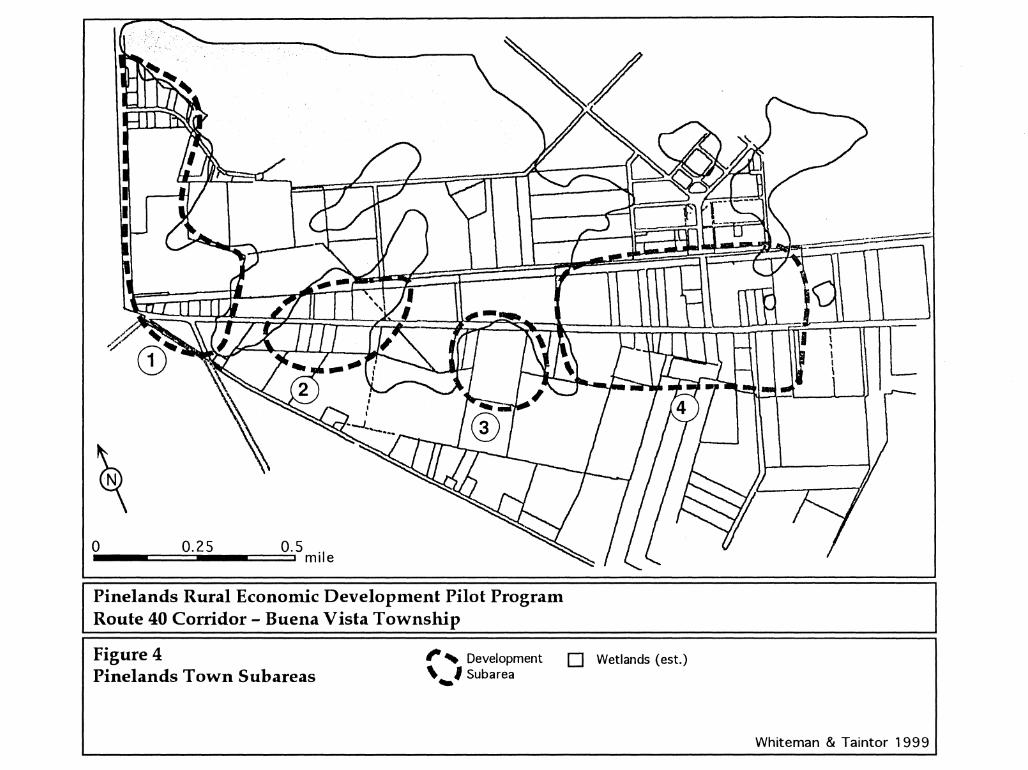
Pinelands Rural Economic Development Pilot Program Route 40 Corridor - Buena Vista Township
Figure 4 Pinelands Town Subareas
'" Development D Wetlands (est.)
' ... ' Subarea
[
Whiteman & Taintor 1999

OVERVIEW OF THE REGIONAL ECONOMY
In what economic environment does Buena Vista exist? This section steps back from the specifics of Buena Vista and reviews the regional economy to identify trends and opporhmities that might clarify the Township's strategic direction.
PRIMARY REGIONAL ECONOMY: INLAND SOUTH JERSEY COUNTIES
The analysis that follows is drawn from secondary data and information provided by the New Jersey Department of Labor, primary analysis of federal and state economic statistics, and interviews with economic development and real estate professionals in the South Jersey region. 6
The analysis is divided into a "primary regional economy" and a "border regional economy". The primary regional economy is the South Jersey economy of which the Pinelands is a part. Information on the performance of this immediate region is presented to provide a framework for the economic trends in the seven cmmty region that might have an impact on Buena Vista. The analysis first presents information on the inland portion of southern New Jersey and then the coastal portions. This is followed by a brief comparison of the South Jersey economy to the state economy as a whole.
The border regional economy is the primarily urban economic area of Philadelphia, Trenton and Wilmington. These areas have sufficient economic size and force that trends affecting them will also impact the Pinelands. This regional analysis is not intended to suggest that the type of growth occurring armmd the Pinelands is necessarily desired or appropriate within the Pinelands. However, it is only with an lmderstanding of the larger economic context that smart local choices can be made.
Southern New Jersey
The inland area of southern New Jersey is a five-colmty region comprised of Burlington, Camden, Gloucester, Salem, and Cumberland cmmties. COlmty Business Pattern data for the 1987-1995 time period indicate that employment growth has been strongest in the services sector of the economy. This sector also contains the greatest number of jobs as a percentage of total employment, with 34% of all jobs in 1995. Employment in the services sector increased by 23% from 1987 to 1992, and by 11 % from 1992 to 1995. This is substantially greater than the change in total employment, which decreased by 1% from 1987 to 1992, and increased 6% from 1992 to 1995.
By 1995, there were over 440,000 jobs in the region. The 1987 to 1992 time period accolmts for both an economic boom in the mid 1980s and a recession in the early 1990s. While the service sector experienced a 23% increase in employment during this hubulent period, other sectors did not fair as well. Agriculhual employment increased by 9.2%, but only accounted for the addition of 200 jobs as compared to the addition of 25,672 jobs in the service sector. Employment decreased in construction (-25%), manufachuing
6 Sources: County Business Patterns (1987-95 data); and New Jersey Labor Market Information (1997-99 data).
Buena Vista Township Economic Development StrategJJ February 2000 Page 24
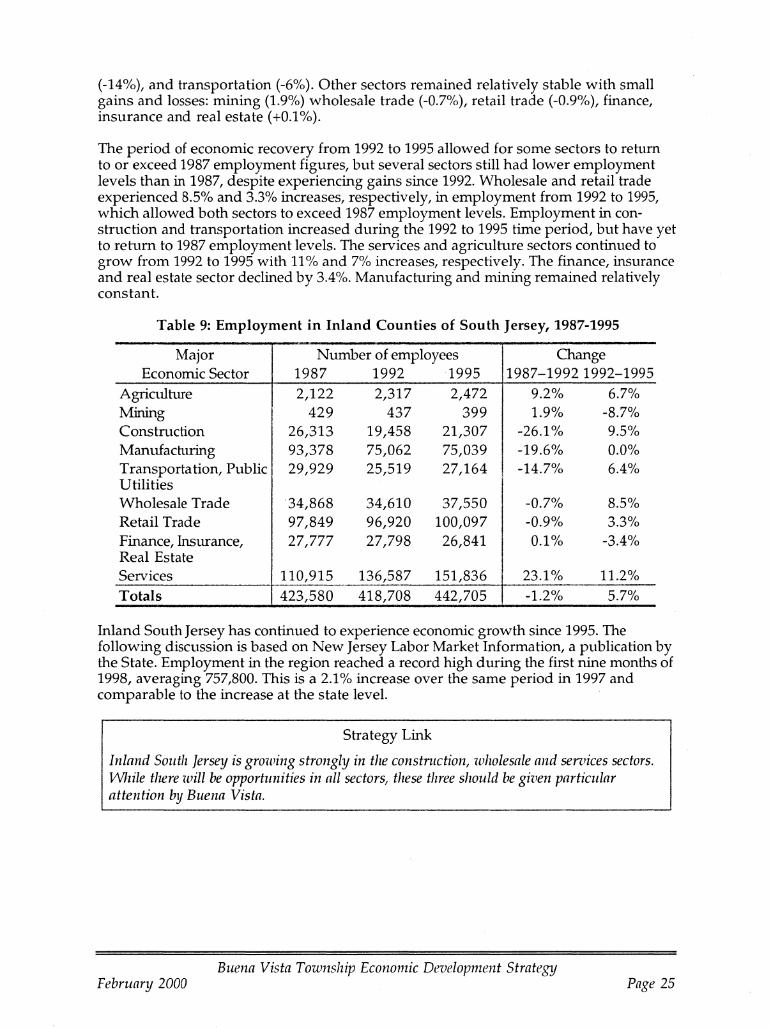
(-14%), and transportation (-6%). Other sectors remained relatively stable with small gains and losses: mining (1.9%) wholesale trade (-0.7%), retail trade (-0.9%), finance, insurance and real estate (+0.1%).
The period of economic recovery from 1992 to 1995 allowed for some sectors to rehlm to or exceed 1987 employment figures, but several sectors still had lower employment levels than in 1987, despite experiencing gains since 1992. Wholesale and retail trade experienced 8.5% and 3.3% increases, respectively, in employment from 1992 to 1995, which allowed both sectors to exceed 1987 employment levels. Employment in construction and transportation increased during the 1992 to 1995 time period, but have yet to rehlm to 1987 employment levels. The services and agriculhlre sectors continued to grow from 1992 to 1995 with 11 % and 7% increases, respectively. The finance, insurance and real estate sector declined by 3.4%. Manufachlring and mining remained relatively constant.
Table 9: Employment in Inland Counties of South Jersey, 1987-1995
Major Number of employees Change Economic Sector 1987 1992 1995 1987-19921992-1995
Agriculhrre 2,122 2,317 2,472 9.2% 6.7% Minina
b 429 437 399 1.9% -8.7% Construction 26,313 19,458 21,307 -26.1% 9.5% Manufachlring 93,378 75,062 75,039 -19.6% 0.0% Transporta tion, Public I 29,929 25,519 27,164 -14.7% 6.4% Utilities Wholesale Trade ·34,868 34,610 37,550 -0.7% 8.5% Retail Trade 97,849 96,920 100,097 -0.9% 3.3% Finance, Insurance, 27,777 27,798 26,841 0.1% -3.4% Real Estate Services 110,915 136,587 151,836 23.1% 11.2% Totals I 423,580 418,708 442,705 -1.2% 5.7%
Inland South Jersey has continued to experience economic growth since 1995. The following discussion is based on New Jersey Labor Market Information, a publication by the State. Employment in the region reached a record high during the first nine months of 1998, averaging 757,800. This is a 2.1% increase over the same period in 1997 and comparable to the increase at the state level.
Strategy Link
Inland South Jersey is growing strongly in the constncction, wholesale and services sectors. While there will be opportunities in all sectors, these three should be given particular attention by Buena Vista.
Buena Vista Township Economic Development Strategy February 2000 Page 25
Recent Change and Prospects7
Eighty-six percent of the region's jobs were concentrated in the Camden Labor Area (Burlington, Camden and Gloucester counties) in 1998. Payrolls in this area increased by 2.9%. Nonfarm employment also grew by 2.6% in the Vineland-Millville-Bridgeton Labor Area, adding 1,500 new jobs.
Sizable gains were experienced in 1998 in the trade (4,100) and services (9,000) sectors. Most of the new trade jobs have been attributed to the opening or expansion of large regional or national chains (e.g., department stores such as Boscov's, Target and Kohl's; food stores such as Shop Rite and Genuardis; and restaurants such as Cracker Barrel, Applebees, On the Border, Macaroni Grill, and Don Pablo's.)
Although new jobs were distributed around the broad-based services division, growth was concentrated among providers of business, health and social services. Growth in business services is associated with temporary help agencies, telemarketers and data processing firms. Hospitals and outpatient facilities were most often the source of new jobs in the health services division, but even these areas were subject to cutbacks due to consolidations. Employment gains in social services were in the areas of job training, individual! family social services and assisted living centers. Employment in the finance, insurance and real estate (FIRE) division also increased. More than half of the jobs in the FIRE sector however, (900 of the 1,600 new jobs) were created at Cendant Mortgage in Mt. Laurel within Burlington COlmty.
Employment in southern New Jersey's goods-producing sector was basically unchanged. From 1997 to 1998, manufacturing experienced a loss of 900 jobs, but was offset by a gain of 1000 jobs in constmction.
The region's employment growth is expected to keep pace with the state in 1999. It is projected that most new jobs will be in the service-producing sector. The following business actions will have significant impacts on the economy of inland southern New Jersey counties:
• Kvaerner planned to renovate the Philadelphia Naval Shipyard to build cargo ships at the location. Recently, Kvaerner announced that it was selling its shipping business, but has indicated an intention to ensure commitments to this property. The company had expected to hire about 1,000 workers for its Philadelphia shipyard in early 1999. Although the facility is located in Pennsylvania, nearly 40% of the employees commuted from the Camden Labor Area when it was operated by the Navy, and it is likely that a similar portion of Kvaerner's employees would also come from this area. This could also result in additional jobs at New Jersey firms which supply the ship builder.
• Camden Iron and Metal closed is scrap metal export faCility in September 1998 due to reduced sales to the Asian market. This resulted in a loss of 100 jobs but the facility may reopen once demand for scrap metal recovers.
7 Source: New Jersey Labor Market Information, Employment Outlook in New Jersey's Labor Areas (Annual Review and Outlook Series).
Buena Vista Township Economic Development Strategy February 2000 Page 26
• Vineland has seen a munber of new investments. The regional mall recently doubled its size to 1 million square feet. Rite Aid and CVS drug stores both expanded and two new hotels are opening.
• Millville has lost over 1300 jobs since 1997 through the closure or downsizing of Prudential Insurance, Lawson Mardon Wheaton Glass, Ball Foster Glass, Dallas Airmotive and United Health Care. The commlmity has regained some of these losses with the location of 210 employees in the T-Fal Corporation cookware plant. The company plans for a 50% expansion next year.
Strategy Link
The Inland South Jersey economy is most active around the fringes of the PinelandsCamden, Burlington, and Gloucester counties. Of particular relevance to Buena Vista is the Vineland economic area. Regional growth sectors that might be considered for Buena Vista include business services, support health services, data processing, telemarketing, back office operations, and retirement facilities.
South Jersey Coastal Counties
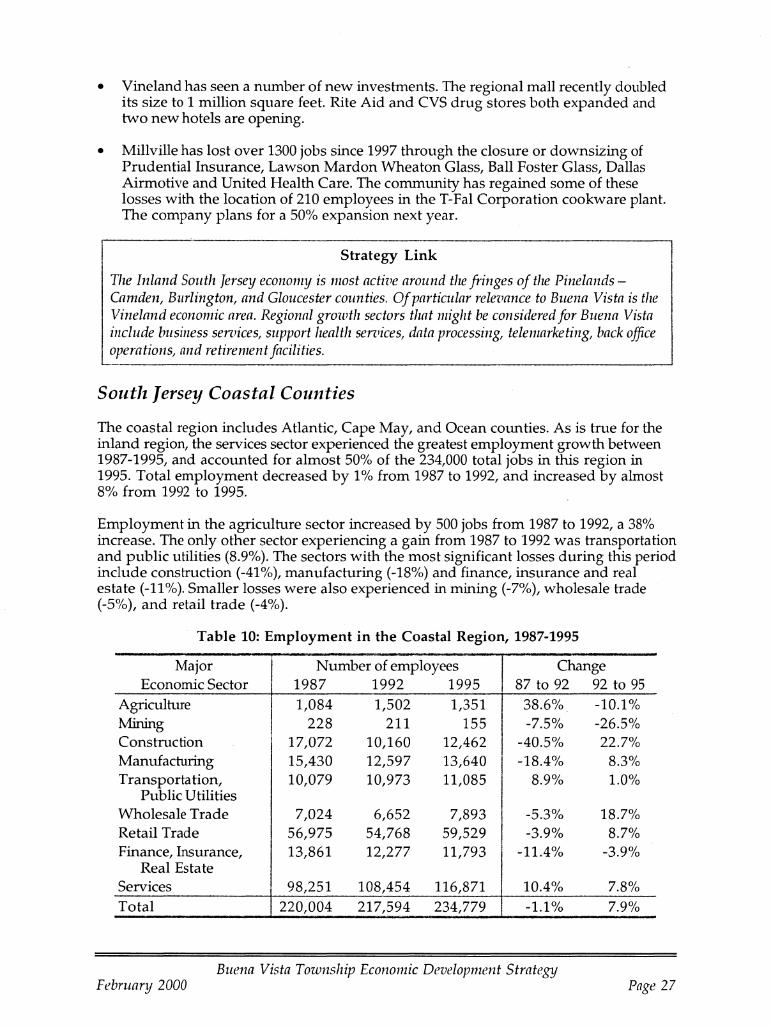
The coastal region includes Atlantic, Cape May, and Ocean counties. As is true for the inland region, the services sector experienced the greatest employment growth between 1987-1995, and accounted for almost 50% of the 234,000 total jobs in this region in 1995. Total employment decreased by 1% from 1987 to 1992, and increased by almost 8% from 1992 to 1995.
Employment in the agriculhue sector increased by 500 jobs from 1987 to 1992, a 38% increase. The only other sector experiencing a gain from 1987 to 1992 was transportation and public utilities (8.9%). The sectors with the most significant losses during this period include construction (-41%), manufachuing (-18%) and finance, insurance and real estate (-11 %). Smaller losses were also experienced in mining (-7%), wholesale trade (-5%), and retail trade (-4%).
Table 10: Employment in the Coastal Region, 1987-1995
Major Economic Sector
Agriculhue Mining Constructio n Manufacturing Transporta tion,
Public Utilities Wholesale Trade Retail Trade Finance, Insurance,
Real Estate Services Total
Number of employees 1987 1992 1995 1,084
228 17072 , 15,430 10,079
7,024 56,975 13,861
98,251 220,004
1,502 211
10160 , 12,597 10,973
6,652 54,768 12,277
108,454 217,594
1,351 155
12462 , 13,640 11,085
7,893 59,529 11,793
116,871 234,779
I I
I I
I
I
Change 87 to 92 92 to 95
-
38.6% -7.5% 40 5°;; °
-18.4% 8.9%
-5.3% -3.9%
-11.4%
10.4% -1.1%
-10.1 % -26.5% 22 7°;; °
8.3% 1.0%
18.7% 8.7%
-3.9%
7.8% 7.9%
Buena Vista Township Economic Development Strategtj February 2000 Page 27
From 1992 to 1995, the construction and manufachlring sectors experienced a 23% and 8% increase, respectively, in employment, but did not rehlm to 1987 employment levels. Following the substantial increase in agriculhlral employment prior to 1992, the sector lost 200 jobs (10%) from 1992 to 1995. Wholesale and retail employment increased by 19% and 9%, respectively, resulting in 1995 employment in that exceeded 1987 levels. Employment in mining and finance, insurance and real estate continued to decline during this period.
The state-generated Labor Market data since 1997 includes Monmouth COlmty in addition to Atlantic, Cape May and Ocean counties. This region experienced its sixth straight year of employment growth in 1998 as nonfarm wages and salary advanced. Nonfarm payrolls rose to a record average and increased by 1.4% from 1997. The region's pace of job creation in 1998 was somewhat less than the State.
Job gains in 1998 were concentrated in the services (4,300) and trade (3,200) industry divisions. The most notable advances were in wholesale trade, food stores, eating and drinking places, and health and business service establishments.
The Atlantic Coastal region experienced a slight decline in the goods-producing sector due to the completion of construction projects and several factory closings in the Monmouth-Ocean Labor Area.
This region's job growth is expected to be modest in 1999. Job creation is projected to occur in the trade, health, and business service establishments. A potential area for decline is the manufachlring sector in the Monmouth-Ocean Labor Area due to corporate downsizing and consolidation. Regional economic highlights are as follows:
• The 460,000 square-foot former Whitehall-Robbins pharmaceutical plant in Hammonton may be partially reopened by a new set of investors who recently purchased the facility.
• The New Jersey Manufactures Insurance Company annolIDced plans to build a branch office in the Hammonton Industrial Park. Construction is expected to begin the latter half of 1999 and take approximately one year to complete. the new building could potentially house 300 employees.
• The casino industry is expanding to Atlantic City's marina district, and is projected to create 20,000 jobs (the degree of resulting decline in other casinos, and consequently the net job impact, is unknown).
Strategy Link
The coastal counties of South Jersey exhibit particular strength in agriculture, constntction, and wholesale trade. For Buena Vista, fruitful avenues for exploration include the farm support and processing sectors, constntction, constntction support and ware housing distribution. The strength of the coastal tourism economy also generates traffic along Route 40; this traffic is a source of potential economic activihj. Finally, the retirement sen/ices sector emerges as a growing area of activihj.
Buena Vista Township Economic Development Strategy February 2000 Page 28
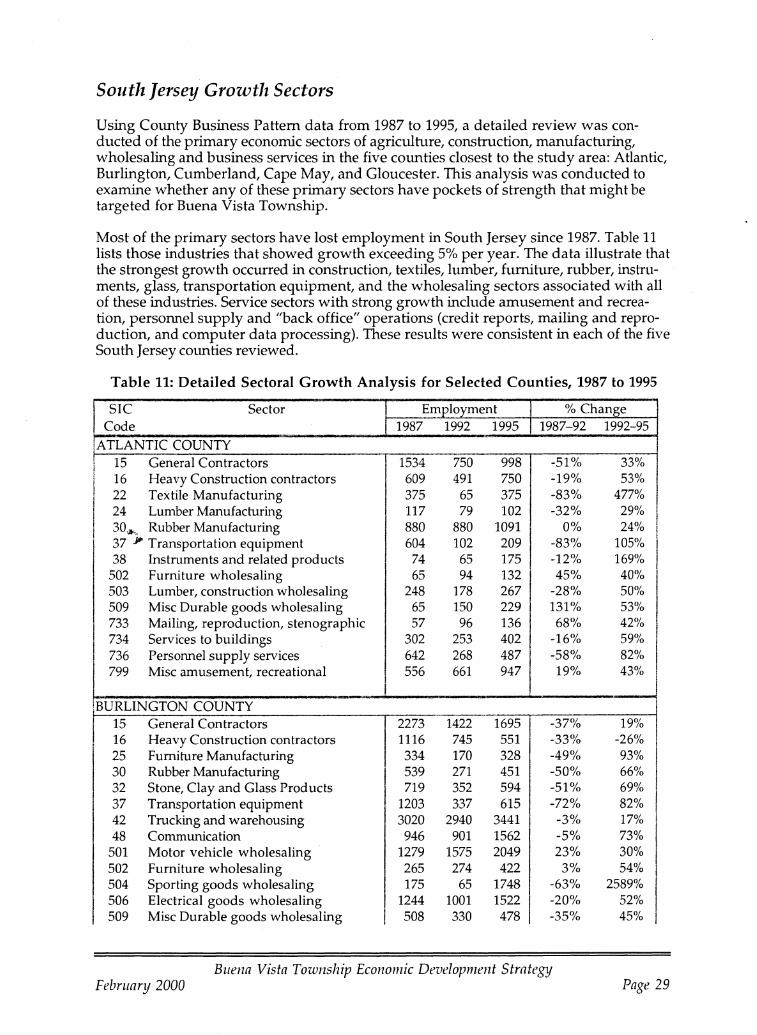
South Jersey Growth Sectors
Using County Business Pattern data from 1987 to 1995, a detailed review was conducted of the primary economic sectors of agriculhtre, construction, manufachlring, wholesaling and business services in the five counties closest to the shldy area: Atlantic, Burlington, Cumberland, Cape May, and Gloucester. This analysis was conducted to examine whether any of these primary sectors have pockets of strength that might be targeted for Buena Vista Township.
Most of the primary sectors have lost employment in South Jersey since 1987. Table 11 lists those industries that showed growth exceeding 5% per year. The data illustrate that the strongest growth occurred in construction, textiles, lumber, furnihlre, rubber, instruments, glass, transportation equipment, and the wholesaling sectors associated with all of these industries. Service sectors with strong growth include amusement and recreation, personnel supply and "back office" operations (credit reports, mailing and reproduction, and computer data processing). These results were consistent in each of the five South Jersey cOlmties reviewed.
Table 11: Detailed Sectoral Growth Analysis for Selected Counties, 1987 to 1995
SIC Sector I Em£loyment I % Change Code I 1987 1992 1995 I 1987-92 1992-95
,ATLANTIC COUNTY I 15 General Contractors 1534 750 998 -51% 33% I 16 Heavy Construction contractors 609 491 750 -19% 53%
I 22 Textile Manufacturing 375 65 375 -83% 477% 24 Lumber Manufacturing 117 79 102 -32% 29% I 30~, Rubber Manufacturing 880 880 1091 0% 24%
,
I 37 -" Transportation equipment 604 102 209 -83% 105% 38 Instruments and related products 74 65 175 -12% 169%
502 Furniture wholesaling 65 94 132 i 45% 40% 503 Lumber, construction wholesaling 248 178 267 I -28% 50%
I 509 Misc Durable goods wholesaling 65 150 229 I 131% 53% I
733 Mailing, reproduction, stenographic 57 96 136
I 68% 42%
734 Services to buildings 302 253 402 -16% 59% 736 Personnel supply services 642 268 487 i -58% 82% 799 Misc amusement, recreational 556 661 947 19% 43%
iBURLINGTON COUNTY 15 General Contractors 2273 1422 1695 -37% 19% 16 Heavy Construction contractors 1116 745 551 -33% -26% 25 Furniture Manufacturing 334 170 328 -49% 93% 30 Rubber Manufacturing 539 271 451 -50% 66% 32 Stone, Clay and Glass Products 719 352 594 -51% 69% 37 Transportation equipment 1203 337 615 -72% 82% 42 Trucking and warehousing 3020 2940 3441 -3% 17% 48 Communication 946 901 1562 -5% 73%
501 Motor vehicle wholesaling 1279 1575 2049 23% 30% 502 Furniture wholesaling 265 274 422 3% 54% 504 Sporting goods wholesaling 175 65 1748 -63% 2589% 506 Electrical goods wholesaling 1244 1001 1522 -20% 52% 509 Misc Durable goods wholesaling 508 330 478 -35% 45%
Buena Vista Township Economic Development Strategy February 2000 Page 29

................................................................................................................. ·······2·96·········'"388······ .. ····70"6 .. T·······j·i;;i~ .. · ·············8·i;;i~· .. ·· 511 Paper products wholesaling 512 Drugs wholesaling 175 58 345 -67% 495% 513 Apparel wholesaling 148 119 168 -20% 41% 514 Groceries wholesaling 755 1608 2092 113% 30% 516 Chemicals wholesaling 286 390 510 36% 31% 519 Misc nondurable goods wholesaling 570 667 811 17% 22% 70 Hotels and lodging 1052 972 1397 -8% 44%
731 Advertising I 223 285 401 28% 41% 732 Credit reporting and collection 160 149 248
I -7% 66%
I 799 Misc amusement, recreational 470 872 1154 86% 32%
I ICAPEMA Y COUNTY
39 Misc Manufacturing
I 0 65 114 (n.a.) 75%
42 Trucking and warehousing 99 162 232 64% 43% 508 Machinery, equipment wholesaling I 101 88 132 -13% 50% 514 Groceries wholesaling
I 420 469 681 12% 45%
79 Amusement and recreation 334 313 454 I -6% 45%
I
CUMBERLAND COUNTY 20 Food Manufacturing I 2207 2580 3140 17% 22% 32 Stone, Clay and Glass Products 5471 6484 8112 19% 25%
323 Products of purchased glass 1681 1677 2157 -0.2% 29% 35 Machinery, except electrical 361 362 944 0.3% 161% 37 Transportation equipment 561 813 45% 39 Misc Manufacturing 196 254 30% 42 Trucking and warehousing 1540 2185 2714 42% 24%
507 Hardware wholesaling 131 150 173 14% 15% 738 Miscellaneous business services I 1405 381 443 -73% 16% 739 Misc business services I 1405 381 443 -73% 16%
7399 Business services, n.e.c.
I 378 171 208 -55% 22%
GLOUCESTER COUNTY 15 General Contractors
I 992 732 892 -26% 22%
16 Heavy Construction contractors 249 375 375 51% 0% 24 Lumber Manufacturing 76 114 172 50% 51% 25 Furniture Manufacturing I 269 109 185 -59% 70% 26 Paper I 175 170 222 -3% 31% 30 Rubber Manufacturing
I 414 455 831 10% 83%
I I 38 Instruments and related products I 221 214 260 -3% 22%
I 42 Trucking and warehousing
I 1359 1324 1567 -3% 18% I 503 Lumber, construction wholesaling 399 425 640 7% 51%
504 Sporting goods wholesaling I 126 534 677 ! 324% 27% 506 Electrical goods wholesaling
I 81 189 221 133% 17%
507 Hardware wholesaling 111 129 169 16% 31% 511 Paper products wholesaling I 78 74 192
, -5% 159%
514 Groceries wholesaling
I
717 854 1096 19% 28% I
736 Personnel supply services 364 485 923
I 33% 90%
737 Computer and data processing 375 81 129 -78% 59% 79 Amusement and recreation 309 528 713 71% 35%
i I I rio
Buena Vista Township Economic Development Strategy February 2000 Page 30
THE REGIONAL BORDER ECONOMY TO THE PINELANDS
The Pinelands project area is located within a two-hour drive from major urban centers such as Philadelphia. The economies of Delaware and Philadelphia are reviewed below to briefly examine trends in these "border economies."
Delaware
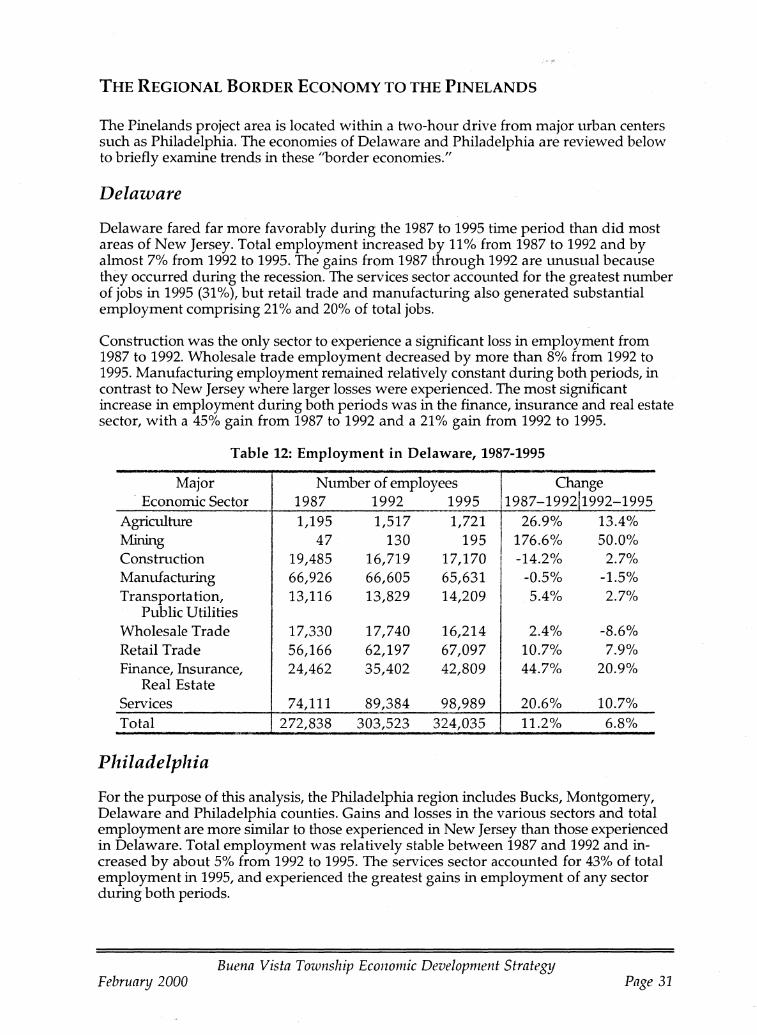
Delaware fared far more favorably during the 1987 to 1995 time period than did most areas of New Jersey. Total employment increased by 11% from 1987 to 1992 and by almost 7% from 1992 to 1995. The gains from 1987 through 1992 are tillusual because they occurred during the recession. The services sector accOlmted for the greatest number of jobs in 1995 (31%), but retail trade and manufachlring also generated substantial employment comprising 21 % and 20% of total jobs.
Construction was the only sector to experience a significant loss in employment from 1987 to 1992. Wholesale trade employment decreased by more than 8% from 1992 to 1995. Manufachlring employment remained relatively constant during both periods, in contrast to New Jersey where larger losses were experienced. The most significant increase in employment during both periods was in the finance, insurance and real estate sector, with a 45% gain from 1987 to 1992 and a 21% gain from 1992 to 1995.
Table 12: Employment in Delaware, 1987-1995
M· N b f 1 Chan aJor urn er 0 emp oyees ge Economic Sector 1987 1992 1995 11987-199211992-1995
Agriculhrre 1,195 1,517 1,721
I 26.9% 13.4%
Minffig 47 130 195 176.6% 50.0% ConstnlCtion 19,485 16,719 17,170 I -14.2% 2.7% Manufachtring 66,926 66,605 65,631
I -0.5% -1.5%
Transportation, 13,116 13,829 14,209 5.4% 2.7% Public Utilities
Wholesale Trade 17,330 17,740 16,214 2.4% -8.6% Retail Trade 56,166 62,197 67,097 10.7% 7.9% Finance, Insurance, 24,462 35,402 42,809 I 44.7% 20.9%
Real Estate Services 74,111 89,384 98,989 20.6% 10.7% Total 272,838 303,523 324,035 11.2% 6.8%
Philadelphia
For the purpose of this analysis, the Philadelphia region includes Bucks, Montgomery, Delaware and Philadelphia counties. Gains and losses in the various sectors and total employment are more similar to those experienced in New Jersey than those experienced in Delaware. Total employment was relatively stable between 1987 and 1992 and increased by about 5% from 1992 to 1995. The services sector accounted for 43% of total employment in 1995, and experienced the greatest gains in employment of any sector during both periods.
Buena Vista Township Economic Development Strategtj February 2000 Page 31
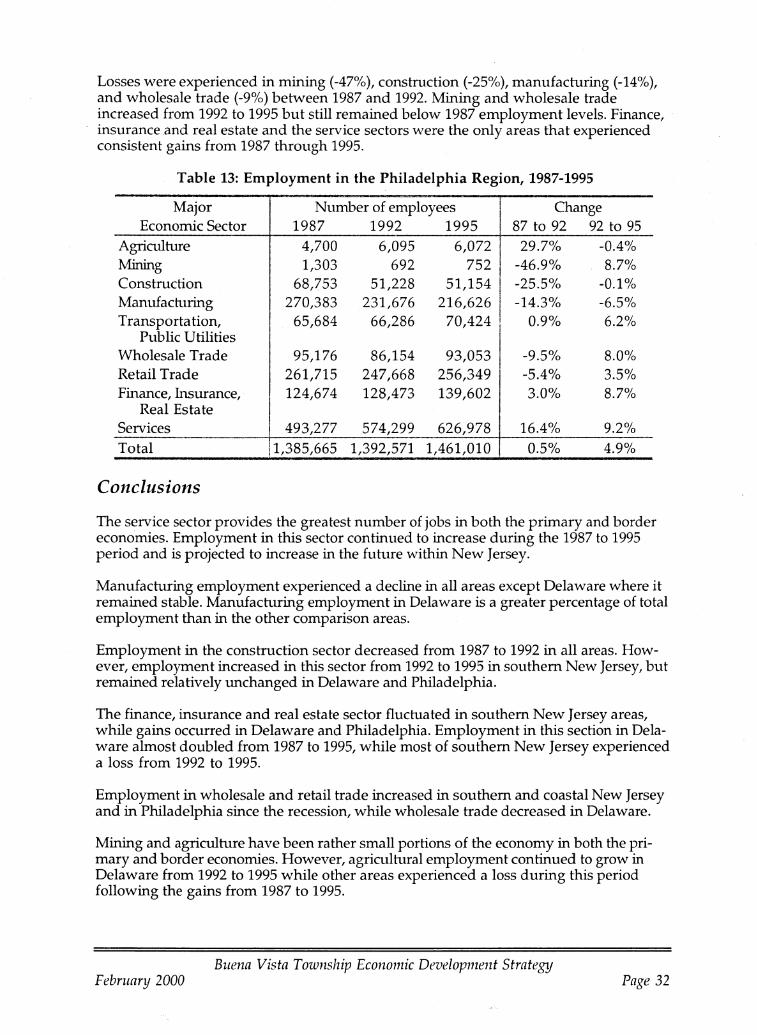
Losses were experienced in mining (-47%), construction (-25%), manufacturing (-14%), and wholesale trade (-9%) between 1987 and 1992. Mining and wholesale trade increased from 1992 to 1995 but still remained below 1987 employment levels. Finance, insurance .and real estate and the service sectors were the only areas that experienced consistent gains from 1987 through 1995.
Table 13: Employment in the Philadelphia Region, 1987-1995
Major Economic Sector
Agriculture Mining Construction Manufachlring Transporta tion,
Public Utilities Wholesale Trade Retail Trade Finance, Insurance,
Real Estate Services Total
Conclusions
Number of employees 1987 1992 1995
I 1
4,700 6,095 6,072 1,303 692 752
68,753 51,228 51,154 270,383 231,676 216,626
65,684 66,286 70,424
95,176 261,715 124,674
86,154 247,668 128,473
I 93,0531 256,349
139,602 I 493,277 574,299 626,978
1,385,665 1,392,571 1,461,010
Change 87 to 92 92 to 95
29.7% -46.9% -25.5% -14.3%
0.9%
-9.5% -5.4% 3.0%
16.4% 0.5%
-0.4% 8.7%
-0.1% -6.5% 6.2%
8.0% 3.5% 8.7%
9.2% 4.9%
The service sector provides the greatest number of jobs in both the primary and border economies. Employment in this sector continued to increase during the 1987 to 1995 period and is projected to increase in the fuhlre within New Jersey.
Manufacturing employment experienced a decline in all areas except Delaware where it remained stable. Manufachlring employment in Delaware is a greater percentage of total employment than in the other comparison areas.
Employment in the construction sector decreased from 1987 to 1992 in all areas. However, employment increased in this sector from 1992 to 1995 in southern New Jersey, but remained relatively unchanged in Delaware and Philadelphia.
The finance, insurance and real estate sector fluctuated in southern New Jersey areas, while gains occurred in Delaware and Philadelphia. Employment in this section in Delaware almost doubled from 1987 to 1995, while most of southern New Jersey experienced a loss from 1992 to 1995.
Employment in wholesale and retail trade increased in southern and coastal New Jersey and in Philadelphia since the recession, while wholesale trade decreased in Delaware.
Mining and agriculhue have been rather small portions of the economy in both the primary and border economies. However, agriculhual employment continued to grow in Delaware from 1992 to 1995 while other areas experienced a loss during this period following the gains from 1987 to 1995.
Buena Vista Township Economic Development Strateg1j February 2000 Page 32
DYNAMICS OF THE LOCAL MARKETPLACE
In order to tmderstand the local and regional dynamics of the commercial real estate market and the potential for business growth, interviews were conducted with local realtors, economic development organizations, and mtmicipal officials in surrOlmding commtmities. These representatives not only provide an important perspective on the local and regional economy for this project, but serve as points of contact for businesses that wish to expand existing operations within New Jersey. Thus, their perspective and knowledge on development trends provide insight as to the type of information that is distributed through these organizations to the business commtmity.
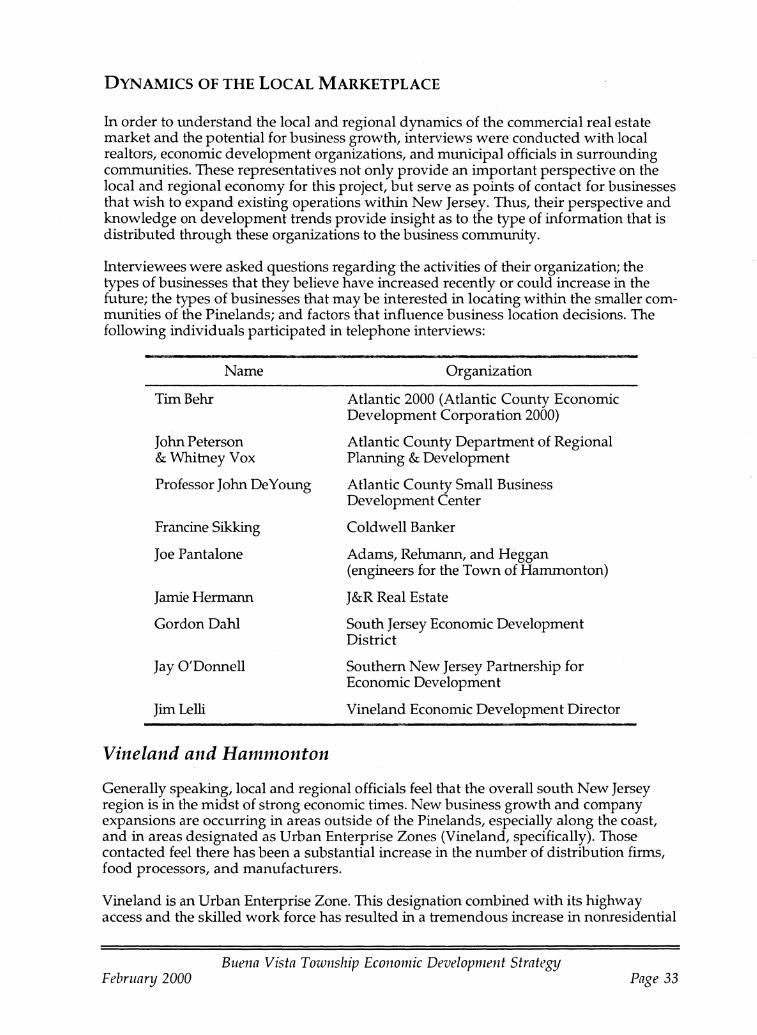
Interviewees were asked questions regarding the activities of their organization; the types of businesses that they believe have increased recently or could increase in the fuhlre; the types of businesses that may be interested in locating within the smaller communities of the Pinelands; and factors that influence business location decisions. The following individuals participated in telephone interviews:
Name
TirnBehr
John Peterson & Whitney Vox
Professor John DeYoung
Francine Sikking
Joe Pantalone
Jamie Hermann
Gordon Dahl
Jay O'Donnell
Jim Lelli
Vineland and Hammonton
Organization
Atlantic 2000 (Atlantic COlmty Economic Development Corporation 2000)
Atlantic COlmty Department of Regional Planning & Development
Atlantic COlmty Small Business Development Center
Coldwell Banker
Adams, Rehmann, and Heggan (engineers for the Town of Hammonton)
J&R Real Estate
South Jersey Economic Development District
Southern New Jersey Partnership for Economic Development
Vineland Economic Development Director
Generally speaking, local and regional officials feel that the overall south New Jersey region is in the midst of strong economic times. New business growth and company expansions are occurring in areas outside of the Pinelands, especially along the coast, and in areas designated as Urban Enterprise Zones (Vineland, specifically). Those contacted feel there has been a substantial increase in the number of distribution firms, food processors, and manufachuers.
Vineland is an Urban Enterprise Zone. This designation combined with its highway access and the skilled work force has resulted in a tremendous increase in nonresidential
Buena Vista Township Economic Development StrategtJ February 2000 Page 33
development. The City has seen an increase in light manufacturing, food processing, distribution centers, and call centers/back office operations.
A new industrial park consisting of 28 lots (an average of 5 acres in size) was recently developed by the City of Vineland. All sites are infrastruchlre ready and include fiberoptic cable. Four lots were sold within a two-month period for $15,000 per acre. The City is considering an increase in the sales price due to how quickly the first few lots sold. The City expects to develop two additional industrial parks in the fuhlre which will be 200 acres and 105 acres in size. Vineland will target the marketing of these sites to food processors and glass manufachlrers through direct mailings and networking at conferences.
Vineland has also experienced an increase in retail and service development. The regional mall recently doubled in size from 500,000 to 1 million square feet. The Downtown's Special Improvement Designation has allowed Rite Aid and CVS to expand operations. An 80-lmit hotel, Wingate Inn, recently opened and a new Holiday Express catering to business travelers is expected to be constructed soon.
Strategy Link
Vineland's local economy is growing strongly - one inten1iewee said it is the best growth period in 60 years. VVlzy isn't Buena Vista growing on its own? Intenliewees support two hypotheses by Township leaders: the absence of sewers and the presence of Pinelands regulations. Other factors include road access, and populationjbusiness densih;.
The Town of Hammonton, following a State-imposed development moratorium from 1987-1994 due to noncompliance of its sewer treatment plant, has recently beglm the process of enhancing its economic base. Hammonton is located within the Pinelands and like Buena Vista Township, is designated as a Pine lands Town. Unlike Buena Vista Township, however, Hammonton has full sewer and water service. Most surrolmding areas are not designated to handle higher density development. Hammonton is thus an "island" for development potential within an area that contains a large amount of publicly owned land or land that is otherwise protected or limited to development.
A sewer extension project to Hammonton's industrial park made the 185 acres of available land more suitable for development. Hammonton's location along the Atlantic City Expressway halfway between Philadelphia and Atlantic City is a marketing tool and an asset for business. The Town is attempting to attract food and beverage distribution facilities, light manufachlring and office uses within the industrial park. It is hoped that the increase in these types of businesses will encourage spin off development along the White Horse Pike and within the downtown. Wal-Mart recently located in Hammonton due to its centralized location, highway access, population, size, and market potential.
Strategy Link
Hammonton -located inside the Pinelands - demonstrates that growth can occur in sewered areas in the Pinelands. The Township's sizable industrial land offerings, however, put it in a class separate from Buena Vista's relatively small study area. Buena Vista must find its own niche. I
Buena Vista Township Economic Development StrategtJ February 2000 Page 34

Potential within the Pinelands
The comrmmities within the Pinelands Pilot Program share many of the amenities that have prompted an increase in economic activity in non-Pinelands commtmities, such as access to transportation corridors, available land and a desirable labor force. However, each of the individuals interviewed stated that the Pine lands regulations and review process hamper the development potential of these areas. While many of these interviewees may only have a limited experience with the Pinelands area and with the Commission itself, it is important to note that these individuals are the points of contact for many businesses. Therefore, their perceptions (accurate or not) are passed on to potential businesses that may have otherwise been interested in one of the Pinelands communities. Each of the individuals contacted stated that infrastructure and regulations are the primary factors businesses evaluate when making a location decision. Businesses seek sites that are immediately available for development. This means sites which are the least impacted by local, regional and state regulations and already have infrastructure in place. Consequently, many businesses do not consider locating within Pinelands communities because business development officials direct them to sites that do not possess these limitations.
It should be noted that these negative perceptions of the regulatory environment for economic development in the Pinelands may not reflect achlal experience in several commtmities. For example, a considerable amotmt of development has occurred in Galloway and Egg Harbor Townships (benefitting from strong growth pressures arOlmd Atlantic City as well as inclusion in designated Regional Growth Areas), and the Town of Hammonton has also been able to attract economic development by providing fully serviced sites. These examples tmderscore the fact that economic development can occur in the Pinelands with the right combination of access, infrastruchlre and regulations. .
Strategy Link
Pinelands communities are in direct competition with non-Pinelands South Jersey communities offering business development space. The presence of Pinelands regulations is perceived 'I
as a competitive disadvantage. Com11lunities must take steps to change these perceptions, or overcome them by finding other creative incentives that will help to offset that disadvan- I tage. The key is to create sites that are ready for development. ,
Generally speaking, interviewees had either no or few opinions regarding Buena Vista. This appears to be due to the area's current lack of infrastructure and the absence of any effort to market it. When asked what the business potential could be if sewer service was provided, some interviewees were able to provide examples for potential market directions, but many still felt that the Pine lands regulations were a deterrent to business development even if sewer service was possible.
Under the assumption that sewer service could be provided and the Pine lands regulations were not so "cumbersome," interviewees felt there was a potential to target small manufacturing operations, craftspeople, and convenience stores. Small manufacturers find southern New Jersey a more desirable location than Philadelphia and Northern New Jersey due to lower land and labor costs. Craftsmen and contractors who specialize in lffiique products such as furniture and other woodworking may be interested in studio space within the smaller Pine lands commtmities. One interviewee said that events such as the Flower Show in Philadelphia attract craftspeople based in locations throughout the country and provide communities with an opporhmity to market themselves to a
Buena Vista Township Economic Development Strategtj February 2000 Page 35
larger consumer base. People are generally willing to travel and pay premiums for unique items, which would be an ideal market for Pinelands cOmffilmities. This is also consistent with the preservation of the Pinelands as a unique place.
Buena Vista - Route 40 Corridor
Several interviewees feel that Buena Vista's location along the Route 40 corridor provides an opporhmity to attract businesses that cater to through traffic. Fast food restaurants and other travel conveniences were cited as examples.
Small manufacturing firms were also mentioned as potential businesses due to the good labor market available within Buena Vista. In addition, existing firms along Tuckahoe Road may be interested in expansion if attractive sites were available.
COMPETITIVE ANALYSIS
This section reviews information on a variety of factors that help to make a place competitive for new business investment. The competitive market within which Buena Vista is operating is clarified, and the question of how Buena Vista can differentiate itself in the South Jersey marketplace is addressed.
Factors Driving Rural Economic Growth
In 1994, researchers from the US Department of Agriculhue, conducted a litera hue review on the causes of rural growth. The review, Factors Associated with Growth of Local and Regional Economies: A Review of Selected Empirical Literature, determined that the results from the 35 studies examined varied too much to identify a discrete set of variables that can always be expected to produce local economic success.
This finding led to a more definitive multiple regression Shldl and article entitled, Rural Economic Development: What Makes Rural Communities Grow? According to this study, the factors most strongly related to local and regional economic growth in rural areas are attractiveness to retirees, right-to-work laws, excellent high school completion rates, high public education expenditures, and access to transportation networks. During the course of a litera hue review performed for that effort, a number of other economic development factors were explored. When combined with those from above, a punch list of the types of issues that should be considered in the course of preparing a rural economic development strategy can be developed (see Table 14).
8 Aldrich, Lorna and Lorin Kusmin. Rural Economic Development: What Makes Rllral Communities Grow. Economic Research Service, Agriculture Information Bulletin No. 737. U.S. Dept. of Agriculture. September 1997.
Buena Vista Township Economic Development Strategtj February 2000 Page 36
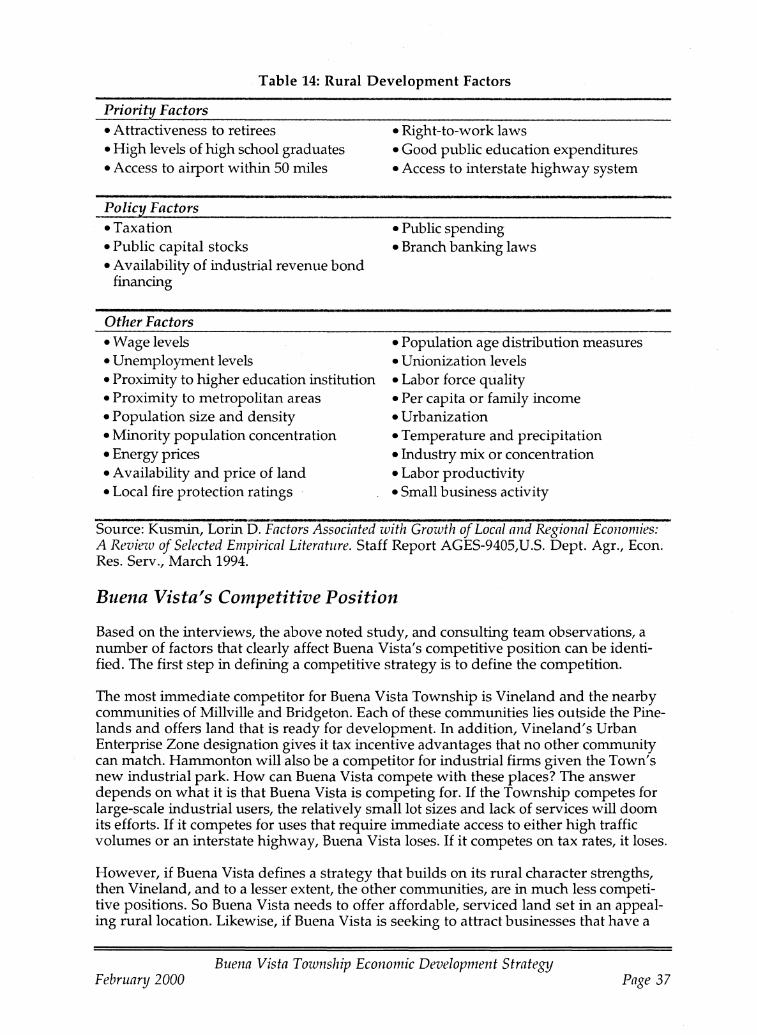
Table 14: Rural Development Factors
Priority Factors • Attractiveness to retirees • High levels of high school graduates • Access to airport within 50 miles
Policy Factors
• Taxation • Public capital stocks • Availability of industrial revenue bond
financing
Other Factors
• Wage levels • Unemployment levels • Proximity to higher education instihltion • Proximity to metropolitan areas • Population size and density • Minority population concentration • Energy prices • Availability and price of land • Local fire protection ratings
• Right-to-work laws • Good public education expendihues • Access to interstate highway system
• Public spending • Branch banking laws
• Population age distribution measures • Unionization levels • Labor force quality • Per capita or family income • Urbanization • Temperature and precipitation • Industry mix or concentration • Labor productivity • Small business activity
Source: Kusmin, Lorin D. Factors Associated with Growth of Local and Regional Economies: A Review of Selected Empirical Literature. Staff Report AGES-9405,U.s. Dept. Agr., Econ. Res. Serv., March 1994.
Buena Vista's Competitive Position
Based on the interviews, the above noted Shldy, and consulting team observations, a number of factors that clearly affect Buena Vista's competitive position can be identified. The first step in defining a competitive strategy is to define the competition.
The most immediate competitor for Buena Vista Township is Vineland and the nearby communities of Millville and Bridgeton. Each of these communities lies outside the Pinelands and offers land that is ready for development. In addition, Vineland's Urban Enterprise Zone designation gives it tax incentive advantages that no other community can match. Hammonton will also be a competitor for industrial firms given the Town's new industrial park. How can Buena Vista compete with these places? The answer depends on what it is that Buena Vista is competing for. If the Township competes for large-scale industrial users, the relatively small lot sizes and lack of services will doom its efforts. If it competes for uses that require immediate access to either high traffic volumes or an interstate highway, Buena Vista loses. If it competes on tax rates, it loses.
However, if Buena Vista defines a strategy that builds on its rural character strengths, then Vineland, and to a lesser extent, the other commlmities, are in much less competitive positions. So Buena Vista needs to offer affordable, serviced land set in an appealing rural location. Likewise, if Buena Vista is seeking to attract businesses that have a
Buena Vista Township Economic Development Strategy February 2000 Page 37
more localized market-Burger King, for instance-then it is irrelevant whether Vineland is next door or not.
Hammonton is within the Pinelands and lies just 12 miles to the north. What does Hammonton have that Buena Vista does not? Again, larger tracts of serviced land in a traditional industrial park setting. Hammonton also has a larger population and an established downtown. Buena Vista's rural setting is distinctive.
Buena Vista Township Economic Development Strategy February 2000 Page 38
DIRECTIONS FOR THE STUDY AREA
Based on the above analysis and consulting team experience, the Shldy area might follow one of several paths. This section presents four alternative development scenarios: one scenario is based on a continuation of existing development trends including continued reliance on on-site septic systems, while the other three scenarios assume that a public wastewater collection and treatment system is provided. Using these scenarios allows for an evaluation of the public costs and benefits of sewering Buena Vista's Pinelands Town district.
METHOD AND ASSUMPTIONS
Definition of Pinelands Town District Subareas
As a first step in analyzing development potential in Buena Vista Township's Pinelands Town district, the environmental characteristics of the district were reviewed. Two branches of a stream (labeled "Deep Rtm" on the USGS topographic map, Buena quadrangle) reach south to Route 40, while a third extends west to Route 54. Because of the low topographic relief in the area, these headwaters are surrotmded by extensive wetlands areas. These wetlands systems were overlaid on parcel maps, and the percentages of wetlands and transitional soils were estimated for each parceL Existing land uses were also mapped from data provided by the Pinelands Commission.
The combination of wetlands and existing development define four distinct subareas within the district:
• Subarea 1, at the westerly end of the district, consists of the area immediately around the intersections of Harding Highway (U.S. 40), Blue Anchor Road (N.J. 54), Tuckahoe Road (C.R. 557) and Cumberland Avenue, as well as the land extending northwards along Route 54 to the boundary of the Town zone. This is a diverse district in terms of existing development and parcelization: it includes some of the most intensely developed land in the PT district sUITOlmding the Route 40/54 intersection, two large farm parcels fronting on Route 54 (one of which is used as a campground), and a number of small residential and vacant parcels along Fursin Avenue at the northerly end of the district. The subarea has a total area of about 76 acres, of which nearly 83 percent (63 acres) is either vacant or farmland.
• Subarea 2, to the east of the main stem of Deep Run, includes several commercial parcels on the north side of Route 40 (including Pietro Foods), and residential and vacant parcels on the south side of the road. This subarea has a total area of 52 acres, of which approximately 12 acres are vacant.
• Subarea 3, with 37 acres, is the smallest of the subareas. Located on the south side of Route 40 between two wetlands areas, it includes the school parcel, the Township building and the post office, as well as a residential parcel and a portion of a small commercial parcel. The land on the northerly side of Route 40 is entirely wetland, and is not included in the Pinelands Town management area or zoning district.
• Subarea 4 extends from east of the post office to about 700 feet east of Oak Road. It is the largest of the subareas (111 acres) and also has the lowest percentage of both
Buena Vista Township Economic Development Strategy February 2000 Page 39
wetlands and transitional soils. Much of this land is already developed for a mix of residential, commercial and industrial uses, including Wilmad Glass and Buena Plwnbing.
The acreage calculations and estimates of buildable land area are presented in Table 15. Note that in this table, "buildable" area refers only to the environmental characteristics, and does not indicate whether or not a parcel is partially or fully developed.
As is evident in Table 15, the amount of buildable land increases in each area and tmder each land use category when sewers are introduced. Sewers allow parcels that are predominantly transitional soils to be developed and lot sizes can be smaller since septic dilution is not required. While the latter won't affect developable acreage, it will affect the number of businesses that can be sited.
It should be emphasized that the figures in Table 15 are estimates and that the actual buildability of each site will need to be determined on a site-by-site basis. Other factors that may need to be considered include wetlands buffer zones and on-site stormwater retention.
Buena Vista Township Economic Development Strategtj February 2000 Page 40
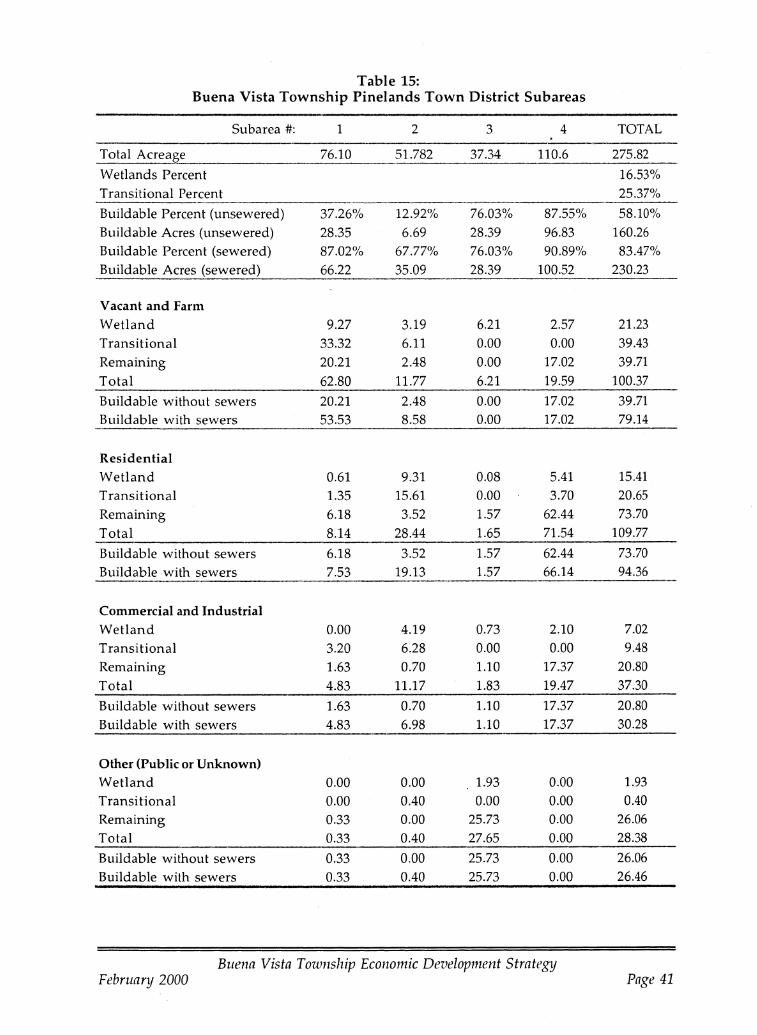
Table 15: Buena Vista Township Pinelands Town District Subareas
Subarea #: 1 2 3 4 TOTAL
Total Acreage 76.10 51.782 37.34 110.6 275.82
Wetlands Percent 16.53%
Transitional Percent 25.37%
Buildable Percent (unsewered) 37.26% 12.92% 76.03% 87.55% 58.10%
Buildable Acres (unsewered) 28.35 6.69 28.39 96.83 160.26
Buildable Percent (sewered) 87.02% 67.77% 76.03% 90.89% 83.47%
Buildable Acres (sewered) 66.22 35.09 28.39 100.52 230.23
Vacant and Farm Wetland 9.27 3.19 6.21 2.57 21.23
Transitional 33.32 6.11 0.00 0.00 39.43
Remaining 20.21 2.48 0.00 17.02 39.71
Total 62.80 11.77 6.21 19.59 100.37
Buildable without sewers 20.21 2.48 0.00 17.02 39.71
Buildable with sewers 53.53 8.58 0.00 17.02 79.14
Residential Wetland 0.61 9.31 0.08 5.41 15.41
Transitional 1.35 15.61 0.00 3.70 20.65
Remaining 6.18 3.52 1.57 62.44 73.70
Total 8.14 28.44 1.65 71.54 109.77
Buildable without sewers 6.18 3.52 1.57 62.44 73.70
Buildable with sewers 7.53 19.13 1.57 66.14 94.36
Commercial and Industrial Wetland 0.00 4.19 0.73 2.10 7.02
Transitional 3.20 6.28 0.00 0.00 9.48
Remaining 1.63 0.70 1.10 17.37 20.80
Total 4.83 11.17 1.83 19.47 37.30
Buildable without sewers 1.63 0.70 1.10 17.37 20.80
Buildable with sewers 4.83 6.98 1.10 17.37 30.28
Other (Public or Unknown) Wetland 0.00 0.00 1.93 0.00 1.93
Transitional 0.00 0.40 0.00 0.00 0.40
Remaining 0.33 0.00 25.73 0.00 26.06
Total 0.33 0.40 27.65 0.00 28.38
Buildable without sewers 0.33 0.00 25.73 0.00 26.06
Buildable with sewers 0.33 0040 25.73 0.00 26.46
Buena Vista Township Economic Development Strategy February 2000 Page 41

Land Uses, Develop111ent Intensities and I111pact Measures Used in the Scenarios
Use Categories
At this level of analysis it is not appropriate to attempt to specify detailed land uses. Therefore, the development scenario model uses five generalized categories of land uses: retail, office, light industry, retirement facility, and residential.
The "retail" category is further broken down into four subcategories for illustrative purposes. "Village commercial" represents small-scale shops and mixed-use buildings typically no greater than 2,000 square feet per struchlre and on lots as small as one-half acre. This type of use would have a pedestrian orientation and be located in a village center. "Strip shopping center" represents a larger-scale, auto-oriented center containing several businesses. The typical scale for this use would be a building of 10,000 square feet on an 8-acre parcel. The "fast food" use category is included because this type of use, oriented to through travelers along Route 40, would appear to have the strongest market at this time, but would also have distinctive impacts in terms of traffic (high levels of hlming movements) and wastewater generation. Typical floor areas would be lmder 5,000 square feet, with lot areas of about one acre. Finally, "general retail" represents larger-scale, free-standing retail uses, ranging from convenience stores or food stores such as Rite-Aid or Wawa to restaurants or larger discolmt stores. Parcel sizes for these stores could be in the five-acre range, with floor areas up to 40,000 square feet.
The residential category is subdivided into two subcategories: "single-family residential" assumes the development of single-family homes on lots of one acre, while "village residential" represents single-family or multifamily development at an average density of 10 dwellings per acre. It is important to note that residential uses are not permitted as of right in the Pine lands Town zone and those that are permitted as a conditional use are required to have a minimum density of one dwelling lmit/ acre. Such uses exist, however, along the Route 40 and Route 54 corridors in Buena Vista's PT district, and would be necessary for the success of a village-based economic development strategy. This strategy also notes that single family developments that result in high numbers of school children will bring higher fiscal costs than other types of development, and thus the residential recommendations in this strategy are oriented toward senior housing and smaller housing units.
Table 16 presents the assumptions used in the analysis for development intensity, and Table 17 lists the assumptions regarding market values, traffic generation and wastewater generation. The rationales for these estimates are described in the following discussion.
Buena Vista Township Economic Development Strategy February 2000 Page 42
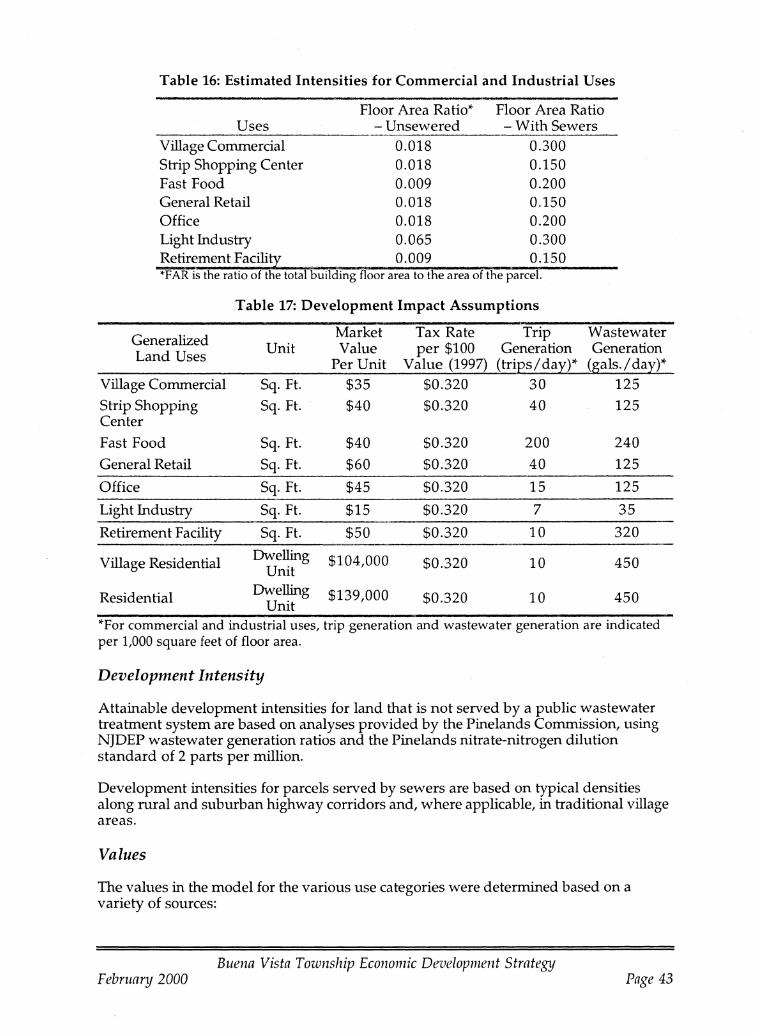
Table 16: Estimated Intensities for Commercial and Industrial Uses
Floor Area Ratio* Floor Area Ratio Uses - Unsewered - With Sewers
Village Commercial 0.018 0.300 Strip Shopping Center 0.018 0.150 Fast Food 0.009 0.200 General Retail 0.018 0.150 Office 0.018 0.200 Light Industry 0.065 0.300 Retirement Facili!X ... 0.009 0.150 *FAR is the ratio of the total building floor area to the area of the parcel.
Table 17: Development Impact Assumptions
Generalized Market Tax Rate Trip Wastewater
Land Uses Unit Value per $100 Generation Generation Per Unit Value (1997) (triEs/ day)* (gals./day)*
Village Commercial Sq. Ft. $35 $0.320 30 125
Strip Shopping Sq. Ft. $40 $0.320 40 125 Center
Fast Food Sq. Ft. $40 $0.320 200 240
General Retail Sq. Ft. $60 $0.320 40 125
Office Sq. Ft. $45 $0.320 15 125
Light Industry Sq. Ft. $15 $0.320 7 35
Retirement Facility Sq. Ft. $50 $0.320 10 320
Village Residential Dwelling $104,000 $0.320 10 450 Unit
Residential Dwelling $139,000 $0.320 10 450 Unit
*For commercial and industrial uses, trip generation and wastewater generation are indicated per 1,000 square feet of floor area.
Development Intensity
Attainable development intensities for land that is not served by a public wastewater treatment system are based on analyses provided by the Pinelands Commission, using NJDEP wastewater generation ratios and the Pinelands nitrate-nitrogen dilution standard of 2 parts per million.
Development intensities for parcels served by sewers are based on typical densities along mral and suburban highway corridors and, where applicable, in traditional village areas.
Values
The values in the model for the various use categories were determined based on a variety of sources:
Buena Vista Township Economic Development Strategtj February 2000 Page 43
• Tax assessment data are available on-line for all New Jersey communities. These data were reviewed for parcels along the Route 40 corridor in Buena Vista Township to establish typical values for existing residential and commercial uses in the corridor.
• Assessed values were collected from the same source for several chain stores throughout New Jersey: Rite-Aid (86 locations), Dlmkin' Donuts (B), Wawa (222), Friendly's (30), McDonald's (142), Wal-Mart (12) and Home Depot (7). These particular chains were chosen as being representative of the kinds of stores that might locate along a highway similar to Route 40 in Buena Vista.
• The average single-family residential value of $139,000 is an estimate of typical values for new construction. This estimate was based on 1997 average sales prices for single-family hQmes in Buena Vista, adjusted by the 1990 ratio of the upper quartile value to the median value in Township (because new homes are likely to have higher values than average for the commlmity), and then increased by 5% to reflect several years of appreciation in real estate values.
• "Village residential" values were estimated as 75% of the typical value for new single-family houses, or $104,000. (In 1990, the average value of attached singlefamily dwellings was 85% of the average value of detached single-family dwellings; however, as noted above, it is assumed that new single-family homes will have significantly higher values than average.) Although unit values for the "village residential" category are significantly lower than for the single-family category, the higher densities result in much higher values per acre for village housing.
Absorption Levels and Rates
Estimates of potential retail and office absorption rates in Buena Vista Township were made in part based on regional labor market forecasts and in part on judgment about the ability of the Township to attract certain types of development.
The New Jersey Department of Labor publishes annual Regional Labor Market Reviews for each of three regions in the State. The Atlantic Region encompasses Atlantic COlmty (including Buena Vista Township and Buena Borough) as well as Cape May, Ocean and Monmouth COlmties; while the Southern Region includes neighboring Cumberland COlllty (with Vineland and Millville), along with Gloucester, Camden, Burlington, Mercer and Salem Counties. The January 1998 Atlantic Region Labor Market Review projected Atlantic COlIDty'S job growth over the 1994-2005 period to be 2,320 jobs in the retail trade sector, and 32,390 jobs in the service sector. Assuming average employment densities of 0.5 employee per 1,000 square feet of retail floor area and 3 employees per 1,000 square feet of office or service industry floor area, these employment forecasts would translate to 4.64 million square feet of retail space and 10.8 million square feet of office or service industry space development in Atlantic County over the 11 year period (these figures would include additional casino development in Atlantic City).
What is Buena Vista Township'S "fair share" of this development and employment growth? One approach is to prorate the total growth according to the Township's share of the COlmty's population (this assumes that the Township's population and economic growth will be proportional to the COlmty's). In 1990 Buena Vista's population was 7,655, or 3.4 percent of Atlantic County's 224,327 residents. Applying this percentage to the development estimates above would result in estimated growth potential in the
Buena Vista Township Economic Development Strategtj February 2000 Page 44

Township of approximatelr 160,000 square feet of retail space and 370,000 square feet of office and service space.
A different approach was used to estimate industrial development. COlmty projections suggest that overall industrial employment will decline in the fuhlre. While this trend may hold true County-wide, it is probable that communities offering appropriately zoned, affordably priced vacant industrial will see construction. The smaller industrial projects such as those that Buena Vista will seek to attract may provide a competitive niChe. Therefore, a general assumption was made that there is sufficient market demand for one 25,000 square foot industrial/warehouse building per year for the next ten years.
These generalized estimates of growth potential were then reviewed in detail, compared with the uses existing in the Route 40 corridor area and judgments about the Township's market area, and then refined as indicated in Table 18.
Table 18: Absorption Rate Assumptions
Uses 10-Year Annual Absorption Absorption How It Could Happen
Village Commercial 50,000 5,000 Mixed-use: two 2,000+ sf buildings per year
Strip Shopping Center 20,000 2,000 One 10,000 sf. shopping center every five years
Fast Food 50,000 5,000 One store per year General Retail 50,000 5,000 One building Eer year Retail (all types) 170,000 17,000 Office 150,000 15,000 One building per year Light Industry 250,000 25,000 One building per year Retirement Facility 60,000 6,000 Two 30,000 sf facilities:
one every five years Total Nonresidential 630,000 63,000
The scenarios that follow present a buildout projection for the study area under four scenarios. Given the amount of land available, the levels of build out represented in these scenarios will not be reached within the next ten years, which is the timeframe noted for Objective #2 (see page 5).
Wastewater
Estimates of wastewater generation are derived from the minimum standards for facilities published in the New Jersey Department of Environmental Protection's "Standards for Individual Subsurface Sewage Disposal Systems" at N.J.A.C. 7:9A-7.4.
9 These estimates may be high because Atlantic City offers economies of scale and agglomeration not found in Buena Vista Township. On the other hand, there are also many areas of Atlantic County that do not have the zoning, vacant land or infrastructure to absorb more growth. Since it is not clear to what extent these factors may balance each other, the population-based approach provides acceptable order-of-magnitude estimates of demand for space.
Buena Vista Township Economic Development Strategy February 2000 Page 45
Traffic
Trip generation estimates are based on factors published by the Instihlte of Transportation Engineers in Trip Gelleration, 5th edition (1987).
SCENARIOS
Scenario 1 - Unsewered
The first scenario represents the baseline case: continued incremental development without commtmity wastewater collection and treatment. This scenario involves the smallest amOlmt of land and potential development for several reasons:
• First, it is assumed that without sewers, development will be severely limited on transitional soils, i.e., those areas where the depth to the seasonal high water table is less than five feet.
• Second, the potential density of development on a parcel is much less without sewers because more land is required to adequately dilute wastewater. Based on calculations provided by the Pinelands Commission, it is assumed that retail and office uses with on-site septic systems will be limited to a floor area ratio of less than 0.02 (the "floor area ratio" or "FAR" is the ratio of the total building floor area to the area of the parcel on which the building is sihlated).
• Third, the lack of infrastruchue does not foster increased development interest along the Route 40 corridor. Therefore, it is assumed that future development occurs only on land that is now vacant or farmland; that is, no redevelopment of existing residential or commercial properties to a higher density is assumed.
Thus, compared to a scenario with sewers, less land is available for development, the typical density of development on the available land is lower, and it is tmlikely that existing developed properties will be converted or redeveloped to a more intensive use.
The area allocated to each use and in each subarea is listed in Table 19, and the resulting floor areas are presented in Table 20. These figures represent development of vacant land only, not land that is currently in another land use.
Buena Vista Township Economic Development Strategtj February 2000 Page 46
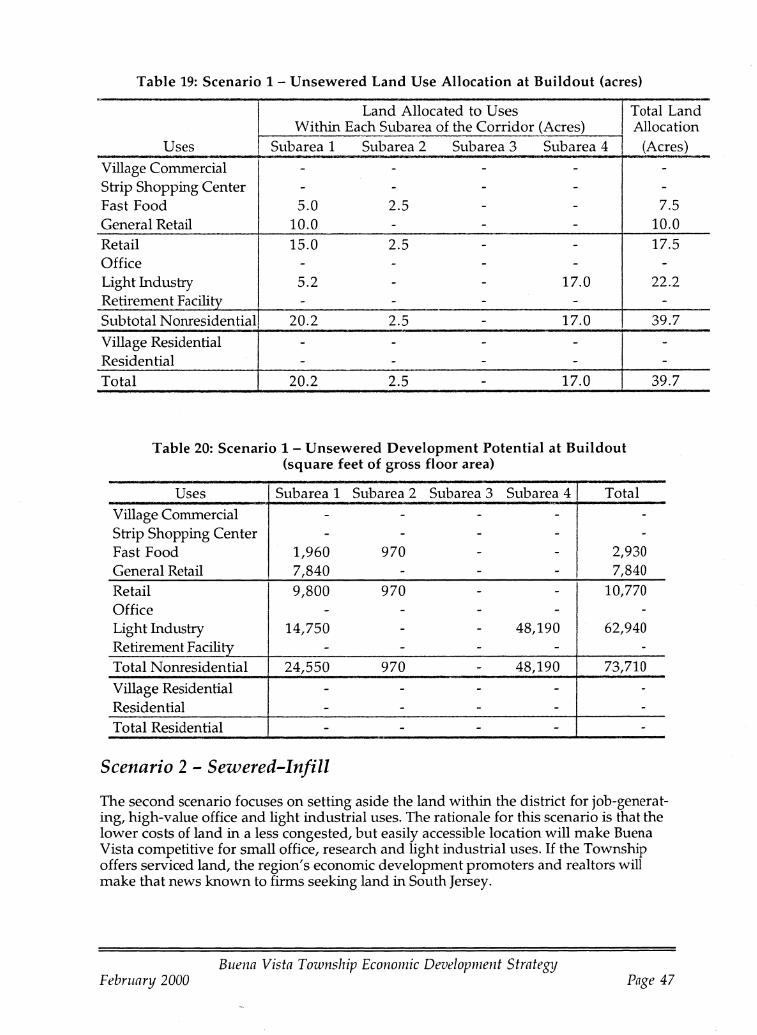
Table 19: Scenario 1 - Unsewered Land Use Allocation at Buildout (acres)
Uses ~~ Land Allocated to Uses Total Land
Within Each Subarea of the Corridor (Acres) Allocation I Subarea 1 Subarea 2 Subarea 3 Subarea 4 I (Acres)
Village Commercial - - - -Strip Shopping Center - - - -
Fast Food 5.0 2.5 - -General Retail 10.0 - - -Retail 15.0 2.5 - -Office - - - -Light Industry 5.2 - - 17.0 Retirement Facility - - - -Subtotal Nonresidential 20.2 2.5 - 17.0
Village Residential - - - -Residential - - - -Total 20.2 2.5 - 17.0
Table 20: Scenario 1 - Unsewered Development Potential at Buildout (square feet of gross floor area)
Uses Subarea 1 Subarea 2 Subarea 3 Subarea 4 Total
Village Commercial - - - - -Strip Shopping Center - - - - -Fast Food 1,960 970 - - 2,930 General Retail 7,840 - - - 7,840 Retail 9,800 970 - - 10,770 Office - - - - -Light Industry 14,750 - - 48,190 62,940 Retirement Facility - - - - -Total Nonresidential 24,550 970 - 48,190 73,710
Village Residential - - - - -Residential - - - - -Total Residential - - - - -
Scenario 2 - Sewered-Infill
--7.5
10.0 17.5
-22.2
-39.7
--
39.7
The second scenario focuses on setting aside the land within the district for job-generating, high-value office and light industrial uses. The rationale for this scenario is that the lower costs of land in a less congested, but easily accessible location will make Buena Vista competitive for small office, research and light industrial uses. If the Township offers serviced land, the region's economic development promoters and realtors will make that news known to firms seeking land in South Jersey.
Buena Vista Township Economic Development Strategy February 2000 Page 47
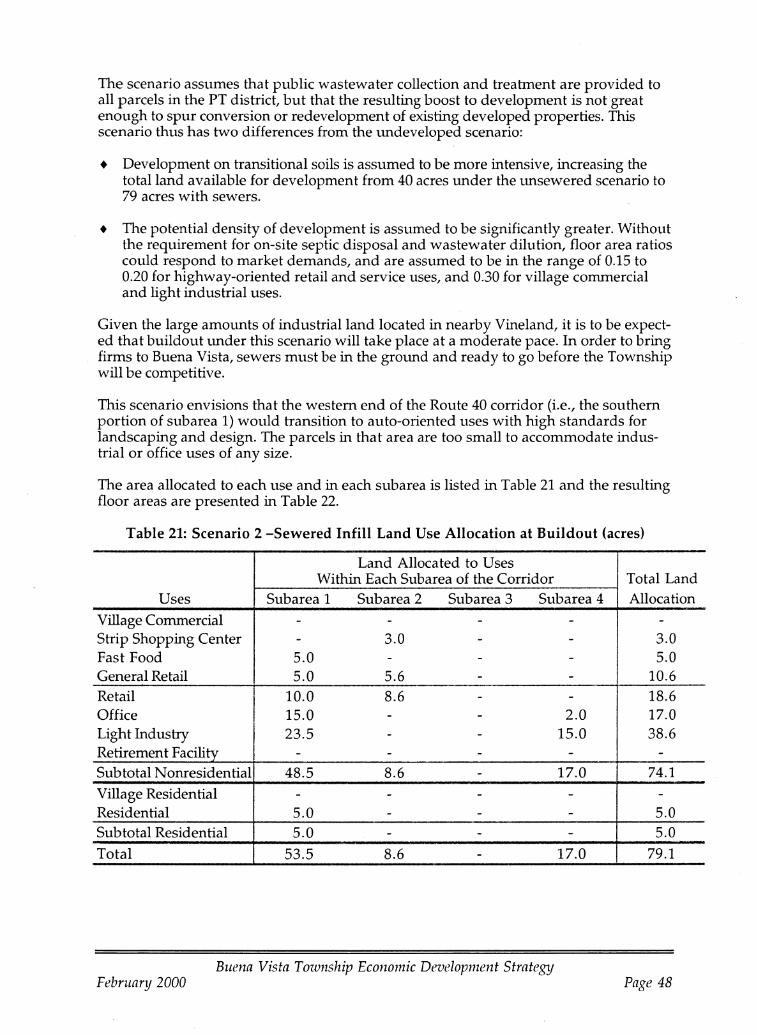
The scenario assumes that public wastewater collection and treatment are provided to all parcels in the PT district, but that the resulting boost to development is not great enough to spur conversion or redevelopment of existing developed properties. This scenario thus has two differences from the l.mdeveloped scenario:
• Development on transitional soils is assumed to be more intensive, increasing the total land available for development from 40 acres l.mder the l.msewered scenario to 79 acres with sewers.
• The potential density of development is assumed to be significantly greater. Without the requirement for on-site septic disposal and wastewater dilution, floor area ratios could respond to market demands, and are assumed to be in the range of 0.15 to 0.20 for highway-oriented retail and service uses, and 0.30 for village commercial and light industrial uses.
Given the large amounts of industrial land located in nearby Vineland, it is to be expected that buildout l.mder this scenario will take place at a moderate pace. In order to bring firms to Buena Vista, sewers must be in the grol.md and ready to go before the Township will be competitive.
This scenario envisions that the western end of the Route 40 corridor (i.e., the southern portion of subarea 1) would transition to auto-oriented uses with high standards for landscaping and design. The parcels in that area are too small to accommodate industrial or office uses of any size.
The area allocated to each use and in each subarea is listed in Table 21 and the resulting floor areas are presented in Table 22.
Table 21: Scenario 2 -Sewered Infill Land Use Allocation at Buildout (acres)
Land Allocated to Uses Within Each Subarea of the Corridor Total Land
Uses Subarea 1 Subarea 2 Subarea 3 Subarea 4 Allocation
Village Commercial - - - - -Strip Shopping Center - 3.0 - - 3.0 Fast Food 5.0 - - - 5.0 General Retail 5.0 5.6 - - 10.6 Retail 10.0 8.6 - - 18.6 Office 15.0 - - 2.0 17.0 , Light Industry 23.5 - - 15.0 38.6 Retirement Facility - - - - -Subtotal Nonresidential 48.5 8.6 - 17.0 74.1
Village Residential - - - - -Residential 5.0 - - - 5.0 Subtotal Residential 5.0 - - - 5.0
Total 53.5 8.6 - 17.0 79.1
Buena Vista Township Economic Development Strategtj February 2000 Page 48

Table 22: Scenario 2 - Sewered Infill Development Potential at Buildout (square feet of gross floor area)
Uses Subarea 1 Subarea 2 Subarea 3 Subarea 4 Total
Village Commercial - - - - -Strip Shopping Center - 19,600 - - 19,600 Fast Food 43,560 - - - 43,560 General Retail 32,670 36,460 - - 69,130 Retail 76,230 56,060 - - 132,290 Office 130,680 - - 17,420 148,100 Light Industry 307,490 - - 196,280 503,770 Retirement Facility - - - - -Total Nonresidential 514,400 56,060 - 213,700 784,160
Village Residential* - - - - -Residential* 5 - - - 5 Total Residential* 5 - - - 5
.. * ResIdential development IS mdlcated m number of housmg umts, not square feet.
Scenario 3 - Sewered-Redevelopment
Scenario 3 is identical to Scenario 3 except that it assumes that the regional demand for commercial space is strong enough to spur redevelopment of existing residential parcels along the Route 40 corridor.
The area allocated to each use and in each subarea is listed in Table 23 and the resulting floor areas are presented in Table 24.
Table 23: Scenario 3 - Sewered Redevelopment Land Use Allocation at Buildout (acres)
Land Allocated to Uses Within Each Subarea of the Corridor Total Land
Uses Subarea 1 Subarea 2 Subarea 3 Subarea 4 Allocation
Village Commercial 4.0 - - - 4.0 Strip Shopping Center - 3.0 - - 3.0 Fast Food 7.0 - - - 7.0 General Retail 5.0 5.0 - - 10.0 -Retail 16.0 8.0 - - 24.0 Office 15.0 2.0 2.0 - 19.0 Light Industry 23.0 - - 15.0 38.0 Retirement Facility - - - - -Subtotal Nonresidential 54.0 10.0 2.0 15.0 81.0
Village Residential - 8.0 - 17.0 25.0 Residential - - - - -Total 54.0 18.0 2.0 32.0 106.0
Buena Vista Township Economic Development Strategy February 2000 Page 49
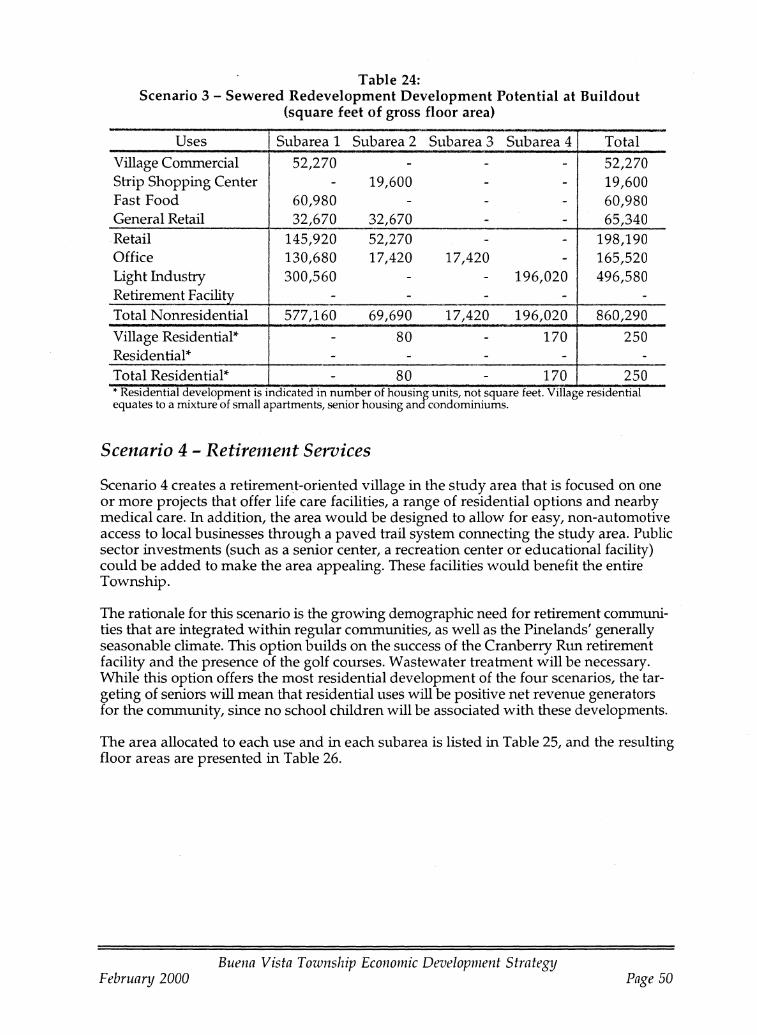
Table 24: Scenario 3 - Sewered Redevelopment Development Potential at Buildout
(square feet of gross floor area)
Uses Subarea 1 Subarea 2 Subarea 3 Subarea 4 Total
Village Commercial 52,270 - - - 52,270 Strip Shopping Center - 19,600 - - 19,600 Fast Food 60,980 - - - 60,980 General Retail 32,670 32,670 - - 65,340 Retail 145,920 52,270 - - 198,190 Office 130,680 17,420 17,420 - 165,520 Light Industry 300,560 - - 196,020 496,580 Retirement Facility - - - - -Total Nonresidential 577,160 69,690 17,420 196,020 860,290
Village Residential* - 80 - 170 250 Residential* - - - - -Total Residential* - 80 - 170 250 *
.. ReSidential development IS Indicated In number of hOUSIng Units, not square feet. Village reSidential
equates to a mixture of small apartments, senior hOUSing and condominiums.
Scenario 4 - Retirement Services
Scenario 4 creates a retirement-oriented village in the Shldy area that is focused on one or more projects that offer life care facilities, a range of residential options and nearby medical care. In addition, the area would be designed to allow for easy, non-automotive access to local businesses through a paved trail system connecting the Shldy area. Public sector investments (such as a senior center, a recreation center or educational facility) could be added to make the area appealing. These facilities would benefit the entire Township.
The rationale for this scenario is the growing demographic need for retirement communities that are integrated within regular commlmities, as well as the Pinelands' generally seasonable climate. This option builds on the success of the Cranberry Rlm retirement facility and the presence of the golf courses. Wastewater treatment will be necessary. While this option offers the most residential development of the four scenarios, the targeting of seniors will mean that residential uses will be positive net revenue generators for the community, since no school children will be associated with these developments.
The area allocated to each use and in each subarea is listed in Table 25, and the resulting floor areas are presented in Table 26.
Buena Vista Township Economic Development Stmtegl) February 2000 Page 50
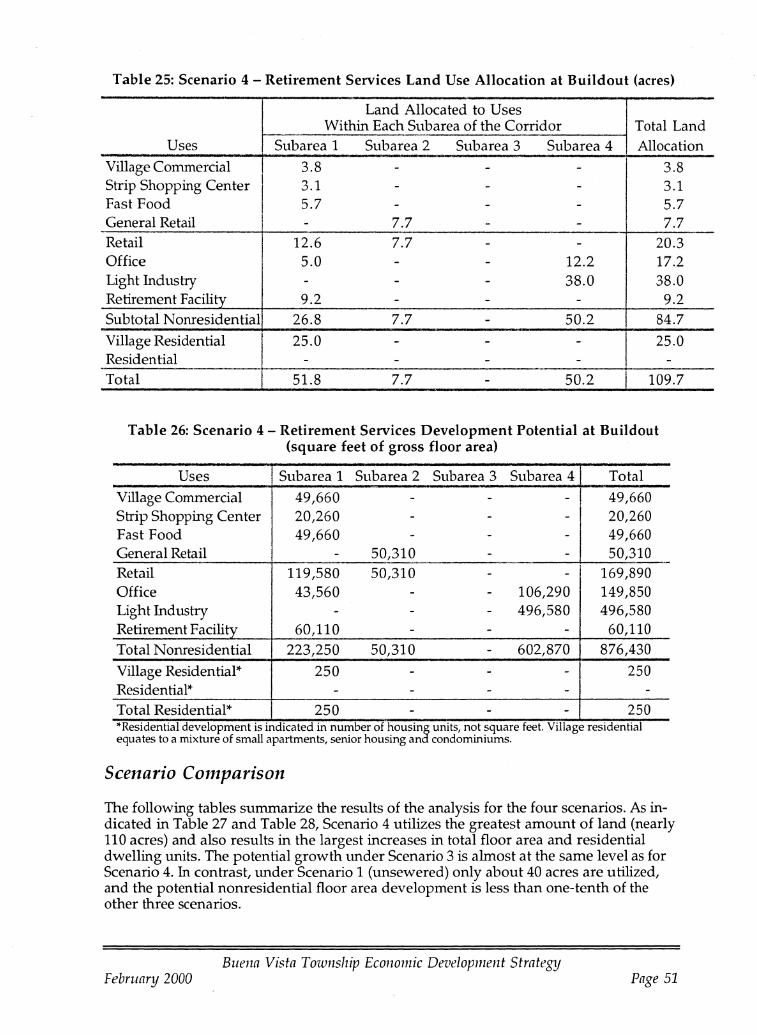
Table 25: Scenario 4 - Retirement Services Land Use Allocation at Buildout (acres)
Land Allocated to Uses Within Each Subarea of the Corridor Total Land
Uses Subarea 1 Subarea 2 Subarea 3 Subarea 4 Allocation
Village Commercial 3.8 - - - 3.8 Strip Shopping Center
I 3.1 - - - 3.1
Fast Food 5.7 - - - 5.7 General Retail
I - 7.7 - - 7.7
Retail 12.6 7.7 - - 20.3 Office 5.0 - - 12.2 17.2 Light Industry - - - 38.0 38.0 Retirement Facility 9.2 - - - 9.2 Subtotal Nonresidential 26.8 7.7 - 50.2 84.7
Village Residential
I 25.0 - - - 25.0
Residential - - - - -Total 51.8 7.7 50.2 109.7
Table 26: Scenario 4 - Retirement Services Development Potential at Buildout (square feet of gross floor area)
Uses Subarea 1 Subarea 2 Subarea 3 Subarea 4 Total
Village Commercial 49,660 - - - I 49,660 Strip Shopping Center 20,260 - - - 20,260 Fast Food 49,660 - - - 49,660 General Retail - 50,310 - - 50,310 .. Retail 119,580 50,310 - - 169,890 Office 43,560 - - 106,290 149,850 Light Industry - - - 496,580 496,580 Retirement Facility 60,110 - - - 60,110 Total Nonresidential 223,250 50,310 - 602,870 876,430
Village Residential* 250 - - - 250 Residential* - - - - -Total Residential* 250 - - - 250
.. *ResldentJal development IS mdlcated m number of housmg umts, not square feet. VIllage reSIdentIal equates to a mixture of small apartments, senior housing and condominiums.
Scenario Comparison
The following tables summarize the results of the analysis for the four scenarios. As indicated in Table 27 and Table 28, Scenario 4 utilizes the greatest amount of land (nearly 110 acres) and also results in the largest increases in total floor area and residential dwelling units. The potential growth tmder Scenario 3 is almost at the same level as for Scenario 4. In contrast, tmder Scenario 1 (unsewered) only about 40 acres are utilized, and the potential nonresidential floor area development is less than one-tenth of the other three scenarios.
Buena Vista Township Economic Development Strategtj February 2000 Page 51

Table 27: Scenario Comparison - Land Use Allocation at Buildout (acres)
Uses 1. Unsewered 2. Sewered- 3. Sewered- 4. Retirement Infill Redevelorment Focus
Village Commercial 4.0 3.8 Strip Shopping Center 3.0 3.0 3.1 Fast Food 7.5 5.0 7.0 5.7 General Retail 10.0 10.6 10.0 7.7 Retail 17.5 18.6 24.0 20.3 Office 17.0 19.0 17.2 Light Industry 22.2 38.6 38.0 38.0 Retirement Facility 9.2 Subtotal 39.7 74.1 81.0 84.7 Nonresidential Village Residential 25.0 25.0 Residential 5.0 -Total 39.7 79.1 106.0 109.7
Table 28: Scenario Comparison - Estimated Development Potential at Buildout (square feet of gross floor area)
Uses 1. Unsewered 2. Sewered- 3. Sewered- 4. Retirement Infill Redevelorment Focus
Village Commercial 52,270 49,660 Strip Shopping 19,600 19,600 20,260 Center Fast Food 2,930 43,560 60,980 49,660 General Retail 7,840 69,130 65,340 50,310 Retail 10,770 132,290 198,190 169,890 Office 148,100 165,520 149,850 Light Industry 62,940 503,770 496,580 496,580 Retirement Facility 60,110 Total Nonresidential 73,710 784,160 860,290 876,430
Village Residential* 250 250 Residential* 5 Total Residential* 5 250 250
&*Residential develofiment is indicated in number of hOUSidf units, not square feet. Village residential equates to a mixture of sma apartments, senior housing (not inclu ing retirement facilities), and condominiums.
Scenario 4 also creates the most financial benefit to the Township, as indicated in Table 29 and Table 30. Again, Scenario 3 generates almost as much valuation and tax revenue, while the revenues from Scenario 1 are only about 7 percent of the Scenario 2 levels and 3 percent of the levels for Scenarios 3 and 4.
Buena Vista Township Economic Development Strategtj February 7-000 Page 52
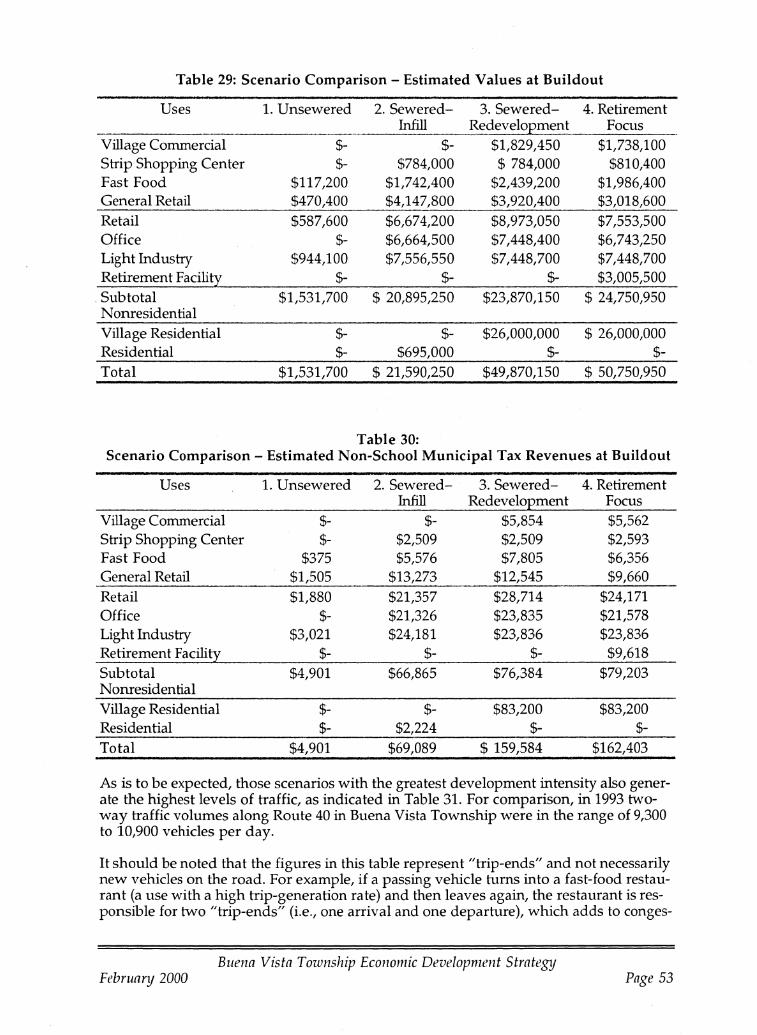
Table 29: Scenario Comparison - Estimated Values at Buildout
Uses 1. Unsewered 2. Sewered- 3. Sewered- 4. Retirement Infill Redevelo.ement Focus
Village Commercial $- $- $1,829,450 $1,738,100 Strip Shopping Center $- $784,000 $ 784,000 $810,400 Fast Food $117,200 $1,742,400 $2,439,200 $1,986,400 General Retail $470,400 $4,147,800 $3,920,400 $3,018,600 Retail $587,600 $6,674,200 $8,973,050 $7,553,500 Office $- $6,664,500 $7,448,400 $6,743,250 Light Industry $944,100 $7,556,550 $7,448,700 $7,448,700 Retirement Facility $- $- $- $3,005,500
. Subtotal $1,531,700 $ 20,895,250 $23,870,150 $ 24,750,950 Nonresidential Village Residential $- $- $26,000,000 $ 26,000,000 Residential $- $695,000 $- $-Total $1,531,700 $ 21,590,250 $49,870,150 $ 50,750,950
Table 30: Scenario Comparison - Estimated Non-School Municipal Tax Revenues at Buildout
Uses 1. Unsewered 2. Sewered- 3. Sewered- 4. Retirement Infill Redevelo.ement Focus
Village Commercial $- $- $5,854 $5,562 Strip Shopping Center $- $2,509 $2,509 $2,593 Fast Food $375 $5,576 $7,805 $6,356 General Retail $1,505 $13,273 $12,545 $9,660 Retail $1,880 $21,357 $28,714 $24,171 Office $- $21,326 $23,835 $21,578 Light Industry $3,021 $24,181 $23,836 $23,836 Retirement Facility $- $- $- $9,618 Subtotal $4,901 $66,865 $76,384 $79,203 Nonresidential Village Residential $- $- $83,200 $83,200 Residential $- $2,224 $- $-Total $4,901 $69,089 $ 159,584 $162,403
As is to be expected, those scenarios with the greatest development intensity also generate the highest levels of traffic, as indicated in Table 31. For comparison, in 1993 twoway traffic volumes along Route 40 in Buena Vista Township were in the range of 9,300 to 10,900 vehicles per day.
It should be noted that the figures in this table represent "trip-ends" and not necessarily new vehicles on the road. For example, if a passing vehicle hlrns into a fast-food restaurant (a use with a high trip-generation rate) and then leaves again, the restaurant is responsible for two "trip-ends" (i.e., one arrival and one deparhue), which adds to conges-
Buena Vista Township Economic Development StrategIJ February 2000 Page 53

tion along the roadway but does not necessarily increase total traffic volume along the road. While almost all the trips generated by residential and industrial uses are new to the area, retail and (to a lesser extent) office developments tend to attract and divert traffic that is already on the road.
Table 31: Scenario Comparison - Traffic Generation (trip-ends per day) at Buildout
Uses 1. Unsewered 2. Sewered- 3. Sewered- 4. Retirement Infill Redevelorment Focus
Village Commercial 1,568 1,490 Strip Shopping Center 784 784 810 Fast Food 586 8,712 12,196 9,932 General Retail 314 2,765 2,614 2,012 Retail 900 12,261 17,162 14,245 Office 2,222 2,483 2,248 Light Industry 441 3,526 3,476 3,476 Retirement Facility 601 Subtotal 1,340 18,009 23,121 20,570 Nonresidential Village Residential 2,500 2,500 Residential 50 Total 1,340 18,059 25,621 23,070
Table 32 presents the estimated wastewater volumes generated l.mder each of the scenarios. Clearly, Scenario 4, with its heavier emphasis on residential uses, would generate the greatest volume of wastewater, more than three times the volume attributable to Scenario 2, which has little residential development and lower retail intensities. These figures include only new wastewater generation, not wastewater generated by existing uses that tie into the new system.
Buena Vista Township Economic Development StmtegtJ February 2000 Page 54

Table 32: Scenario Comparison - Wastewater Generation (gallons per day) at Buildout
Uses 1. Unsewered 2. Sewered- 3. Sewered- 4. Retirement Infill Redevelopment Focus
Village Commercial 6,534 6,208 Strip Shopping Center 2,450 2,450 2,533 Fast Food 703 10,454 14,635 11,918 General Retail 980 8,641 8,168 6,289 Retail 1,683 21,546 31,786 26,947 Office 18,513 20,690 18,731 Light Industry 2,203 17,632 17,380 17,380 Retirement Facili!y 19,235 Subtotal 3,886 57,690 69,857 82,294 Nonresidential Village Residential 112,500 112,500 Residential 2,250 Total 3,886 59,940 182,357 194,794
Comparing the estimated wastewater generation for the four scenarios at the subarea level reveals the possibilities for different wastewater strategies for each subarea. As indicated in Table 33, even in the scenarios with high total wastewater generation, the volumes tend to be much greater at the two ends of the corridor than in the central portions. As a result, the Township might consider a strategy combining on-site septic systems in the middle of the corridor with public solutions at the ends-for example, linking Subarea 1 to the Buena Borough system and creating a small treatment system for Subarea 4. This type of approach is discussed further in the next section of the report.
Table 33: Estimated Wastewater Generation for Each Scenario, By Subarea -- - ! Scenario Subarea 1 Subarea 2 Subarea 3 Subarea 4 Total
Scenario 1 1,967 233 - 1,687 3,886 Scenario 2 43,885 7,008 - 9,047 59,940 Scenario 3 52,107 44,711 2,178 83,361 182,357 Scenario 4 157,839 6,289 - 30,667 194,794
Buena Vista Township Economic Development Strategtj February 2000 Page 55
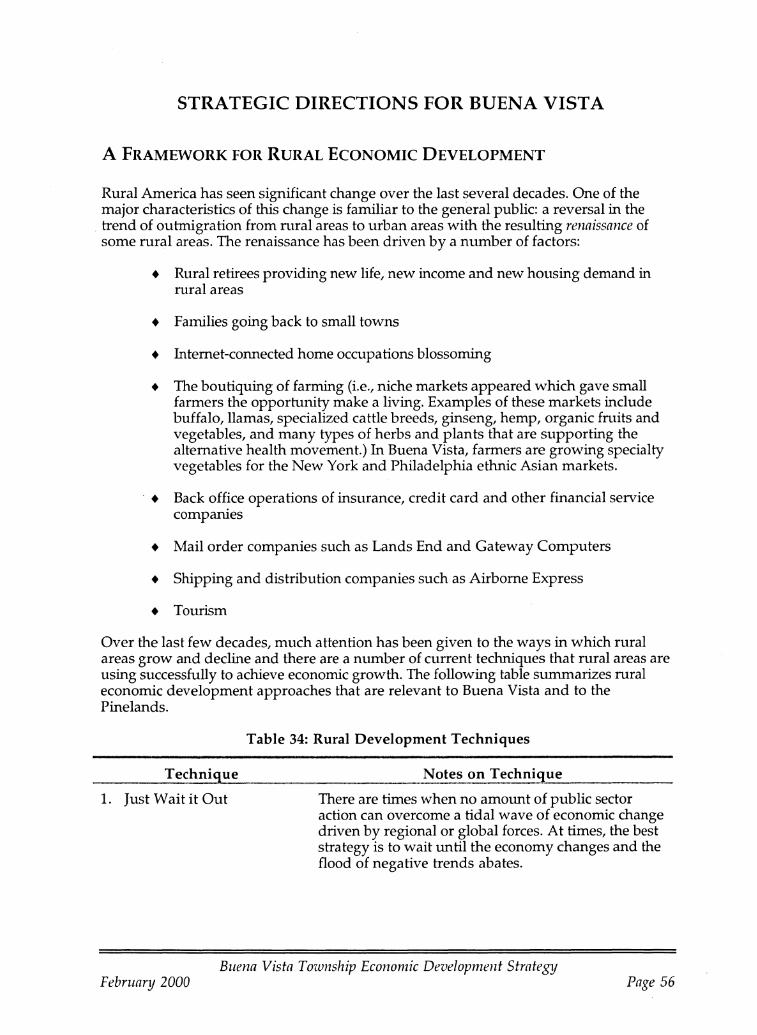
STRATEGIC DIRECTIONS FOR BUENA VISTA
A FRAMEWORK FOR RURAL ECONOMIC DEVELOPMENT
Rural America has seen significant change over the last several decades. One of the major characteristics of this change is familiar to the general public: a reversal in the trend of outmigration from rural areas to urban areas with the resulting renaissance of some rural areas. The renaissance has been driven by a number of factors:
• Rural retirees providing new life, new income and new housing demand in rural areas
• Families going back to small towns
• Internet-connected home occupations blossoming
• The boutiquing of farming (i.e., niche markets appeared which gave small farmers the opportunity make a living. Examples of these markets include buffalo, llamas, specialized cattle breeds, ginseng, hemp, organic fruits and vegetables, and many types of herbs and plants that are supporting the alternative health movement.) In Buena Vista,farmers are growing specialty vegetables for the New York and Philadelphia ethnic Asian markets.
.• Back office operations of insurance, credit card and other financial service companies
• Mail order companies such as Lands End and Gateway Computers
• Shipping and distribution companies such as Airborne Express
• Tourism
Over the last few decades, much attention has been given to the ways in which rural areas grow and decline and there are a number of current techniques that rural areas are using successfully to achieve economic growth. The following table summarizes rural economic development approaches that are relevant to Buena Vista and to the Pinelands.
Technique
1. Just Wait it Out
Table 34: Rural Development Techniques
Notes on Technique
There are times when no amount of public sector action can overcome a tidal wave of economic change driven by regional or global forces. At times, the best strategy is to wait until the economy changes and the flood of negative trends abates.
Buena Vista Township Economic Development Strategtj February 2000 Page 56

2. Offer Infrastruchue and Wait for the Market
3. Provide a Land Use Framework and Wait for the Market
4. Sponsor Public Owned Business Parks or Other Real Estate
5. Public Buys a Business
6. Tax Subsidies
Although it can be a long wait it is common for communities to invest in the necessary infrastruchlre to accommodate economic growth and then wait for the companies to come. In some respects, this approach makes great sense since industry will often not come until the infrastruchue is in place. This is especially true in areas where there is weak market demand. Long-term carrying cost for a commlmity can be substantial
Related to the above point is the strategy of developing a land use framework to shape development well before there is market demand. This ensures that when development arrives, it can be managed appropriately.
In this case, the local or regional government buys land or buildings, creates serviced sites or buildings and works to attract tenants or buyers. The up-front commitment from government is substantial and the carrying costs for the facility can become politically difficult if the market does not respond strongly and quickly.
Some communities have aChlally searched out and purchased a business in order to provide local jobs and stimulate more investment. In one case, shares were sold to the general public for $10 a piece. In the end, these funds and grant dollars allowed the town to buy a small furniture company, bring it to town and help it become profitable.
Enterprise Zones are the most recent examples of the long standing technique of lowering property and income tax levels to attract business. Despite the many tales of companies that invest, take the subsidy and then leave, many areas continue to offer tax subsidies and they work. Recent enterprise zone regulations limit the number of one night industrial investments and target new business investment to regions of states that are most in need of economic growth. The combination of offering job training assistance with state income tax subsidies makes the deal even more appealing for relocating businesses. Vineland is a large urban enterprise zone.
Buena Vista Township Economic Development Strategy February 2000 Page 57

7. Beneficial Taxation Programs
8. Advertise/Create an Image
9. Clustered Economic Growth
10. Rural Networks
11. Amenity Driven Development
Tax increment financing and business improvement districts are both common techniques whereby property taxes are targeted for improvements within specified areas. TIFs hold down overall taxes on properties within a given area by maintaining the taxation level existing at the time of investment for the new business and using the incremental taxes flowing from the new investment to help the business pay down long-term debt. BIDs assess a special tax within a given area and the revenues flowing from that tax are spent only within the targeted area. Businesses pay more taxes, but they see a direct proportional benefit from their taxes.
Often communities suffer from being unknown. While most rural places cannot afford an advertising campaign per se, most can afford to become more active in state and regionally sponsored economic development advertising. One of the spin-off benefits of tourism is that it brings people to the community and thus creates more general awareness of the place. Increasingly, rural business investment is initiated by people discovering the place through pleasure travel. Other options for creating awareness are the Internet, direct mail, attendance at business trade shows, coop advertising and working with a writer to place articles in strategically selected publications.
A cluster strategy normally builds on one or two existing strong business sectors which already show some diversification within the local economy and have ties to growing economic sectors in the broader economy. There is demonstrated evidence that clustered businesses have many advantages over competitors operating in isolated circumstances.
Rural networks are deliberately constructed systems of business support that address the needs of local businesses. They can involve cooperative purchasing systems, shared space, research and development support from local universities, and many other resources.
This model is driven by the desire of retirees, geographically free workers and businesses to find locations that offer a high quality of life. Public sector investments in recreation facilities, lakes, trails, downtowns, school systems and the protection of open space all enhance amenities that are appealing to investors.
Buena Vista Township Economic Development Strateg1j February 2000 Page 58
12. Retirement Regions
13. Tourism Regions
Rural retirees are a major economic trend. Some areas of the country area focusing all their energies on attracting retirees because they bring income, generate few local service demands and energize local real estate markets. Communities must offer a good mixhue of appealing climate, culhtral activities, recreational amenities and affordable housing to compete for retirees.
Tourism is becoming an increasingly powerful economic force in rural areas. This is due to the general growth in tourism around the world and the fact tha t tourism is a business sector over which public sector investment, marketing and management can have a great influence. Often it is the public sector that offers the product (e.g., national parks, museums, historic sites, etc.) that draw the travelers.
While this is not an exhaustive list, it does suggest the variety of ways in which communities can foster rural growth. The type of approach a community takes depends on available resources, grant writing savvy, and the particular assets and challenges facing the place. For the purposes of this study, it is assumed that a mixture of some of these techniques will be most appropriate for Buena Vista.
CRITICAL STRATEGIC FACTORS
The analysis presented above suggests several key themes that the Township should at least consider, if not directly incorporate, in its economic development strategy:
1. The study area is limited in size and is stretched out along 1.6 miles of Route 40. The linear shape of the area limits the types of uses that can occur. For example, a major industrial park is not an option
2. While the shldy area is close to the Atlantic City Expressway, it is not close enough to offer a location that can take maximum advantage of the Expressway or which can draw traffic from the Expressway. Thus, the Expressway is an asset, but a minor asset.
3. Buena Vista lies adjacent to an area experiencing strong economic growth-Vineland. According to local economic development professionals, the critical factors preventing growth in the study area are first, the lack of sewers, and secondly a perception that the Pinelands regulations are too onerous to tackle unless absolutely necessary. Since ample serviced sites are nearby, both inside and outside the Pinelands, Buena Vista's sites are not competitive.
4. Route 40 traffic levels-midweek 10,000 to 12,000 trips-are high, but not high enough to create a "miracle mile" type of retail area.
Buena Vista Township Economic Development Strategtj February 2000 Page 59
5. The land lying along Route 54 in the PT zone offers the greatest development potential as it consists of over 50 acres of vacant, contiguous, buildable land.
6. If sewers were present, it is most likely that the market would see opporhmities for more fast food restaurants and other auto-oriented businesses.
7. An important aspect of this strategy is to define what type of place the community wishes the Shldy area to become. Should it, or one subarea, become a village center? Should it be an attractively designed strip shopping area? Should its focus be on industrial and office activity? Should it present an image distinct from Landisville?
8. One of the key ingredients to many successful rural economic development efforts is offering the appealing small town environment that retirees, families and businesses associate with rural life. Buena Vista has a number of small villages, but only Richland feels like a distinct place. If the Township created a new village, it might then offer the classic rural appeal.
9. With whom is the Township competing for business investment? The answer depends on the type of investment sought by the commlmity. For industrial and larger office development, Vineland is clearly a competitor. The enterprise zone and other incentives offered by that community will be difficult-perhaps impossible-for Buena Vista to match. Therefore, Buena Vista should not attempt to attract the types of firms that Vineland is attracting. Generally speaking, Buena Vista does not have the capacity to accommodate very large businesses. A threshold for marketing might be set at businesses of 200 or fewer employees. Buena Vista does offer qualities that Vineland cannot match. The Township will attract the smaller light industrial or office business that is seeking the following qualities: a rural setting, no traffic congestion and easy access for workers who live in Vineland or along the Expressway corridor. In addition, Hammonton will be a competitor. Again, Buena Vista must compete with its rural character.
10. Buena Vista must offer wastewater disposal options of some type if it is to attract sufficient business investment to make its economic development effort worthwhile. The development capacity analysis demonstrates that build out of the corridor in an unsewered fashion will generate less than $5000 in additional, non-school, tax revenues.
11. Buena Vista's strategy should perhaps take a broader view of the potential future development of the immediate region. As Vineland continues to grow, there will be new development pressures to areas northeast of the City in Landisville, Minotola and Buena Vista. Although the majority of Buena Vista lies in the Pinelands, its lands to the west and the adjoining western commlmities are outside the Pinelands. What type of development pattern might Buena Vista encourage that will in the long nm be compatible and sustaining to the development pattern that is likely to emerge along the Township'S western border?
12. Buena Vista has a cluster of pharmaceutical related firms within and near to the Township. The Township also continues to share some of the regional cluster of glass industries.
13. Buena Vista Township has a strong base of agriculhtre. Ideally, the Township's economic development strategy should attempt to capitalize on and support this sector.
Buena Vista Township Economic Development Strategy February 2000 Page 60
14. Regional growth is also occurring in the construction, wholesale and service sectors. More specific categories include business services, support health services, data processing, telemarketing, back office operations and retirement facilities.
15. Atlantic City traffic along Route 40 offers an opporhmity for the comrmmity to provide more tourism-oriented services. The Township's position as a gateway community also offers a potential opporhmity for the comrmmity to act as an interpretive gateway for travelers. For example, an interpretive facility might focus on the agriculhual heritage and economy of the Pine lands. In addition, the Township's golf courses might also form the base for a tourism promotion effort.
16. Assumptions regarding the ability of the local real estate market to absorb new development suggest that the Shldy area has more land available than could be absorbed for business development over the next ten years. There appears to be sufficient demand in the residential sector to absorb the excess land. If the right types of residential development is chosen, then the fiscal impact to the Township could be positive. Under current zoning, however, housing is not allowed in the Pine lands Town district.
Buena Vista Township Economic Development Strategtj February 2000 Page 61
BUENA VISTA'S PATH
This analysis has defined the parameters within which economic development is most likely to occur. It has also examined local and regional economic trends to find potential opporhmities for the commlmity. Based on this work, the following menu of strategic directions appears feasible for Buena Vista Township. The menu concept is used because different components of the list can be mixed and matched, although some ideas go together better than others.
Land Use Options
1. Light Industry/Office Option: Focus on light industrial and office with retail in high traffic, high visibility frontage areas. This option allows for retail development to occur but with a clear site priority given to light industry and office uses. In other words, retail uses should not be allowed to push light industry and office from sites that are well suited for those latter uses. The housing element of this option would be for small apartments targeted for families with no or few children in order to minimize the impacts on the school system. This option corresponds to Scenario 3 -Sewered-Redevelopment (page 49) in the land use scenarios.
2. Mixed Use Option: Mix village/pedestrian-oriented development with a senior housing and service theme and light industrial and office uses. This option incorporates the idea of a place or center within the Study Area but in a fiscally positive manner. It would create pedestrian systems and more strongly support any tourismoriented efforts to be undertaken by the Township. It also includes equal amounts of light industry and office development. It corresponds to Scenario 4 - Retirement Services (page 50).
Wastewater Options
1. Work with Buena Borough to hook into the Borough's system at the western end of the Shldy area in order to allow for short-term development to occur. Design the development in a manner that keeps volume below 50,000 gpd.
2. Install a package plant in Subareas 2 or 3 to serve the elementary school and development in Subarea 2. Fifty thousand gpd capacity should be sufficient.
3. Install a package plant in Subarea 4 to serve development in that area. Capacity of up to 100,000 gpd might be necessary to meet existing and new demand.
Transportation and Circulation
1. Apply for funds to install sidewalks and streetscape improvements along Route 40.
2. Consider realigning the Cumberland Road/Route 40 intersection to the east of the Route 40/54 intersection and extending a new road north to service backlands in Subarea 1.
3. Consider widening Route 40 to provide a hlrning lane. The Township should also consider whether reverse frontage roads would be appropriate under certain
Buena Vista Township Economic Development Strategtj February 2000 Page 62

circumstances. Overall, road capacity will be an issue that must be addressed as development proceeds.
4. Develop a trail system running throughout the corridor to service workers, residents and visitors.
Public Investn1ents
1. Create a system of trails and interpreted nature areas in the wetlands to the north of Route 40. Obtain grant funds for public purchase of this land.
2. Build an interpretive center/visitor center (to make Route 40 traffic slow down and look around in the study area) on public land in Subarea 3. Focus the center on the Pinelands and its agricultural heritage and economy.
3. Create a farmers market facility within one of the development areas. This facility would feature products from local farmers and provide a stronger reason for people to stop in the Center.
4. Under land use scenarios that involve senior housing and services, incorporate a public-accessible recreation center in the development. This center should include facilities such as a pool, aerobic equipment, weight training equipment, and racquet courts.
Regulatory and Zoning Issues
1. Work with the Pinelands Commission to find a way to expedite project review within the study area. Consideration should be given to pre-approval for uses that are defined in the Township'S economic development strategy. The Pinelands Commission has considered a similar pre-approval process for Woodbine which addresses most potential development problems ahead of time and thus reduces the applicant's permitting time and cost.
2. Consider allowing apartments, senior housing and/ or condominiums within the PT district.
Marketing
1. Work with existing pharmaceutical and related companies to identify services or ancillary businesses that would benefit their businesses and would be attracted to the study area. Also identify any specific needs within this industry that the Township might be able to meet with the design and operation of its PT District and business areas.
2. Work with regional economic development organizations to encourage them to promote the Buena Vista Shldy area to relocating and expanding businesses.
3. Hold a design competition for graduate students at planning, landscape architecture, and architecture schools in the region to assemble ideas for a senior-oriented development along the corridor. Student assistance can be obtained as part of a class project, on a consulting basis (for a small fee), or in response to a reward (e.g., a $2,000 scholarship prize).
Buena Vista Township Economic Development Strategy February 2000 Page 63
4. Work with the owner of the vacant lands in Subarea 1 and issue a developer RFP for a senior-oriented village development.
5. Install a visitors center as part of the village development. Use this vehicle to promote the Township and its oppornmities.
6. Find a visible site within the study area and near senior housing that could be planted as a grand experimental garden for flowers, herbs and vegetables with management and maintenance by seniors and area farmers. Use this as a tourism draw, interpretive experience and advertisement for local farmers.
-. Buena Vista Township Economic Development Strategy February 2000 Page 64
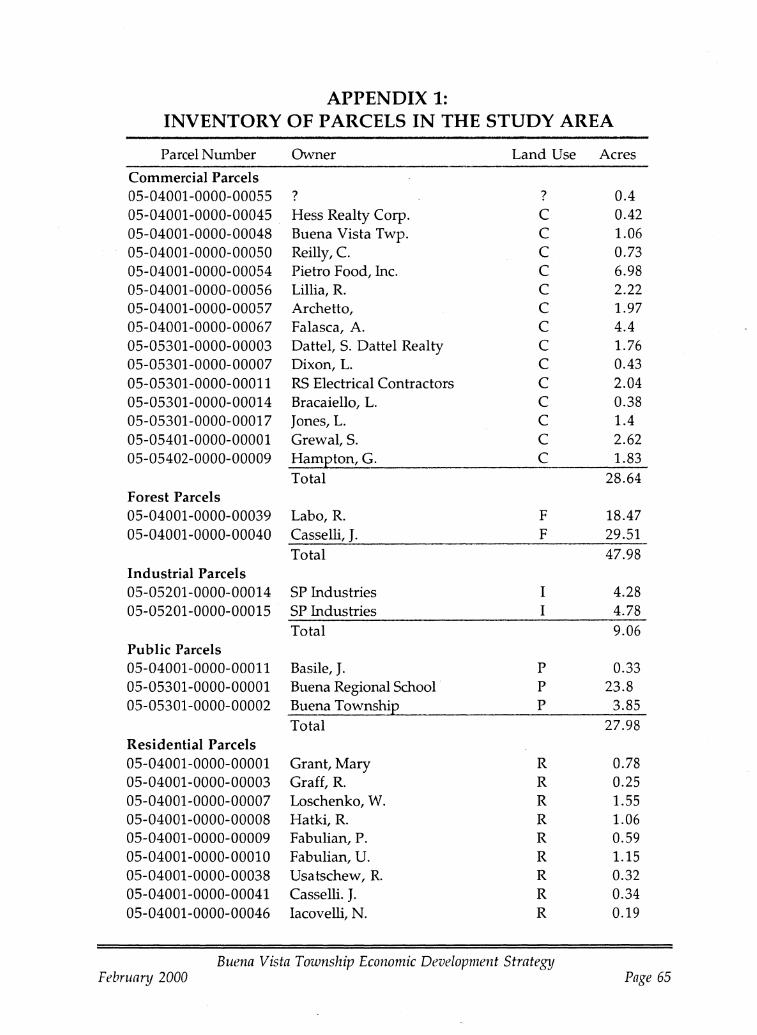
APPENDIX 1: INVENTORY OF PARCELS IN THE STUDY AREA
Parcel Number Owner Land Use Acres
Commercial Parcels 05-04001-0000-00055 ? ? 0.4 05-04001-0000-00045 Hess Realty Corp. C 0.42 05-04001-0000-00048 Buena Vista Twp. C 1.06 05-04001-0000-00050 Reilly, C. C 0.73 05-04001-0000-00054 Pietro Food, Inc. C 6.98 05-04001-0000-00056 Lillia, R. C 2.22 05-04001-0000-00057 Archetto, C 1.97 05-04001-0000-00067 Falasca, A. C 4.4 05-05301-0000-00003 Dattel, S. Dattel Realty C 1.76 05-05301-0000-00007 Dixon, L. C 0.43 05-05301-0000-00011 RS Electrical Contractors C 2.04 05-05301-0000-00014 Bracaiello, L. C 0.38 05-05301-0000-00017 Jones, L. C 1.4 05-05401-0000-00001 Grewal, S. C 2.62 05-05402-0000-00009 Hampton,G. C 1.83
Total 28.64 Forest Parcels 05-04001-0000-00039 Labo, R. F 18.47 05-04001-0000-00040 Casselli, J. F 29.51
Total 47.98 Industrial Parcels 05-05201-0000-00014 SP Industries I 4.28 05-05201-0000-00015 SP Industries I 4.78
Total 9.06 Public Parcels 05-04001-0000-00011 Basile, J. P 0.33 05-05301-0000-00001 Buena Regional School P 23.8 05-05301-0000-00002 Buena Township P 3.85
Total 27.98 Residential Parcels 05-04001-0000-00001 Grant, Mary R 0.78 05-04001-0000-00003 Graff, R. R 0.25 05-04001-0000-00007 Loschenko, W. R 1.55 05-04001-0000-00008 Hatki, R. R 1.06 05-04001-0000-00009 Fabulian, P. R 0.59 05-04001-0000-00010 Fabulian, U. R 1.15 05-04001-0000-00038 Usatschew, R. R 0.32 05-04001-0000-00041 Casselli. J. R 0.34 05-04001-0000-00046 Iacovelli, N. R 0.19
Buena Vista Township Economic Development Strategy February 2000 Page 65
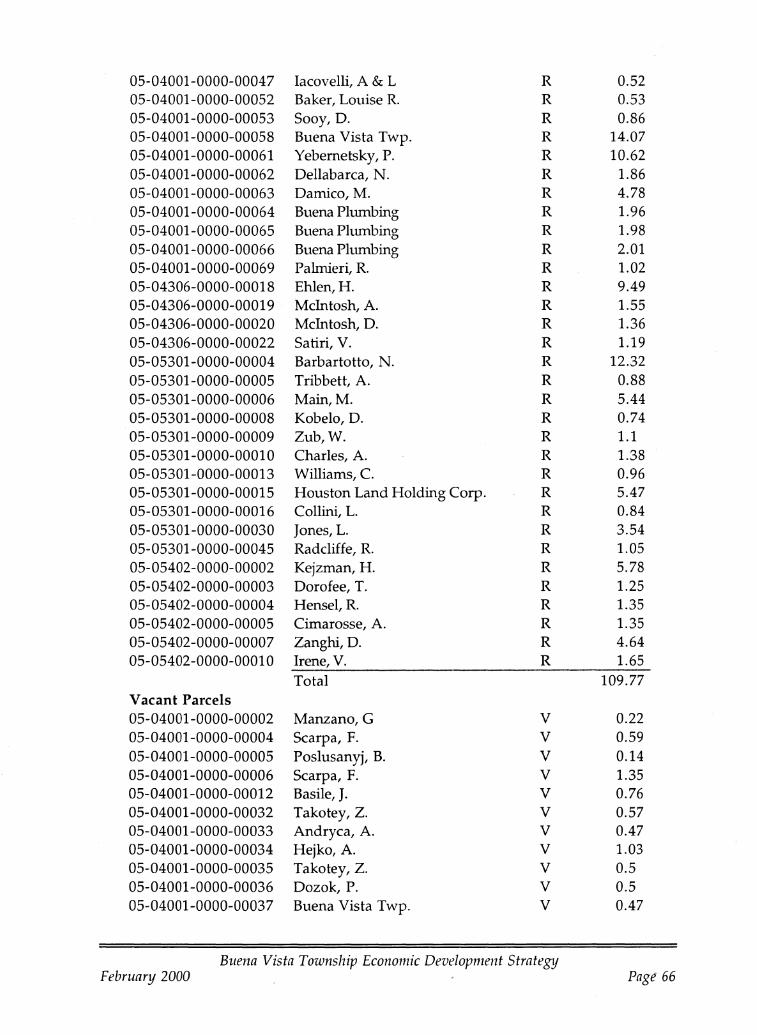
05-04001-0000-00047 Iacovelli, A & L R 0.52 05-04001-0000-00052 Baker, Louise R. R 0.53 05-04001-0000-00053 Sooy, D. R 0.86 05-04001-0000-00058 Buena Vista Twp. R 14.07 05-04001-0000-00061 Yebemetsky, P. R 10.62 05-04001-0000-00062 Dellabarca, N. R 1.86 05-04001-0000-00063 Damico, M. R 4.78 05-04001-0000-00064 Buena Plumbing R 1.96 05-04001-0000-00065 Buena Plumbing R 1.98 05-04001-0000-00066 Buena Plumbing R 2.01 05-04001-0000-00069 Palmieri, R. R 1.02 05-04306-0000-00018 Ehlen, H. R 9.49 05-04306-0000-00019 McIntosh, A. R 1.55 05-04306-0000-00020 McIntosh, D. R 1.36 05-04306-0000-00022 Satiri, V. R 1.19 05-05301-0000-00004 Barbartotto, N. R 12.32 05-05301-0000-00005 Tribbett, A. R 0.88 05-05301-0000-00006 Main, M. R 5.44 05-05301-0000-00008 Kobelo, D. R 0.74 05-05301-0000-00009 Zub, W. R 1.1 05-05301-0000-00010 Charles, A. R 1.38 05-05301-0000-00013 Williams, C. R 0.96 05-05301-0000-00015 Houston Land Holding Corp. R 5.47 05-05301-0000-00016 Collini, L. R 0.84 05-05301-0000-00030 Jones, L. R 3.54 05-05301-0000-00045 Radcliffe, R. R 1.05 05-05402-0000-00002 Kejzman, H. R 5.78 05-05402-0000-00003 Dorofee, T. R 1.25 05-05402-0000-00004 Hensel, R. R 1.35 05-05402-0000-00005 Cimarosse, A. R 1.35 05-05402-0000-00007 Zanghi, D. R 4.64 05-05402-0000-00010 Irene, V. R 1.65
Total 109.77 Vacant Parcels 05-04001-0000-00002 Manzano, G V 0.22 05-04001-0000-00004 Scarpa, F. V 0.59 05-04001-0000-00005 Poslusanyj, B. V 0.14 05-04001-0000-00006 Scarpa, F. V 1.35 05-04001-0000-00012 Basile, J. V 0.76 05-04001-0000-00032 Takotey, Z. V 0.57 05-04001-0000-00033 Andryca, A. V 0.47 05-04001-0000-00034 Hejko, A. V 1.03 05-04001-0000-00035 Takotey, Z. V 0.5 05-04001-0000-00036 Dozok, P. V 0.5 05-04001-0000-00037 Buena Vista Twp. V 0.47
Buena Vista Township Economic Development Strateg1j February 2000 Page 66

05-04001-0000-00044 Casselli, J. V 7.74 05-04001-0000-00049 Casselli, J. V 0.44 05-04001-0000-00051 Casselli, J. V 0.77 05-04001-0000-00059 Pajic, N. V 0.74 05-04001-0000-00068 Buena Corp. V 1.7 05-04001-0000-00070 Buena Corp. V 1.53 05-04306-0000-00001 Buena Corp. V 11.52 05-04306-0000-00002 Buena Corp.· V 0.74 05-04306-0000-00003 Brunozzi, S. & J. V 2.81 05-04306-0000-00021 Fagotti, S. V 1.29 05-05402-0000-00001 Tamburro, R. V 5.46 05-05402-0000-00006 Woschenko, M. V 4.84 05-05402-0000-00008 Zanghi, D. V 6.21
Total 52.39
Grand Total 275.82
Buena Vista Township Economic Development Strategy Febru.ary 2000 Page 67
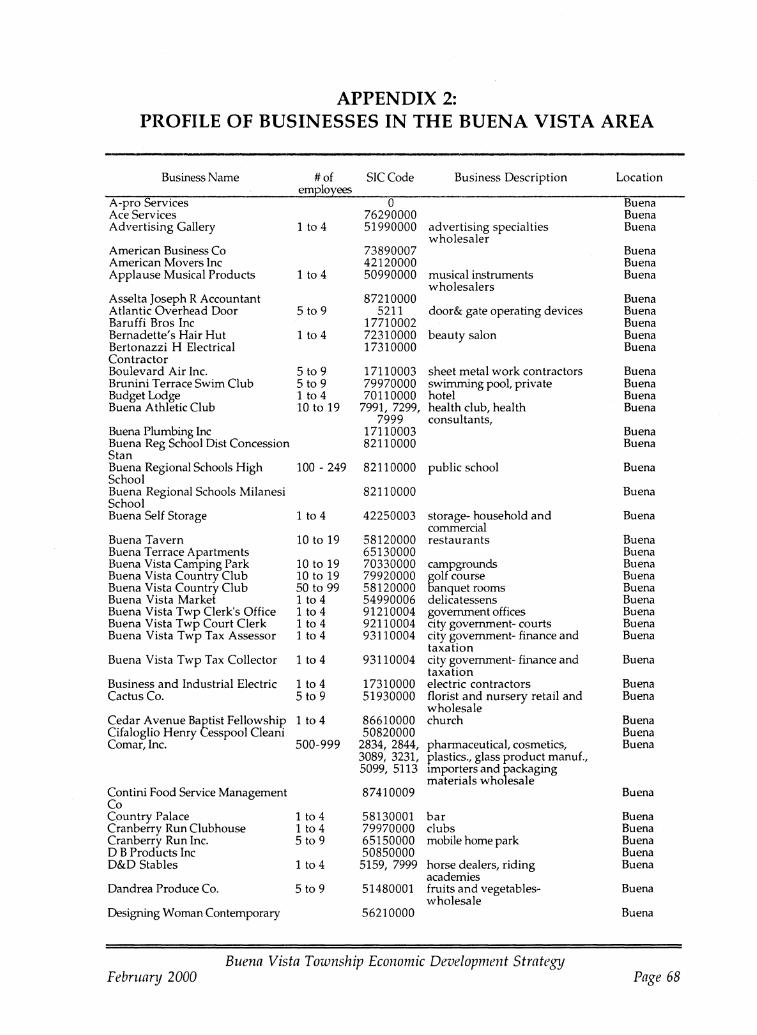
APPENDIX 2: PROFILE OF BUSINESSES IN THE BUENA VISTA AREA
Business Name #of employees
SIC Code Business Description Location
A-pro Services 0 Buena Ace Services 76290000 Buena Advertising Gallery 1 to 4 51990000 advertising specialties Buena
wholesaler American Business Co 73890007 Buena American Movers Inc 42120000 Buena Applause Musical Products 1 to 4 50990000 musical instruments Buena
wholesalers Asselta Joseph R Accountant 87210000 Buena Atlantic Overhead Door 5 to 9 5211 door& gate operating devices Buena Baruffi Bros Inc 17710002 Buena Bernadette's Hair Hut 1 to 4 72310000 beauty salon Buena Bertonazzi H Electrical 17310000 Buena Contractor Boulevard Air Inc. 5 to 9 17110003 sheet metal work contractors Buena Brunini Terrace Swim Club 5 to 9 79970000 swimming pool, private Buena Budget Lodge 1 to 4 70110000 hotel Buena Buena Athletic Club 10 to 19 7991, 7299, health club, health Buena
7999 consultants, Buena Plumbing Inc 17110003 Buena Buena Reg School Dist Concession 82110000 Buena Stan Buena Regional Schools High 100 - 249 82110000 public school Buena School Buena Regional Schools Milanesi 82110000 Buena School Buena Self Storage 1 to 4 42250003 storage- household and Buena
commercial Buena Tavern 10to19 58120000 restaurants Buena Buena Terrace Apartments 65130000 Buena Buena Vista Camping Park 10 to 19 70330000 campgrounds Buena Buena Vista Country Club 10 to 19 79920000 golf course Buena Buena Vista Country Club 50 to 99 58120000 anquet rooms Buena Buena Vista Market 1 to 4 54990006 delicatessens Buena Buena Vista Twp Clerk's Office 1 to 4 91210004 government offices Buena Buena Vista Twp Court Clerk 1 to 4 92110004 city government- courts Buena Buena Vista Twp Tax Assessor 1 to 4 93110004 city govemment- finance and Buena
taxation Buena Vista Twp Tax Collector 1 to 4 93110004 city government- finance and
taxation Buena
Business and Industrial Electric 1 to 4 17310000 electric contractors Buena Cactus Co. 5 to 9 51930000 florist and nursery retail and Buena
wholesale Cedar Avenue Battist Fellowship 1 to 4 86610000 church Buena Cifaloglio Henry esspool Cleani 50820000 Buena Comar,Inc. 500-999 2834, 2844, pharmaceutical, cosmetics, Buena
3089, 3231, plastics., glass product manuf., 5099, 5113 Importers and f.ackaging
materials who esale Contini Food Service Management 87410009 Buena Co Country Palace 1 to 4 58130001 bar Buena Cranberry Run Clubhouse 1 to 4 79970000 clubs Buena Cranberry Run Inc. 5 to 9 65150000 mobile home park Buena DB Products Inc 50850000 Buena D&D Stables 1 to 4 5159, 7999 horse dealers, riding
academies Buena
Dandrea Produce Co. 5 to 9 51480001 fruits and vegetables- Buena wholesale
Designing Woman Contemporary 56210000 Buena
Buena Vista Township Economic Development Strategtj February 2000 Page 68
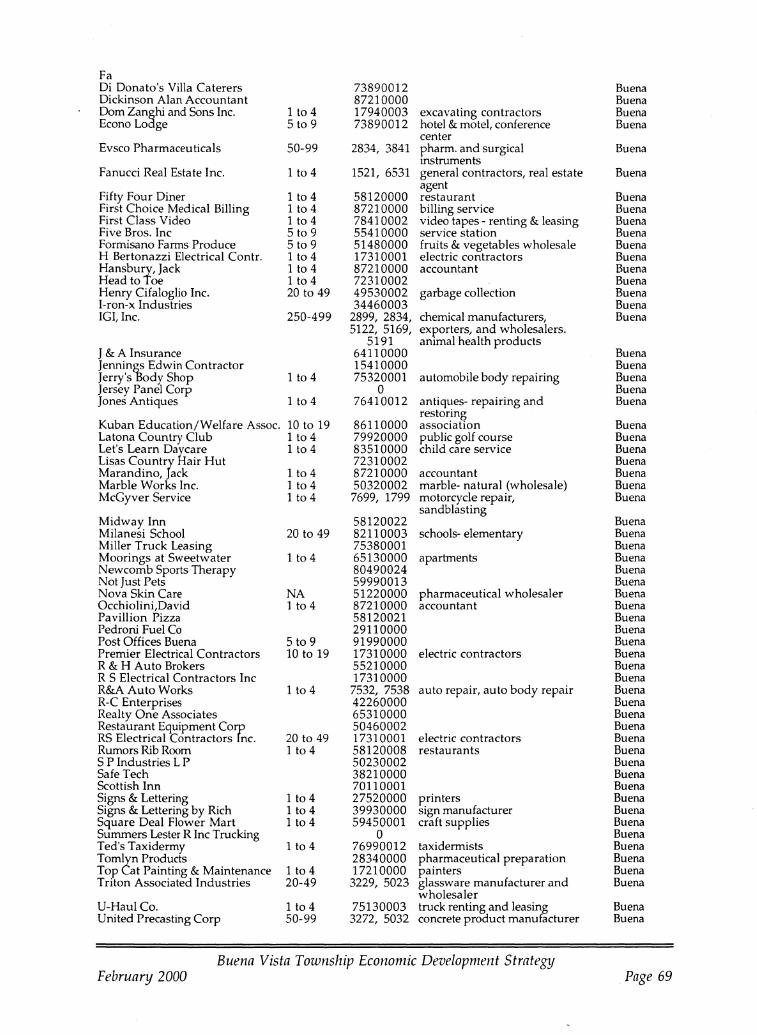
Fa Di Donato's Villa Caterers 73890012 Buena Dickinson Alan Accountant 87210000 Buena Dom Zan~hi and Sons Inc. 1 to 4 17940003 excavating contractors Buena Econo Lo ge 5 to 9 73890012 hotel & motel, conference Buena
center Evsco Pharmaceuticals 50-99 2834, 3841 pharm. and surgical Buena
mstruments Fanucci Real Estate Inc. 1 to 4 1521, 6531 general contractors, real estate Buena
Fifty Four Diner agent
1 to 4 58120000 restaurant Buena First Choice Medical Billing 1 to 4 87210000 billing service Buena First Class Video 1 to 4 78410002 video tapes - renting & leasing Buena Five Bros. Inc 5 to 9 55410000 service station Buena Formisano Farms Produce 5 to 9 51480000 fruits & vegetables wholesale Buena H Bertonazzi Electrical Contr. 1 to 4 17310001 electric contractors Buena Hansburt,' Jack 1 to 4 87210000 accountant Buena Head to oe 1 to 4 72310002 Buena Henry Cifaloglio Inc. 20 to 49 49530002 garbage collection Buena I-ron-x Industries 34460003 Buena IGI, Inc. 250-499 2899, 2834, chemical manufacturers, Buena
5122, 5169, exporters, and wholesalers. 5191 animal health products
J & A Insurance 64110000 Buena Jennin~ Edwin Contractor 15410000 Buena Jerry's ody Shop 1 to 4 75320001 automobile body repairing Buena Jersey Panel Corp 0 Buena Jones Antiques 1 to 4 76410012 antiques- repairing and Buena
Kuban Education/Welfare Assoc. 10 to 19 86110000 restoring association Buena
Latona Country Club 1 to 4 79920000 public golf course Buena Let's Learn Da~care 1 to 4 83510000 child care service Buena Lisas Countrrc air Hut 72310002 Buena Marandino, ack 1 to 4 87210000 accountant Buena Marble Works Inc. 1 to 4 50320002 marble- natural (wholesale) Buena McGyver Service 1 to 4 7699, 1799 motorcycle repair, Buena
sandblasting Midway Inn 58120022 Buena Milanesi School 20 to 49 82110003 schools- elementary Buena Miller Truck Leasing 75380001 Buena Moorings at Sweetwater 1 to 4 65130000 apartments Buena Newcomb Sports Therapy 80490024 Buena Not Just Pets 59990013 Buena Nova Skin Care NA 51220000 pharmaceutical wholesaler Buena Occhiolini,David 1 to 4 87210000 accountant Buena Pavillion Pizza 58120021 Buena Pedroni Fuel Co 29110000 Buena Post Offices Buena 5 to 9 91990000 Buena Premier Electrical Contractors 10 to 19 17310000 electric contractors Buena R & H Auto Brokers 55210000 Buena R S Electrical Contractors Inc 17310000 Buena R&A Auto Works 1 to 4 7532, 7538 auto repair, auto body repair Buena R-C Enterprises 42260000 Buena Realty One Associates 65310000 Buena Restaurant Equipment Corr 50460002 Buena RS Electrical Contractors nco 20 to 49 17310001 electric contractors Buena Rumors Rib Room 1 to 4 58120008 restaurants Buena S P Industries L P 50230002 Buena Safe Tech 38210000 Buena Scottish Inn 70110001 Buena Signs & Lettering 1 to 4 27520000 printers Buena Signs & Lettering by Rich 1 to 4 39930000 sign manufacturer Buena Square Deal Flower Mart 1 to 4 59450001 craft supplies Buena Summers Lester R Inc Trucking 0 Buena Ted's Taxidermy lt04 76990012 taxidermists Buena Tom~n Products 28340000 pharmaceutical preparation Buena Top at Painting & Maintenance 1 to 4 17210000 painters Buena Triton Associated Industries 20-49 3229, 5023 glassware manufacturer and Buena
wholesaler U-HauICo. 1 to 4 75130003 truck renting and leasing Buena United Precasting Corp 50-99 3272, 5032 concrete product manufacturer Buena
Buena Vista Township Economic Development Strategy February 2000 Page 69
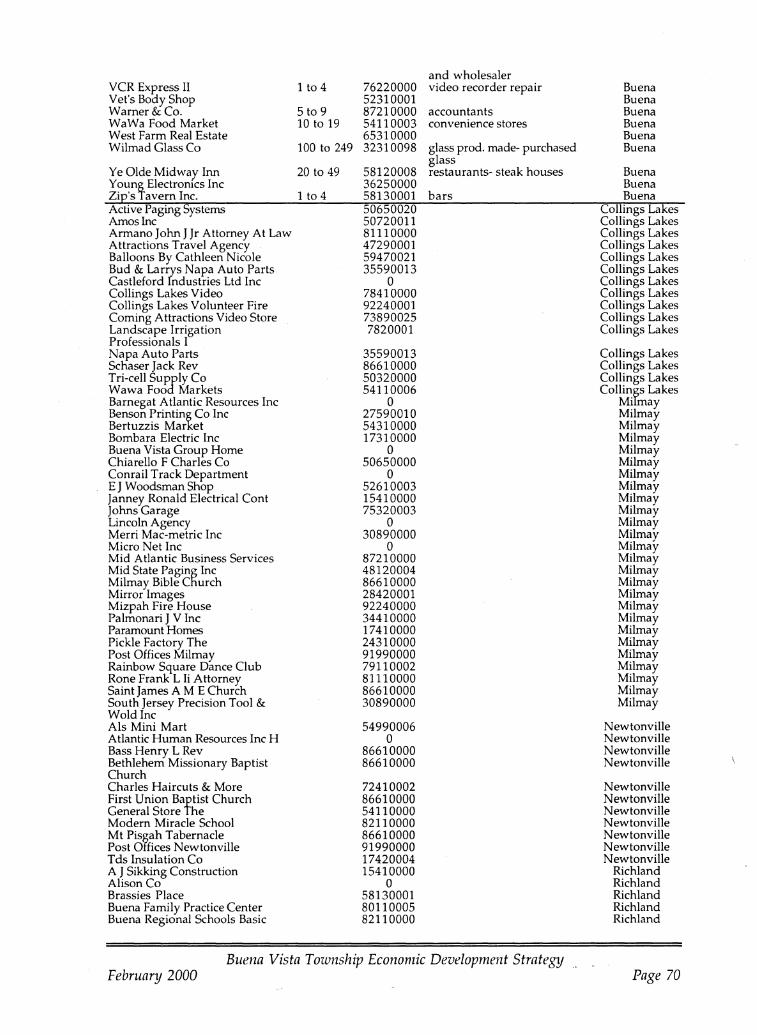
VCR Express II 1 to 4 Vet's Body Shop Warner & Co. 5 to 9 WaWa Food Market 10 to 19 West Farm Real Estate Wilmad Glass Co 100 to 249
Ye Olde Midway Inn 20 to 49 Young Electromcs Inc Zip's Tavern Inc. 1 to 4 Active Paging Systems Amos Inc Armano John J Jr Attorney At Law Attractions Travel Agency Balloons By Cathleen Nicole Bud & Larrys Napa Auto Parts Castleford Industries Ltd Inc Collings Lakes Video Collings Lakes Volunteer Fire Coming Attractions Video Store Landscape Irrigation Professionals I Napa Auto Parts Schaser Jack Rev Tri-cell Supply Co Wawa Food Markets Barnegat Atlantic Resources Inc Benson Printing Co Inc Bertuzzis Market Bombara Electric Inc Buena Vista Group Home Chiarello F Charles Co Conrail Track Department E J Woodsman Shop Janney Ronald Electrical Cont Johns Garage Lincoln Agency Merri Mac-metric Inc Micro Net Inc Mid Atlantic Business Services Mid State Paging Inc Milmay Bible Cnurch Mirror Images Mizpah Fire House Palmonari J V Inc Paramount Homes Pickle Factory The Post Offices Milmay Rainbow Square Dance Club Rone Frank L Ii Attorney Saint James A M E Church South Jersey Precision Tool & Wold Inc Als Mini Mart Atlantic Human Resources Inc H Bass Henry L Rev Bethlehem Missionary Baptist Church Charles Haircuts & More First Union Baptist Church General Store The Modern Miracle School Mt Pisgah Tabernacle Post Offices Newtonville Tds Insulation Co A J Sikking Construction Alison Co Brassies Place Buena Family Practice Center Buena Regional Schools Basic
76220000 52310001 87210000 54110003 65310000 32310098
58120008 36250000 58130001 50650020 50720011 81110000 47290001 59470021 35590013
o 78410000 92240001 73890025 7820001
35590013 86610000 50320000 54110006
o 27590010 54310000 17310000
o 50650000
o 52610003 15410000 75320003
o 30890000
o 87210000 48120004 86610000 28420001 92240000 34410000 17410000 24310000 91990000 79110002 81110000 86610000 30890000
54990006 o
86610000 86610000
72410002 86610000 54110000 82110000 86610000 91990000 17420004 15410000
o 58130001 80110005 8211 0000
and wholesaler video recorder repair
accountants convenience stores
glass prod. made-- purchased glass restaurants- steak houses
bars
Buena Vista Township Economic Development Strategy. February 2000
Buena Buena Buena Buena Buena Buena
Buena Buena Buena
Collings Lakes Collings Lakes Collings Lakes Collings Lakes Collings Lakes Collings Lakes Collings Lakes Collings Lakes Collings Lakes Collings Lakes Collings Lakes
Collings Lakes Collings Lakes Collings Lakes Collings Lakes
Milmay Milmay Milmay Milmay Milmay Milmay Milmay Milmay Milmay Milmay Milmay Milmay Milmay Milmay Milmay Milmay Milmay Milmay Milmay Milmay Milmay Milmay Milmay Milmay Milmay Milmay
Newtonville Newtonville Newtonville Newtonville
Newtonville Newtonville Newtonville Newtonville Newtonville Newtonville Newtonville
Richland Richland Richland Richland Richland
Page 70
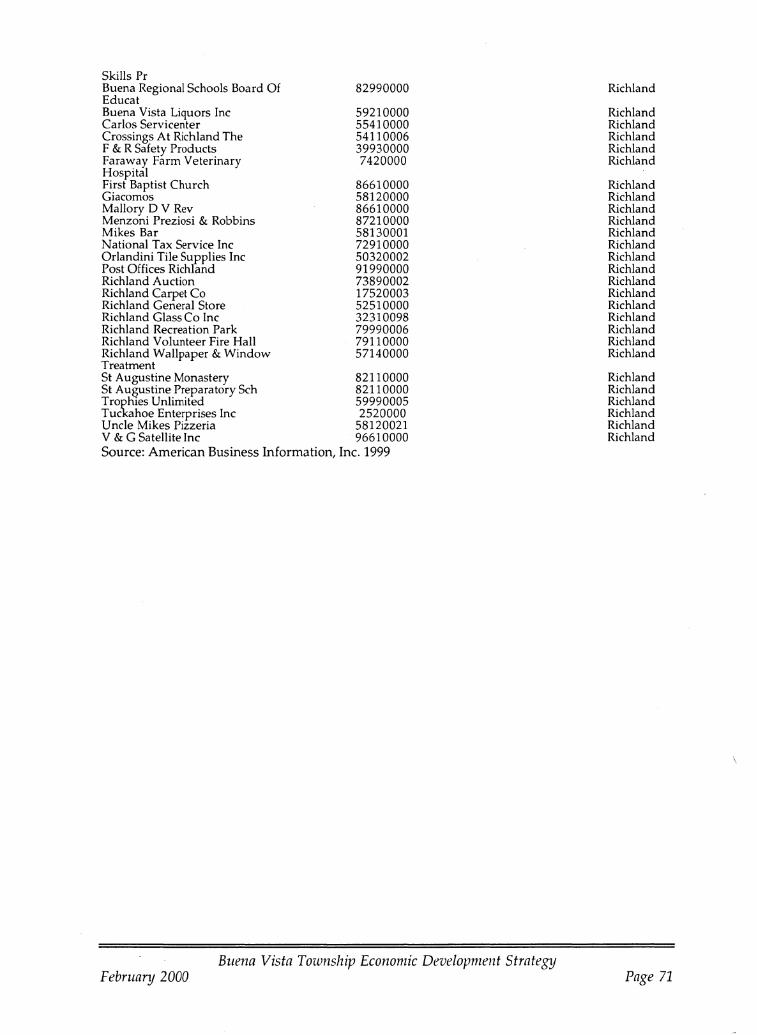
Skills Pr Buena Regional Schools Board Of Educat Buena Vista Liquors Inc Carlos Servicenter Crossings At Richland The F & R Safety Products Faraway Farm Veterinary Hospital First Baptist Church Giacomos Mallory D V Rev Menzoni Preziosi & Robbins Mikes Bar National Tax Service Inc Orlandini Tile Supplies Inc Post Offices Richland Richland Auction Richland Carpet Co Richland General Store Richland Glass Co Inc Richland Recreation Park Richland Volunteer Fire Hall Richland Wallpaper & Window Treatment
82990000
59210000 55410000 54110006 39930000 7420000
86610000 58120000 86610000 87210000 58130001 72910000 50320002 91990000 73890002 17520003 52510000 32310098 79990006 79110000 57140000
St Augustine Monastery 82110000 St Augustine Preparatory Sch 82110000 Trophies Unlimited 59990005 Tuckahoe Enterprises Inc 2520000 Uncle Mikes Pizzeria 58120021 V & G Satellite Inc 96610000 Source: American Business Information, Inc. 1999
Buena Vista Township Economic Development Strategtj February 2000
Richland
Richland Richland Richland Richland Richland
Richland Richland Richland Richland Richland Richland Richland Richland Richland Richland Richland Richland Richland Richland Richland
Richland Richland Richland Richland Richland Richland
Page 71
APPENDIX 3: ECONOMIC DEVELOPMENT ASSISTANCE RESOURCES
The Southern New Jersey Partnership for Economic Development provides assistance to seven counties. It promotes the Southern New Jersey region as a whole by providing site selection services and disseminates economic data to businesses on a regional basis. Potential businesses wishing to expand or relocate in southern New Jersey examine the region when making a location decision and are less interested in mlmicipal bOlmdaries. The organization generally works with businesses which employee 25 to 200 people. These businesses contact the Partnership as a result of targeted advertisements, direct mailing and marketing directed to site location specialists.
The South Jersey Economic Development District, with offices in Vineland, assists communities in attracting business development by assembling grant packages for the development of infrastructure, industrial parks, and other resources. It also provides loans for specialized business assistance programs to companies in Atlantic, Cape May, Cumberland, and Salem Counties.
The Greater Atlantic City branch of the New Jersey Small Business Development Centers located in Atlantic City offers a wide range of services to existing small business owners and to those considering starting their own business by providing cOlmseling, workshops, and loans from the Small Business Administration. The program is a cooperative effort of the private sector, the educational community and government agencies. Clients are assisted in determining the feasibility of their cash flow projections, financial statements, and marketing strategies.
Atlantic County Economic Development Corporation 2000 (known as Atlantic 2000) was established as a non-profit agency in 1994 and works with local agencies on financial packages for business recruitment and retention. The office is based in Atlantic Commlmity College in Mays Landing. The staff of Atlantic 2000 follow up on new business leads and package relevant economic and demographic information targeted to meet the specific needs of those business leads. Once the leads become tangible, staff assist in coordinating local and state permit and approval processes and in identifying other resources. The organization markets itself to businesses as the "one-stop shopping" contact for assistance in establishing businesses in Atlantic County by assisting with loans, permitting and identifying other necessary information (such as labor, training, and financing).
The Atlantic County Department of Regional Planning and Development is in many cases, the contact for economic development for communities that do not have the staff to support their own operations. The Atlantic 2000 committee has taken over many of the responsibilities that this department once addressed.
In 1998, Atlantic 2000 petitioned the New Jersey Economic Development Authority (NJEDA) with support from the Pinelands Municipal COlmcil to implement a Pinelands Incentive Priority Program (PIP) in order to provide selected Pinelands communities with priority status for selected programs available through the New Jersey EDA. The special designation would be similar to the Urban Aid Designation already in effect through the NJEDA and would allow selected Pinelands communities to qualify for most of the NJEDA's programs at the lowest interest rates available. NJEDA expressed interest in the Atlantic 2000 proposal, but first requested further information on the demand for
Buena Vista Township Economic Development Strategy February 2000 Page 72

commercial borrowing in specific Pinelands communities and the degree of interest in those communities for commercial expansion in order to determine the type of financial assistance required by businesses. To date, this information has not been provided to the NJEDA.
Buena Vista Township Economic Development Strategtj February 2000 Page 73