pioneer ibbotson asset allocation series - atlantic...
TRANSCRIPT
Pioneer Ibbotson Asset Allocation SeriesFour Investment StrategiesOne Asset Allocation Decision
Pioneer Funds
Asset Allocation
Subadvised by
Pioneer Ibbotson Asset Allocation Series is a family of four portfolio
allocations actively managed by Ibbotson Associates, a leading authority on
investing and asset allocation. Each portfolio is a ‘fund of funds’ invested in a
select group of Pioneer mutual funds.
Asset Allocation. Diversification. Rebalancing.Each of these investment steps is an important part of building and maintaining
a long-term portfolio. As subadvisor, Ibbotson Associates incorporates
each of these elements into its management process to help each fund pursue
attractive returns at a given level of risk.
Your Financial Advisor can help you select the portfolio that may be best for you based on your investment goals, time horizon and risk
tolerance. Ibbotson Associates allocates, diversifies and automatically rebalances
your investments over time, to keep them in line with your financial goals.
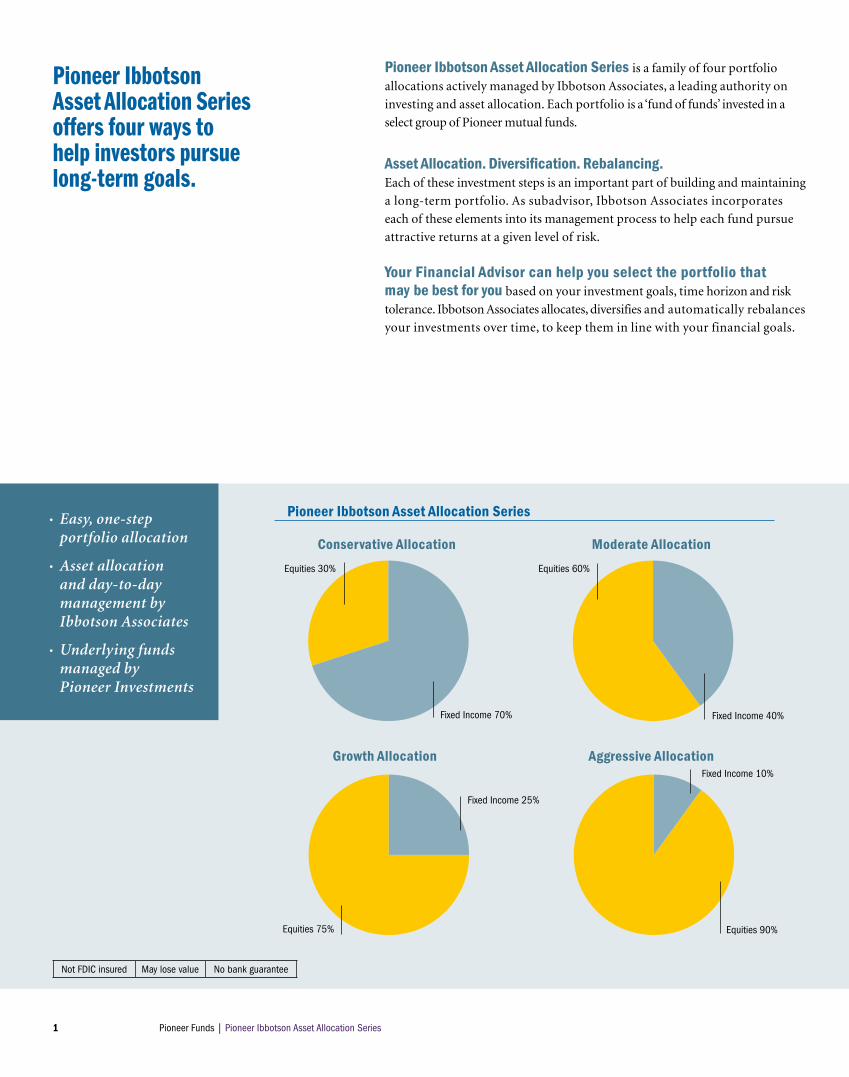
Pioneer Ibbotson Asset Allocation Series offers four ways to help investors pursue long-term goals.
• Easy, one-step portfolio allocation
• Asset allocation and day-to-day management by Ibbotson Associates
• Underlying funds managed by Pioneer Investments
Equities 30%
Fixed Income 70% Fixed Income 40%
Equities 60%
Fixed Income 25%
Equities 75% Equities 90%
Fixed Income 10%
Not FDIC insured May lose value No bank guarantee
Conservative Allocation Moderate Allocation
Aggressive AllocationGrowth Allocation
Pioneer Ibbotson Asset Allocation Series
1 Pioneer Funds | Pioneer Ibbotson Asset Allocation Series

Why Invest in a Fund of Funds? Many long-term investors — particularly those in search of retirement or
education savings solutions — have been attracted to the ease and convenience
that a fund of funds has to offer. With one investment decision, investors can
open the door to a carefully allocated and diversified portfolio designed to
pursue attractive returns at a level of risk that is comfortable for them.
Why Choose Pioneer Ibbotson Asset Allocation Series?As an investor in Pioneer Ibbotson Asset Allocation Series you are supported
by three levels of investment professionals.
First, the guidance of your financial advisor will help you choose the portfolio
that may be best for you.
Once you’ve made your decision, Ibbotson Associates will manage your fund.
Founded in 1977 by Roger Ibbotson, Ibbotson Associates is highly regarded
for its expertise in asset allocation modeling, fund evaluation and portfolio
construction — services that are typically reserved for large institutional clients.
Finally, you’ll have access to a diverse range of Pioneer mutual funds, spanning
virtually every investment asset class. As a leading innovator in the mutual
fund industry worldwide, Pioneer Investments has been helping investors
pursue their financial goals for 80 years.
Pioneer Investments brings the expertise of Ibbotson Associates to investors.
Ibbotson Associates
allocates, diversifies and
automatically rebalances
your investments over
time, to keep them in line
with your financial goals.
Designed for those invested in:
• Individual retirement accounts – Traditional and Roth IRAs, and rollovers
• Small business retirement plans – Uni-K, SEP and SIMPLE IRA
• Other long-term savings programs, including 403(b) and Coverdell Education Savings Accounts
Pioneer Funds | Pioneer Ibbotson Asset Allocation Series 2

Asset Allocation for a Solid Foundation Asset allocation is the process of combining asset classes such as stocks, bonds
and cash in a portfolio. The way you choose to allocate your investment dollars
can be a primary factor in determining your long-term investment success. In
fact, according to research conducted by Ibbotson Associates, it is the single
most important determinant of portfolio performance.
Your asset allocation should be influenced by your financial needs and goals,
your investment time horizon and your attitude toward risk. A professional
financial advisor can be useful in helping you determine these personal factors.
What Factors Influence Portfolio Performance?According to a study conducted by Roger Ibbotson and Paul Kaplan, 87.6% of
portfolio performance can be attributed to asset allocation, far outweighing the
effects of market timing, security selection and other factors.
“Asset allocation is critical to establishing a long-term, strategic investment plan.”
—Roger Ibbotson, Ph.D, Chairman and Founder, Ibbotson Associates, Inc.
Source: “Does Asset Allocation Policy Explain 40, 90, or 100 Percent of Performance”, Roger Ibbotson and Paul Kaplan, Jan./Feb. Financial Analysts Journal, 2000.
Other factors, including market timing and security selection
12.4%
Asset Allocation 87.6%
The way you choose to allocate your investment dollars can be a primary factor in determining your long-term financial success.
The Impact of Asset Allocation on Portfolio Performance
3 Pioneer Funds | Pioneer Ibbotson Asset Allocation Series

Why Diversify? Spreading your holdings across a range of investments within each major asset
class makes your portfolio less dependent on the performance of any single
type of investment. This offers two potential benefits:
1. You may reduce overall risk by ‘cushioning’ against volatility
in a single asset class
2. You may increase overall return by taking advantage of strong
performance over a broader range of investments
The Importance of Low CorrelationEffective diversification requires combining assets with low correlations — those
that have behaved differently over varying economic or market conditions.
The pie charts below illustrate the effects of low correlation on the risk
and return profiles of three hypothetical portfolios. Though it may seem
counterintuitive, adding a 21% stock allocation to the Fixed Income portfolio
actually reduced overall risk without affecting return. Similarly, increasing the
stock allocation to 30% allowed an increased return, without added risk.
An efficient allocation is one that is well diversified.
Cash 44%
Bonds 35%
Bonds 85%
Stocks 21%
Cash 15%
Stocks 30%
Cash 20%
Bonds 50%
Data represents past performance. Past performance is no guarantee of future results. Information is presented for illustrative purposes only and is not indicative of any investment. Assumes reinvestment of all income and does not account for taxes or transaction costs. Diversification does not eliminate the risk of experiencing investment losses.
Government bonds and Treasury bills are guaranteed by the full faith and credit of the United States government as to the timely payment of principal and interest. This guarantee does not eliminate market risk. Stocks are not guaranteed and have been more volatile than the other asset classes.
Source: Ibbotson Associates. Stocks represented by Standard & Poor’s 500 Index,® an unmanaged measure of U.S. stock market performance; Bonds represented by an equally weighted portfolio of 20-year U.S. Government Bonds and 5-year U.S. Government Bonds; Cash represented by 30-day U.S. Treasury Bills. It is not possible to invest directly in an index. Risk is measured by standard deviation, a statistical measure of the fluctuation of returns around the arithmetic average return of the investment. The higher the standard deviation, the greater the variability (and thus risk) of the investment returns. All portfolios are rebalanced annually. Charts prepared by Pioneer.
Adding Equities Reduced Risk or Increased Return (1970-2007)
Fixed Income PortfolioReturn 8.2% Risk 7.5%
Lower Risk PortfolioReturn 8.2% Risk 5.5%
Higher Return Portfolio Return 9.1% Risk 7.5%
Pioneer Funds | Pioneer Ibbotson Asset Allocation Series 4

Diversifying your portfolio makes you less dependent on the performance of any single asset class.
Avoid Market Motion SicknessFor many investors, staying diversified helps to alleviate
concerns about being in the right place at the right time.
It may also help ease anxiety during periods of market
volatility. Of course, diversification does not guarantee
a profit or protect against loss.
Data shown represents past performance. Past performance does not guarantee future results. The investments you choose should correspond to your financial needs, goals and risk tolerance. Consult your financial advisor for assistance in selecting investments.Source: Calculated by Pioneer Research using information and data from Morningstar Direct. Used with permission. Chart is for illustrative purposes only and not indicative of any investment. The data assumes reinvestment of all income and does not account for taxes or transaction costs.
Market Segment Key
Investment Represented by Index Risk Considerations
n Diversified Portfolio Calculated using an equal-weighted average, based on total return, of the indices provided. Equity investments offer a higher rate of return, but may be more volatile and riskier than fixed income investments.
Risks of international investing include currency fluctuations and political instability.
Small- and mid-cap stocks may be more volatile and less liquid than stocks of larger companies.
When interest rates rise, the prices of fixed income securities in the fund will generally fall. Conversely, when interest rates fall the prices of fixed income securities in the fund will generally rise.
Government bonds and Treasury bills are guaranteed by the full faith and credit of the United States government as to the timely payment of princi-pal and interest. This guarantee does not eliminate market risk.
Indices are unmanaged and their returns assume reinvestment of dividends and, unlike mutual fund returns, do not reflect any fees or expenses associated with a mutual fund. It is not possible to invest in an index. Standard deviation is a statistical measure of the historic volatility of a portfolio.
n International Stocks The Morgan Stanley Capital International (MSCI) EAFE (Europe, Australasia, and Far East) Index is a commonly used measure of the performance of international stocks.
n Large-cap Stocks Standard & Poor’s 500®, an unmanaged measure of U.S. stock market performance.
n Mid-cap Stocks The Russell MidcapTM Index consists of the smallest 800 companies in the Russell 1000 Index.
n Small-cap Stocks The Russell 2000 Index measures U.S. small-cap stocks.
n Corporate Bonds The Lehman Brothers Aggregate Bond Index measures the performance of the corporate bond market.
n Long Term Gov’t. Bonds The Lehman Brothers Long-Term Government Bond Index measures the performance of the long-term government bond market.
n 30 Day T-bills The Citigroup 30 day T-bill Index is generally considered representative of the performance of short-term money market instruments.
1993 – 2007
1993 1994 1995 1996 1997 1998 1999 2000 2001 2002 2003 2004 2005 2006 2007 AnnualizedReturns
StandardDeviation
Grea
ter %
Ret
urn
Internat’lstocks32.56
Internat’lstocks7.78
Midstocks34.46
Large stocks20.26
Large stocks31.01
Largestocks26.67
Internat’l stocks27.03
LT Gov’tbonds20.29
Corporatebonds8.44
LT Gov’tbonds16.99
Small stocks47.25
Internat’l stocks20.25
Internat’l stocks13.54
Internat’l stocks26.34
Internat’lstocks11.17
Midstocks12.62
Smallstocks17.71
Small stocks18.88
30 dayT-bills3.84
Large stocks34.11
Midstocks19.00
Midstocks29.01
Internat’l stocks19.93
Small stocks21.26
Corporatebonds11.63
LT Gov’tbonds4.34
Corporatebonds10.26
Midstocks40.06
Midstocks20.22
Midstocks12.65
Small stocks18.37
L T gov’tbonds9.65
Smallstocks10.10
Midstocks14.32
s LT Gov’tbonds17.42
Diversifiedportfolio
-0.59
LT Gov’tbonds30.90
Small stocks16.49
Small stocks22.36
LT Gov’tbonds13.41
Large stocks19.53
Midstocks8.25
30 dayT-bills3.69
30 dayT-bills1.65
Internat’l stocks38.59
Small stocks18.33
Diversifiedportfolio
6.69
Midstocks15.26
Corporatebonds6.97
Internat’lstocks9.56
Internat’lstocks14.23
Diversifiedportfolio14.65
Large stocks-1.54
Small stocks28.45
Diversifiedportfolio
9.94
Diversifiedportfolio16.19
vDiversifiedportfolio12.16
Midstocks18.23
30 dayT-bills5.65
Small stocks2.49
Diversifiedportfolio
-7.08
Large stocks26.38
Diversifiedportfolio11.59
LT Gov’tbonds6.61
Large stocks13.62
Midstocks5.60
Diversifiedportfolio
9.04
Largestocks13.55
Midstocks14.30
Small stocks-1.82
Diversifiedportfolio23.07
Internat’l stocks6.05
LT Gov’tbonds15.12
Midstocks10.10
Diversifiedportfolio11.26
Diversifiedportfolio
2.68
Diversifiedportfolio
-2.86
Internat’l stocks-15.94
Diversifiedportfolio22.00
Large stocks8.99
Small stocks4.55
Diversifiedportfolio12.02
Diversifiedportfolio
4.94
Largestocks8.44
Diversifiedportfolio
9.07
s
Corporatebonds9.75
Midstocks-2.09
Corporatebonds18.47
30 dayT-bills4.95
Corporatebonds9.66
Corporatebonds8.69
30 dayT-bills4.44
Small stocks-3.02
Midstocks-5.62
Midstocks-16.19
Corporatebonds4.10
LT Gov’tbonds7.94
Large stocks3.00
30 dayT-bills4.75
30 dayT-bills4.56
LT gov’tbonds8.18
L T gov’tbonds8.37
Lowe
r % R
etur
n
Large stocks7.06
Corporatebonds-2.92
Internat’l stocks11.21
Corporatebonds3.63
30 dayT-bills4.88
30 dayT-bills4.55
Corporatebonds-0.82
Large stocks-10.14
Large stocks-13.04
Small stocks-20.48
LT Gov’tbonds2.61
Corporatebonds4.34
30 dayT-bills2.93
Corporatebonds4.33
Largestocks3.53
Corporatebonds6.47
Corporatebonds3.70
30 dayT-bills2.86
LT Gov’tbonds-7.73
30 dayT-bills5.37
LT Gov’tbonds-0.84
Internat’l stocks1.78
Small stocks-2.55
LT Gov’tbonds-8.73
Internat’l stocks-14.19
Internat’l stocks-21.43
Large stocks-23.37
30 dayT-bills1.03
30 dayT-bills1.21
Corporatebonds2.43
LT Gov’tbonds2.06
Smallstocks-1.57
30 dayT-bills3.75
30 dayT-bills0.43
5 Pioneer Funds | Pioneer Ibbotson Asset Allocation Series

No Asset Class Performs Well All the Time The performance of most major asset classes has shifted — at times dramatically — from one year to the
next. Take a moment to track the movements of each asset class over any five-year period. You will notice
that the top performers in one year are often lesser or bottom performers in the next, and vice versa.
Market Segment Key
Investment Represented by Index Risk Considerations
n Diversified Portfolio Calculated using an equal-weighted average, based on total return, of the indices provided. Equity investments offer a higher rate of return, but may be more volatile and riskier than fixed income investments.
Risks of international investing include currency fluctuations and political instability.
Small- and mid-cap stocks may be more volatile and less liquid than stocks of larger companies.
When interest rates rise, the prices of fixed income securities in the fund will generally fall. Conversely, when interest rates fall the prices of fixed income securities in the fund will generally rise.
Government bonds and Treasury bills are guaranteed by the full faith and credit of the United States government as to the timely payment of princi-pal and interest. This guarantee does not eliminate market risk.
Indices are unmanaged and their returns assume reinvestment of dividends and, unlike mutual fund returns, do not reflect any fees or expenses associated with a mutual fund. It is not possible to invest in an index. Standard deviation is a statistical measure of the historic volatility of a portfolio.
n International Stocks The Morgan Stanley Capital International (MSCI) EAFE (Europe, Australasia, and Far East) Index is a commonly used measure of the performance of international stocks.
n Large-cap Stocks Standard & Poor’s 500®, an unmanaged measure of U.S. stock market performance.
n Mid-cap Stocks The Russell MidcapTM Index consists of the smallest 800 companies in the Russell 1000 Index.
n Small-cap Stocks The Russell 2000 Index measures U.S. small-cap stocks.
n Corporate Bonds The Lehman Brothers Aggregate Bond Index measures the performance of the corporate bond market.
n Long Term Gov’t. Bonds The Lehman Brothers Long-Term Government Bond Index measures the performance of the long-term government bond market.
n 30 Day T-bills The Citigroup 30 day T-bill Index is generally considered representative of the performance of short-term money market instruments.
1993 – 2007
1993 1994 1995 1996 1997 1998 1999 2000 2001 2002 2003 2004 2005 2006 2007 AnnualizedReturns
StandardDeviation
Grea
ter %
Ret
urn
Internat’lstocks32.56
Internat’lstocks7.78
Midstocks34.46
Large stocks20.26
Large stocks31.01
Largestocks26.67
Internat’l stocks27.03
LT Gov’tbonds20.29
Corporatebonds8.44
LT Gov’tbonds16.99
Small stocks47.25
Internat’l stocks20.25
Internat’l stocks13.54
Internat’l stocks26.34
Internat’lstocks11.17
Midstocks12.62
Smallstocks17.71
Small stocks18.88
30 dayT-bills3.84
Large stocks34.11
Midstocks19.00
Midstocks29.01
Internat’l stocks19.93
Small stocks21.26
Corporatebonds11.63
LT Gov’tbonds4.34
Corporatebonds10.26
Midstocks40.06
Midstocks20.22
Midstocks12.65
Small stocks18.37
L T gov’tbonds9.65
Smallstocks10.10
Midstocks14.32
s LT Gov’tbonds17.42
Diversifiedportfolio
-0.59
LT Gov’tbonds30.90
Small stocks16.49
Small stocks22.36
LT Gov’tbonds13.41
Large stocks19.53
Midstocks8.25
30 dayT-bills3.69
30 dayT-bills1.65
Internat’l stocks38.59
Small stocks18.33
Diversifiedportfolio
6.69
Midstocks15.26
Corporatebonds6.97
Internat’lstocks9.56
Internat’lstocks14.23
Diversifiedportfolio14.65
Large stocks-1.54
Small stocks28.45
Diversifiedportfolio
9.94
Diversifiedportfolio16.19
vDiversifiedportfolio12.16
Midstocks18.23
30 dayT-bills5.65
Small stocks2.49
Diversifiedportfolio
-7.08
Large stocks26.38
Diversifiedportfolio11.59
LT Gov’tbonds6.61
Large stocks13.62
Midstocks5.60
Diversifiedportfolio
9.04
Largestocks13.55
Midstocks14.30
Small stocks-1.82
Diversifiedportfolio23.07
Internat’l stocks6.05
LT Gov’tbonds15.12
Midstocks10.10
Diversifiedportfolio11.26
Diversifiedportfolio
2.68
Diversifiedportfolio
-2.86
Internat’l stocks-15.94
Diversifiedportfolio22.00
Large stocks8.99
Small stocks4.55
Diversifiedportfolio12.02
Diversifiedportfolio
4.94
Largestocks8.44
Diversifiedportfolio
9.07
s
Corporatebonds9.75
Midstocks-2.09
Corporatebonds18.47
30 dayT-bills4.95
Corporatebonds9.66
Corporatebonds8.69
30 dayT-bills4.44
Small stocks-3.02
Midstocks-5.62
Midstocks-16.19
Corporatebonds4.10
LT Gov’tbonds7.94
Large stocks3.00
30 dayT-bills4.75
30 dayT-bills4.56
LT gov’tbonds8.18
L T gov’tbonds8.37
Lowe
r % R
etur
n
Large stocks7.06
Corporatebonds-2.92
Internat’l stocks11.21
Corporatebonds3.63
30 dayT-bills4.88
30 dayT-bills4.55
Corporatebonds-0.82
Large stocks-10.14
Large stocks-13.04
Small stocks-20.48
LT Gov’tbonds2.61
Corporatebonds4.34
30 dayT-bills2.93
Corporatebonds4.33
Largestocks3.53
Corporatebonds6.47
Corporatebonds3.70
30 dayT-bills2.86
LT Gov’tbonds-7.73
30 dayT-bills5.37
LT Gov’tbonds-0.84
Internat’l stocks1.78
Small stocks-2.55
LT Gov’tbonds-8.73
Internat’l stocks-14.19
Internat’l stocks-21.43
Large stocks-23.37
30 dayT-bills1.03
30 dayT-bills1.21
Corporatebonds2.43
LT Gov’tbonds2.06
Smallstocks-1.57
30 dayT-bills3.75
30 dayT-bills0.43
Pioneer Funds | Pioneer Ibbotson Asset Allocation Series 6

Keeping Your Investments on Track From time to time, your allocation may need to be shifted, or ‘rebalanced’ to
bring it back in line with your long-term goals. That’s because, over the years,
the asset classes in your portfolio offer varying rates of return. When a particular
asset class has performed well for an extended period of time, it can grow to
occupy a larger percentage of your allocation, offsetting the intended balance
between risk and reward.
Rebalancing your portfolio on a regular basis can help you avoid unnecessary
risk and remain well positioned to capture return potential.
An Unbalanced Portfolio May Result In Unnecessary Risk Here’s an example of the effect that a changing market environment can have
on an asset allocation left unchecked over time:
The bull market of the late 1990s contributed to the increased value of stocks in
the portfolio below, causing it to be overweighted and therefore subjecting it to
greater volatility than the investor may have planned.
Active rebalancing is essential to avoiding unnecessary risk over time.
More Reasons for Rebalancing
Over the years, changes in lifestyle – a growing family, a shift in college or retirement savings needs – may trigger the need to revisit your asset allocation decision.
Your financial advisor can review these changes with you to determine whether another fund in the Series may be more appropriate for your needs.
Data represents past performance. Past performance is no guarantee of future results. These examples are hypothetical and intended for illustrative use only. They are not intended to represent the actual performance of any Pioneer portfolio. While asset allocation does not guarantee a profit or protect against loss, a balanced portfolio may improve your ability to reach long-term goals.
Source: Ibbotson Associates. Portfolio allocations are represented by: Large Company Stocks – Standard & Poor’s 500®, which is an unmanaged group of securities and considered to be representative of the stock market in general; Small Company Stocks – represented by Dimensional Fund Advisors, Inc. (DFA), U.S. Micro Cap Portfolio; International Stocks – Morgan Stanley Capital International Europe, Australasia, and Far East (EAFE®) Index; Government Bonds – 5-year U.S. Government Bonds; Cash – 30-day U.S. Treasury Bill.
Chart prepared by Pioneer.
Stocks 50%
Bonds 50%
Bonds 25%
Stocks 75%
1991 2007
A Portfolio Left Unchecked Over Time
7 Pioneer Funds | Pioneer Ibbotson Asset Allocation Series

In addition to regular rebalancing, Ibbotson allows some flexibility, in each target allocation, to take advantage of market trends that may offer improved return potential.
Rebalancing as a Valuable Risk-Management Tool Historically, rebalancing a portfolio has allowed investors to reduce portfolio
risk without sacrificing too much return. In all three of the examples below,
regular rebalancing resulted in lower risk, with a minimal trade-off of reduced
return. For example, the rebalanced portfolio beginning January 1980 offered
approximately 20% less risk than the non-rebalanced portfolio, with about
nearly 100% of the return.
Data represents past performance. Past performance does not guarantee future results. The information presented herein is for illustrative purposes only and not indicative of any investment. Government bonds and Treasury bills are guaranteed by the full faith and credit of the United States government as to the timely payment of principal and interest. This guarantee does not eliminate market risk. Risks of international investing include currency fluctuations and political instability. Stocks are not guaranteed and have been more volatile than the other asset classes.
Source: Ibbotson Associates. Each portfolio consisted of 60% stocks, 20% bonds, and 20% cash at portfolio begin date. Stocks consist of 33.3% large, 33.3% small, and 33.3% international stocks at each portfolio begin date and are represented by the Standard & Poor’s 500 Index, the DFA U.S. Micro Cap Portfolio and the Morgan Stanley Capital International (MSCI) EAFE Index, respectively. The bond allocation consists entirely of 5-year U.S. Government bonds, while the cash allocation consists of 30-day U.S. Treasury bills. The portfolios have been rebalanced semi-annually. Risk is measured by standard deviation, a statistical measure of the fluctuation of returns around the arithmetic average return of the investment. The higher the standard deviation, the greater the variability (and thus risk) of the investment returns. The data assumes reinvestment of income and does not account for taxes or transaction costs. It is not possible to invest directly in an index. Chart prepared by Pioneer.
Rebalanced portfolio Non-rebalanced portfolio
8
2
4
6
0
Risk Return
10.2%
1/70–12/07
9.4%9.0%
11.6%11.9% 11.5%10.7% 10.9%
9.5%10.6%
11.2%
8.8%Perc
ent
1/80–12/07 1/90–12/07 1/70–12/07 1/80–12/07 1/90–12/07
10
12
14
Rebalancing Helped to Lower Risk
Pioneer Funds | Pioneer Ibbotson Asset Allocation Series 8

s
Keeping Risk in Line with Expected ReturnAs subadvisor to the Pioneer Ibbotson Asset Allocation Series portfolios,
Ibbotson Associates adheres to a strict investment process that marries a
proprietary quantitative approach with a qualitative set of guidelines in
an effort to minimize expected risk for a given level of expected return in
each portfolio.
Ibbotson begins the process by selecting asset classes and — based on its own
forecasting and analysis — building model portfolios that target maximum
return for given levels of risk. Next, an in-depth analysis of each underlying
fund leads to the construction of actual portfolios designed to mirror the risk/
return characteristics of the asset class models. An ongoing process of monitoring,
reallocating and rebalancing helps to keep each portfolio in line with its stated
investment objective.
Professional Portfolio Management by Ibbotson Associates
6. Monitor, Review, RebalanceMonitor fund allocations and performance
quarterly; review asset allocation annually, reallocate monthly in addition to daily
monitoring and rebalancing, as necessary
5. Fund Level Efficient Frontier
Implement the strategic asset allocation and determine the most
efficient use of the risk budget through complementary underlying funds
4. Fund AnalysisIn-depth study of underlying fund
characteristics, including returns analysis, holdings, management and performance
1. Asset Class Selection Select asset classes most appropriate
to the available fund universe, considering each
model portfolio
2. Forecasting Asset Class Returns
Develop asset class forecasts based on market expectations
3. Asset Class Level Efficient Frontier Statistical analysis to target maximum
return for a given level of risk through model testing, simulation and sensitivity analysis
Ibbotson’s Investment Process
9 Pioneer Funds | Pioneer Ibbotson Asset Allocation Series

As Subadvisor, Ibbotson is responsible for:
• Dynamic Allocation
• Portfolio Construction and Fund Selection
• Monitoring, Reallocating and Rebalancing
s
3. Asset Class Level Efficient Frontier Statistical analysis to target maximum
return for a given level of risk through model testing, simulation and sensitivity analysis
Diversification Among Asset ClassesEach of the four asset allocation strategies — Conservative, Moderate,
Growth and Aggressive — invests in a mix of Pioneer mutual funds allocated
across major asset classes, which include U.S. stocks, international stocks,
bonds and cash. Ibbotson also makes sure that each allocation is properly
diversified to spread your investment assets over a range of investment styles
and market capitalizations.
Building and Maintaining Efficient AllocationsThe chart below represents an ‘efficient frontier’, a scientific way of looking at
the targeted risk/return characteristics of each portfolio. A portfolio that lines
up along the efficient frontier is one that targets the greatest potential return
for a given level of risk, or the lowest level of risk for a given level of return.
By choosing investments with low correlations, Ibbotson has been able to target
the lowest, or most efficient level of risk for the maximum level of potential
return in each of the four portfolios. Then, with regular rebalancing, Ibbotson
makes sure that each allocation maintains its peak efficiency over time.
Source: Ibbotson Associates. Portfolio models presented are hypothetical and for illustrative purposes only.
There can be no guarantee that portfolio performance will match risk/return targets.
Portfolio Model Risk/Reward Targets
ConservativeAllocation
ModerateAllocation
GrowthAllocation
Aggressive Allocation
Fixed Income
Equities
Lower
Higher
Higher
Potential Risk
Pote
ntia
l Ret
urn
Pioneer Funds | Pioneer Ibbotson Asset Allocation Series 10
s
s
ss

14 Pioneer Funds | Pioneer Ibbotson Asset Allocation Series
Pioneer Ibbotson Asset Allocation Series F U N D A L L O C A T I O N T A R G E T S
The fund’s performance depends on the adviser’s skill in determining the strategic asset class allocations, the mix of underlying Pioneer funds, as well as the performance of those underlying funds. The underlying funds’ performance may be lower than the performance of the asset class that they were selected to represent. Stocks and bonds can decline due to adverse issuer, market, regulatory, or economic developments. Before making an investment in the fund, you should consider all the risks associated with it.
For performance information pertaining to any of the Pioneer Ibbotson Asset Allocation Series portfolios, ask your financial advisor for a fund fact sheet, call 1-800-225-6292, or visit our web site at pioneerinvestments.com.

Pioneer Ibbotson Asset Allocation Series F U N D A L L O C A T I O N T A R G E T S
Conservative Allocation Moderate Allocation
Equities 30%
Fixed Income 70%
Fixed Income 40%
Equities 60%
Growth Allocation
Fixed Income 25%
Equities 75%
Aggressive Allocation
Equities 90%
Fixed Income 10%
Pioneer Allocations as of December 2007
For Investors Seeking
ConservativeAllocation
ModerateAllocation
Growth Allocation
AggressiveAllocation
Conservative long-term growth potential
Moderate long-term growth potential
Strong long-term growth potential
Aggressive long-term growth potential
Expected Volatility Lower Higher
U.S. Stocks 26% 48% 58% 65%
Pioneer Fund 6% 9% 9% 10%
Pioneer Research Fund 7% 10% 12% 13%
Pioneer Oak Ridge Large Cap Growth Fund 2% 5% 7% 8%
Pioneer Cullen Value Fund 3% 4% 4% 5%
Pioneer Value Fund 2% 4% 4% 4%
Pioneer Mid Cap Growth Fund 1% 2% 3% 3%
Pioneer Mid Cap Value Fund — 2% 4% 5%
Pioneer Small Cap Value Fund 1% 2% 3% 4%
Pioneer Real Estate Shares — 3% 4% 4%
Pioneer Independence Fund 3% 4% 5% 5%
Pioneer Growth Opportunities Fund 1% 3% 3% 4%
International Stocks 8% 15% 19% 26%
Pioneer International Equity Fund 6% 10% 12% 15%
Pioneer Emerging Markets Fund — 2% 4% 6%
Pioneer Europe Select Equity Fund 2% 3% 3% 5%
Bonds 60% 36% 23% 9%
Pioneer Bond Fund 23% 11% 9% 7%
Pioneer Short Term Income Fund 25% 18% 11% 2%
Pioneer High Yield Fund 3% 2% 1% —
Pioneer Global High Yield Fund 2% 2% 1% —
Pioneer Strategic Income Fund 5% 2% 1% —
Pioneer Government Income Fund 2% 1% — —
Cash 6% 1% — —
Small- and mid-cap stocks may be more volatile and less liquid than stocks of larger companies. Real estate investments may be subject to special risks, including risks related to general and local economic conditions, and risks related to an individual property. Risks of international and emerging market investing include currency fluctuations and political instability. Below investment grade securities may be more volatile and riskier than investment grade securities.
Pioneer Ibbotson Asset Allocation Series
Pioneer Funds | Pioneer Ibbotson Asset Allocation Series 12
s
s

A fund of funds – or any other single investment – may be only one component
of your long-term portfolio. Your financial advisor can be a valuable resource
for helping you select additional investments and coordinate the broader
aspects of your overall financial plan.
Here are just a few of the topics you might discuss with your financial advisor
when considering an investment in Pioneer Ibbotson Asset Allocation Series.
Retirement planning – Traditional, Roth and rollover IRAs as well as small
business retirement plans, such as Uni-K plans or SIMPLE IRAs, or other
retirement savings vehicles, such as 403(b) plans
Education savings – An investment program such as a Coverdell Education
Savings Account
Lump sum investing – Windfall sums, such as lottery winnings, an
inheritance or a large insurance payment
Other opportunities – Of course, you need not wait for a major financial
event to begin investing in one of the Pioneer Ibbotson Asset Allocation
Series portfolios. Nor does your investment need to take the form of one
lump sum. You can make regular investments over time by using an automatic
investment program.
Automatic investment programs do not assure a profit or protect against loss
in declining markets. You should consider your financial ability to continue
investing through periods of low prices.
Find Out MoreBefore investing, consider the product’s investment objectives, risks, charges and expenses carefully. Contact your financial advisor or Pioneer Investments for a prospectus containing this information. Read it carefully.
Your Financial Advisor – A Valuable Resource
Our Commitment to You
Pioneer Investments is committed to supporting the partnership between you and your financial advisor through a broad range of quality, innovative investment ideas designed to help you pursue your long-term goals.
Contact your financial advisor for more information about the Pioneer investment products and programs that might be best for you.
13 Pioneer Funds | Pioneer Ibbotson Asset Allocation Series


Contact Us
For more information about these or any Pioneer funds,
please visit pioneerinvestments.com or call 1-800-225-6292.

©2008 Ibbotson Associates. All rights reserved. Ibbotson Associates Advisors is a registered investment advisor and wholly owned subsidiary of Morningstar, Inc.
Securities offered through Pioneer Funds Distributor, Inc.60 State Street, Boston, Massachusetts 02109 Underwriter of Pioneer mutual funds, Member SIPC©2008 Pioneer Investments. • pioneerinvestments.com 17464-05-0108

Atlantic Financial
About Atlantic Financial
Through our broker dealer, Cantella & Inc., Atlantic Financial is proud to offer investment products and services
from several leading investment management and mutual fund companies.
Information produced by third parties is for client service and educational purposes. Atlantic Financial recommends third party investments for many clients. Presentation of materials does not imply any endorsement by any other company.
Atlantic Financial is not affiliated with any investment management or mutual fund company; we recommend investment products and services from mutual fund and money management companies. Services we offer include:
401k plans
IRA Rollovers
401k Rollovers
Global Investing
Institutional Investing
Bonds
Managed Accounts
Roth IRAs
Asset Management
College 529 Plans
Socially Responsible Investing
SEP IRAs
Financial Planning
Emerging Markets Investing
Consulting
Mutual Funds
Through our broker dealer and clearing firm, we also offer over 18,000 mutual funds
For more information, please contact Atlantic Financial today.
Please also visit Fenton Report Globalization Blog and Economic News, edited by Economic Strategist Bruce
Fenton
Securities offered through Cantella & Co. Inc., Member FINRA / SIPC
Past performance does not guarantee future results. Please read a prospectus before investing. Please speak with a
qualified financial advisor before investing.
All Atlantic Financial material is copyright Atlantic Financial Inc., all rights reserved.