piotr lewandowski - a routine transition? technology, upskilling, structural change and the task...
TRANSCRIPT
A r o u t i n e t r a n s i t i o n ? Te c h n o l o g y , u p s k i l l i n g , s t r u c t u r a l c h a n g e a n d t h e t a s k c o n t e n t o f j o b s i n C e n t r a l a n d E a s t e r n E u r o p e
P i o t r L e w a n d o w s k i ( I B S , I Z A )
b a s e d o n w o r k w i t h
W o j c i e c h H a r d y , R o m a K e i s t e r , S z y m o n G ó r k a

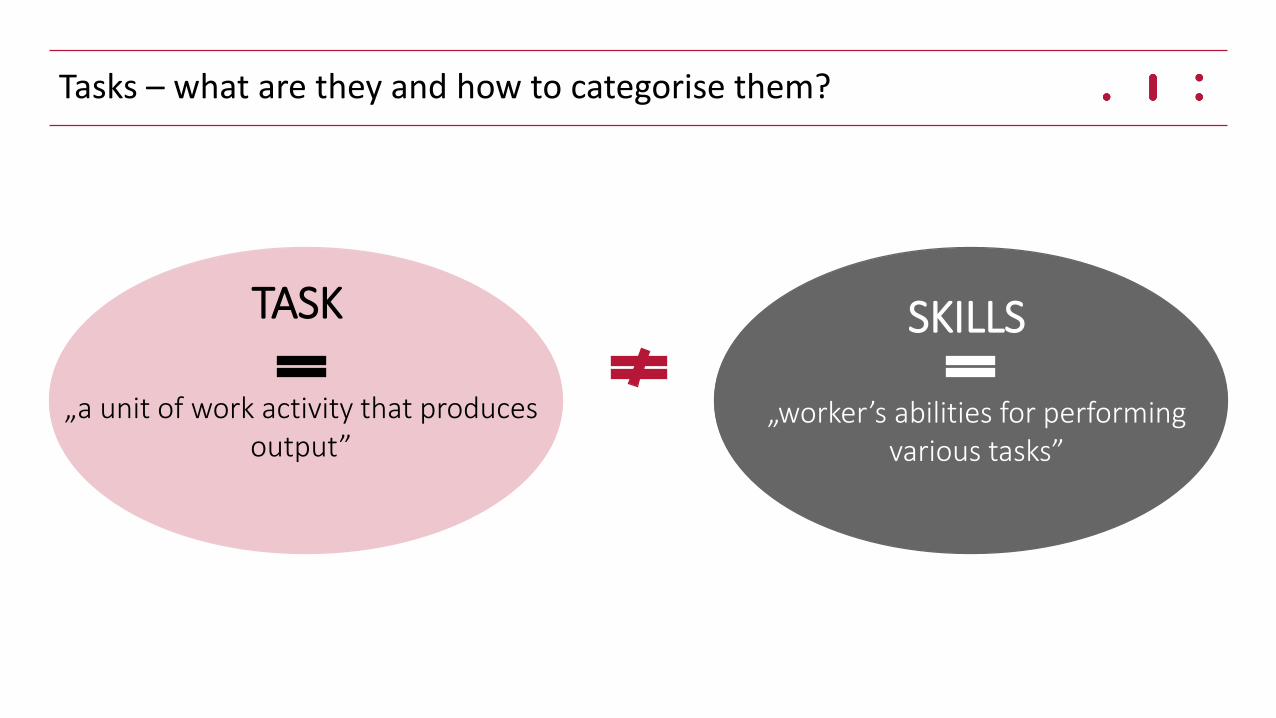
Tasks – what are they and how to categorise them?
„a unit of work activity that produces output”
TASK SKILLS
„worker’s abilities for performing various tasks”
Tasks – what are they and how to categorise them?
„a unit of work activity that produces output”
TASK SKILLS
„worker’s abilities for performing various tasks”

Particular tasks are most common in different occupations
Non-routine cognitive (analytical
and personal)
• Managers
• IT specialists
• Architects
• Engineers
Routine cognitive
• Bookkeepers
• Tellers
• Office clerks
• Salespersons
Manual (routine and non-routine)
• Assemblers
• Toolmakers
• Drivers
• Farmers

Where did tasks come from – Autor, Levy, Murnane (2003)
Rising wage premium for graduates
Increasing wage inequality
Hollowing-out of middle-skilled employment

Where did tasks come from – Autor, Levy, Murnane (2003)
Rising wage premium for graduates
Increasing wage inequality
Hollowing-out of middle-skilled employment
Job polarisation

Where did tasks come from – Autor, Levy, Murnane (2003)
Rising wage premium for graduates
Increasing wage inequality
Hollowing-out of middle-skilled employment
Falling price of ICT
Job polarisation

Where did tasks come from – Autor, Levy, Murnane (2003)
Rising wage premium for graduates
Increasing wage inequality
Hollowing-out of middle-skilled employment
The „de-routinisation” hypothesis
Falling price of ICT
Job polarisation

Studies confirm „de-routinisation” in the most advanced economies
In the US:
• Routine cognitive and manual tasks fell
• Non-routine cognitive tasks grew
• Non-routine manual tasks decreased, but started to grow
Source: Autor, Price (2013)

Is „deroutinisation” also present in less developed countries?
0%
5%
10%
15%
20%
25%
30%
35%
1998 1999 2000 2001 2002 2003 2004 2005 2006 2007 2008 2009 2010 2011
ICT Stock per worker, relative to the US
Czech Republic Hungary Poland Romania Slovakia Slovenia
Source: own calculations on Eden & Gaggl (2015) data on ICT capital stock and Eurostat data on employment
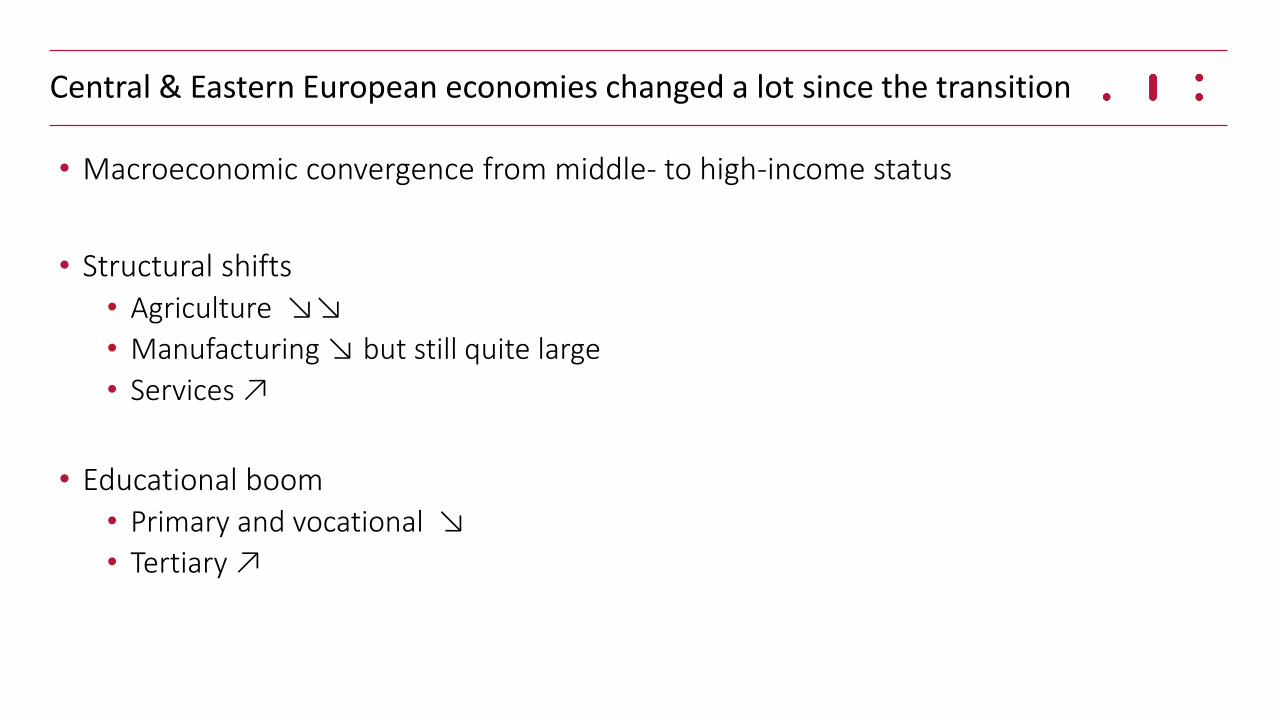
Central & Eastern European economies changed a lot since the transition
• Macroeconomic convergence from middle- to high-income status
• Structural shifts
• Agriculture ↘↘
• Manufacturing ↘ but still quite large
• Services ↗
• Educational boom
• Primary and vocational ↘
• Tertiary ↗
SKILLS
„worker’s abilities for performing various tasks”

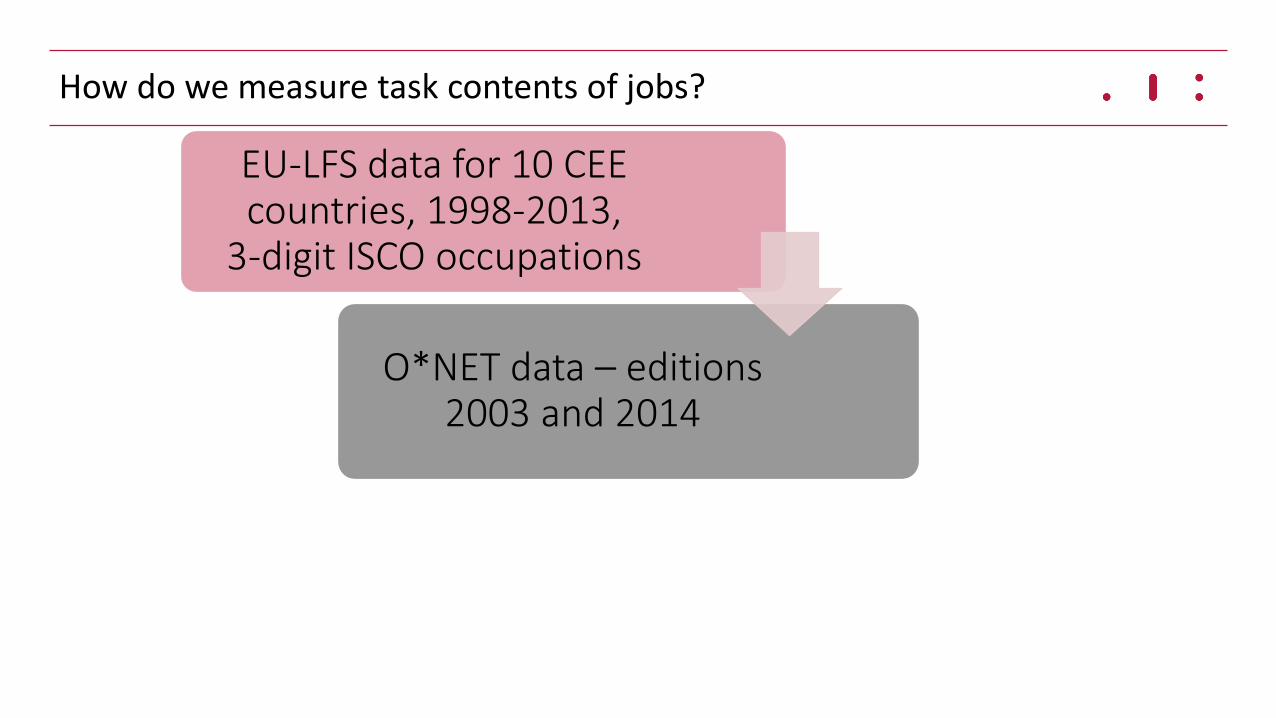
How do we measure task contents of jobs?
EU-LFS data for 10 CEE countries, 1998-2013,
3-digit ISCO occupations
How do we measure task contents of jobs?
EU-LFS data for 10 CEE countries, 1998-2013,
3-digit ISCO occupations
O*NET data – editions 2003 and 2014
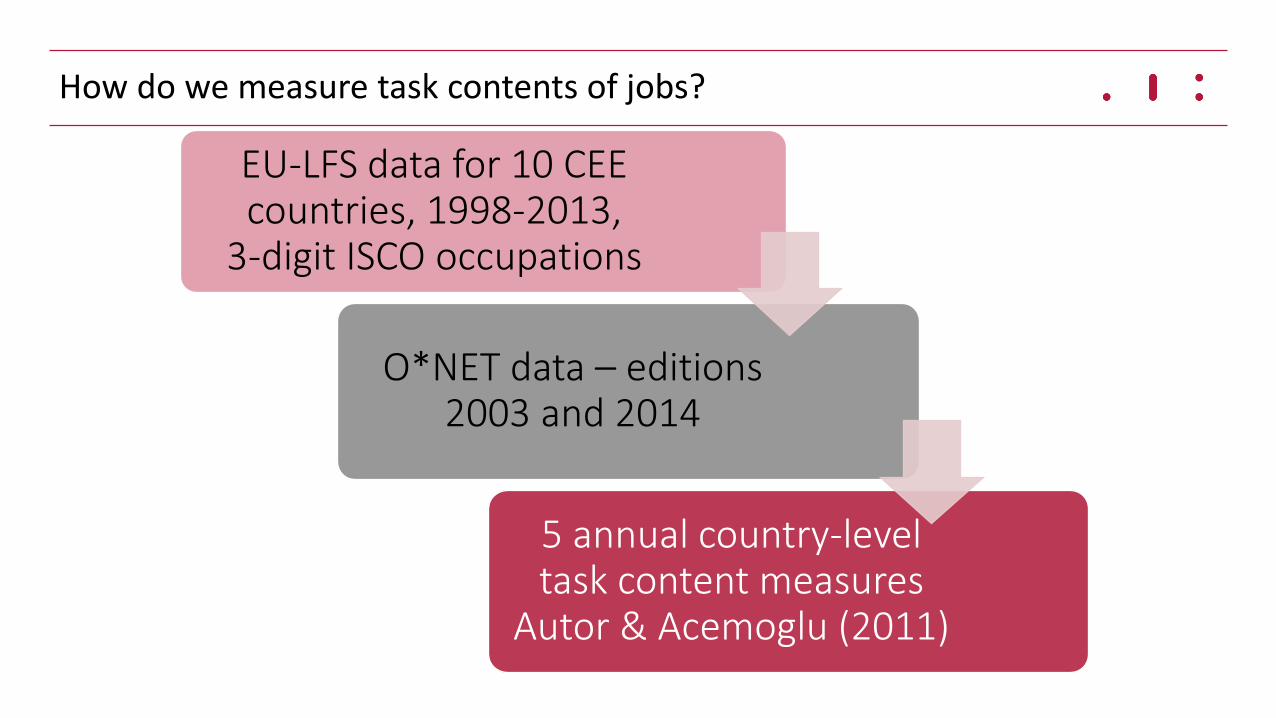
How do we measure task contents of jobs?
EU-LFS data for 10 CEE countries, 1998-2013,
3-digit ISCO occupations
O*NET data – editions 2003 and 2014
5 annual country-level task content measures
Autor & Acemoglu (2011)
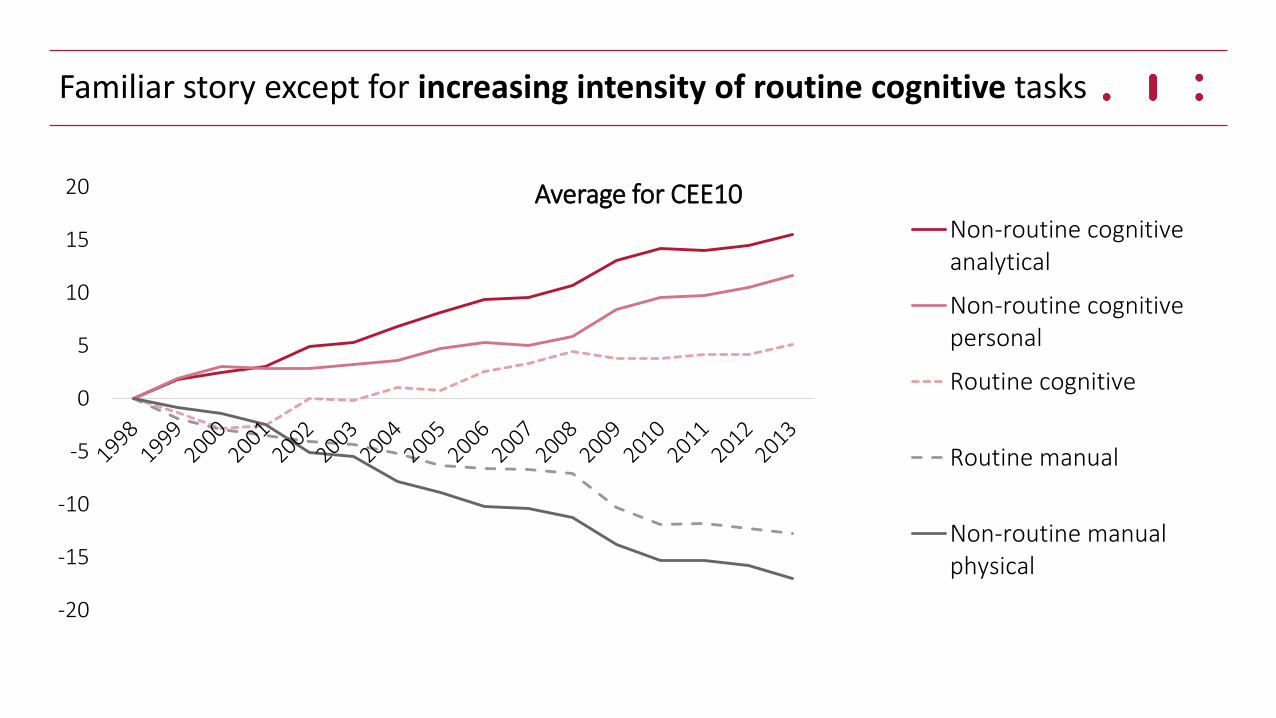
Familiar story except for increasing intensity of routine cognitive tasks
-20
-15
-10
-5
0
5
10
15
20 Average for CEE10 Non-routine cognitiveanalytical
Non-routine cognitivepersonal
Routine cognitive
Routine manual
Non-routine manualphysical
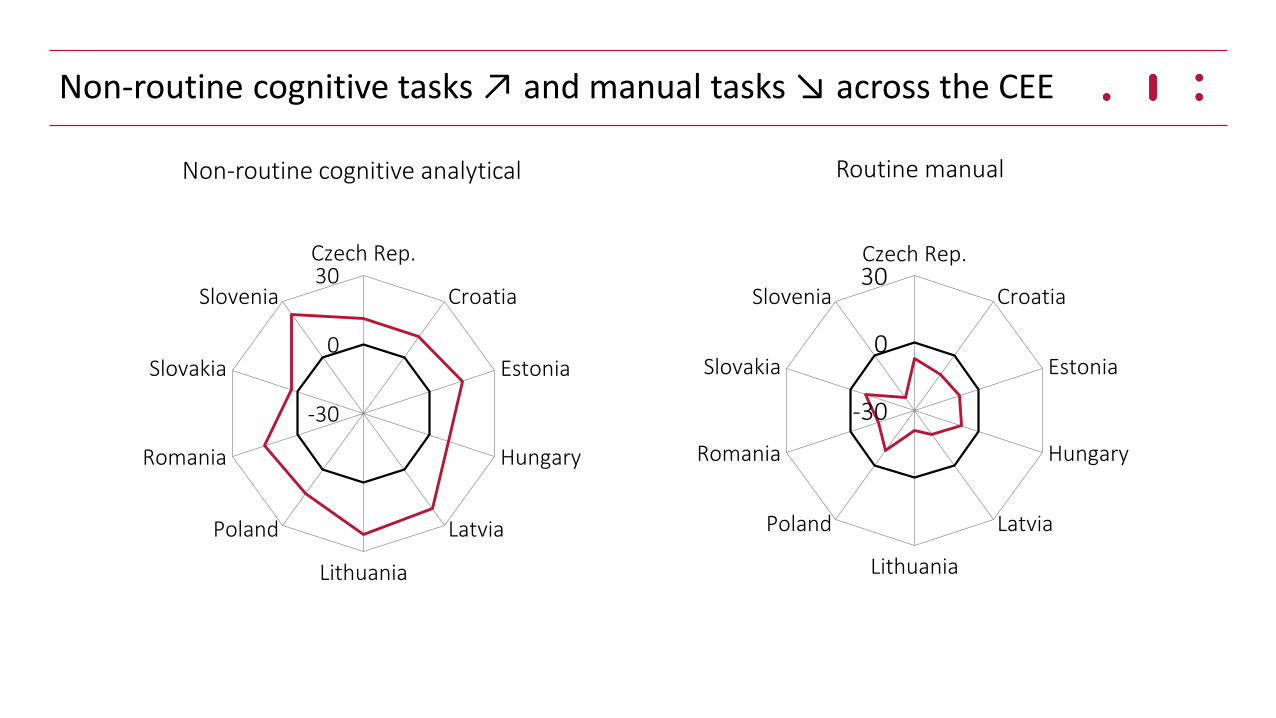
Non-routine cognitive tasks ↗ and manual tasks ↘ across the CEE
-30
0
30Czech Rep.
Croatia
Estonia
Hungary
Latvia
Lithuania
Poland
Romania
Slovakia
Slovenia
Non-routine cognitive analytical Routine manual
-30
0
30Czech Rep.
Croatia
Estonia
Hungary
Latvia
Lithuania
Poland
Romania
Slovakia
Slovenia

But changes in routine cognitive tasks were heterogenous in CEE
-30
0
30Czech Rep.
Croatia
Estonia
Hungary
Latvia
Lithuania
Poland
Romania
Slovakia
Slovenia

What was the correlation between education, technology, and aggregate task content changes in CEE
• Regression of tasks contents on educational structure and R&D spending
• Panel fixed-effects, 1998-2012, 10 CEE countries
• R&D as a proxy for ICT
log ICT stock per worker Coefficient Std. err. R2 within R2 between Correlation
R&D spending / GDP 118.9** 39.55
0.17 0.59 0.73 Constant -0.63 0.36
Observations 84 (6 countries)

Workforce upskilling associated with growing non-routine cognitive and falling manual tasks
Non-routine
cognitive analytical
Non-routine cognitive personal
Routine cognitive
Routine manual
Non-routine manual physical
Share of persons with tertiary education
attained
1.49*** 0.82*** 0.74 -1.18*** -1.74***
Share of persons with secondary education
attained
0.71*** 0.01 0.60 -0.33 -1.17*
R&D spending / GDP 3.73* 3.04* -4.71 -3.01* -1.81
R2 (between/within) 0.01/0.84 0.01/0.75 0.03/0.20 0.00/0.80 0.04/0.82

Shift-share decomposition (1998 to 2013) helps to understand routine cognitive
• Structural change
∀𝑖∈𝑇 𝐵𝑆𝑖 = 𝑡𝑖,𝑗,0398 ℎ𝑗
13 − ℎ𝑗98 ,
𝑗∈𝑆
• Educational change
∀𝑖∈𝑇 𝐵𝐸𝑖 = 𝑡𝑖,𝑗,𝑘,0398
𝑘∈𝐸
ℎ𝑗,𝑘13
ℎ𝑗13 −ℎ𝑗,𝑘98
ℎ𝑗98 ℎ𝑗
98
𝑗∈𝑆
,
• Occupational change
∀𝑖∈𝑇 𝑂𝐶𝑖 = (𝑡𝑖,𝑗,𝑘,1413 − 𝑡𝑖,𝑗,𝑘,03
98 )
𝑘∈𝐸
ℎ𝑗,𝑘98
𝑗∈𝑆
• Interaction (equation in the paper)
O*NET 2003 task content in sector j, education i
Employment share in sector j, education i

Structural and occupational changes drove the growth of routine cognitive tasks
-25
-20
-15
-10
-5
0
5
10
15
20
25
Slovenia Hungary Czechia Slovakia Croatia Estonia Poland Latvia Romania
Interaction
Occupational effect
Educational effect
Structural effect
Total observed change
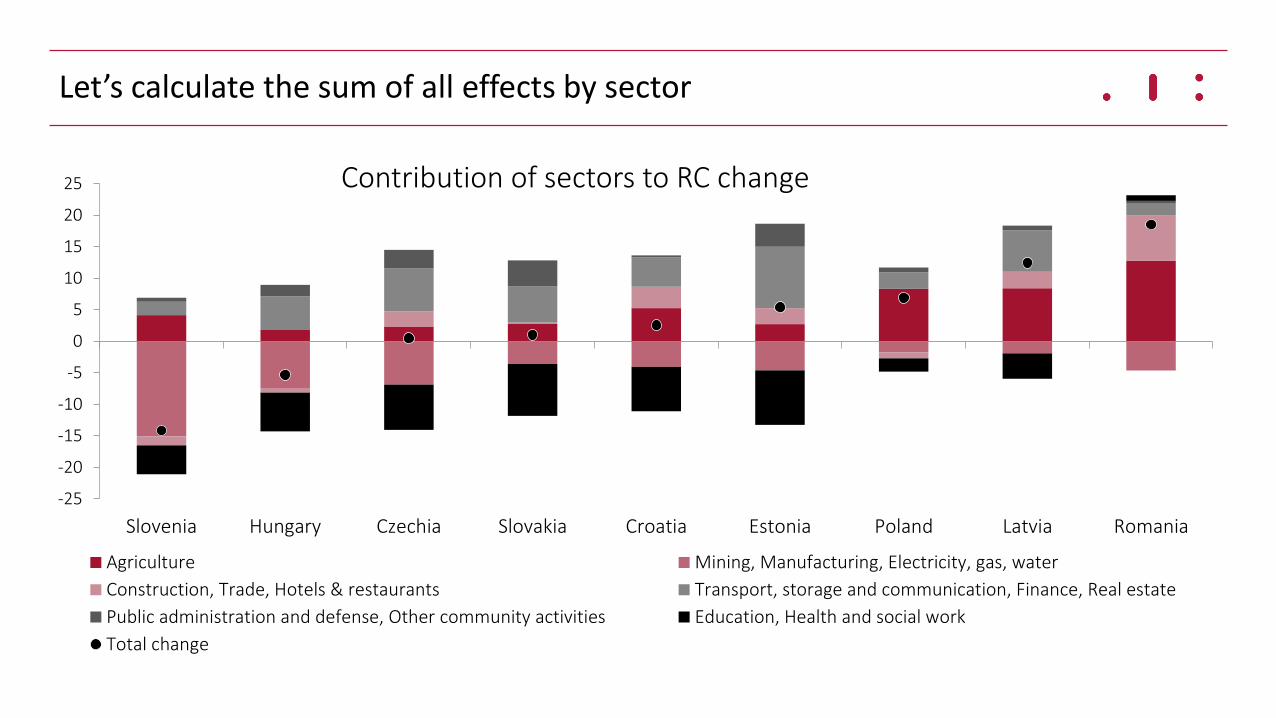
Let’s calculate the sum of all effects by sector
Contribution of sectors to RC change
-25
-20
-15
-10
-5
0
5
10
15
20
25
Slovenia Hungary Czechia Slovakia Croatia Estonia Poland Latvia Romania
Agriculture Mining, Manufacturing, Electricity, gas, water
Construction, Trade, Hotels & restaurants Transport, storage and communication, Finance, Real estate
Public administration and defense, Other community activities Education, Health and social work
Total change

Agriculture contributed most of routine cognitive tasks’ growth in countries where RC grew most
Contribution of sectors to RC change
-25
-20
-15
-10
-5
0
5
10
15
20
25
Slovenia Hungary Czechia Slovakia Croatia Estonia Poland Latvia Romania
Agriculture Mining, Manufacturing, Electricity, gas, water
Construction, Trade, Hotels & restaurants Transport, storage and communication, Finance, Real estate
Public administration and defense, Other community activities Education, Health and social work
Total change

Transport & communication, finance and real estate - the second main source of routine cognitive tasks’ growth
Contribution of sectors to RC change
-25
-20
-15
-10
-5
0
5
10
15
20
25
Slovenia Hungary Czechia Slovakia Croatia Estonia Poland Latvia Romania
Agriculture Mining, Manufacturing, Electricity, gas, water
Construction, Trade, Hotels & restaurants Transport, storage and communication, Finance, Real estate
Public administration and defense, Other community activities Education, Health and social work
Total change

Manufacturing compressed routine cognitive tasks
Contribution of sectors to RC change
-25
-20
-15
-10
-5
0
5
10
15
20
25
Slovenia Hungary Czechia Slovakia Croatia Estonia Poland Latvia Romania
Agriculture Mining, Manufacturing, Electricity, gas, water
Construction, Trade, Hotels & restaurants Transport, storage and communication, Finance, Real estate
Public administration and defense, Other community activities Education, Health and social work
Total change

Educational boom fuelled the growth of non-routine analytical tasks
-15
-10
-5
0
5
10
15
20
25
30
Slovakia Hungary Croatia Czechia Poland Estonia Romania Latvia Slovenia
Interaction
Occupational effect
Educational effect
Structural effect
Total observed change

Educational boom also fuelled the decline of routine manual tasks
-30
-25
-20
-15
-10
-5
0
5
10
15
Slovenia Latvia Romania Croatia Estonia Hungary Poland Slovakia Czechia
Interaction
Occupational effect
Educational effect
Structural effect
Total observed change

So far no de-routinisation in CEE
• Growth of non-routine cognitive tasks and decline of manual tasks
• Prevailing increase in routine cognitive tasks
• Changes largely attributed to workforce upskilling
• Structural change most important for the rise of routine cognitive tasks

Who are the routine workers in CEE?
-80
-60
-40
-20
0
20
40
Czechia Estonia Hungary Lithuania Latvia Poland Romania Slovakia
Routine cognitive task content by segments of wage distribution, 2010
Bottom 40% Middle 40% Top 20%
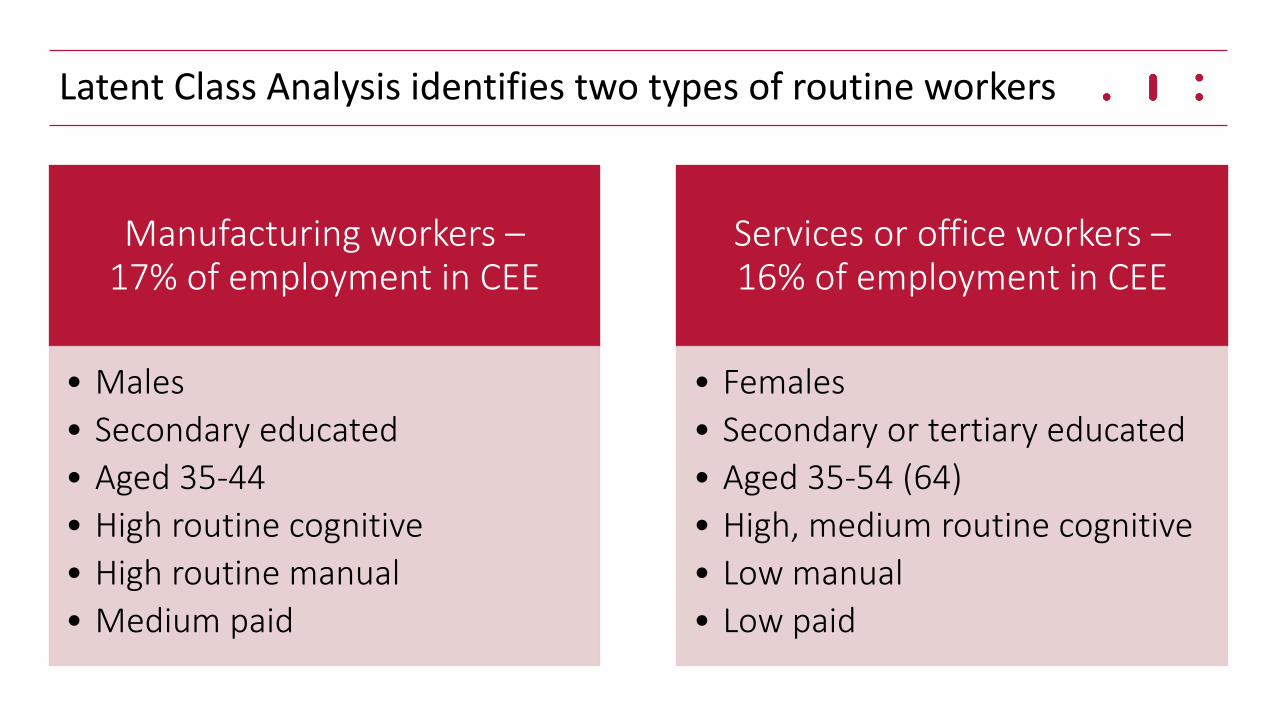
Latent Class Analysis identifies two types of routine workers
Manufacturing workers – 17% of employment in CEE
• Males
• Secondary educated
• Aged 35-44
• High routine cognitive
• High routine manual
• Medium paid
Services or office workers – 16% of employment in CEE
• Females
• Secondary or tertiary educated
• Aged 35-54 (64)
• High, medium routine cognitive
• Low manual
• Low paid
How important is the age dimension of these developments?

Non-routine cognitive analytical tasks rose much faster among cohorts born after 1970 than among older cohorts
0
1
2
3
4
5
6
7
8
9
10
1950 1955 1960 1965 1970 1975 1980 1985
NRCA – time trends by 5-year birth cohorts
Czechia Estonia Hungary Poland

Routine cognitive tasks – slightly declining within cohorts, especially younger. Composition effects behind the rise of RC
-3
-2
-1
0
1
2
3
4
5
6
1950 1955 1960 1965 1970 1975 1980 1985
RC – time trends by 5-year birth cohorts
Czechia Estonia Hungary Poland

Manual tasks were declining much faster among younger cohorts
-8
-7
-6
-5
-4
-3
-2
-1
0
1
2
1950 1955 1960 1965 1970 1975 1980 1985
RM – time trends by 5-year birth cohorts
Czechia Estonia Hungary Poland

How has the age structure of routine intensive jobs changed?
• Jobs rich in routine tasks are often rich in non-routine ones too
• Autor & Dorn (2009) – index of routine-task intensity
• RTI ↗ with relative importance of routine tasks, ↘ with relative importance of non-routine ones
∀𝑖∈𝑜𝑐𝑐𝑢𝑝𝑎𝑡𝑖𝑜𝑛𝑠𝑅𝑇𝐼𝑖 = ln 𝑅𝐶 + 𝑅𝑀 − ln (𝑁𝑅𝐶𝐴 + 𝑁𝑅𝐶𝑃)
• RTI based on 1998 country-specific task structures, ≈100 occupations per country
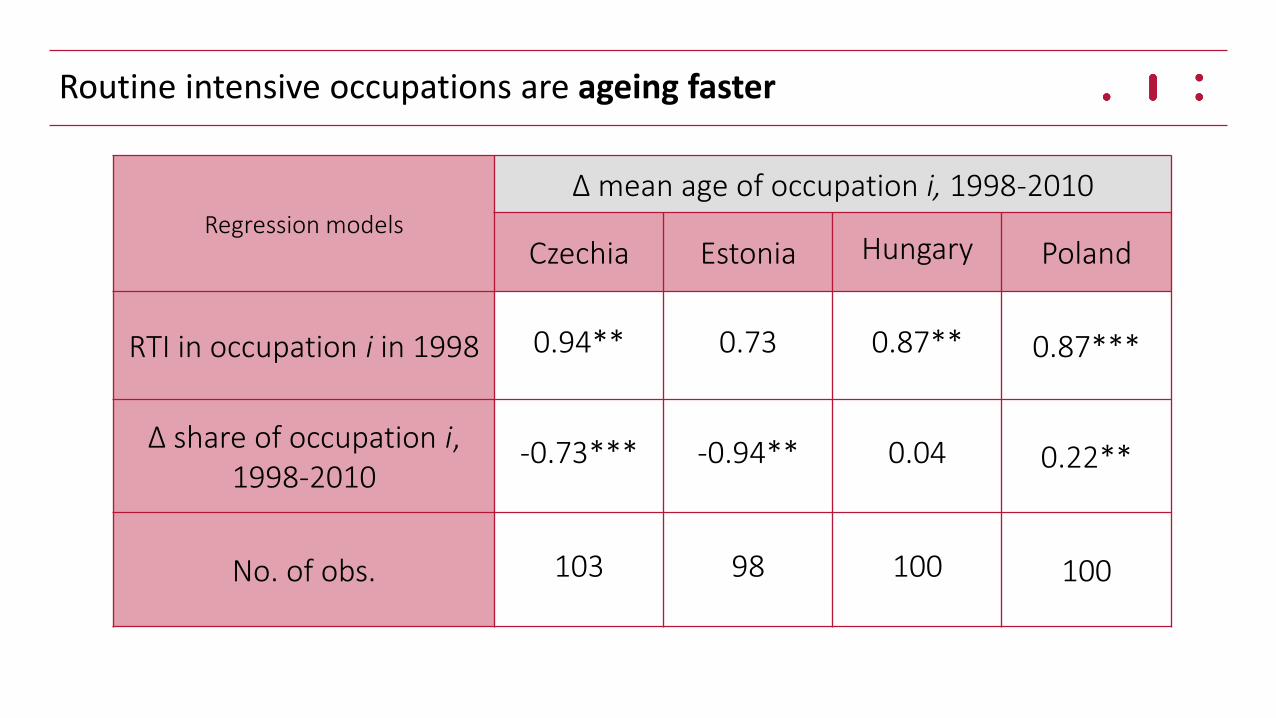
Routine intensive occupations are ageing faster
Regression models
Δ mean age of occupation i, 1998-2010
Czechia Estonia Hungary Poland
RTI in occupation i in 1998 0.94** 0.73 0.87** 0.87***
Δ share of occupation i, 1998-2010
-0.73*** -0.94** 0.04 0.22**
No. of obs. 103 98 100 100
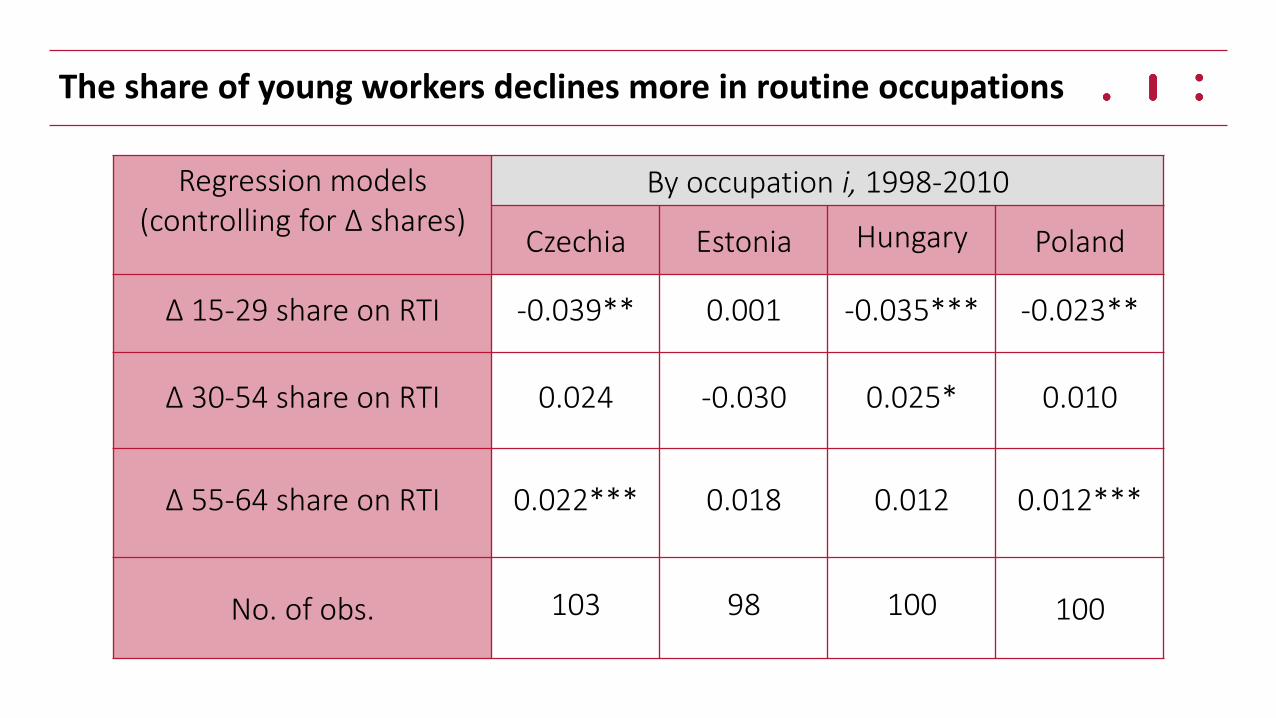
The share of young workers declines more in routine occupations
Regression models (controlling for Δ shares)
By occupation i, 1998-2010
Czechia Estonia Hungary Poland
Δ 15-29 share on RTI -0.039** 0.001 -0.035*** -0.023**
Δ 30-54 share on RTI 0.024 -0.030 0.025* 0.010
Δ 55-64 share on RTI 0.022*** 0.018 0.012 0.012***
No. of obs. 103 98 100 100
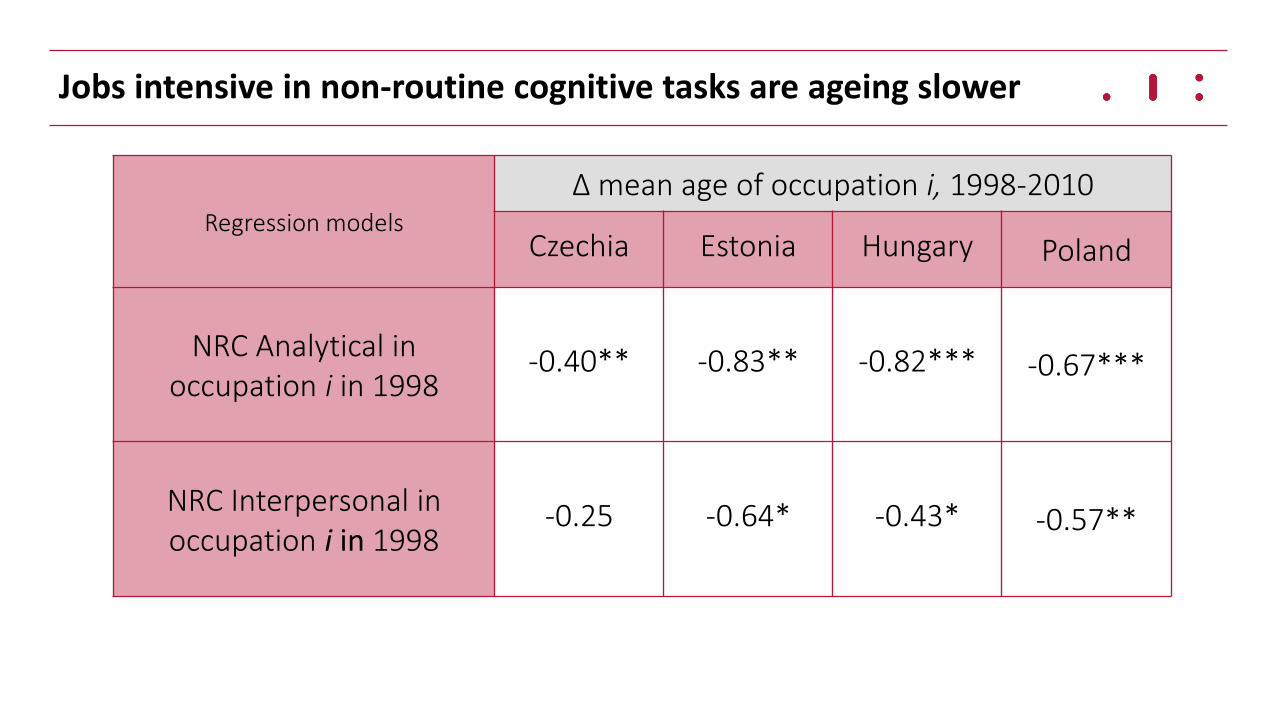
Jobs intensive in non-routine cognitive tasks are ageing slower
Regression models
Δ mean age of occupation i, 1998-2010
Czechia Estonia Hungary Poland
NRC Analytical in occupation i in 1998
-0.40** -0.83** -0.82*** -0.67***
NRC Interpersonal in occupation i in 1998
-0.25 -0.64* -0.43* -0.57**

The higher the RTI, the higher the change of unemployment rate
Regression models
Δ UR of occupation i, 1998-2010
Czechia Estonia Hungary Poland
RTI in occupation i in 1998 1.62*** 4.25*** 0.12 -0.25
• What about the age dimension?
• Logit models for the probability of being unemployed (accounting for changes over time, standard control variables)
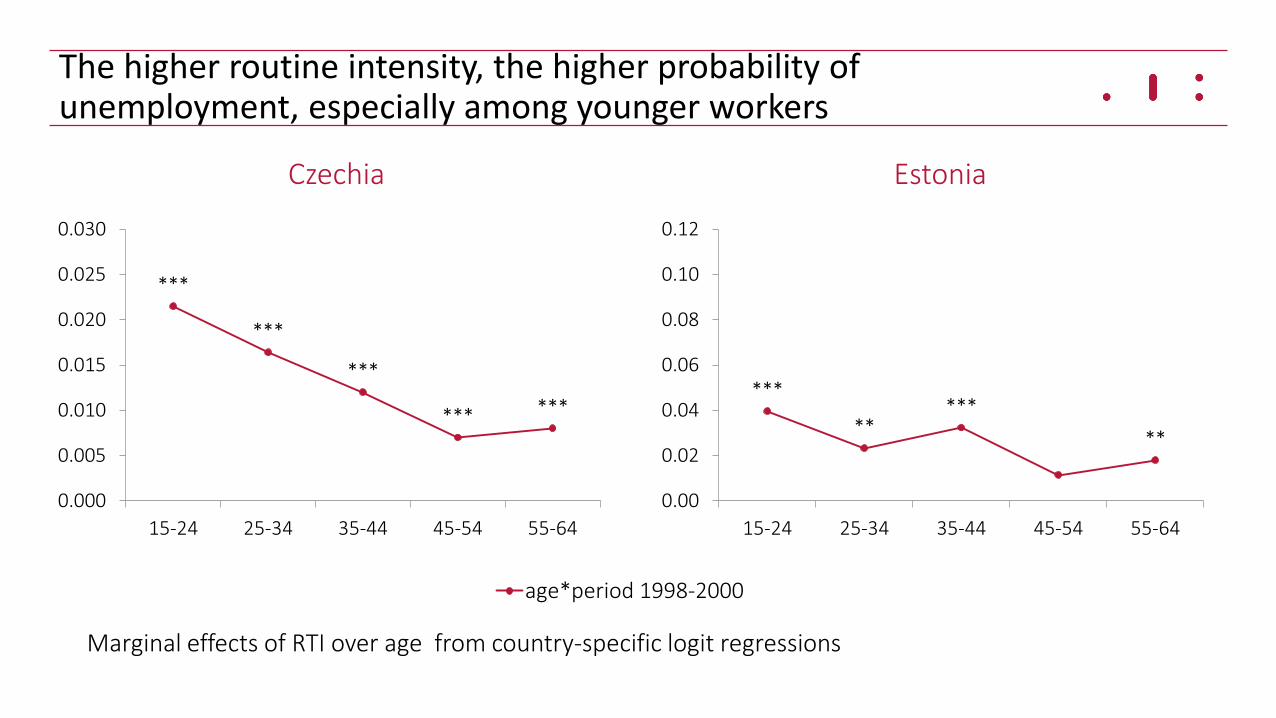
The higher routine intensity, the higher probability of unemployment, especially among younger workers
Czechia Estonia
Marginal effects of RTI over age from country-specific logit regressions
age*period 1998-2000
***
***
***
*** ***
0.000
0.005
0.010
0.015
0.020
0.025
0.030
15-24 25-34 35-44 45-54 55-64
***
** ***
**
0.00
0.02
0.04
0.06
0.08
0.10
0.12
15-24 25-34 35-44 45-54 55-64

The relationship between routine intensity and unemployment risk appears to strenghten over time
Czechia Estonia
Marginal effects of RTI over age from country-specific logit regressions
***
***
***
*** ***
***
*** ***
***
0.000
0.005
0.010
0.015
0.020
0.025
0.030
15-24 25-34 35-44 45-54 55-64
***
** ***
**
***
***
*** *** ***
0.00
0.02
0.04
0.06
0.08
0.10
0.12
15-24 25-34 35-44 45-54 55-64
age*period 1998-2000 age*period 2012-2014

The pattern is similar in all countries
Hungary Poland
Marginal effects of RTI over age from country-specific logit regressions
***
*** *** ***
***
0.00
0.01
0.02
0.03
0.04
0.05
0.06
15-24 25-34 35-44 45-54 55-64
*** ***
***
***
**
0.000
0.005
0.010
0.015
0.020
0.025
0.030
0.035
0.040
15-24 25-34 35-44 45-54 55-64
age*period 1998-2000

And changes over time are similar too
Hungary Poland
Marginal effects of RTI over age from country-specific logit regressions
age*period 1998-2000 age*period 2012-2014
***
*** *** ***
***
*** ***
*** ***
***
0.00
0.01
0.02
0.03
0.04
0.05
0.06
15-24 25-34 35-44 45-54 55-64
*** ***
***
***
**
***
***
***
***
*
0.000
0.005
0.010
0.015
0.020
0.025
0.030
0.035
0.040
15-24 25-34 35-44 45-54 55-64

Main findings on tasks in Central and Eastern Europe
• Non-routine cognitive tasks ↗ and manual tasks↘: upskilling (mainly) and technology (a bit)
• Routine cognitive tasks ↗ in many CEE countries: structural change
• Workers in highly routine jobs usually prime-aged and middle-skilled
• The shift to non-routine cognitive stronger among younger workers
• Routine-intensive occupations age faster and create higher unemployment risk for the young and prime-aged
• In the future routine tasks & jobs can ↘ as ICT stock ↗ and technology prices ↘

Papers used for this talk:
• Hardy W., Keister, R., Lewandowski P., 2016, Do entrants take it all? The evolution of task content of jobs in Poland, Ekonomia no. 46
• Hardy, W., Keister, R., Lewandowski, P., 2016. Technology or upskilling? The evolution of job task content in Central and Eastern Europe, IBS Working Paper 01/2016
• Keister, R., Lewandowski, P., 2017, A routine transition? The rise of routine work in Central and Eastern Europe, Accepted for publication in Transfer. The European Review of Labour and Research.
• Hardy, W., Keister, R., Lewandowski, P., Górka, S. 2016. Routine and ageing? The intergenerational divide in the task composition of jobs in Europe, IBS Working Paper , forthcoming