pipeline integrity software solution - mesa productspipeline integrity software solution pipeline...
TRANSCRIPT

mesaproducts.com
Pipeline Integrity Software Solution
Pipeline integrity field data acquisition represents
a significant investment to pipeline operators, and
managing the data generated through a pipeline
integrity program is an equally significant challenge.
Most of the available data management tools have
limitations in alignment, integration, and analysis of
multiple data streams.
Current PHMSA guidelines require integration of past, current, and future pipeline integrity data:
“Therulerequiresthatoperatorsintegrateassessmentresultswithotherpertinentinformationabouttherisk conditionsofthepipelinetouncoverintegrityissuesthatmightnotbeevidentfromtheassessmentdataalone.“ PHMSA Protocol #3.04
“Verifythatindividualdataelementsarebroughttogetherandanalyzedintheircontextsuchthe integrateddatacanprovideimprovedconfidencewithrespecttodeterminingtherelevanceofspecificthreats andcansupportanimprovedanalysisofoverallrisk.” PHMSA Gas Integrity Management Inspection Manual, C.02.f.
N-LINE is designed to reduce data management problems and streamline the data integration process while ensuring
the integrity of the information.
N-LINE was developed as a pipeline integrity data management application, allowing field technicians and engineers
to gather and process data, and perform quality control checks while integrating and aligning both current and
historical data into a single database. This software provides for the analysis of multiple data sets in a single
component, increasing both accuracy and capacity.
The application handles the import, storage, and analysis of the following types of data: CIS: ON\OFF and Static, DCVG,
ACVG, Soil Resistivity, PCM, ILI, Pipeline Depth, Cell to Cell, IR Drop Survey, Test Station, and GPS. Results are reported
through digital, tabular, graphical, and Pipeline Analysis Graph Engine (PAGE) reports formatted to client needs.
Headquarters4445 S. 74th E. AveTulsa, OK [email protected] Southeast- ServicesP.O. Box 14325 Tallahassee, FL 32317850.893.9366 Southeast- Materials843.271.8069 Gulf Coast16740 Hedgecroft Suite 412Houston, TX 77060281.445.8700 West Coast17461 Apex CircleHuntington Beach, CA 92647714.963.6202 Dallas/Ft. Worth12441 Bus. Hwy. 287NFt. Worth, TX 76179817.230.4249 Midwest1208 Lunar DriveWapakoneta, OH 45895419.738.7402
Import Features
• Accepts CIS data
• Accepts GPS data (DCVG, ACVG, PCM, Soil Resistivity, HCA, CP Surveys, Mapping, etc)
• Accepts ILI data
• Accepts any other data that can be put into the proper Excel/CSV format
• Data can be imported with and without GPS
Processing Features
• CIS can be ID’ed and matched to GPS data giving CIS GPS coordinates
• Automatic alignment of GPS
• GIS viewer to verify data alignment
• Correction allowed in GIS viewer to correct data
• Calculation of stationing based on GPS coordinates
• History tracking of changes to data that verify data integrity in a printed report
• Imports of multiple GPS data steams matched by GPS coordinate
Analysis Features
• Customization of equations to adjust calculations for client request
• Customization of queries for outputs for customizing reports
• Alignment of data from multiple pipelines in a single corridor
• Standard CP data analysis, i.e., -0.850 volt ON or OFF, >100 mV cathodic polarization shift criteria,
<-1.250 volt off or other user defined criterion
• Categorization of results by severe, moderate and minor based on user defined criterion.
• Data integration of indirect inspection results
• Site selection ranking for direct examination
• Data analysis correlated to GPS coordinates for relocating anomalies
• Data integration and analysis of indirect inspection results with ILI data
Reporting/Presentation Features
• All Reports can be printed in alignment sheet stationing or walked stationing
• Standard and customizable tabular reports
• Customizable digital output (Excel/CSV, ESRI Shape Files, Google Earth)
• Hard copy and screen visuals
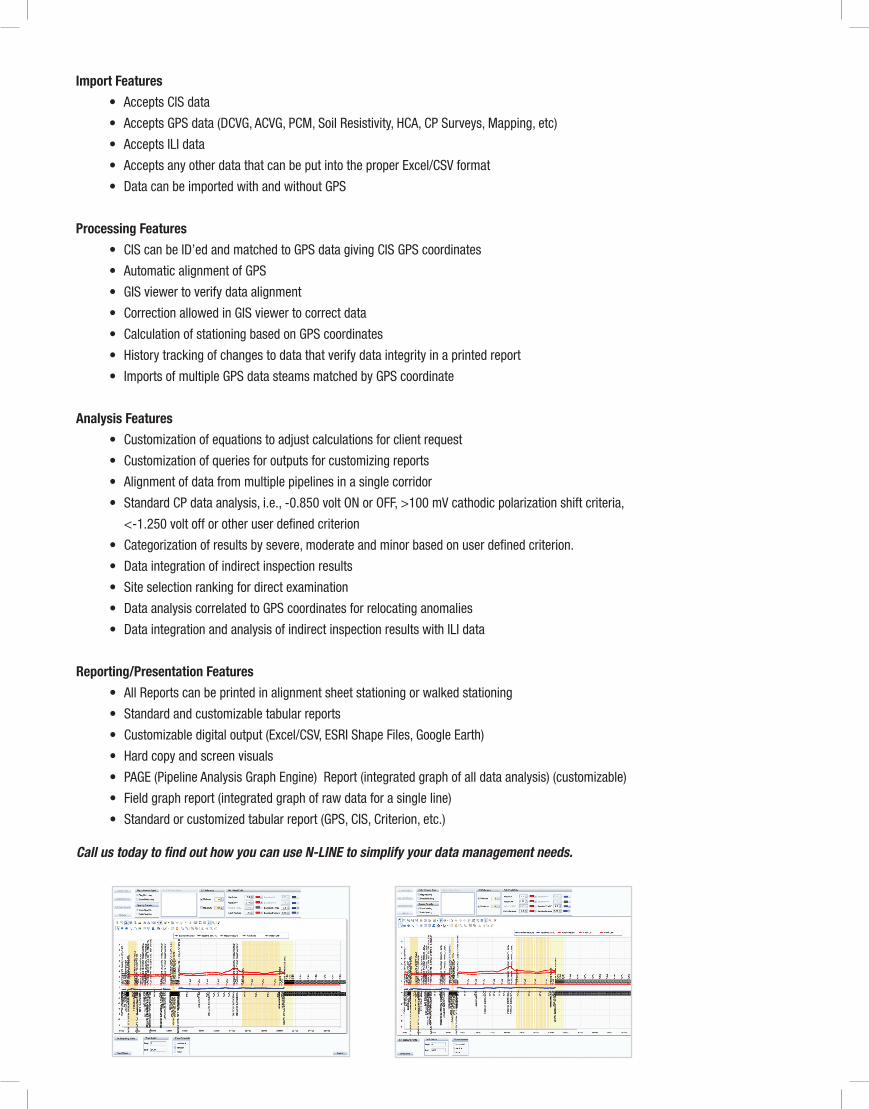
• PAGE (Pipeline Analysis Graph Engine) Report (integrated graph of all data analysis) (customizable)
• Field graph report (integrated graph of raw data for a single line)
• Standard or customized tabular report (GPS, CIS, Criterion, etc.)
Call us today to find out how you can use N-LINE to simplify your data management needs.