pipeline power - fiw€¦ · · 2012-05-14in 2010 essentially all of ... this does not...
TRANSCRIPT
FIW, a collaboration of WIFO (www.wifo.ac.at), wiiw (www.wiiw.ac.at) and WSR (www.wsr.ac.at)
FIW – Working Paper
Pipeline Power
Franz Hubert1, Onur Cobanli 2
We use cooperative game theory to analyze the strategic impact of three controversial pipeline projects. Two of them, Nord Stream and South Stream, allow Russian gas to bypass transit countries, Ukraine and Belarus. Nord Stream’s strategic value turns out to be huge, justifying the high investment cost for Germany and Russia. The additional leverage obtained through South Stream, in contrast, appears small. The third project, Nabucco, aims at diversifying Europe’s gas imports by accessing producers in Middle East and Central Asia. The project has a large potential to curtail Russia’s power, but the benefits accrue mainly to Turkey, while the gains for the EU are negligible. JEL: L5, L9, O22 Keywords: Bargaining Power, Transport Network, Natural Gas
1 Humboldt–Universität zu Berlin, E-Mail: [email protected] 2 Humboldt–Universität zu Berlin, E-Mail: [email protected]
Abstract
Authors
FIW Working Paper N° 93 May 2012


Pipeline Power
Franz Hubert Onur Cobanli
Humboldt–Universitat zu Berlin Humboldt–Universitat zu Berlin
[email protected] [email protected]
first draft
February 2012
Abstract
We use cooperative game theory to analyze the strategic impact of three controver-
sial pipeline projects. Two of them, Nord Stream and South Stream, allow Russian
gas to bypass transit countries, Ukraine and Belarus. Nord Stream’s strategic value
turns out to be huge, justifying the high investment cost for Germany and Russia.
The additional leverage obtained through South Stream, in contrast, appears small.
The third project, Nabucco, aims at diversifying Europe’s gas imports by accessing
producers in Middle East and Central Asia. The project has a large potential to
curtail Russia’s power, but the benefits accrue mainly to Turkey, while the gains for
the EU are negligible.
Keywords: Bargaining Power, Transport Network, Natural Gas
JEL class.: L5, L9, O22

PipePower March 1, 2012 1
1 Introduction
Gas from the Russian Federation accounts for a quarter of the consumption in the
European Union and for more than 40% of its imports. In 2010 essentially all of
these imports depended on transit through either Belarus or Ukraine, both being
major importers of Russian gas themselves. On both routes conflicts over transit
fees and gas prices led to several interruptions of supply, the most serious one
in January 2009 when transport through Ukraine was shut down for three weeks
with dire consequences for heating and power supply in the Balkan.1 European
policy makers are struggling to find a coherent response to these challenges. On
the one hand, new pipeline links with Russia are needed to diversify transit routes
for Russian gas. On the other hand, such pipelines have the potential to further
increase the dependency on Russian gas and reduce the viability of investments
securing supplies from alternative sources.
In this paper we analyze three controversial pipeline projects, which have the po-
tential to thoroughly transform the Eurasian supply system for natural gas. In the
North, the offshore twin-pipeline Nord Stream establishes a direct link between
Russia and Germany through the Baltic Sea. In spite of strong opposition from
Poland and some Baltic states, it received EU support as a strategic infrastructure
project. The first pipeline was inaugurated in late 2011 and the second is sched-
uled for completion in 2013. Further to the South, Italy and Russia discuss another
offshore pipeline, South Stream, through the Black Sea. If realized, it would pro-
vide a direct connection between Russia and Bulgaria, from where gas should flow
to Central Europe, Italy and Turkey. By bypassing the transit countries, Belarus
and Ukraine, both projects diversify transit routes for Russian gas. However, critics
argue that they will also increase Europe’s dependency on Russian exports and
safeguard Russia’s dominance in European markets by preempting investments
into alternative gas supplies. The third project, Nabucco, reflects these concerns.
Nabucco opens a southern corridor through Turkey connecting Europe to new sup-
pliers in the Middle East and the Caspian region. It also offers a new option to pro-
ducers in Central Asia, which currently ship gas through Russia. South Stream and
Nabucco are still at the planning stage and often portrayed as competing projects.
The EU made Nabucco a major strategic project under its Trans-European Energy
Networks (TEN-E), and the European Bank for Reconstruction and Development,
the European Investment Bank, and IFC (a member of the World Bank Group) ten-
1For a comprehensive account of major conflicts over transit through Belarus and Ukraine see
Bruce (2005) and Pirani et al. (2009), respectively.

PipePower March 1, 2012 2
tatively earmarked 4 billion e for funding. EU support for South Stream, in contrast,
has been lukewarm, due to concerns that it might pre-empt Nabucco by draining it
of potential gas supplies in Central Asia.2
The size of these projects appears out of range with both production possibilities
and market demand. With 55 bcm/aand 63 bcm/a, respectively, Nord Stream and
South Stream will increase transport capacities for Russian gas by 63% from app.
186 bcm/a to almost 304 bcm/a. If compared to the actual gas deliveries, which
peaked in 2008, the increase is almost 80% (BP (2011)). Given growing domestic
consumption and slow progress in developing new fields in Western Siberia, Rus-
sia will not be able to produce enough gas to make use of the additional offshore
transport capacity any time soon (Stern (2005)). Taken together all three pipelines
would increase the European import capacity by 150 bcm/a or 47%. While declining
production in the EU makes an increase of imports a likely scenario, pipeline gas
faces stiff competition from liquefied natural gas (LNG), which experienced a sharp
drop in prices due to decreasing cost and competing supplies of non-conventional
shale gas. Hence, we consider it as very unlikely that demand could take up so
much additional gas in the foreseeable future.3
In this paper the focus is on the strategic role of the pipelines. Even if not needed
for transporting additional gas, pipelines may have a substantial impact on the bal-
ance of power in the network. To assess the pipelines’ impact on bargaining power,
we develop a disaggregated quantitative model of the Eurasian gas network. The
interdependencies among the players are represented by a game in characteristic
function form, which is solved using the Shapley value. The power index thus ob-
tained reflects the production possibilities, market size and the architecture of the
transport network. When the latter is changed trough a new pipeline, we obtain a
different game entailing gains for some and losses for other players. If the gains
of the beneficiaries are larger than the cost of the pipeline, the project is a viable
strategic option, even if the impact on total consumption and production is negligi-
ble. This does not necessarily imply that the pipeline will be built. Those players
who are set to loose power might dissuade those who will gain from carrying out
2For the position of the EU see EU (2006), EU (2007), and EurActiv (2011).3It is misleading to relate the projects to import needs projected for 2030 or later. While a pipeline
will easily last 40 years, the decision to invest at a given time should be based on a much shorter
forecasting range. Once the ‘go ahead’ is given, it will take 3-7 years before the pipeline is ready to
deliver gas. Hence, if demand forecasted for a decade ahead is too low or too uncertain to justify
the project, the investment should be delayed. For the option like nature of sunk investment under
uncertainty see Dixit & Pindyck (1994).

PipePower March 1, 2012 3
the project. However, the pipeline option is at least a credible threat which can be
used to extract concessions.
Our analysis shows that Nord Stream’s strategic value is huge, justifying the high
investment cost for Germany and Russia. It severely curtails the power of transit
countries, Belarus and Ukraine, and the EU’s main producer, Netherlands. In prin-
ciple, South Stream fulfills a similar strategic role. However, with Nord Stream
already in place, the additional leverage obtained through South Stream is too
small to make the project viable for its main beneficiaries; Russia, Germany and
some central European countries. Nabucco has a large potential to curtail Russia’s
power, but the benefits accrue mainly to Turkey, which will diversify its gas imports
and become a major potential hub. The gains for the EU, in contrast, are negligible.
With financial support from Turkey and Iraq the project is strategically viable but our
results cast doubts on the prospects of raising the necessary funds within the EU.
Somewhat surprisingly, South Stream has little effect on Nabucco’s viability. The
EU Commission’s concern (or Russian hopes) that South Steam might pre-empt
the investment in a southern corridor through Turkey appears unfounded.
The paper can be related to various strands of literature. Grais & Zheng (1996),
Boots et al. (2004), von Hirschhausen et al. (2005) and Holz et al. (2008) use a
non-cooperative approach to model strategic interaction in quantitative models of
the Eurasian gas system. While this approach has computational advantages when
solving large disaggregated models, we do see several conceptional shortcomings.
First, the literature ignores that most pipeline gas is delivered under negotiated,
comprehensive price-quantity-contracts. Instead it adopts counterfactual assump-
tions from the standard Cournot or Bertrand set up. In combination with market
power, these restrictions on the strategy space lead to inefficiencies, which can
be avoided by the contracts, which exists in the real world.4 Second, the power
distribution is largely determined by ad hoc assumptions on the nature of strate-
gic interaction at the various stages (production, transport, distribution) and on the
sequencing of actions, hence, the ability to commit, and not derived from the un-
derlying economic environment. To avoid these problems, Hubert & Ikonnikova
(2011a) propose a cooperative model. They assume that players make efficient
use of the existing network and derive the power structure endogenously from the
actor’s role in gas production, transport and consumption. Their regional scope
4The European pipeline system was developed under long–term agreements with so called ‘take–
or–pay’ provisions. Contracts stipulate prices and quantities to ensure the efficient usage of the
capacities and to avoid double marginalization (see Energy Charter Secretariat (2007) for details).
Contracts with transit countries also cover tariffs and quantities.

PipePower March 1, 2012 4
however is very narrow. Here we extend their model to include several competing
producers and transit countries such as Turkey. We also allow importers in the EU
to act strategically. With these modifications we can assess the pipelines’ impact
on all major market participants. In a closely related paper Hubert & Orlova (2012)
use the same quantitative model of the gas industry to analyze mergers and the
liberalization of access rights within the EU.
On a more abstract level, the Eurasian pipeline network can be seen as just one
example of a network, which enables the parties to trade. Its architecture deter-
mines not only the actual trade flows but also the power of the parties, i.e. how they
will share the gains from trade. Hence, the actors will try to shape the network to
their own advantage. That the formation or severance of trade links can be used to
enhance the power of a nation has been recognized long ago (Hirschman (1969)).
More recent theoretical research developed formal models of strategic network for-
mation (e.g. Jackson & Wolinski (1996), for a review see Jackson (2008)). In this
paper we measure the impact of particular link on the power structure and relate it
to its cost, but we do not try to predict the equilibrium network structure (for a first
attempt along these lines see Hubert & Ikonnikova (2011b)).
2 The Model
The Eurasian gas network consists of a set of nodes R, which may be production
sites RP , customers RC or transit-connections RT , and a set of directed links L rep-
resenting pipelines (see figure 1 for a simplified illustration). A link l = {i, j}, i , j ∈ R
connects two nodes. Gas flows are denoted xi j where negative values indicate a
flow from j to i. For those links, which connect a producer to the network or the
network to a customer, flows have to be positive (xi j ≥ 0, ∀ i ∈ RP or j ∈ RC). For
each link {i, j} we have a capacity limit ki j and link specific transportation costs
Ti j(x), which includes production costs in case of i ∈ RP. For capacities which al-
ready exist, transportation cost consist only of operation costs, because investment
cost are sunk. When we allow for investments to increase ki j, the capital costs for
new capacities are added to the transportation costs. Each customer is connected
through a single dedicated link to the network. So consumption at node j ∈ RC is
equal to xi j and the inverse demand is p j(xi j).
The set of strategic players is denoted N. The interdependencies among the players
can be represented by a game in value function form (N, v), where the value (or
characteristic) function v : 2|N| → R+ gives the maximal payoff, which a subset

PipePower March 1, 2012 5
Figure 1: The Network
NS
OS
NW
SW
West
Center
East
TC
AlgeriaLibya
Iberia
Balkan
Belarus
Belgium
France
Iran
Iraq
Italy
Poland
RussiaC
RussiaN
RussiaP
RussiaS
Turkey TurkeyE
UK
Center-
East
Center
Nether-
lands
UkraineKazakh-
stan
Turkmen-
istan
Uzbek-
istan
Azer-
baijan
Norway
NABUCCO
NO
RD
STREAM
SOUTHSTREAM
Red nodes represent producers and transit nodes are white. Blue points represent regions where we have a
major transit node, which is linked to local production and local customers (the nodes are not shown separately).
Solid arrows represent the main pipelines as existing in 2010. Grey nodes and pipelines are taken into account
but not considered as strategic instruments. Dashed arrows are pipelines under construction or planning.
of players S ⊆ N can achieve. The legal and regulatory framework determines
the access rights of the various players. So for any coalition S ⊆ N we have to
determine to which pipelines L(S ) ⊆ L the coalition S has access. Access to the link
{i, j}, i ∈ RP is equivalent of having access to production at p. Access to {i, j}, j ∈ RC
yields access to customer j. The value function is obtained by maximizing the joint
surplus of the players in S using the gas-flows in the pipelines:
v(S ) = max{xi j |{i, j}∈L(S )}
∑{i, j}∈L(S ), j∈RC
∫ xi j
0p j(z)dz −
∑{i, j}∈L(S )
Ti j(xi j)
(1)
subject to the node-balancing constraints∑
i xit =∑
j xt j, ∀ t ∈ RT (S ), the capacity
constraints of the network |xi j| ≤ ki j, ∀ {i, j} ∈ L(S ) and non-negativity constraints
xi j ≥ 0, ∀ i ∈ RP or j ∈ RC. The value function captures the essential economic fea-
tures, such as the geography of the network, different cost of alternative pipelines,
demand for gas in the different regions, production cost, etc. It also reflects institu-
tional features, such as ownership titles and access rights.
Finally, we calculate the Shapley value, φi, i ∈ N, which is player i’s weighted con-
tribution to possible coalitions:
φi(v) =∑
S :i<S
P(S ) [v(S ∪ i) − v(S )] (2)

PipePower March 1, 2012 6
Table 1: Consumers
Regions Consumptiona Productiona Importa Import Dep.b
[bcm] [bcm] Dependencyc [%] on Russia [%]Centerd 107.3 21.4 80.1 43.6
Center-Easte 37.2 4.9 86.8 82.Italy 83 8.3 90. 18.9
France 49.8 0.7 98.6 17Poland 17.2 6.1 64.5 89.5
Netherlands 54.9 88.5 −61.2 −11.1f
Balkang 21.3 11.1 47.9 77.7Belgium 20.3 0. 100. 0.
Turkey 38.1 0.7 98.2 46.2UK 90.5 62.1 31.4 0
aData are from IEA (2010).bImports from Russia/net imports, BP (2011)cNet imports/consumptiondGermany, Denmark, Switzerland and LuxembourgeAustria, Hungary, Czech Republic and SlovakiafIn 2010 Netherlands imported 4.03 bcm from Russia and 16.97 bcm in total, although she is a net
exporter. (BP (2011)).gRomania, Bulgaria and Greece
where P(S ) = |S |! (|N | − |S | − 1)!/|N |! is the weight of coalition S . The Shapley value
assigns a share of the surplus from cooperation to each player, which will be also
referred to as his ‘power’. Suppose we change a network generating the value
function vo by adding a pipeline to obtain a new network generating v1. The gross
impact of the pipeline on the surplus of player i is then given by φi(v1) − φi(vo). This
difference in payoff is then compared to the investment cost of the pipeline.
To obtain a detailed representation of the various customers, owners of pipelines,
gas producers, etc. we would like to consider a large set of players. Unfortunately,
computational complexity increases fast in the number of players, as we have to
solve 2|N | − 1 optimization problems to calculate the value function. It is for compu-
tational reasons that we restrict the geographical scope by aggregating customers
into large markets and leaving out producers which appear to be of minor strategic
relevance.
As to producers, we focus on Russia, the supplier for Nord Stream and South
Stream, its main competitor Norway, and those countries in the Middle East and
Central Asia which have a potential to serve Nabucco (Iraq, Iran, Azerbaijan, and
Turkmenistan). Transit countries are Belarus, Ukraine and Georgia. Turkey is a
major consumer and a potential transit country for Middle Eastern and Caspian

PipePower March 1, 2012 7
gas. We aggregate customers and producers within the EU into eight regional
players. Each controls local production, access to local customers, and possibly
transit through the region. France, UK, Italy, Poland, Netherlands, and Belgium
correspond their respective countries. In each of these countries a national cham-
pion dominates imports and local supply (GDF, ENI, PNGiG, Gasunie, Botas). We
collect Austria, Czech Republic, Slovakia and Hungary in one region called “Center-
East”. South Stream and Nabucco will end in Center-East, from where gas will be
distributed to other European consumers. The countries in the region exhibit similar
consumption and import dependency patterns. With very little alternative supplies
the region depends with almost 90 % of its consumption on imports from Russia.
While the pipeline networks are largely privatized, some owned by Western im-
porters. The Austrian OMV can be seen as the dominant private supplier in the
region. Germany, Switzerland, Denmark and Luxembourg are bundled to “Cen-
ter”. In terms of consumption the region is clearly dominated by Germany, which
is also home of large gas suppliers, E.ON-Ruhrgas and Wintershall. The region
covers more than three quarters of gas consumption by imports, but its imports are
well diversified between Russia (43.6%), Norway (38%) and Netherlands (31.1%).5
Finally, we collect Romania, Bulgaria and Greece in a region called “Balkan”. The
region has only weak links to other European regions and its imports depend largely
on Russian gas.
We aggregate all pipelines and interconnection points between any two players into
one link. The arrows in figure 1 indicate direction of net flows between regions ac-
cording to IEA (2010a). Nord Stream, South Stream and Nabucco are presented
in dashed arrows. The arrows display direction of flow after the completion of the
project, namely from East to West. As to access rights, we assume that outside
EU every country has unrestricted control over its pipelines and gas fields. For
the regions within the EU, in contrast, we assume that common market rules en-
sure open third party access to the international high pressure transport pipelines.
Hence, regions within the EU cannot derive bargaining power from blocking gas
transit. Since this is an idealization of the current state of regulation, we discuss
the robustness of our results in Section 4. EU regions control local production and
access to the local customers. Most of them are mainly customers, who use Rus-
sian and Norwegian gas to complement their own production and other imports,
which are taken as given. The only exception is Netherlands, which produces in
excess of own consumption and is the only net exporter in the EU.
5Imports from the supplier/Net imports, BP (2011).

PipePower March 1, 2012 8
We assume a stationary environment with constant demand, technology, produc-
tion cost, etc. The value of a coalition, nevertheless, depends on the temporal
scope of the model. In the very short run, the pipeline network is essentially static.
The longer one projects into the future, however, the more options to invest in pipes,
compressors etc. can be exploited, hence the more flexible the transport system be-
comes. Here, we adopt a rather short horizon assuming that all pipelines can be
made bi-directional, but capacities cannot be increased.
The details of the numerical calibration are given in a technical appendix, which is
available on request. Here we outline only the main principles. We calibrate the
model using data for 2009 from IEA (2010a) on consumption and production in the
regions and flows between the regions from November 2009 to October 2010 taken
from IEA (2010b). We assume production cost, which are constant up to production
levels achieved in 2009 and linear demand functions with the same intercept for all
regions. The slope parameters are then estimated as to replicate the consumption
in 2009, given our assumption on production cost. The most important implication
of our calibration of demand in relation to cost is that the pipeline system as ex-
isting in 2009 is sufficient. Given the willingness to pay and the cost of producing
gas, it is able to deliver the efficient amount of gas into the different consumption
nodes. Thus, none of the expensive pipeline projects considered in this paper can
be justified in narrow economic terms.
This approach also ensures that the main difference between the regions is the
relation of total consumption to own production on which we have solid information
and not our assumption on demand functions on which information is poor. The
main difference between producers is production capacity and pipeline connections
to the markets, for which data are good, and not differences in wellhead production
cost, which are difficult to estimate.
Perhaps the most critical part of the calibration is the relation of demand intercept
and production cost which determines the overall surplus from gas trade. The rela-
tive shares of different players tend to be rather robust with respect to an aggregate
increase of demand in relation to production cost. However, the absolute values
of their shares will increase, and as a result more pipeline projects will become
strategically viable for given investment cost. We use a discount rate of 15% to
annualize investment cost to account for depreciation and the real option nature of
the investment.

PipePower March 1, 2012 9
3 Results for Pipelines
We assess the impact of a new pipeline by comparing the Shapley value (SV) for
two games, one without and another with the pipeline in place. Given our calibration
of demand, the pipelines do not create value. They can only change the power
structure. To assess the strategic viability of the pipeline, we relate the cost of the
pipeline to the gains of those players, whose power is increased.
Since a player’s Shapley Value is the weighted sum of his contributions to the values
of possible coalitions of other players, any change can be traced back to changes
of these contributions. The value of a coalition depends on its access to pipelines,
markets and gas fields. Hence, a player can increase the coalition value by pro-
viding additional markets, additional supply or by improving connections through
transit. In any case, the value of his contribution will depend on how well his re-
sources complement what is already there. Adding a market to other markets with
no access to production helps little compared to making the same market available
to several producers, which are short of customers. Generally speaking, a pipeline
may benefit a player by improving his access to complementary inputs and hurt
him by improving his competitors access to such resources. The trade-off between
access and competition is complicated by the fact that some countries play multiple
roles. While in our model Russia is a pure producer, and Belarus and Ukraine are
pure transit regions; Balkan is all, a gas producer, a customer and a transit region
for Russian gas. Moreover, the role of a player depends on the coalition against
which he is evaluated. For example, Turkey is an importer when all players are in
the coalition. However, it becomes a transit country for Russian gas in a smaller
coalition, for which neither transit through Belarus nor Ukraine is available. Multiple
and changing roles make it sometimes difficult to predict what the overall impact of
a new pipeline on a player will be.
3.1 Nord Stream
Nord Stream bypasses the transit countries in the Northern corridor and connects
Russia via a twin offshore pipeline through the Baltic Sea to Germany. The project
was initiated by Russian Gasprom and German EON-Ruhrgas and Wintershall in
2005. Later French GDF Suez and Dutch Gasunie joined the consortium. The
first pipeline was put into service in late 2011. The pipeline is expected to be fully
operational with 55 bcm/a by 2013. Published figures on investment cost have been
revised several times. We estimate total cost including complementary pipelines in

PipePower March 1, 2012 10
Table 2: Nord Stream’s Impact on Bargaining Power
Shapleyvalue [bn e/a]without with
Nord Stream Nord Stream differenceRussia 4.6 6.1 1.5
Ukraine 2. 0.6 −1.3Belarus 0.6 0.2 −0.4Norway 5.2 4.2 −1.
Netherlands 3.9 3.3 −0.6UK 1. 0.9 0.
Center 9.4 10.1 0.7Center-East 5.7 6.1 0.4
Italy 1.7 1.9 0.2Poland 0.9 1. 0.1France 4. 4.3 0.3
Belgium 1.7 1.9 0.1Balkan 0.4 0.4 0.Turkey 3.8 3.8 0.
Iran 0.6 0.6 0.Azerbaijan 0.2 0.2 0.
Georgia 0.2 0.2 0.project costa 1.5
aInvestment cost annualized with an interest of 15%.
Russia and Germany at 10 billion e.
Table 2 exhibits Nord Stream’s effect on the players’ relative power. For each player
we report the Shapley value with and without the pipeline as well as the difference
between the two measuring the project’s impact on the players’ surplus. As we
measure all figures in bn e/a we can compare the impact with annualized invest-
ment cost of 1.5 bn e/a.
The benchmark case without Nord Stream is presented in the first column. The
sum of all figures gives the total surplus of the grand coalition, when all players
cooperate regarding the production and transport of pipeline gas. The shares of
suppliers reflect their production capacities as well as their dependency on the
transit countries to access to consumer markets. Although Russia exports more
gas than Norway to the European markets, Norway’s surplus (5.2 bn e/a) is larger
than Russia’s (4.6 bn e/a), since Norway has direct access to the European pipeline
network, while Russia depends on transit countries, Ukraine and Belarus, to ship
gas to the European markets. Different transport capacities in Ukraine and Belarus
are reflected in their shares of profit, 2 bn e/a and 0.6 bn e/a, respectively. The

PipePower March 1, 2012 11
largest European producer, Netherlands obtains 3.9 bn e/a. The other European
regions are net importers, hence their benefits tend to increase with the size of their
markets and their dependence on pipeline gas. The figures reflect the gains from
trading gas, not the gains from consuming gas. A country whose own production
or LNG imports are large enough to cover demand will gain little from participating
in the gas trade even if its gas market is large. The EU as a whole obtains 28.7
bn e/a, with Center, Center-East and France having the largest shares. Turkey
benefits from its consumption of pipeline gas as well as its potential transit position
between Balkan and the suppliers; Russia, Iran and Azerbaijan.
The last column in Table 2 presents Nord Stream’s impact on the players’ surplus as
the differences. Russia gains 1.5 bn e/a, which is 32.6% of its share of profits in the
benchmark case. Increased transport competition mitigates the power of Ukraine
and Belarus, which loose 1.3 bn e/a and 0.4 bn e/a, respectively. The transit coun-
tries together lose 65.4% of their relative power in the benchmark case, since their
monopoly in transportation of Russian supplies to Europe is broken. Due to inten-
sified supply competition in the European markets, Norway and Netherlands suffer
losses of 1 bn e/a and 0.6 bn e/a, respectively. The European players together
benefit from increased transport and supply competition gaining 1.2 bn e/a. In the
EU, Center has the largest increase with 0.7 bn e/a.
Nord Stream’s total strategic value for the initiators of the consortium, Wintershall
and EON Ruhrgas of Germany and Gazprom of Russia (in our model Center and
Russia), is 2.2 bn e/a, which clearly exceeds the project’s cost of 1.5 bn e/a. It
is worth stressing that the project appears profitable only because it increases the
bargaining power of the consortium vis-a-vis other players. Given our calibration
of demand, the pipeline is not needed to transport additional gas. Our results also
suggest that it is in the interest of the EU to support the project since the gains of
the EU and Russia (2.7 bn e/a) is larger than the annualized cost of the project.
After the project was kicked off Gasunie of Netherlands and GDF Suez of France
joined the consortium each with a share of 9%. In view of our results the par-
ticipation of Gasunie is surprising, since Netherlands supplies 15% of the EU’s
consumption and is set to loose (-0.6 bn e/a) from intensified supply competition.
Our interpretation is the following. Gasunie joined in anticipation of its changing
role in the system. Due to rapidly declining reserves Netherlands will become a net
importer around 2025. The country also intents to become a gas hub in Northwest-
ern Europe transiting Russian gas from Germany to UK (Netherlands Ministry of
Economic Affairs, Agriculture and Innovation (2010)).

PipePower March 1, 2012 12
3.2 South Stream
South Stream can be seen as the Black Sea twin of the Baltic Sea crossing Nord
Stream. Russia pushes the project to obtain direct access to its customers in the
Southeast, bypassing Ukraine. It consists of three sections: offshore, northwestern
and southwestern.
OS: The offshore section runs through Turkey’s economic zone in Black Sea and
connects Russia directly with Bulgaria with a capacity of 63 bcm/a. The con-
sortium for the offshore section is composed by Gazprom of Russia, Eni of
Italy and EDF of France. Onshore the pipeline splits in two routes.
NW: The northwestern route runs from Bulgaria to Baumgarten in Austria via Ser-
bia and Hungary with a capacity of 30 bcm/a.
SW: The southwestern route connects Bulgaria to Italy via Greece and a short
offshore pipeline through Adriatic Sea. It has a capacity of 10 bcm/a. Each
section of northwestern and southwestern routes in the participating coun-
tries will be undertaken by a joint-venture between Gazprom and national gas
company of the corresponding country.
The offshore and the onshore pipeline sections are expected to cost 10 billion e
and 5.5 billion e, respectively. Thus, South Stream has total investment cost of
15.5 billion e (South Stream (2010)). According to press releases, the first line of
the project with a capacity of 16 bcm/a should be operational at the end of 2015.
The project will be in service with full capacity at the end of 2018.
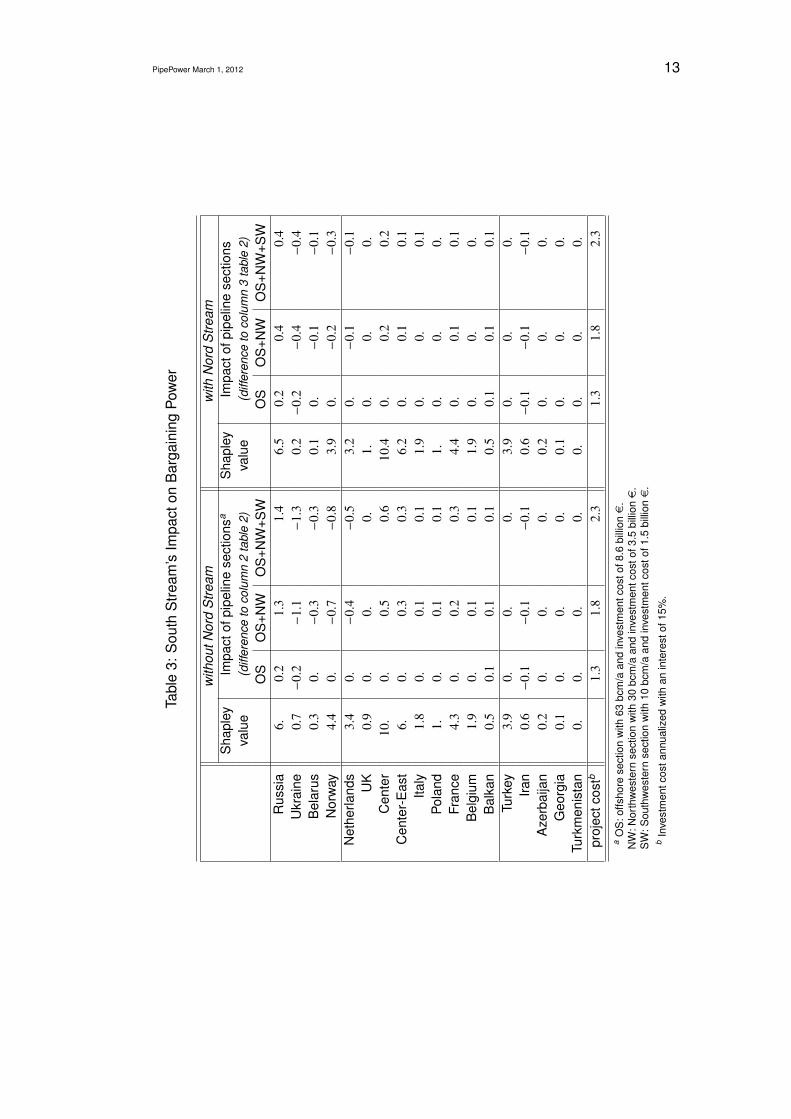
PipePower March 1, 2012 13
Tabl
e3:
Sou
thS
tream
’sIm
pact
onB
arga
inin
gPo
wer
with
outN
ord
Stre
amw
ithN
ord
Stre
amS
hapl
eyIm
pact
ofpi
pelin
ese
ctio
nsa
Sha
pley
Impa
ctof
pipe
line
sect
ions
valu
e(d
iffer
ence
toco
lum
n2
tabl
e2)
valu
e(d
iffer
ence
toco
lum
n3
tabl
e2)
OS
OS
+NW
OS
+NW
+SW
OS
OS
+NW
OS
+NW
+SW
Rus
sia
6.0.
21.
31.
46.
50.
20.
40.
4U
krai
ne0.
7−
0.2
−1.
1−
1.3
0.2
−0.
2−
0.4
−0.
4B
elar
us0.
30.
−0.
3−
0.3
0.1
0.−
0.1
−0.
1N
orw
ay4.
40.
−0.
7−
0.8
3.9
0.−
0.2
−0.
3N
ethe
rland
s3.
40.
−0.
4−
0.5
3.2
0.−
0.1
−0.
1U
K0.
90.
0.0.
1.0.
0.0.
Cen
ter
10.
0.0.
50.
610.4
0.0.
20.
2C
ente
r-E
ast
6.0.
0.3
0.3
6.2
0.0.
10.
1Ita
ly1.
80.
0.1
0.1
1.9
0.0.
0.1
Pola
nd1.
0.0.
10.
11.
0.0.
0.Fr
ance
4.3
0.0.
20.
34.
40.
0.1
0.1
Bel
gium
1.9
0.0.
10.
11.
90.
0.0.
Bal
kan
0.5
0.1
0.1
0.1
0.5
0.1
0.1
0.1
Turk
ey3.
90.
0.0.
3.9
0.0.
0.Ira
n0.
6−
0.1
−0.
1−
0.1
0.6
−0.
1−
0.1
−0.
1A
zerb
aija
n0.
20.
0.0.
0.2
0.0.
0.G
eorg
ia0.
10.
0.0.
0.1
0.0.
0.Tu
rkm
enis
tan
0.0.
0.0.
0.0.
0.0.
proj
ectc
ostb
1.3
1.8
2.3
1.3
1.8
2.3
aO
S:o
ffsho
rese
ctio
nw
ith63
bcm
/aan
din
vest
men
tcos
tof8
.6bi
llione
.N
W:N
orth
wes
tern
sect
ion
with
30bc
m/a
and
inve
stm
entc
osto
f3.5
billi
one
.S
W:S
outh
wes
tern
sect
ion
with
10bc
m/a
and
inve
stm
entc
osto
f1.5
billi
one
.b
Inve
stm
entc
osta
nnua
lized
with
anin
tere
stof
15%
.

PipePower March 1, 2012 14
Russia enjoys a very strong bargaining position in Southeastern Europe. Com-
peting producers such as Norway or Netherlands cannot reach this region, since
the transport capacities between Balkan and Central Europe are very small (1.7
bcm/a).6 The northwestern section improves the connection between Center and
Balkan; thus, it has a potential to increase competition for Russian gas in Balkan
and Turkey. However, Gazprom can prevent its competitors from using the pipeline.
As a co-owner, it can seek exemption from the Third Party Access (TPA) rules for
new investment.7
Nord Stream will be fully operational, before the construction of South Stream is
expected to start. So, the impact of South Stream has to be assessed for a network
which already includes Nord Stream (the right panel of Table 3). Nevertheless, it is
instructive to study the counterfactual case first, which is presented in the left panel
of Table 3. The comparison of left panel’s last column in Table 3 and the last column
in Table 2 shows that South Stream and Nord Stream alter the power structure in
a similar way. It does not matter much whether Russian gas is injected in Center
or in Balkan if third party access to the existing European network is free, while
at the same time new investment in the Northwestern section enjoys regulatory
holiday, so that Russia’s dominance in Southeastern Europe remains protected.8
The differences in the figures are in the range of 0.1 bn e/a. As in the case of Nord
Stream, Russia enjoys the biggest increase in bargaining power, worth 1.4 bn e/a,
while competing suppliers and transit countries loose.
As an alternative to Nord Stream, the more expensive South Stream is viable for
the members of the consortium (Russia, Italy, France, Center-East and Balkan), if
the offshore section is combined with the northwestern section, but the incremental
gains of southwestern section are not worth the additional cost. The whole project
is barely viable under our parameter assumptions. The consortiums jointly gains
2.2 bn e/a, while project cost are 2.3 bn e/a.
6In January 2009, the gas dispute between Russia and Ukraine hit Balkan countries severely,
since the bottleneck between Balkan and Central Europe hinders imports from other major suppliers
in Northwestern Europe and North Africa via Central Europe.7To incentivize new investment in infrastructure projects, the EU allows for so called regulatory
holiday under EU (2009). Nabucco, which is considered below, has a section which is similar to the
northwestern section of South Stream. There we are going to analyze the case of open third party
access.8We also considered the case that South Stream’s Northwestern section is not exempted from
free third party rules. In this case, the strategic gains from bypassing Ukraine are compensated by
the strategic loss of increased competition from Dutch and Norwegian gas. Thus Russia would loose
interest in the project.

PipePower March 1, 2012 15
Now we turn to the realistic scenario, in which Nord Stream is already in operation
(the right panel of Table 3). We start with the impact of the offshore section alone
(the column headed ‘OS’). The leverage gained is very small, since the gas could
only be transported to Balkan, a small market, and Turkey, which is already acces-
sible through Blue Stream. The offshore section is of little strategic use without
substantial onshore investments. If these complementary sections are added the
picture, we obtain a scaled down version of the counterfactual case. Russia gains
0.4 bn e/a, while Ukraine and Belarus suffer from transit competition and Nether-
lands and Norway from intensified supply competition. As a group the consortium
gain 1.0 bn e/a, which is less than the half of the project cost. With Nord Stream in
place, South Stream is no longer strategically viable.
It is also worth noting that the southwestern section has very little impact on the
power structure. With Nord Stream in place, there is already a large amount of
spare capacity to transport Russian gas to Central Europe and Italy.9 Adding a 10
bcm/a link through the Adriatic Sea makes hardly a difference.
In summary, considered as an alternative, both South Stream and Nord Stream
have almost identical effects on the power structure, since both projects bypass
the transit countries and allow Russia to compete more effectively with Norway
and Netherlands, without loosing its strong position in the Southeast. However,
in the presence of Nord Stream’s large capacities, South Stream provides much
less additional leverage. The gains for the consortium are not large enough to
compensate for the project’s high cost.
3.3 Nabucco
Plans for a new ‘southern corridor’ have been discussed for almost two decades.
In the late nineties the US government pushed for a ‘Trans-Caspian Pipeline’ from
Central Asia through the Caspian Sea, Azerbaijan and Georgia into Turkey and
further on to Southern Europe. The strategic aim was twofold: to reduce Turkey’s
and Europe’s dependency on Russian gas and to decrease Russia’s leverage in
the newly independent former Soviet republics. However, US energy companies
dragged their feet over uncertain economic prospects. These worsened when Rus-
sia started to contract large volumes of gas from Turkmenistan in 2002 at much
higher prices than before. With the US’ support withering the Europeans took over
9The northwestern and offshore sections of South Stream and Nord Stream together increase
pipeline capacity between Russia and Europe (except Balkan) from 140 bcm/a to 225 bcm/a, while
in 2008 the demand for Russian gas in the area was 108.3 bcm (BP (2009)).

PipePower March 1, 2012 16
the initiative. A consortium lead by OMV of Austria and Botas of Turkey (later joined
by German RWE) coined the new name ‘Nabucco’.10 The focus of the new project
has shifted, in the East from Central Asia towards suppliers in the Middle East and
in the West towards extending the pipeline into the heart of Europe. The project has
been postponed several times and is currently scheduled to become operational in
2017.
For the assessment of the pipeline’s impact it is useful to divide Nabucco into four
sections: Trans-Caspian, the eastern section, the central section and the western
section.
TC: Trans-Caspian, for the purpose of this paper, is narrowly defined as the off-
shore pipeline between Turkmenistan and Azerbaijan. With 30 bcm/a capacity
it is estimated to cost 2.3 billion e. RWE of Germany and OMV of Austria,
both also members of Nabucco’s overall consortium, have the initiative.
ES: The Eastern section consists of several pipelines connecting Turkey with po-
tential suppliers, Azerbaijan, Iran and Iraq. We include Iran even though at
present this appears to be very unlikely for political reasons. The country has
the second largest gas reserves in the world and Turkey already imports gas
from Iran. Even though none of the parties involved in the project will openly
admit, Iran is an important potential supplier for Nabucco. For the calculation
we assume that the existing capacity of each feeder pipeline between Turkey
and the suppliers is increased by 15 bcm/a, and the section from Turkey’s
East to the West is enlarged by 30 bcm/a. We estimate the cost at 7.2 billion
e, which includes in some cases the cost of developing fields.
CS: The central section connects western Turkey with Balkan. It is important to
note that existing pipelines with a capacity of app. 16 bcm/a are currently used
to pump Russian gas into the opposite direction, from Balkan into Turkey.
Nabucco will reverse the direction of the flow through the central section and
expand its capacity by 30 bcm/a to an estimated total of 46 bcm/a. We esti-
mate the cost of the central section at 1.9 billion e.
WS: The western section connects Balkan to Center with a planned capacity of
30 bcm/a and an estimated cost of 3.5 billion e. At present, Southeastern
Europe is isolated from Central Europe since existing transport capacities
between these regions are small (1.7 bcm/a). As a result, Russia faces no
10The consortium also includes companies from transit countries: Bulgargaz of Bulgaria, Transgaz
of Romania, and MOL of Hungary.

PipePower March 1, 2012 17
competition from Norway and Netherlands in the Southeast. The Nabucco
consortium rallied political support in the EU arguing that it would help to in-
tegrate the region to other European markets by eliminating the bottleneck.
The pipeline is designed for bidirectional use and shall be open for gas trans-
port for all interested parties. So, we assume that every player has access to
Nabucco’s western section, whereas we assumed exclusive access for South
Stream’s northwestern section.
Nabucco’s expected total cost is 12.6 billion e. Since none of the potential suppliers
are member of either Nabucco’s or Trans Caspian’s consortium, producers will not
contribute to investment cost.11 It is worth emphasizing, that Nabucco’s commercial
prospects are built on reversing flows in the present network. Currently, gas flows in
small quantities from Center to Balkan and in substantial quantities from Balkan to
Turkey. These flows have to be reversed before anybody will pay transport fees to
Nabucco’s owners. Considering the pipeline in isolation, it is easy to underestimate
how much additional gas in Turkey is needed to justify its capacity. Let’s consider
the central section of Nabucco. First, some 10 bcm/a are needed to substitute for
the current flow from Balkan to Turkey. Second, existing capacities can be made
bidirectional at modest cost to pump some 16 bcm/a from Turkey to Balkan without
new pipelines. Third, 30 bcm/a are needed to fill the additional pipeline capacities.
In total it would require app. 55 bcm/a additional gas in Turkey to make fully use of
the new pipeline. As with Nord Stream and South Stream, many observers raised
serious doubts as to whether such quantities can be provided anytime soon.
In Table 4 we report selected results for the strategic impact of Nabucco. We focus
on a scenario where Nord Stream is already completed and then Nabucco is added
to the system (left panel). The first column shows the absolute Shapley values for
the completion of all sections. It should be compared to column 2 in Table 2. The
difference between the two i.e. the impact of the whole project is shown in column
4. It is instructive to consider the effect of the different sections separately. First,
we consider only the sections in the east (TC and ES), which connect Turkey to
the producers in the Middle East and Central Asia (second column). As increased
supply competition harms other producers, in particular Russia, it benefits Turkey
and to a much lesser extend Balkan. The effects of additional producers in the East
on other EU regions are negligible, which is not surprising in view of the bottleneck
11In principle, the suppliers can compensate the members of the consortium for investment cost
by providing cheap gas under long term contracts. It is not clear, however, whether countries like
Azerbaijan and Iraq, not to speak of Iran, can credibly make such long term commitments.

PipePower March 1, 2012 18
Table 4: Nabucco’s Impact on Bargaining Power
without South Stream with South StreamShapley Impact of pipeline sectionsa Shapley Impactb
value (difference to column 3 table 2) valueTC+ES WS TC+ES+ TC+ES+
CS+WS CS+WSRussia 4.7 −0.8 −0.3 −1.4 5. −1.5
Ukraine 0.4 −0.1 −0.1 −0.2 0.1 −0.1Belarus 0.2 0. 0. 0. 0.1 0.Norway 4. −0.1 0.3 −0.1 3.8 −0.1
Netherlands 3.2 0. 0.2 −0.1 3.1 0.UK 0.9 0. 0. 0. 0.9 0.
Center 10.2 0. −0.1 0.1 10.5 0.1Center-East 6.2 0. −0.1 0.1 6.3 0.1
Italy 1.9 0. 0. 0. 1.9 0.Poland 1. 0. 0. 0. 1.1 0.France 4.4 0. −0.1 0. 4.5 0.
Belgium 1.9 0. 0. 0. 1.9 0.Balkan 0.6 0.1 0.1 0.1 0.6 0.1Turkey 5.1 0.7 0.5 1.3 5.1 1.2
Iraq 0.3 0.4 0. 0.3 0.3 0.3Iran 0.6 −0.1 −0.2 −0.1 0.5 0.
Azerbaijan 0.2 0. −0.1 0. 0.1 0.Georgia 0.1 0. −0.1 0. 0.1 0.
Turkmenistan 0.1 0. 0. 0.1 0.1 0.1project costc 0.9 0.5 1.7 1.7aTC: Trans Caspian with 30 bcm/a and investment cost of 2.3 bn e.
ES (eastern section). Pipelines between east Turkey and Azerbaijan, Iran and Iraq, each increasedby 15 bcm/a. East to West Turkey enlarged by 30 bcm/a. Total investment cost 7.2 billion e.
CS (central section) with 30 bcm/a and investment cost of 1.9 billion e.WS (western section) with 30 bcm/a and investment cost of 3.5 billion e.
b difference to column 6 table 3cInvestment cost annualized with an interest of 15%.

PipePower March 1, 2012 19
between Balkan and the rest. Iraq, which previously had no connection, gains
substantially, but other producers and transit countries in the region have little to
gain and might even loose. The benefits of Turkey and Iraq clearly outweigh the
cost of the pipelines in the East. As gain depends only on the branch leading into
Iraq, we expect investments here even when the rest of Nabucco fails to materialize.
Next, we consider only the western section (WS) connecting Balkan and Turkey
(column three). This pipeline with a capacity of 30 bcm/a will not be used. Nev-
ertheless, the option to move gas from Northwest to Southeast intensifies com-
petition for customers in the Southeast which benefits Turkey and Balkan as well
as producers in Northwest at the cost of Russia and producers in the Middle East
and Caspian region. Some regions in the EU, such as Center, Center-East and
France are slightly harmed from increased demand competition, since Norway and
Netherlands will gain better access to other markets. Again the effect on the EU as
a group is negligible. With a total gain of 1.0 bn e/a compared to cost of 0.5 bn e/a
the section is a viable option for producers in Northwest together with Turkey and
Balkan.
Now, we consider the project as a whole (column 4, left panel). Bringing in new
suppliers in the East and connecting them with the center of Europe’s network
weaken the bargaining power of all old suppliers, but in particular Russia (-1.4 bn
e/a). The lion’s share of the benefits accrues to Turkey (+1.3 bn e/a) and Iraq (+0.3
bn e/a) while the impact on the European regions is again very small. Comparing
the gains of the winners to the investment cost, the whole project just breaks even.
However, starting with the eastern parts, the incremental gains of bargaining power
do not cover the incremental cost of the central and the western sections. Nabucco
does surprisingly little to improve the power of Turkmenistan. We attribute this to
the fact, that the cost of the Trans-Caspian section is high and the new supply route
has three transit countries of which Azerbaijan is also a competing producer. In
view of these results, it is difficult to make much sense out of the EU’s support of
the project. Nabucco appears oversized given the limited supplies of gas in the
east, and the main beneficiaries are Turkey and possibly producers in the east.12
Finally, we return to the perception that South Stream and Nabucco are competing
projects and the concern that the former might preempt investment into the latter.
12Recent developments lend credibility to this sceptical assessment. While support for Nabucco is
crumbling Botas of Turkey and Socar of Azerbaijan agreed on a Trans-Anatolian pipeline from Shah
Deniz gas field to Turkey’s West, which corresponds to the eastern and central sections of Nabucco
but has half of its capacity, 16 bcm/a (Businessweek (2011)). In the West, BP considers a South-East
Europe pipeline, with 10 bcm/a a scaled down version Nabucco’s Western section (FT (2011)).

PipePower March 1, 2012 20
In the right panel of Table 4 we show the strategic impact of Nabucco in a situation,
where South Stream and Nord Stream will be fully operational. Comparing the
second column of the right and the fourth column of the left panel, we find very little
difference. Hence, South Stream has almost no impact on the strategic viability of
Nabucco.
4 Concluding Remarks
In this paper we analyze the strategic impact of three controversial pipeline projects,
Nord Stream, South Stream and Nabucco, which have the potential to thoroughly
transform the Eurasian supply system for natural gas. The interdependencies
among the players are represented by a game in characteristic function form. We
use the Shapley value of the game to measure the bargaining power of the players.
A disaggregated quantitative model of the Eurasian gas network is used to calibrate
the model. Each pipeline changes the architecture of the network, hence, the value
function for the game. We identify the strategic impact by comparing the power
index for the various players and relate it to the cost of the project.
If considered as an alternative, both South Stream and Nord Stream have almost
identical effects on the power structure in the Eurasian transport network for natural
gas. The pipelines bypass the transit countries Belarus and Ukraine and allow Rus-
sia to compete more effectively with Norway and Netherlands. For the initiators of
Nord Stream, Russia and Germany, the gains in bargaining power clearly justify the
cost of investment. The main beneficiaries of South Stream are Russia, Germany
and some Central European countries. Due to its much higher cost, it is difficult for
the project to brake even. However, once Nord Stream’s large capacities become
operational, South Stream’s additional leverage is much reduced and the project
turns strategically unviable.
Nabucco opens a southern corridor through Turkey connecting Europe to new sup-
pliers in the Middle East and the Caspian region. It also offers a new option to
the producers in Central Asia, which currently ship gas through Russia. The EU
made Nabucco a major strategic project under its Trans-European Energy Net-
works (TEN-E) and substantial public funds have been earmarked for the project.
The project has large potential to decrease Russia’s power, but the benefits accrue
mainly to Turkey, which will diversify its gas imports and become a major potential
hub. The gains for the EU, in contrast, are negligible. The gains for Turkey and Iraq

PipePower March 1, 2012 21
are very large and clearly justify investments in the eastern sections of the project.
The incremental cost of the sections in the center and towards the west are too
large to justify the strategic gains.
We will now briefly discuss, how robust these results are. First, we reconsider our
assumption of free third party access within the European Union. When the Euro-
pean Commission started its policies to ensure a common market for natural gas
in the late nineties, the situation was very different. Most countries had a ‘national
champion’ who monopolized the high pressure transportation grid, hence long dis-
tance transport, and one might argue that it is still a long way to overcome this
fragmentation of the market. With exclusive access, a region in the EU can derive
power by blocking gas shipments through its trunk pipe network. As a result each
coalition has access only to the pipeline network of its members. Therefore, Euro-
pean consumers, which neighbor a producer or a transit country, gain transit power,
while importers without Non-European borders suffer. While the impact of pipelines
on bargaining power change slightly, our conclusions regarding the strategic viabil-
ity of the various projects remain valid. There is one minor exception for Nabucco:
The incremental gain through the central and western sections justifies investment
in these sections. If designed for free third party access, this sections of Nabucco
have an stronger impact if the market is fragmented.
We also consider an increase of demand accompanied by a decrease in European
production capacities. In accordance with predictions for 2030, we increase each
consumer’s demand by 20%. By that time Netherlands’ production is expected to
decrease by 30 bcm/a, making the region a net importer. By keeping LNG imports
constant, we rule out that the growth of demand can be satisfied by alternative
sources of gas. Regarding the production capacity of Russia, we study two cases:
In the first, Russia’s production capacity remains unchanged. In the second it is
increased by 30 bcm/a to compensates for the decrease in Netherlands’ production.
Overall, these scenarios create environments, which are very favorable for pipeline
investments. Nevertheless, with Nord Stream in place the narrowly defined eco-
nomic benefits of additional pipelines are still a tiny fraction of project cost in all
scenarios.13 The strategic effect, however, is amplified. Even with Nord Stream
providing already a massive direct link, South Stream’s additional leverage for Rus-
sia and European customers yields gains which clearly outweigh the projects cost.
Only the Southwestern section through the Adriatic Sea remains an unattractive
13The increase in total surplus is 0.04 (0.03) bn e/a for South Stream and 0.16 (0.18) bn e/a for
Nabucco if Russia can (cannot) increase production, while project cost are 2.3 and 1.7, respectively.

PipePower March 1, 2012 22
proposition. The increase in demand also enhances the strategic attractiveness of
Nabucco. The value of the central and western section is raised enough to justify
the investment cost. While the main benefits still accrue to Turkey and eastern pro-
ducers, European importers would also improve their leverage. These results do
not depend much on whether Russia can raise production capacities over present
day levels or not.
References
Businessweek (2011), Socar to Ship Caspian Natural Gas
to EU Using Own Pipelines, published in 29.12.2011,
http://www.businessweek.com/news/2011-12-29/socar-to-ship-caspian-
natural-gas-to-eu-using-own-pipelines.html
Boots, M.G. & Rijkers, F.A.M. & Hobbs, B.F. (2004), Trading in the Downstream
European Gas Market: A Successive Oligopoly Approach, Energy Journal,
vol. 25(3), 74-102
British Petroleum (2009), Statistical Review of World Energy June 2009,
http://www.bp.com/statisticalreview
British Petroleum (2011), Statistical Review of World Energy June 2011,
http://www.bp.com/statisticalreview
Bruce, Chloe(2005), Fraternal Friction or Fraternal Fiction? The Gas Factor in
Russian-Belarussian Relations, Oxford Institute for Energy Studies, NG 8
Dixit, Avinash K. & Pindyck, Robert S. (1994), Investment under Uncertainty,
Princeton University Press, Princeton, N.J.
European Union (2007), Commission of the European Communities, Priority In-
terconnection Plan, COM(2006) 846 final/2, Brussels
European Union (2008), Commission of the European Communities, An EU En-
ergy and Solidarity Action Plan, COM(2008) 781 final, Brussels
European Union (2009), Commission of the European Communities, New Infras-
tructure Exemptions, SEC(2009)642 final, Brussels

PipePower March 1, 2012 23
Energy Charter Secretariat (2007), Putting a Price on Energy - International Pric-
ing Mechanisms for Oil and Gas, Brussels
ENTSOG, European Network of Transmission System Operators for Gas
(2010), Capacity map dataset in Excel format, version June 2010,
http://www.entsog.eu/mapsdata.html
EurActiv (2011), Oettinger zu Nabucco: ”Jahr der Entscheidung”, published in
28.03.2011, http://www.euractiv.de/energie-und-klimaschutz/artikel/oettinger-
nabucco-jahr-der-entscheidung-004571
European Parliament & Council (2006), Decision No: 1364/2006/EC, Official Jour-
nal of the European Union, L 262/1-23
Financial Times (2011), BP plans gas pipeline to Europe from Azerbaijan, pub-
lished in 26.09.2011, http://www.ft.com/intl/cms/s/0/ed9151b8-e84c-11e0-
ab03-00144feab49a.html#axzz1mvnH9BOB
Grais, Wafik & Zheng, Kangbin (1996), Strategic interdependence in European
east-west gas trade: a hierarchical Stackelberg game approach, The Energy
Journal, vol. 17(3)
Hirschhausen, Christian von & Meinhart, Berit & Pavel, Ferdinand (2005), Trans-
porting Russian Gas to Western Europe: A simulation Analysis, Energy Jour-
nal, vol 26 (2), p 49-67
Hirschman, Albert O. (1969), National Power and the Structure of Foreign trade,
University of California Press, Berkeley
Holz, F. & Hirschhausen, C. & Kemfert, C. (2008): A Strategic Model of European
Gas Supply, Energy Economics, vol. 30/3, pp. 766788
Hubert, F. and Ikonnikova, S., (2011a), Investment Options and Bargaining Power
in the Eurasian Supply Chain for Natural Gas, Journal of Industrial Eco-
nomics, vol LIX(1), pp. 85 -116
Hubert, Franz & Ikonnikova, Svetlana (2011b), Hold-up and Strategic Investment
in International Transport Networks: Gas Pipelines in North Western Europe,
working paper
Hubert, Franz & Orlova, Ekaterina (2012), Competition or Countervailing Power
for the European Gas Market, working paper

PipePower March 1, 2012 24
Hubert, Franz & Suleymanova, Irina (2008), Strategic Investment in International
Gas-Transport Systems: A Dynamic Analysis of the Hold-Up Problem, DIW
Discussion Paper, 846.
International Energy Agency (2010a), Gas Trade Flows in Europe, viewed 6 Jan-
uary 2011, http://www.iea.org/gtf/index.asp
International Energy Agency (2010b), Monthly Natural Gas Survey September
2010, http://www.iea.org/stats/surveys/archives.asp
Jackson, Matthew O. & Wolinsky, Asher (1996), A Strategic Model of Social and
Economic Networks, Journal of Economic Theory, vol. 71, pp. 44-74
Jackson, Matthew O. (2008), Social and Economic Networks, Princeton University
Press, Princeton, N.J.
Netherlands Ministry of Economic Affairs, Agriculture and Innovation (2010), Eco-
nomic Impact of the Dutch Gas Hub Strategy on Netherlands, Hague
Pirani, Simon & Stern, & Yafimava, Katja (2009), The Russo-Ukrainian gas dispute
of January 2009: a comprehensive assessment, Oxford Institute for Energy
Studies, NG 27
South Stream (2010), South Stream is estimated to cost EUR 15.5 billion, pub-
lished in 30.11.2010, http://south-stream.info/index.php?id=70&L=1
Stern, Jonathan (2005), The future of Russian gas and Gazprom, Oxford Univer-
sity Press, England