pisa math sample items
TRANSCRIPT
1
PISA MATH SAMPLE ITEMS
Unit Name Page
Walking ............................................. 2
Cubes ................................................. 5
Growing Up ....................................... 7
Robberies ........................................... 12
Carpenter ........................................... 15
Internet Relay Chat ............................ 17
Exchange Rate ................................... 19
Exports .............................................. 22
Coloured Candies .............................. 24
Science Tests ...................................... 25
Bookshelves ....................................... 26
Litter .................................................. 27
Earthquake ........................................ 29
Choices .............................................. 30
Test Scores ......................................... 31
Skateboard ......................................... 33
Staircase ............................................. 37
Number Cubes .................................. 38
Support For President ........................ 40
The Best Car ....................................... 42
Step Pattern ....................................... 44
2
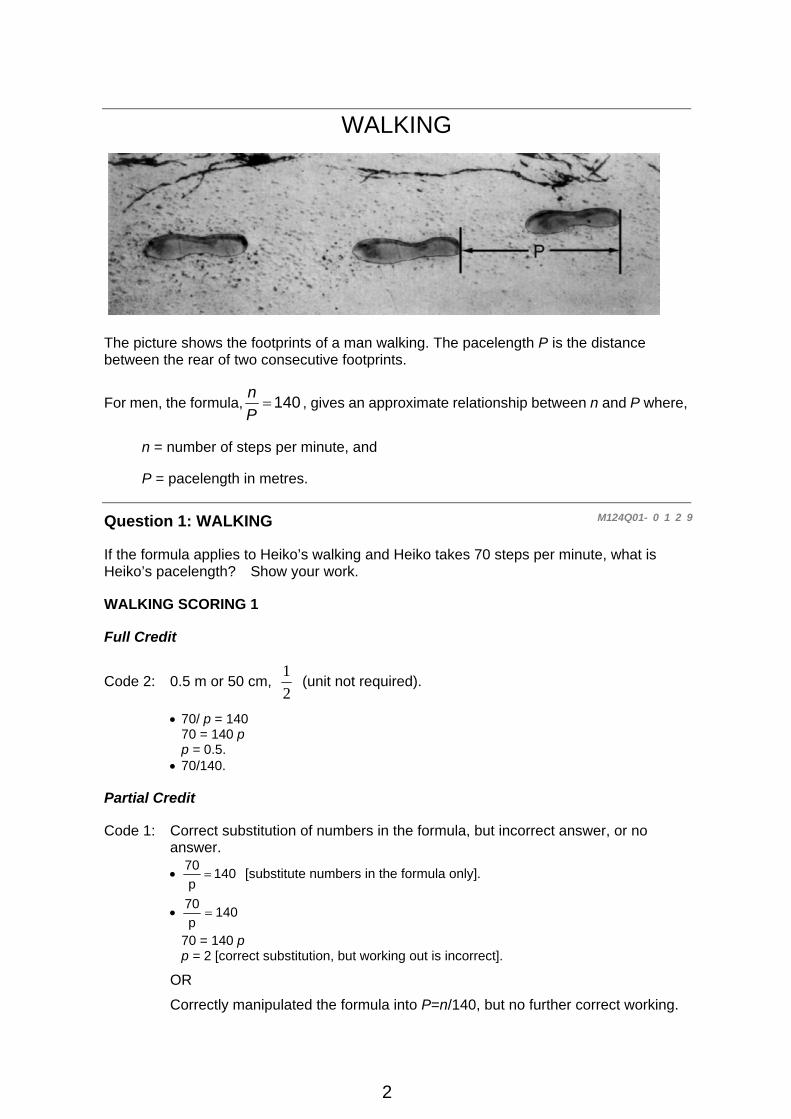
WALKING
The picture shows the footprints of a man walking. The pacelength P is the distance between the rear of two consecutive footprints.
For men, the formula, 140=Pn
, gives an approximate relationship between n and P where,
n = number of steps per minute, and
P = pacelength in metres.
Question 1: WALKING M124Q01- 0 1 2 9
If the formula applies to Heiko’s walking and Heiko takes 70 steps per minute, what is Heiko’s pacelength? Show your work.
WALKING SCORING 1
Full Credit
Code 2: 0.5 m or 50 cm, 21
(unit not required).
• 70/ p = 140 70 = 140 p p = 0.5.
• 70/140.
Partial Credit
Code 1: Correct substitution of numbers in the formula, but incorrect answer, or no answer.
• 140p70
= [substitute numbers in the formula only].
• 140p70
=
70 = 140 p p = 2 [correct substitution, but working out is incorrect].
OR
Correctly manipulated the formula into P=n/140, but no further correct working.
3
No Credit
Code 0: Other responses. • 70 cm.
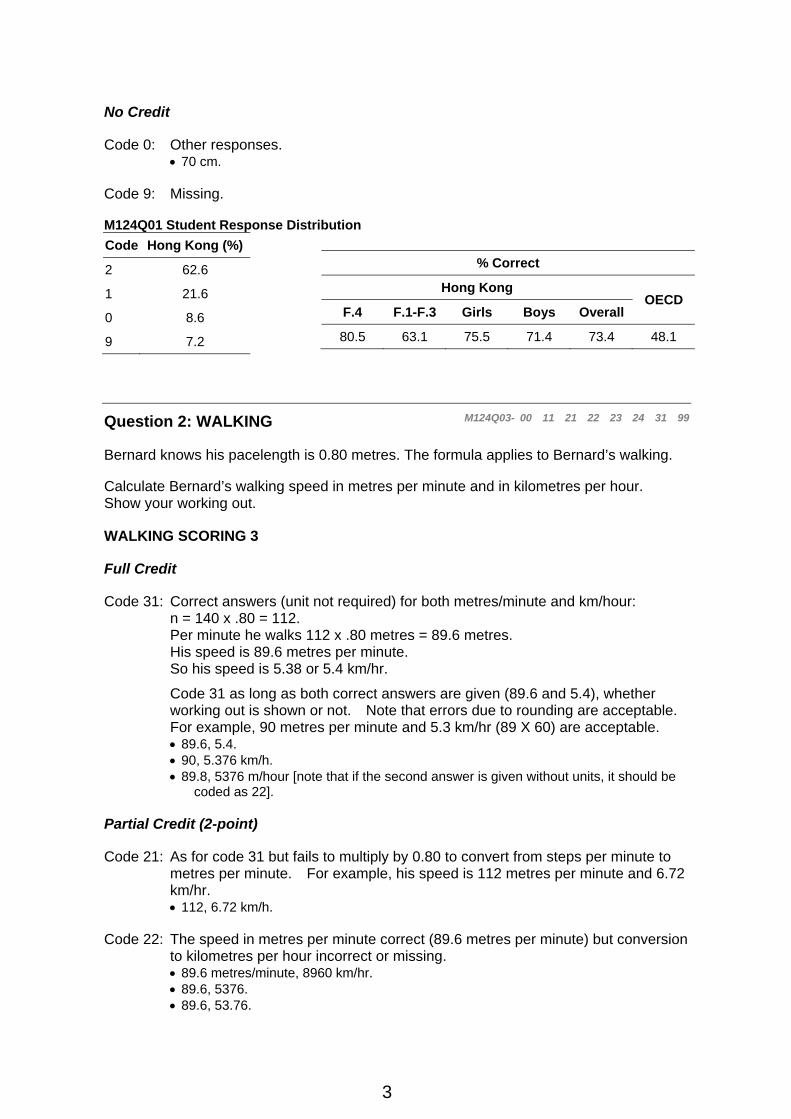
Code 9: Missing. M124Q01 Student Response Distribution Code Hong Kong (%)
2 62.6
1 21.6
0 8.6
9 7.2
Question 2: WALKING M124Q03- 00 11 21 22 23 24 31 99
Bernard knows his pacelength is 0.80 metres. The formula applies to Bernard’s walking.
Calculate Bernard’s walking speed in metres per minute and in kilometres per hour. Show your working out.
WALKING SCORING 3
Full Credit
Code 31: Correct answers (unit not required) for both metres/minute and km/hour: n = 140 x .80 = 112. Per minute he walks 112 x .80 metres = 89.6 metres. His speed is 89.6 metres per minute. So his speed is 5.38 or 5.4 km/hr.
Code 31 as long as both correct answers are given (89.6 and 5.4), whether working out is shown or not. Note that errors due to rounding are acceptable. For example, 90 metres per minute and 5.3 km/hr (89 X 60) are acceptable. • 89.6, 5.4. • 90, 5.376 km/h. • 89.8, 5376 m/hour [note that if the second answer is given without units, it should be
coded as 22].
Partial Credit (2-point)
Code 21: As for code 31 but fails to multiply by 0.80 to convert from steps per minute to metres per minute. For example, his speed is 112 metres per minute and 6.72 km/hr. • 112, 6.72 km/h.
Code 22: The speed in metres per minute correct (89.6 metres per minute) but conversion to kilometres per hour incorrect or missing. • 89.6 metres/minute, 8960 km/hr. • 89.6, 5376. • 89.6, 53.76.
% Correct
Hong Kong OECD
F.4 F.1-F.3 Girls Boys Overall
80.5 63.1 75.5 71.4 73.4 48.1
4
• 89.6, 0.087 km/h. • 89.6, 1.49 km/h.
Code 23: Correct method (explicitly shown) with minor calculation error(s) not covered by Code 21 and Code 22. No answers correct. • n=140 x .8 = 1120; 1120 x 0.8 = 896. He walks 896 m/min, 53.76km/h. • n=140 x .8 = 116; 116 x 0.8 =92.8. 92.8 m/min -> 5.57km/h.
Code 24: Only 5.4 km/hr is given, but not 89.6 metres/minute (intermediate calculations not shown). • 5.4. • 5.376 km/h. • 5376 m/h.
Partial Credit (1-point)
Code 11: n = 140 x .80 = 112. No further working out is shown or incorrect working out from this point. • 112. • n=112, 0.112 km/h. • n=112, 1120 km/h. • 112 m/min, 504 km/h.
No Credit
Code 00: Other responses.
Code 99: Missing.
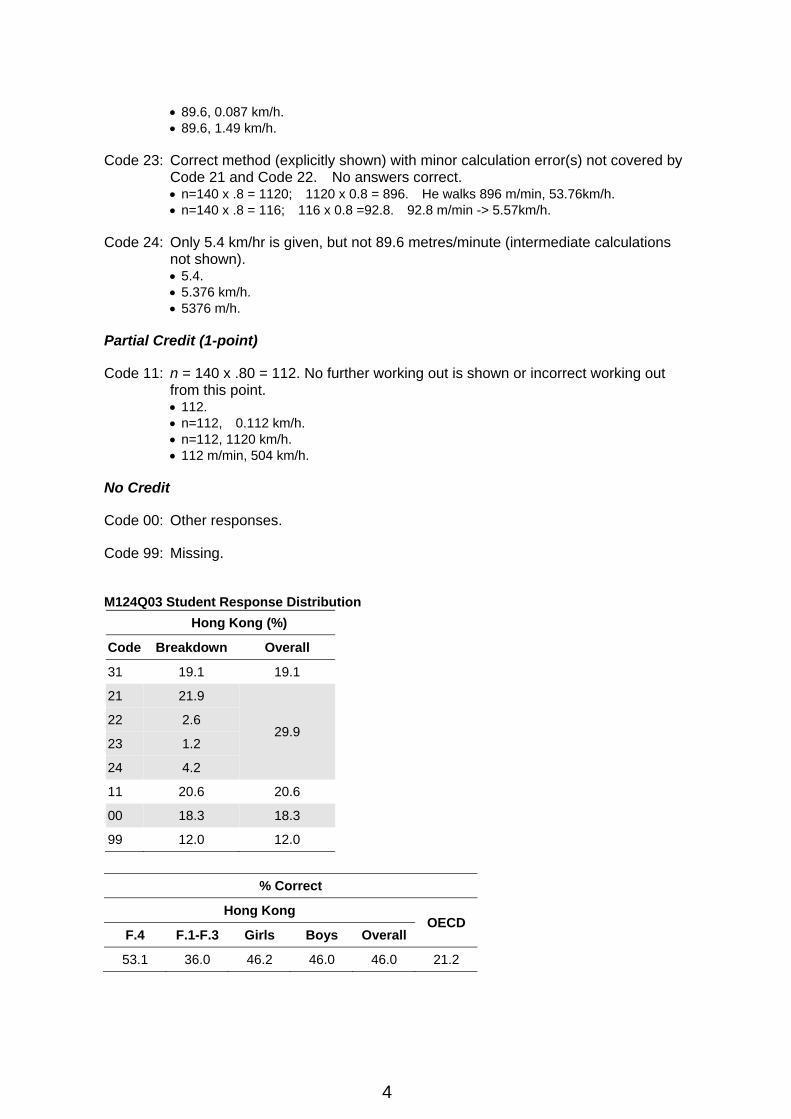
M124Q03 Student Response Distribution
Hong Kong (%)
Code Breakdown Overall
31 19.1 19.1
21 21.9
29.9 22 2.6
23 1.2
24 4.2
11 20.6 20.6
00 18.3 18.3
99 12.0 12.0
% Correct
Hong Kong OECD
F.4 F.1-F.3 Girls Boys Overall
53.1 36.0 46.2 46.0 46.0 21.2

5
CUBES Question 3: CUBES M145Q01
In this photograph you see six dice, labelled (a) to (f). For all dice there is a rule:
The total number of dots on two opposite faces of each die is always seven.
Write in each box the number of dots on the bottom face of the dice corresponding to the photograph.
(a) (b) (c)
(d) (e) (f)
CUBES SCORING 1
Full Credit
Code 1: Top row (1 5 4) Bottom Row (2 6 5). Equivalent answer shown as dice faces is also acceptable.
No Credit
Code 0: Other responses.
Code 9: Missing.
1 5 4
2 6 5
(d)
(b)
(a) (f)
(c)
(e)
6
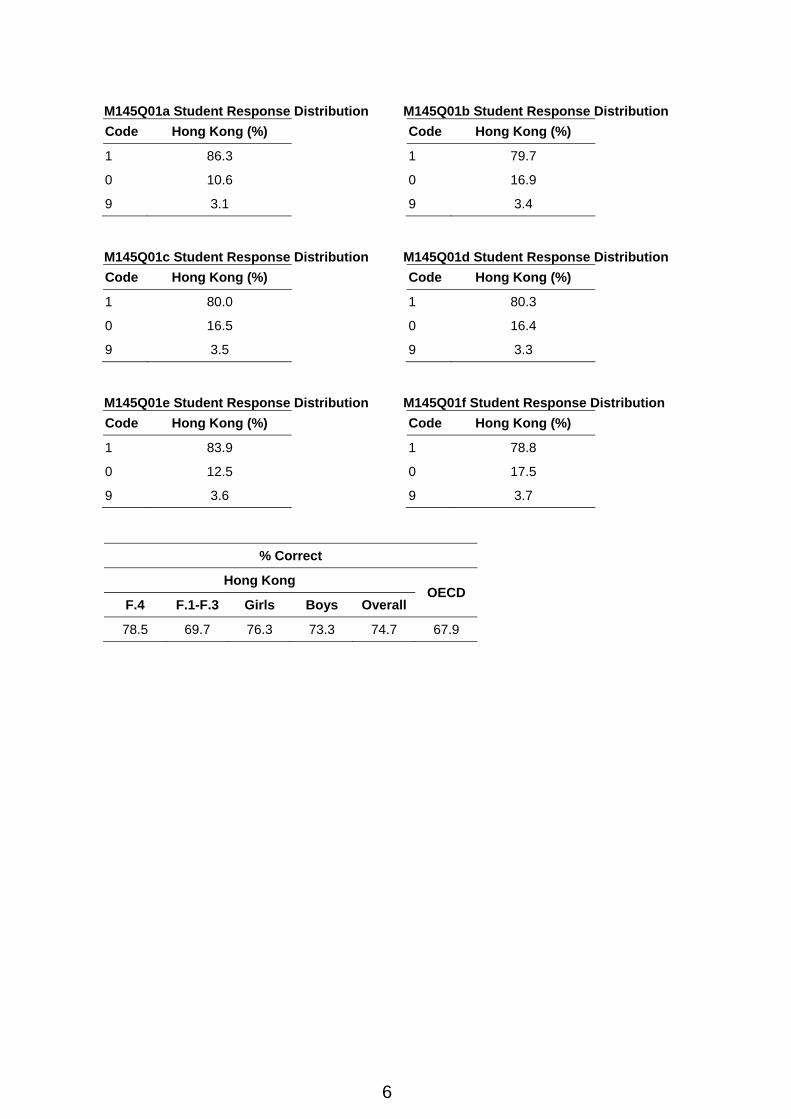
M145Q01a Student Response Distribution M145Q01b Student Response Distribution Code Hong Kong (%) Code Hong Kong (%)
1 86.3 1 79.7
0 10.6 0 16.9
9 3.1 9 3.4
M145Q01c Student Response Distribution M145Q01d Student Response Distribution Code Hong Kong (%) Code Hong Kong (%)
1 80.0 1 80.3
0 16.5 0 16.4
9 3.5 9 3.3
M145Q01e Student Response Distribution M145Q01f Student Response Distribution Code Hong Kong (%) Code Hong Kong (%)
1 83.9 1 78.8
0 12.5 0 17.5
9 3.6 9 3.7
% Correct
Hong Kong OECD
F.4 F.1-F.3 Girls Boys Overall
78.5 69.7 76.3 73.3 74.7 67.9
7
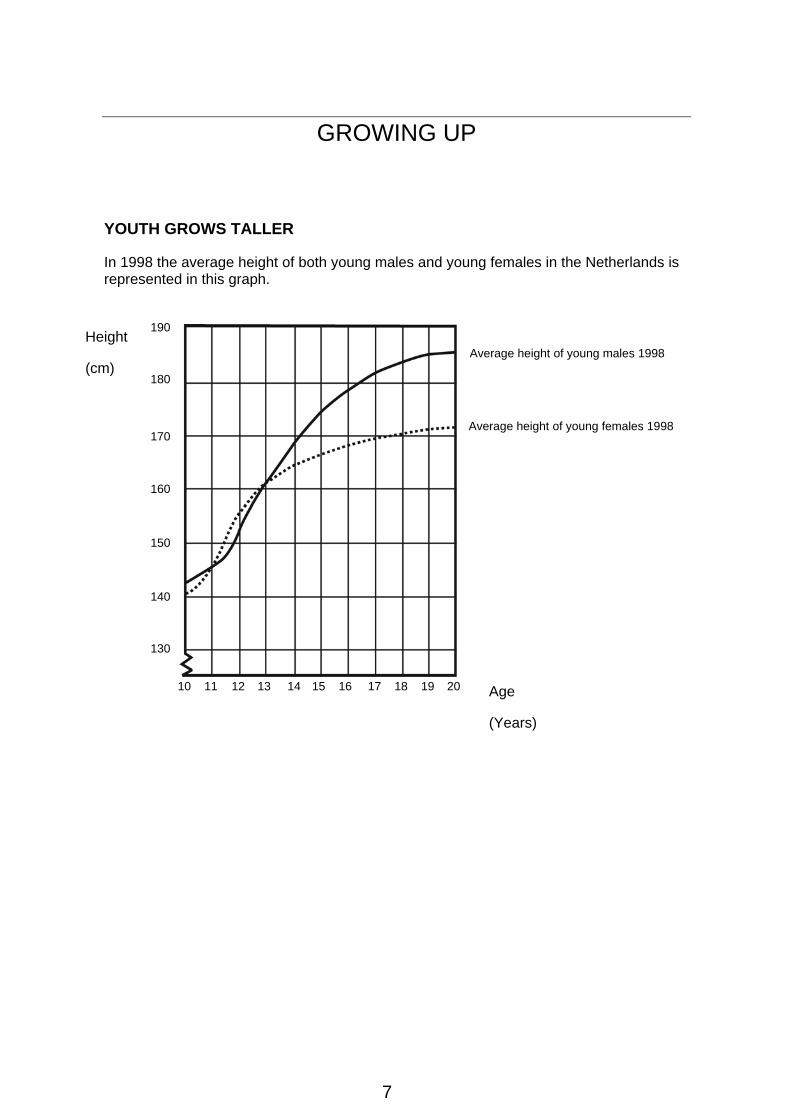
GROWING UP
YOUTH GROWS TALLER
In 1998 the average height of both young males and young females in the Netherlands is represented in this graph.
10 11 12 13 14 15 16 17 18 19 20
190
180
170
160
150
130
140
Height
(cm) Average height of young males 1998
Average height of young females 1998
Age
(Years)
8
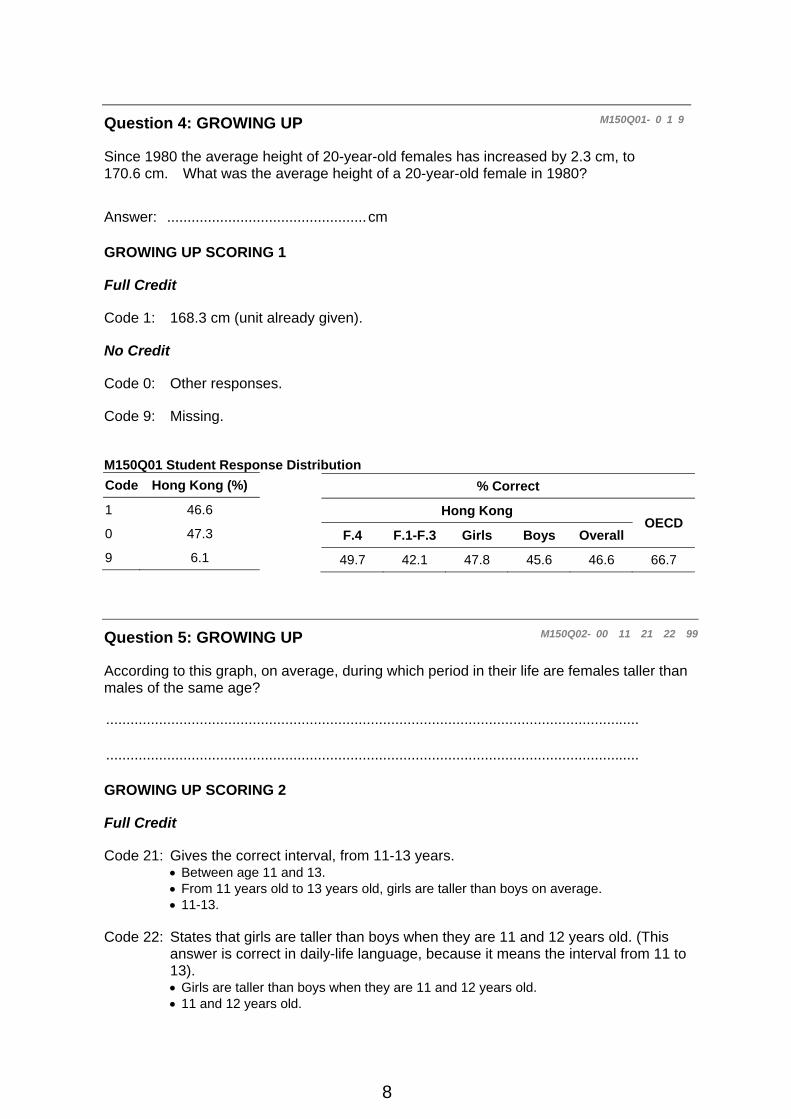
Question 4: GROWING UP M150Q01- 0 1 9
Since 1980 the average height of 20-year-old females has increased by 2.3 cm, to 170.6 cm. What was the average height of a 20-year-old female in 1980?
Answer: ................................................. cm
GROWING UP SCORING 1
Full Credit
Code 1: 168.3 cm (unit already given).
No Credit
Code 0: Other responses.
Code 9: Missing.
M150Q01 Student Response Distribution Code Hong Kong (%)
1 46.6
0 47.3
9 6.1
Question 5: GROWING UP M150Q02- 00 11 21 22 99
According to this graph, on average, during which period in their life are females taller than males of the same age?
...................................................................................................................................
...................................................................................................................................
GROWING UP SCORING 2
Full Credit
Code 21: Gives the correct interval, from 11-13 years. • Between age 11 and 13. • From 11 years old to 13 years old, girls are taller than boys on average. • 11-13.
Code 22: States that girls are taller than boys when they are 11 and 12 years old. (This answer is correct in daily-life language, because it means the interval from 11 to 13). • Girls are taller than boys when they are 11 and 12 years old. • 11 and 12 years old.
% Correct
Hong Kong OECD
F.4 F.1-F.3 Girls Boys Overall
49.7 42.1 47.8 45.6 46.6 66.7
9
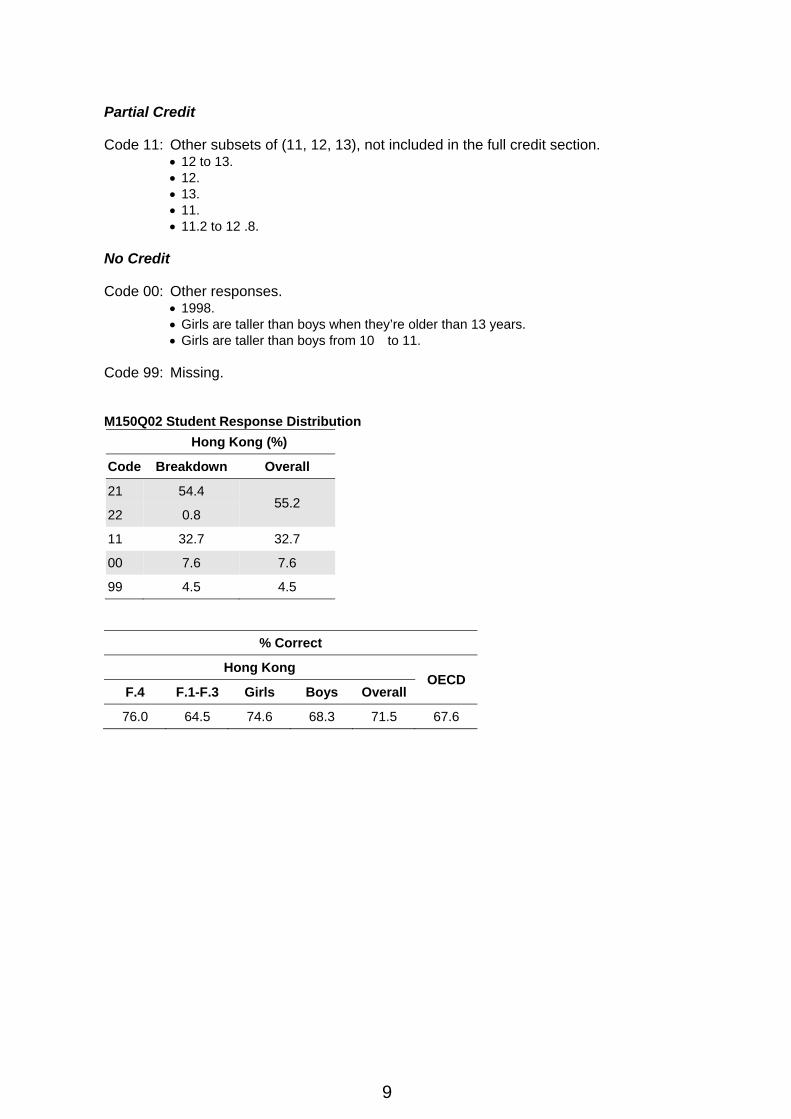
Partial Credit
Code 11: Other subsets of (11, 12, 13), not included in the full credit section. • 12 to 13. • 12. • 13. • 11. • 11.2 to 12 .8.
No Credit
Code 00: Other responses. • 1998. • Girls are taller than boys when they’re older than 13 years. • Girls are taller than boys from 10 to 11.
Code 99: Missing.
M150Q02 Student Response Distribution
Hong Kong (%)
Code Breakdown Overall
21 54.4 55.2
22 0.8
11 32.7 32.7
00 7.6 7.6
99 4.5 4.5
% Correct
Hong Kong OECD
F.4 F.1-F.3 Girls Boys Overall
76.0 64.5 74.6 68.3 71.5 67.6
10
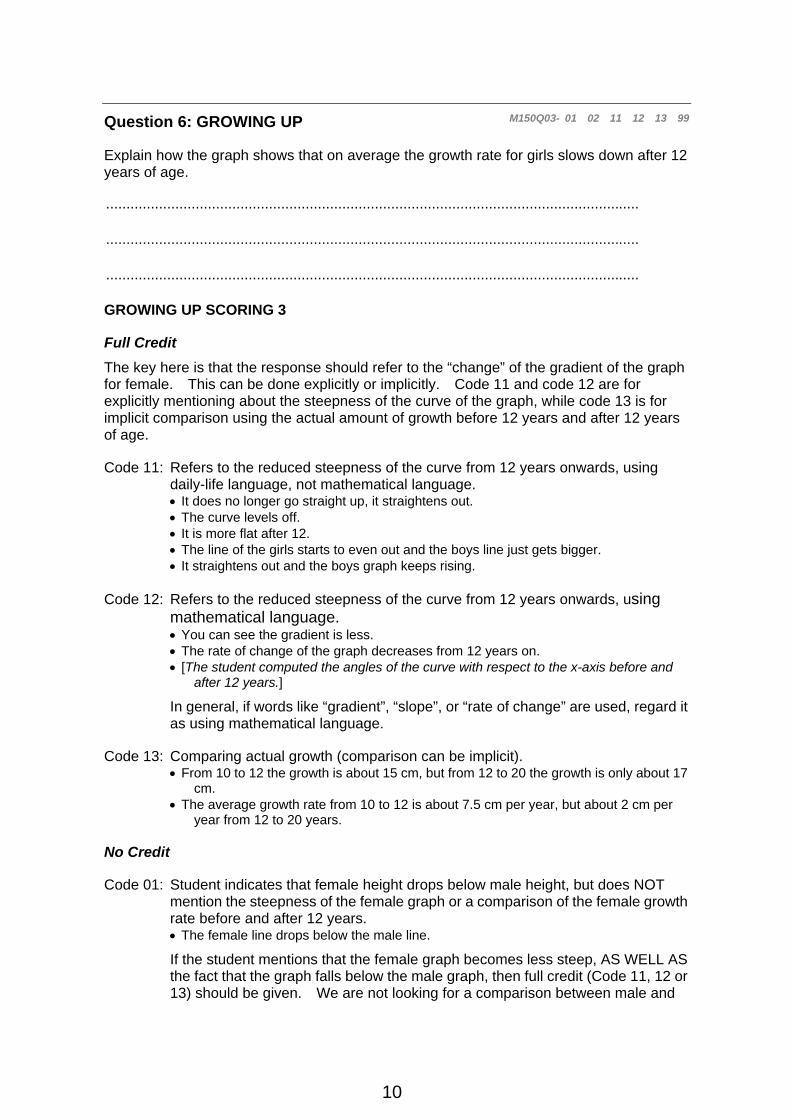
Question 6: GROWING UP M150Q03- 01 02 11 12 13 99
Explain how the graph shows that on average the growth rate for girls slows down after 12 years of age.
...................................................................................................................................
...................................................................................................................................
...................................................................................................................................
GROWING UP SCORING 3
Full Credit The key here is that the response should refer to the “change” of the gradient of the graph for female. This can be done explicitly or implicitly. Code 11 and code 12 are for explicitly mentioning about the steepness of the curve of the graph, while code 13 is for implicit comparison using the actual amount of growth before 12 years and after 12 years of age.
Code 11: Refers to the reduced steepness of the curve from 12 years onwards, using daily-life language, not mathematical language. • It does no longer go straight up, it straightens out. • The curve levels off. • It is more flat after 12. • The line of the girls starts to even out and the boys line just gets bigger. • It straightens out and the boys graph keeps rising.
Code 12: Refers to the reduced steepness of the curve from 12 years onwards, using mathematical language. • You can see the gradient is less. • The rate of change of the graph decreases from 12 years on. • [The student computed the angles of the curve with respect to the x-axis before and
after 12 years.]
In general, if words like “gradient”, “slope”, or “rate of change” are used, regard it as using mathematical language.
Code 13: Comparing actual growth (comparison can be implicit). • From 10 to 12 the growth is about 15 cm, but from 12 to 20 the growth is only about 17
cm. • The average growth rate from 10 to 12 is about 7.5 cm per year, but about 2 cm per
year from 12 to 20 years.
No Credit
Code 01: Student indicates that female height drops below male height, but does NOT mention the steepness of the female graph or a comparison of the female growth rate before and after 12 years. • The female line drops below the male line.
If the student mentions that the female graph becomes less steep, AS WELL AS the fact that the graph falls below the male graph, then full credit (Code 11, 12 or 13) should be given. We are not looking for a comparison between male and
11
female graphs here, so ignore any reference on such a comparison, and make a judgement based on the rest of the response.
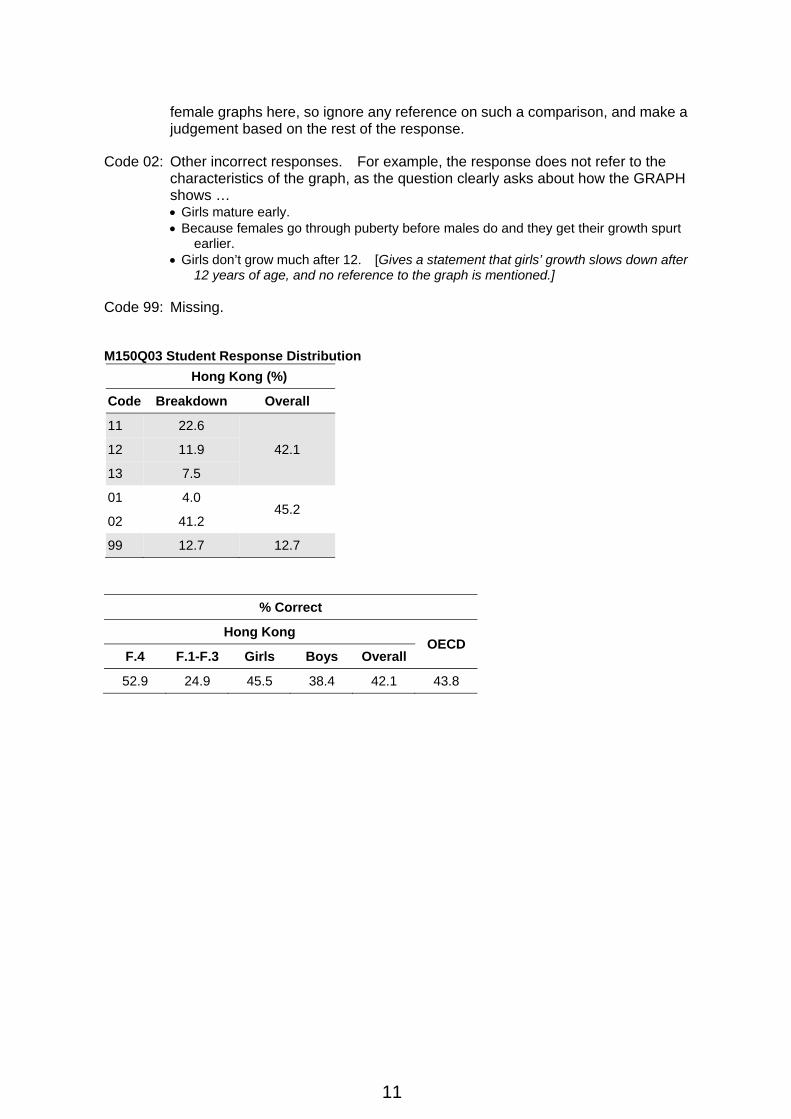
Code 02: Other incorrect responses. For example, the response does not refer to the characteristics of the graph, as the question clearly asks about how the GRAPH shows … • Girls mature early. • Because females go through puberty before males do and they get their growth spurt
earlier. • Girls don’t grow much after 12. [Gives a statement that girls’ growth slows down after
12 years of age, and no reference to the graph is mentioned.]
Code 99: Missing.
M150Q03 Student Response Distribution
Hong Kong (%)
Code Breakdown Overall
11 22.6
42.1 12 11.9
13 7.5
01 4.0 45.2
02 41.2
99 12.7 12.7
% Correct
Hong Kong OECD
F.4 F.1-F.3 Girls Boys Overall
52.9 24.9 45.5 38.4 42.1 43.8

12
ROBBERIES Question 7: ROBBERIES M179Q01- 01 02 03 04 11 12 21 22 23 99
A TV reporter showed this graph and said:
“The graph shows that there is a huge increase in the number of robberies from 1998 to 1999.”
Do you consider the reporter’s statement to be a reasonable interpretation of the graph? Give an explanation to support your answer.
ROBBERIES SCORING 1 [Note: The use of NO in these codes includes all statements indicating that the interpretation of the graph is NOT reasonable. YES includes all statements indicating that the interpretation is reasonable. Please assess whether the student’s response indicates that the interpretation of the graph is reasonable or not reasonable, and do not simply take the words “YES” or “NO” as criteria for codes.]
Full Credit
Code 21: No, not reasonable. Focuses on the fact that only a small part of the graph is shown. • Not reasonable. The entire graph should be displayed. • I don’t think it is a reasonable interpretation of the graph because if they were to show
the whole graph you would see that there is only a slight increase in robberies. • No, because he has used the top bit of the graph and if you looked at the whole graph
from 0 – 520, it wouldn’t have risen so much. • No, because the graph makes it look like there’s been a big increase but you look at
the numbers and there’s not much of an increase.
Code 22: No, not reasonable. Contains correct arguments in terms of ratio or percentage increase. • No, not reasonable. 10 is not a huge increase compared to a total of 500.
Number of robberies per year
Year 1999
Year 1998
505
510
515
520
13
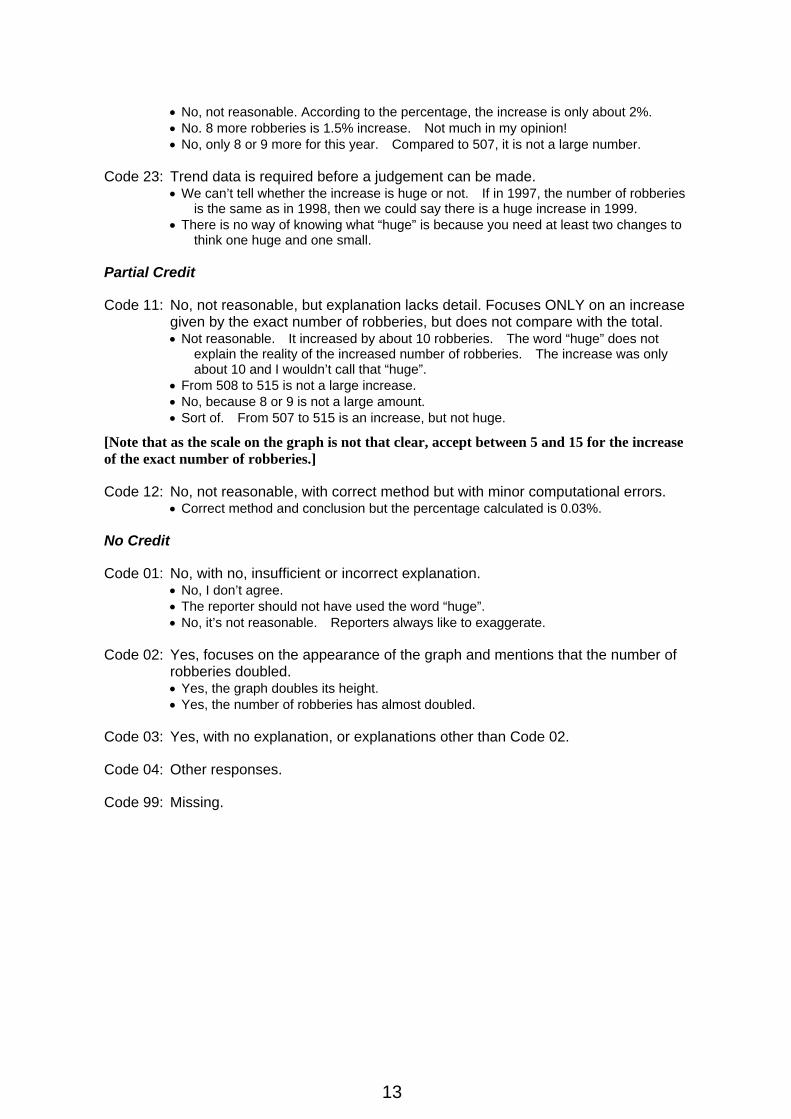
• No, not reasonable. According to the percentage, the increase is only about 2%. • No. 8 more robberies is 1.5% increase. Not much in my opinion! • No, only 8 or 9 more for this year. Compared to 507, it is not a large number.
Code 23: Trend data is required before a judgement can be made. • We can’t tell whether the increase is huge or not. If in 1997, the number of robberies
is the same as in 1998, then we could say there is a huge increase in 1999. • There is no way of knowing what “huge” is because you need at least two changes to
think one huge and one small.
Partial Credit
Code 11: No, not reasonable, but explanation lacks detail. Focuses ONLY on an increase given by the exact number of robberies, but does not compare with the total. • Not reasonable. It increased by about 10 robberies. The word “huge” does not
explain the reality of the increased number of robberies. The increase was only about 10 and I wouldn’t call that “huge”.
• From 508 to 515 is not a large increase. • No, because 8 or 9 is not a large amount. • Sort of. From 507 to 515 is an increase, but not huge.
[Note that as the scale on the graph is not that clear, accept between 5 and 15 for the increase of the exact number of robberies.]
Code 12: No, not reasonable, with correct method but with minor computational errors. • Correct method and conclusion but the percentage calculated is 0.03%.
No Credit
Code 01: No, with no, insufficient or incorrect explanation. • No, I don’t agree. • The reporter should not have used the word “huge”. • No, it’s not reasonable. Reporters always like to exaggerate.
Code 02: Yes, focuses on the appearance of the graph and mentions that the number of robberies doubled. • Yes, the graph doubles its height. • Yes, the number of robberies has almost doubled.
Code 03: Yes, with no explanation, or explanations other than Code 02.
Code 04: Other responses.
Code 99: Missing.
14
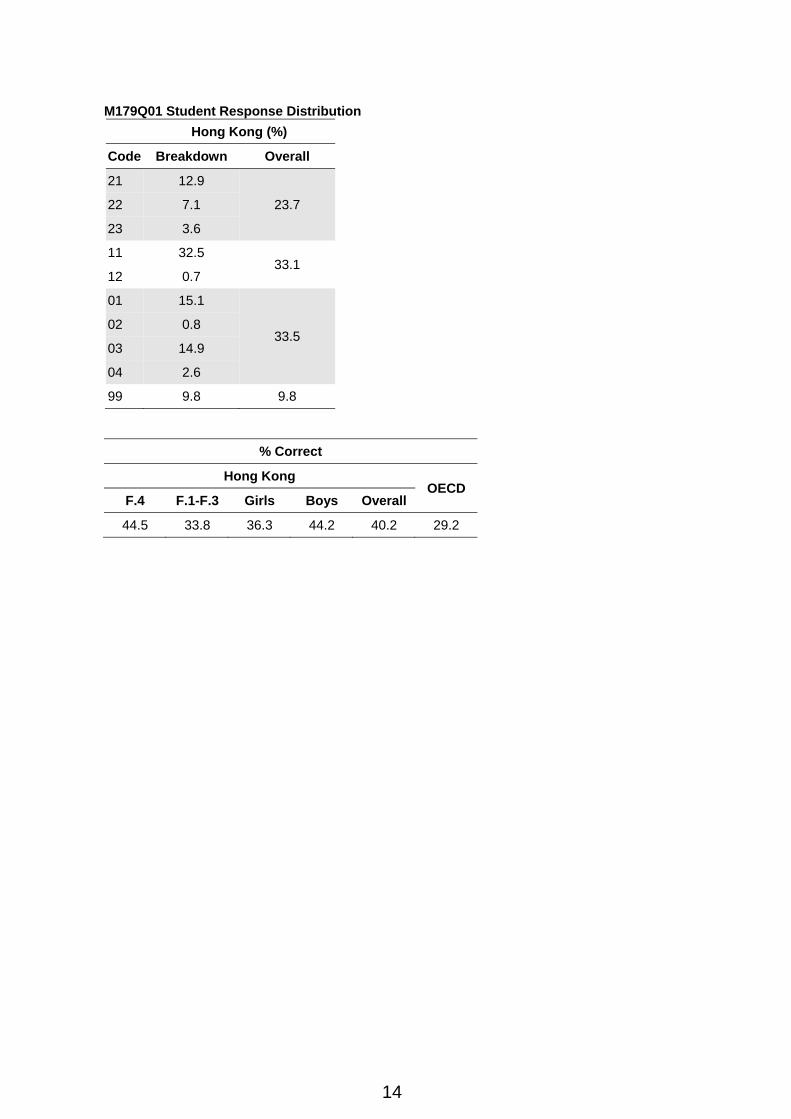
M179Q01 Student Response Distribution
Hong Kong (%)
Code Breakdown Overall
21 12.9
23.7 22 7.1
23 3.6
11 32.5 33.1
12 0.7
01 15.1
33.5 02 0.8
03 14.9
04 2.6
99 9.8 9.8
% Correct
Hong Kong OECD
F.4 F.1-F.3 Girls Boys Overall
44.5 33.8 36.3 44.2 40.2 29.2

15
CARPENTER Question 8: CARPENTER M266Q01
A carpenter has 32 metres of timber and wants to make a border around a garden bed. He is considering the following designs for the garden bed.
Circle either “Yes” or “No” for each design to indicate whether the garden bed can be made with 32 metres of timber.
Garden bed design Using this design, can the garden bed be made with 32 metres of timber?
Design A Yes / No Design B Yes / No Design C Yes / No Design D Yes / No
CARPENTER SCORING 1
Full Credit
Code 2: Exactly four correct
Design A Yes
Design B No
Design C Yes
Design D Yes
10 m
6 m
10 m
10 m 10 m
6 m
6 m 6 m

16
Partial Credit
Code 1: Exactly three correct.
No Credit
Code 0: Two or fewer correct.
Code 9: Missing.
M266Q01a Student Response Distribution M266Q01b Student Response Distribution Code Hong Kong (%) Code Hong Kong (%)
1 67.6 1 68.0
0 30.4 0 30.1
9 2.0 9 1.9
M266Q01c Student Response Distribution M266Q01d Student Response Distribution Code Hong Kong (%) Code Hong Kong (%)
1 64.9 1 81.8
0 33.0 0 16.6
9 2.1 9 1.7
% Correct
Hong Kong OECD
F.4 F.1-F.3 Girls Boys Overall
58.1 44.0 50.5 54.4 52.4 35.4
17
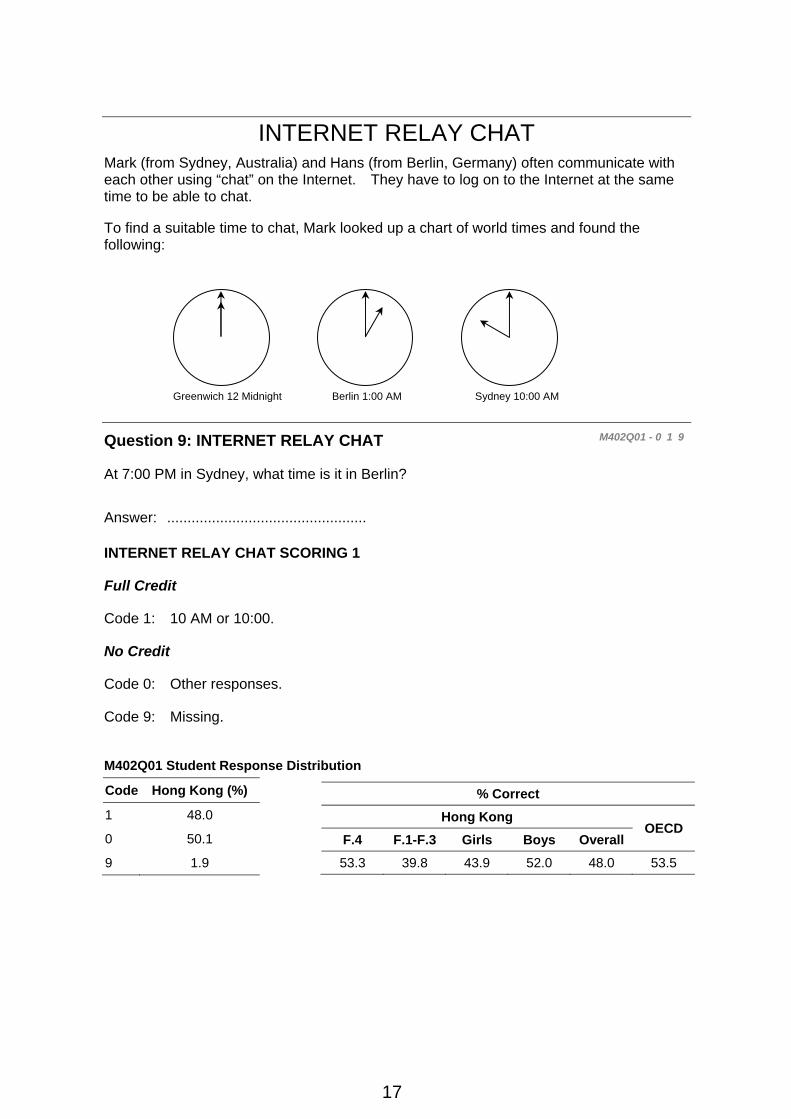
INTERNET RELAY CHAT Mark (from Sydney, Australia) and Hans (from Berlin, Germany) often communicate with each other using “chat” on the Internet. They have to log on to the Internet at the same time to be able to chat.
To find a suitable time to chat, Mark looked up a chart of world times and found the following:
Question 9: INTERNET RELAY CHAT M402Q01 - 0 1 9
At 7:00 PM in Sydney, what time is it in Berlin?
Answer: .................................................
INTERNET RELAY CHAT SCORING 1
Full Credit
Code 1: 10 AM or 10:00.
No Credit
Code 0: Other responses.
Code 9: Missing.
M402Q01 Student Response Distribution
Code Hong Kong (%)
1 48.0
0 50.1
9 1.9
% Correct Hong Kong
OECDF.4 F.1-F.3 Girls Boys Overall 53.3 39.8 43.9 52.0 48.0 53.5
Greenwich 12 Midnight Berlin 1:00 AM Sydney 10:00 AM
18
Question 10: INTERNET RELAY CHAT M402Q02 - 0 1 9
Mark and Hans are not able to chat between 9:00 AM and 4:30 PM their local time, as they have to go to school. Also, from 11:00 PM till 7:00 AM their local time they won’t be able to chat because they will be sleeping.
When would be a good time for Mark and Hans to chat? Write the local times in the table.
Place Time
Sydney
Berlin
INTERNET RELAY CHAT SCORING 2
Full Credit
Code 1: Any time or interval of time satisfying the 9 hours time difference and taken from one of these intervals:
Sydney: 4:30 PM – 6:00 PM; Berlin: 7:30 AM – 9:00 AM
OR
Sydney: 7:00 AM – 8:00 AM; Berlin: 10:00 PM – 11:00 PM • Sydney 17:00, Berlin 8:00.
NOTE: If an interval is given, the entire interval must satisfy the constraints. Also, if morning (AM) or evening (PM) is not specified, but the times could otherwise be regarded as correct, the response should be given the benefit of the doubt, and coded as correct.
No Credit
Code 0: Other responses, including one time correct, but corresponding time incorrect. • Sydney 8 am, Berlin 10 pm.
Code 9: Missing.
M402Q02 Student Response Distribution Code Hong Kong (%)
1 28.0
0 61.9
9 10.1
% Correct
Hong Kong OECD
F.4 F.1-F.3 Girls Boys Overall
33.7 19.8 26.2 30.0 28.0 28.7
19
EXCHANGE RATE Mei-Ling from Singapore was preparing to go to South Africa for 3 months as an exchange student. She needed to change some Singapore dollars (SGD) into South African rand (ZAR).
Question 11: EXCHANGE RATE M413Q01 - 0 1 9
Mei-Ling found out that the exchange rate between Singapore dollars and South African rand was:
1 SGD = 4.2 ZAR
Mei-Ling changed 3000 Singapore dollars into South African rand at this exchange rate.
How much money in South African rand did Mei-Ling get?
Answer: .................................................
EXCHANGE RATE SCORING 1
Full Credit
Code 1: 12 600 ZAR (unit not required).
No Credit
Code 0: Other responses.
Code 9: Missing.
M413Q01 Student Response Distribution
Code Hong Kong (%)
1 89.3
0 8.2
9 2.5
% Correct
Hong Kong OECD
F.4 F.1-F.3 Girls Boys Overall
92.1 85.0 90.6 88.0 89.3 80.5

20
Question 12: EXCHANGE RATE M413Q02 - 0 1 9
On returning to Singapore after 3 months, Mei-Ling had 3 900 ZAR left. She changed this back to Singapore dollars, noting that the exchange rate had changed to:
1 SGD = 4.0 ZAR
How much money in Singapore dollars did Mei-Ling get?
Answer: .................................................
EXCHANGE RATE SCORING 2
Full Credit
Code 1: 975 SGD (unit not required).
No Credit
Code 0: Other responses.
Code 9: Missing.
M413Q02 Student Response Distribution Code Hong Kong (%)
1 88.4
0 8.5
9 3.1
Question 13: EXCHANGE RATE M413Q03 - 01 02 11 99
During these 3 months the exchange rate had changed from 4.2 to 4.0 ZAR per SGD.
Was it in Mei-Ling’s favour that the exchange rate now was 4.0 ZAR instead of 4.2 ZAR, when she changed her South African rand back to Singapore dollars? Give an explanation to support your answer.
EXCHANGE RATE SCORING 3
Full Credit
Code 11: ‘Yes’, with adequate explanation. • Yes, by the lower exchange rate (for 1 SGD) Mei-Ling will get more Singapore dollars
for her South African rand. • Yes, 4.2 ZAR for one dollar would have resulted in 929 ZAR. [Note: student wrote ZAR
instead of SGD, but clearly the correct calculation and comparison have been carried out and this error can be ignored]
• Yes, because she received 4.2 ZAR for 1 SGD, and now she has to pay only 4.0 ZAR to get 1 SGD.
% Correct
Hong Kong OECD
F.4 F.1-F.3 Girls Boys Overall
91.9 82.9 89.2 87.6 88.4 74.5

21
• Yes, because it is 0.2 ZAR cheaper for every SGD. • Yes, because when you divide by 4.2 the outcome is smaller than when you divide by
4. • Yes, it was in her favour because if it didn’t go down she would have got about $50
less.
No Credit
Code 01: ‘Yes’, with no explanation or with inadequate explanation. • Yes, a lower exchange rate is better. • Yes it was in Mei-Ling’s favour, because if the ZAR goes down, then she will have
more money to exchange into SGD. • Yes it was in Mei-Ling’s favour.
Code 02: Other responses.
Code 99: Missing.
M413Q03 Student Response Distribution
% Correct
Hong Kong OECD
F.4 F.1-F.3 Girls Boys Overall
60.3 42.9 56.5 50.5 53.5 40.6
Hong Kong (%)
Code Breakdown Overall
11 53.5 53.5
01 16.2 38.4
02 22.2
99 8.1 8.1
22
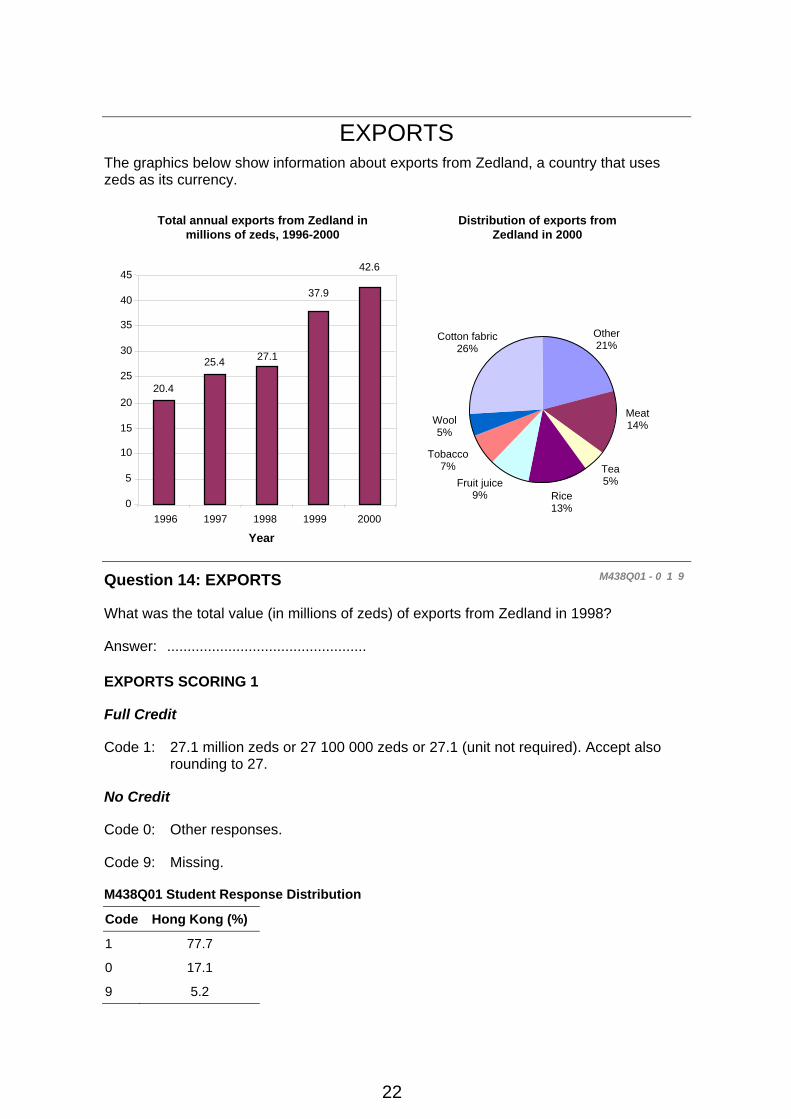
EXPORTS The graphics below show information about exports from Zedland, a country that uses zeds as its currency.
Question 14: EXPORTS M438Q01 - 0 1 9
What was the total value (in millions of zeds) of exports from Zedland in 1998?
Answer: .................................................
EXPORTS SCORING 1
Full Credit
Code 1: 27.1 million zeds or 27 100 000 zeds or 27.1 (unit not required). Accept also rounding to 27.
No Credit
Code 0: Other responses.
Code 9: Missing.
M438Q01 Student Response Distribution
Code Hong Kong (%)
1 77.7
0 17.1
9 5.2
Distribution of exports from Zedland in 2000
Total annual exports from Zedland in millions of zeds, 1996-2000
Year
Tobacco 7%
Wool 5%
Cotton fabric 26%
Fruit juice 9% Rice
13%
Tea 5%
Meat 14%
Other 21%
20.4
25.4 27.1
37.9
42.6
0
5
10
15
20
25
30
35
40
45
1996 1997 1998 1999 2000
23
Question 15: EXPORTS M438Q02
What was the value of fruit juice exported from Zedland in 2000?
A 1.8 million zeds. B 2.3 million zeds. C 2.4 million zeds. D 3.4 million zeds. E 3.8 million zeds.
EXPORTS SCORING 2
Full Credit
Code 1: E. 3.8 million zeds.
No Credit
Code 0: Other responses.
Code 9: Missing.
M438Q02 Student Response Distribution Hong Kong (%)
A 5.8%
B 4.6%
C 11.3%
D 6.0%
E 68.5%
% Correct
Hong Kong OECD
F.4 F.1-F.3 Girls Boys Overall
81.3 72.4 78.2 77.0 77.7 77.2
% Correct
Hong Kong OECD
F.4 F.1-F.3 Girls Boys Overall
75.1 59.4 68.0 69.3 68.5 47.8
24
COLOURED CANDIES Question 16: COLOURED CANDIES M467Q01
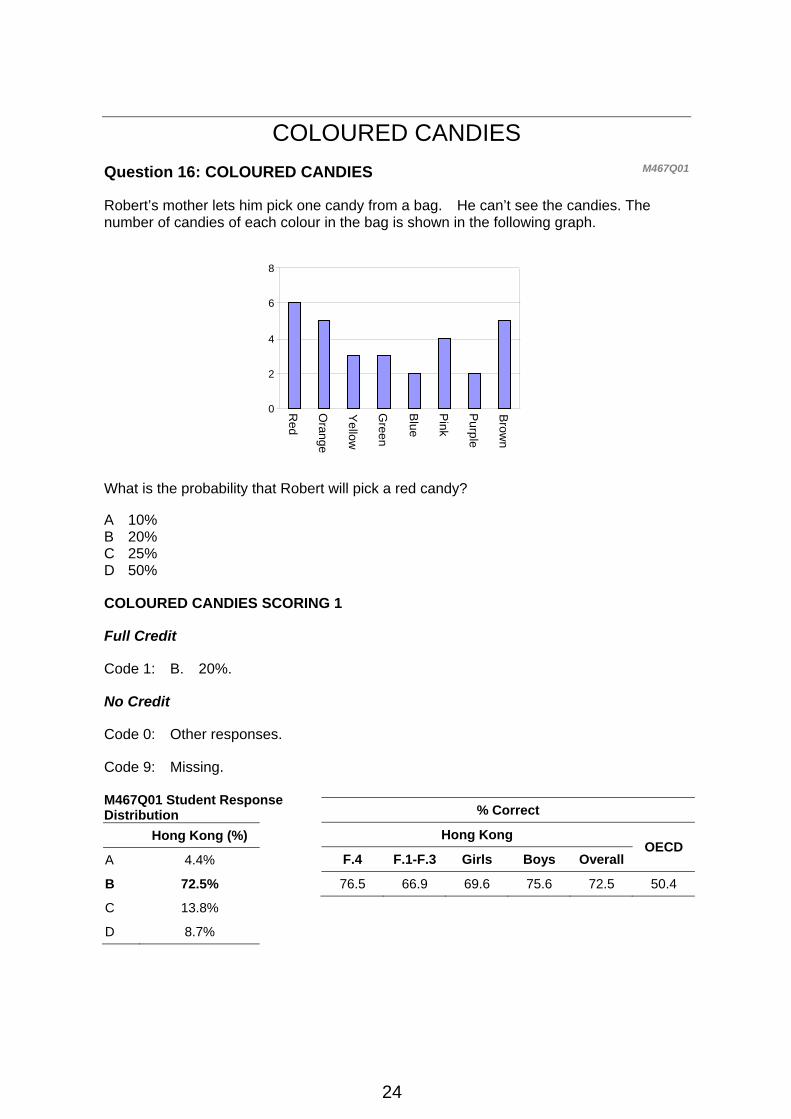
Robert’s mother lets him pick one candy from a bag. He can’t see the candies. The number of candies of each colour in the bag is shown in the following graph.
What is the probability that Robert will pick a red candy?
A 10% B 20% C 25% D 50%
COLOURED CANDIES SCORING 1
Full Credit
Code 1: B. 20%.
No Credit
Code 0: Other responses.
Code 9: Missing. M467Q01 Student Response Distribution Hong Kong (%)
A 4.4%
B 72.5%
C 13.8%
D 8.7%
% Correct
Hong Kong OECD
F.4 F.1-F.3 Girls Boys Overall
76.5 66.9 69.6 75.6 72.5 50.4
0
2
4
6
8
Red
Orange
Yellow
Green
Blue
Pink
Purple
Brow
n
25
SCIENCE TESTS Question 17: SCIENCE TESTS M468Q01
In Mei Lin’s school, her science teacher gives tests that are marked out of 100. Mei Lin has an average of 60 marks on her first four Science tests. On the fifth test she got 80 marks.
What is the average of Mei Lin’s marks in Science after all five tests?
Average: ................................................
SCIENCE TESTS SCORING 1
Full Credit
Code 1: 64.
No Credit
Code 0: Other responses.
Code 9: Missing.
M468Q01 Student Response Distribution
Code Hong Kong (%)
1 74.9
0 19.2
9 5.9
% Correct
Hong Kong OECD
F.4 F.1-F.3 Girls Boys Overall
79.2 68.5 73.7 76.3 74.9 46.1
26
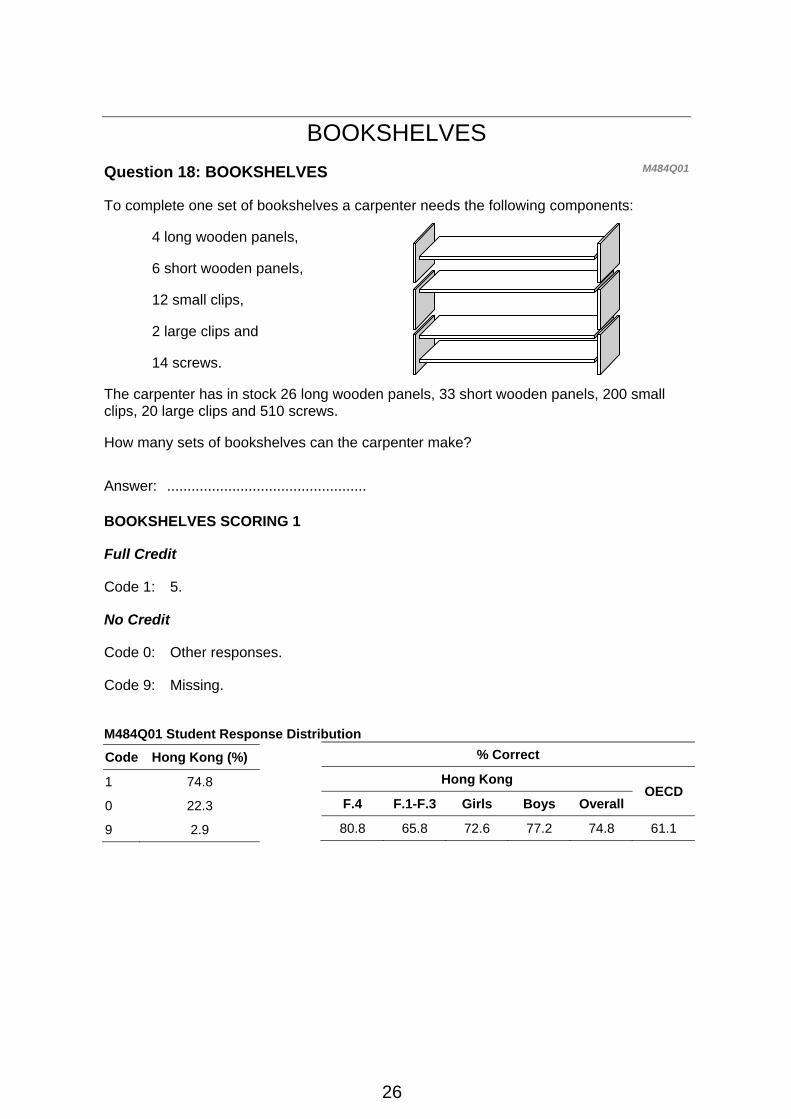
BOOKSHELVES Question 18: BOOKSHELVES M484Q01
To complete one set of bookshelves a carpenter needs the following components:
4 long wooden panels,
6 short wooden panels,
12 small clips,
2 large clips and
14 screws.
The carpenter has in stock 26 long wooden panels, 33 short wooden panels, 200 small clips, 20 large clips and 510 screws.
How many sets of bookshelves can the carpenter make?
Answer: .................................................
BOOKSHELVES SCORING 1
Full Credit
Code 1: 5.
No Credit
Code 0: Other responses.
Code 9: Missing.
M484Q01 Student Response Distribution
Code Hong Kong (%)
1 74.8
0 22.3
9 2.9
% Correct
Hong Kong OECD
F.4 F.1-F.3 Girls Boys Overall
80.8 65.8 72.6 77.2 74.8 61.1

27
LITTER Question 19: LITTER M505Q01 - 0 1 9
For a homework assignment on the environment, students collected information on the decomposition time of several types of litter that people throw away:
Type of Litter Decomposition time
Banana peel 1–3 years
Orange peel 1–3 years
Cardboard boxes 0.5 year
Chewing gum 20–25 years
Newspapers A few days
Polystyrene cups Over 100 years
A student thinks of displaying the results in a bar graph.
Give one reason why a bar graph is unsuitable for displaying these data.
LITTER SCORING 1
Full Credit
Code 1: Reason focuses on big variance in data. • The difference in the lengths of the bars of the bar graph would be too big. • If you make a bar with length 10 centimetres for polystyrene, the one for cardboard
boxes would be 0.05 centimetres.
OR
Reason focuses on the variability of the data for some categories. • The length of the bar for “polystyrene cups” is undetermined. • You cannot make one bar for 1–3 years or one bar for 20–25 years.
No Credit
Code 0: Other responses. • Because it will not work. • A pictogram is better. • You cannot verify the info. • Because the numbers in the table are only approximations.
Code 9: Missing.

28
M505Q01 Student Response Distribution
Code Hong Kong (%)
1 68.0
0 24.9
9 7.1
% Correct
Hong Kong OECD
F.4 F.1-F.3 Girls Boys Overall
72.9 61.2 70.1 66.0 68.0 51.3
29
EARTHQUAKE Question 20: EARTHQUAKE M509Q01
A documentary was broadcast about earthquakes and how often earthquakes occur. It included a discussion about the predictability of earthquakes.
A geologist stated: “In the next twenty years, the chance that an earthquake will occur in Zed City is two out of three”.
Which of the following best reflects the meaning of the geologist’s statement?
A 13.32032
=× , so between 13 and 14 years from now there will be an earthquake in Zed
City.
B 32 is more than
21 , so you can be sure there will be an earthquake in Zed City at some
time during the next 20 years. C The likelihood that there will be an earthquake in Zed City at some time during the next
20 years is higher than the likelihood of no earthquake. D You cannot tell what will happen, because nobody can be sure when an earthquake
will occur.
EARTHQUAKE SCORING 1
Full Credit
Code 1: C. The likelihood that there will be an earthquake in Zed City at some time during the next 20 years is higher than the likelihood of no earthquake.
No Credit
Code 0: Other responses.
Code 9: Missing. M509Q01 Student Response Distribution Hong Kong (%)
A 8.7%
B 9.6%
C 56.0%
D 17.8%
% Correct
Hong Kong OECD
F.4 F.1-F.3 Girls Boys Overall
60.5 49.6 53.3 59.2 56.0 45.5

30
CHOICES Question 21: CHOICES M510Q01
In a pizza restaurant, you can get a basic pizza with two toppings: cheese and tomato. You can also make up your own pizza with extra toppings. You can choose from four different extra toppings: olives, ham, mushrooms and salami.
Ross wants to order a pizza with two different extra toppings.
How many different combinations can Ross choose from?
Answer: ................................................. combinations.
CHOICES SCORING 1
Full Credit
Code 1: 6.
No Credit
Code 0: Other responses.
Code 9: Missing.
M510Q01 Student Response Distribution
Code Hong Kong (%)
1 46.5
0 51.5
9 2.0
% Correct
Hong Kong OECD
F.4 F.1-F.3 Girls Boys Overall
51.6 38.8 47.3 45.5 46.5 48.7
31
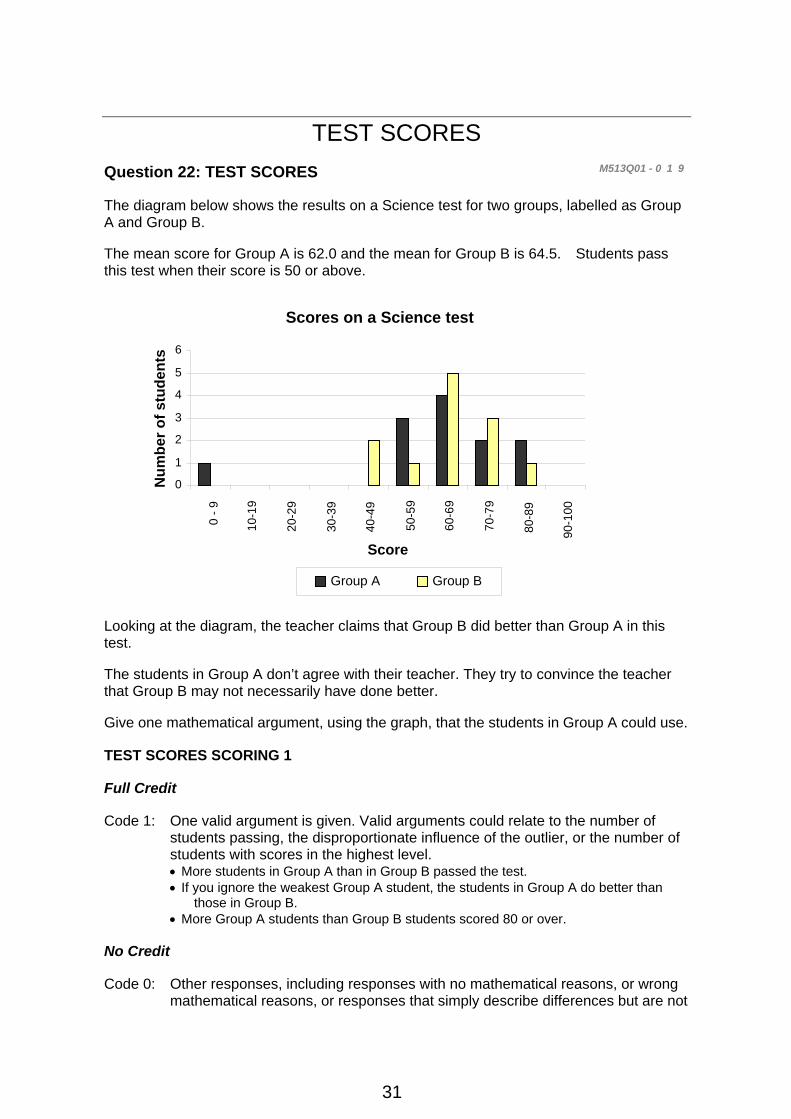
TEST SCORES Question 22: TEST SCORES M513Q01 - 0 1 9
The diagram below shows the results on a Science test for two groups, labelled as Group A and Group B.
The mean score for Group A is 62.0 and the mean for Group B is 64.5. Students pass this test when their score is 50 or above.
Looking at the diagram, the teacher claims that Group B did better than Group A in this test.
The students in Group A don’t agree with their teacher. They try to convince the teacher that Group B may not necessarily have done better.
Give one mathematical argument, using the graph, that the students in Group A could use.
TEST SCORES SCORING 1
Full Credit
Code 1: One valid argument is given. Valid arguments could relate to the number of students passing, the disproportionate influence of the outlier, or the number of students with scores in the highest level. • More students in Group A than in Group B passed the test. • If you ignore the weakest Group A student, the students in Group A do better than
those in Group B. • More Group A students than Group B students scored 80 or over.
No Credit
Code 0: Other responses, including responses with no mathematical reasons, or wrong mathematical reasons, or responses that simply describe differences but are not
Scores on a Science test
0
1
2
3
4
5
6
0 - 9
10-1
9
20-2
9
30-3
9
40-4
9
50-5
9
60-6
9
70-7
9
80-8
9
90-1
00
Score
Num
ber o
f stu
dent
s
Group A Group B
32
valid arguments that Group B may not have done better. • Group A students are normally better than Group B students in science. This test
result is just a coincidence. • Because the difference between the highest and lowest scores is smaller for Group B
than for Group A. • Group A has better score results in the 80-89 range and the 50-59 range. • Group A has a larger inter-quartile range than Group B.
Code 9: Missing.
M513Q01 Student Response Distribution
Code Hong Kong (%)
1 64.8
0 17.7
9 17.4
% Correct
Hong Kong OECD
F.4 F.1-F.3 Girls Boys Overall
71.0 56.0 64.4 65.4 64.8 32.0
33
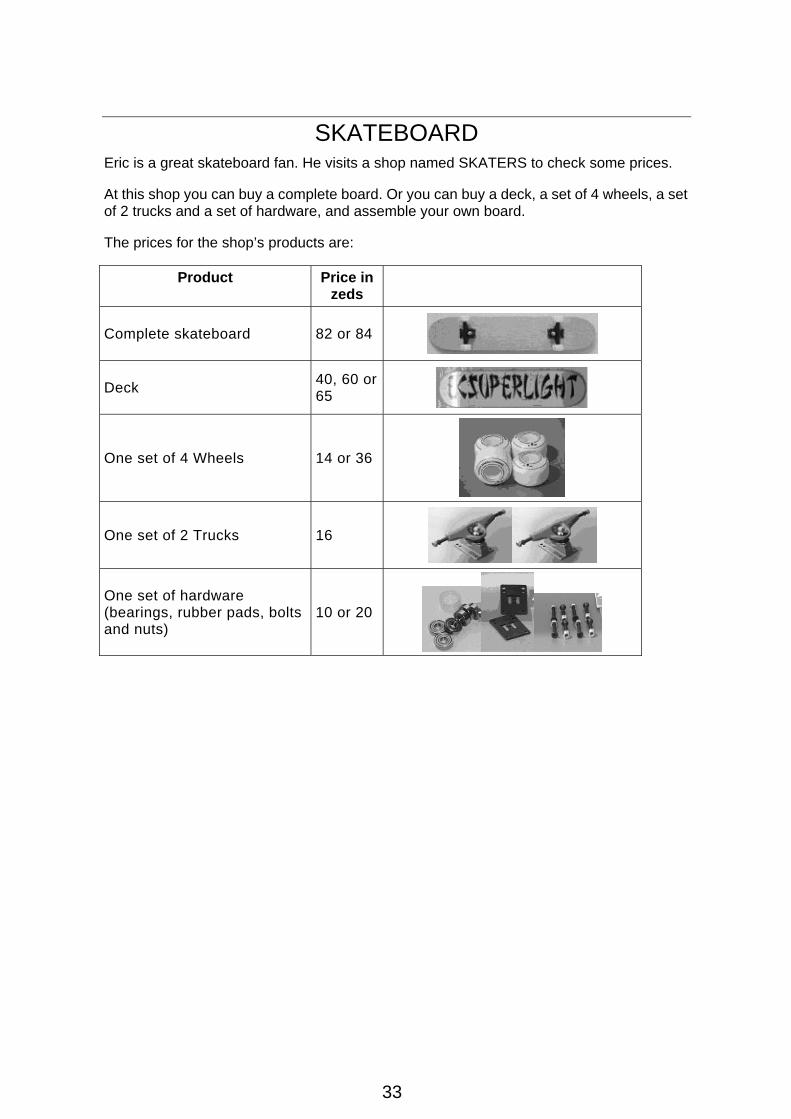
SKATEBOARD Eric is a great skateboard fan. He visits a shop named SKATERS to check some prices.
At this shop you can buy a complete board. Or you can buy a deck, a set of 4 wheels, a set of 2 trucks and a set of hardware, and assemble your own board.
The prices for the shop’s products are:
Product Price in zeds
Complete skateboard 82 or 84
Deck 40, 60 or 65
One set of 4 Wheels 14 or 36
One set of 2 Trucks 16
One set of hardware (bearings, rubber pads, bolts and nuts)
10 or 20
34
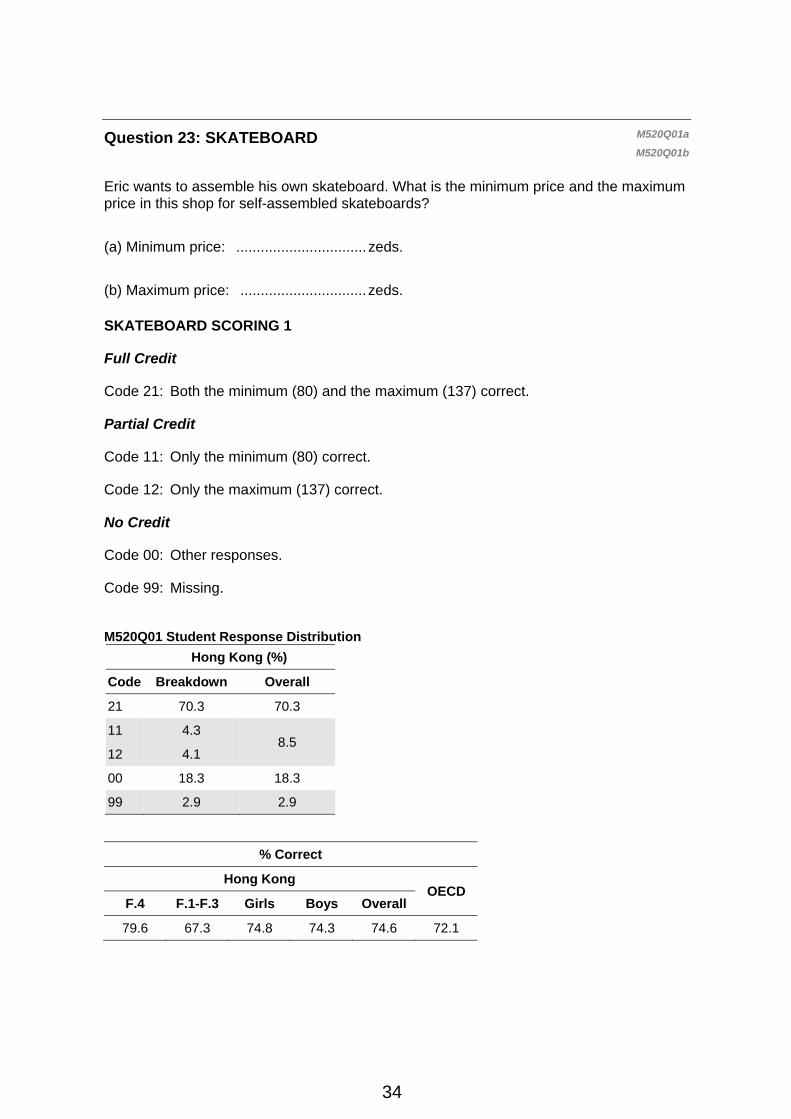
Question 23: SKATEBOARD M520Q01a M520Q01b
Eric wants to assemble his own skateboard. What is the minimum price and the maximum price in this shop for self-assembled skateboards?
(a) Minimum price: ................................ zeds.
(b) Maximum price: ............................... zeds.
SKATEBOARD SCORING 1
Full Credit
Code 21: Both the minimum (80) and the maximum (137) correct.
Partial Credit
Code 11: Only the minimum (80) correct.
Code 12: Only the maximum (137) correct.
No Credit
Code 00: Other responses.
Code 99: Missing.
M520Q01 Student Response Distribution
Hong Kong (%)
Code Breakdown Overall
21 70.3 70.3
11 4.3 8.5
12 4.1
00 18.3 18.3
99 2.9 2.9
% Correct
Hong Kong OECD
F.4 F.1-F.3 Girls Boys Overall
79.6 67.3 74.8 74.3 74.6 72.1
35
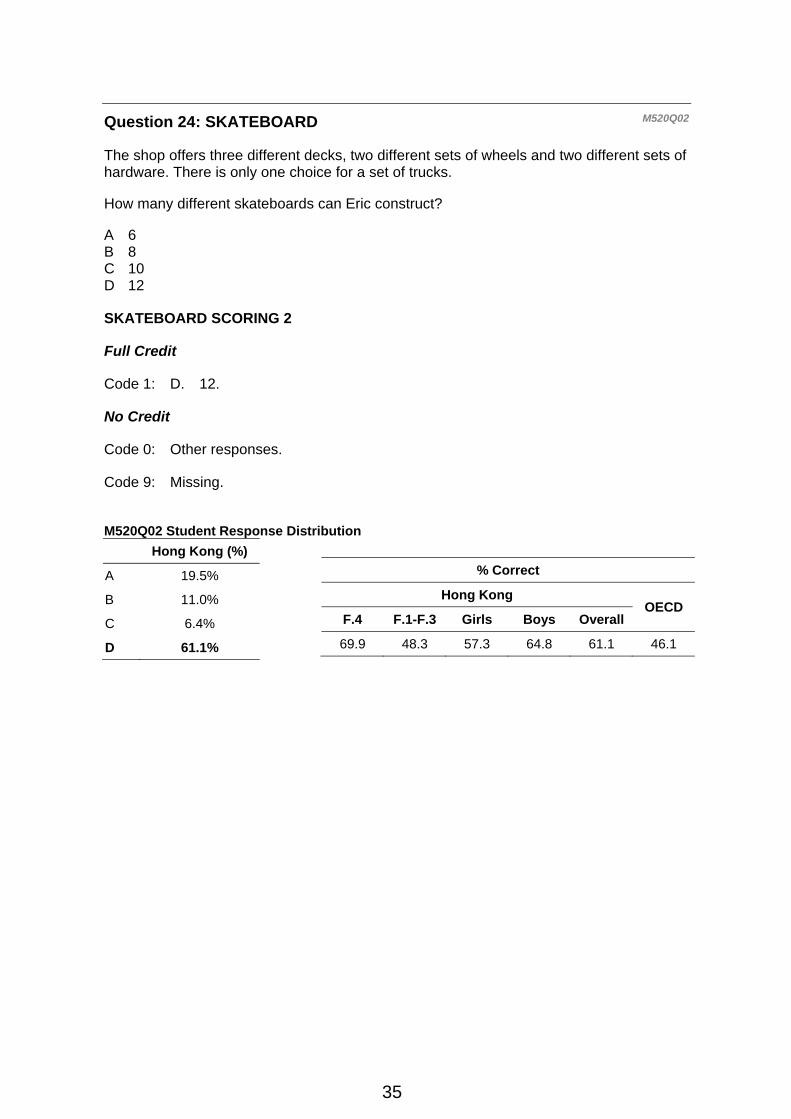
Question 24: SKATEBOARD M520Q02
The shop offers three different decks, two different sets of wheels and two different sets of hardware. There is only one choice for a set of trucks.
How many different skateboards can Eric construct?
A 6 B 8 C 10 D 12
SKATEBOARD SCORING 2
Full Credit
Code 1: D. 12.
No Credit
Code 0: Other responses.
Code 9: Missing.
M520Q02 Student Response Distribution Hong Kong (%)
A 19.5%
B 11.0%
C 6.4%
D 61.1%
% Correct
Hong Kong OECD
F.4 F.1-F.3 Girls Boys Overall
69.9 48.3 57.3 64.8 61.1 46.1
36
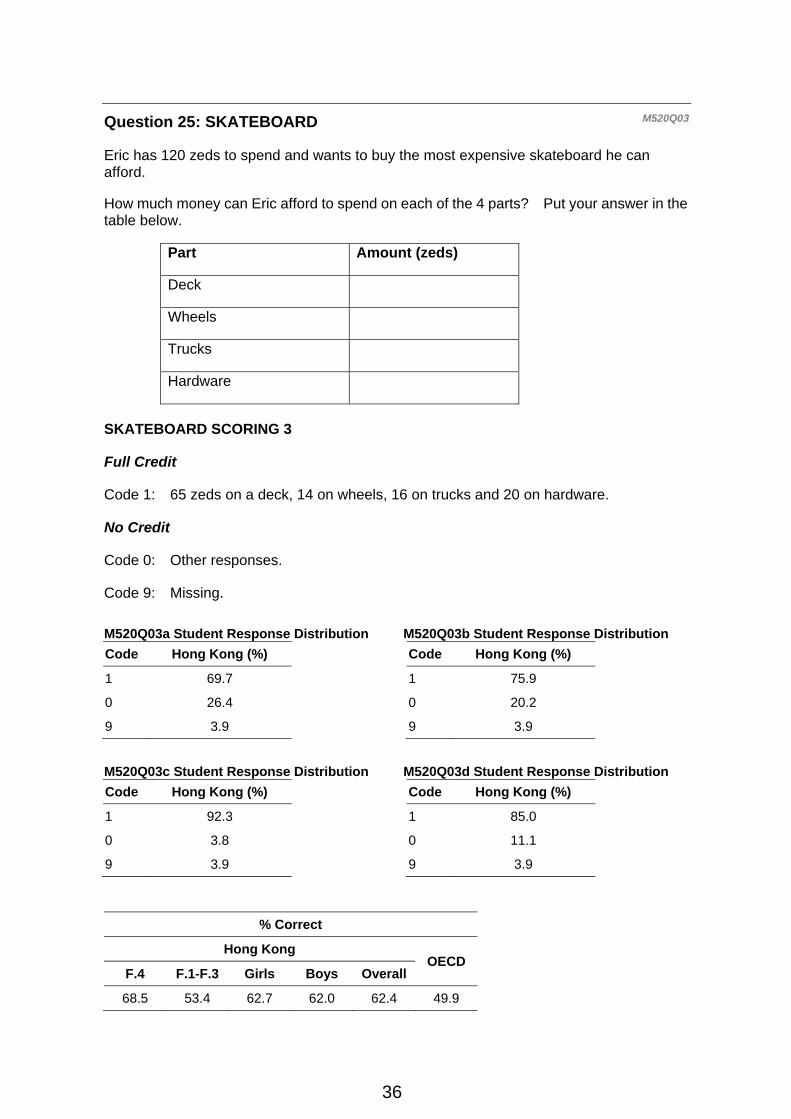
Question 25: SKATEBOARD M520Q03
Eric has 120 zeds to spend and wants to buy the most expensive skateboard he can afford.
How much money can Eric afford to spend on each of the 4 parts? Put your answer in the table below.
Part Amount (zeds)
Deck
Wheels
Trucks
Hardware
SKATEBOARD SCORING 3
Full Credit
Code 1: 65 zeds on a deck, 14 on wheels, 16 on trucks and 20 on hardware.
No Credit
Code 0: Other responses.
Code 9: Missing.
M520Q03a Student Response Distribution M520Q03b Student Response Distribution Code Hong Kong (%) Code Hong Kong (%)
1 69.7 1 75.9
0 26.4 0 20.2
9 3.9 9 3.9
M520Q03c Student Response Distribution M520Q03d Student Response Distribution Code Hong Kong (%) Code Hong Kong (%)
1 92.3 1 85.0
0 3.8 0 11.1
9 3.9 9 3.9
% Correct
Hong Kong OECD
F.4 F.1-F.3 Girls Boys Overall
68.5 53.4 62.7 62.0 62.4 49.9

37
STAIRCASE Question 26: STAIRCASE M547Q01
The diagram below illustrates a staircase with 14 steps and a total height of 252 cm:
What is the height of each of the 14 steps?
Height: ................................................... cm.
STAIRCASE SCORING 1
Full Credit
Code 1: 18.
No Credit
Code 0: Other responses.
Code 9: Missing.
M547Q01 Student Response Distribution
Code Hong Kong (%)
1 85.5
0 10.2
9 4.2
% Correct
Hong Kong OECD
F.4 F.1-F.3 Girls Boys Overall
88.2 81.7 86.1 84.8 85.5 76.4
Total height 252 cm
Total depth 400 cm

38
NUMBER CUBES Question 27: NUMBER CUBES M555Q02
On the right, there is a picture of two dice.
Dice are special number cubes for which the following rule applies:
The total number of dots on two opposite faces is always seven.
You can make a simple number cube by cutting, folding and gluing cardboard. This can be done in many ways. In the figure below you can see four cuttings that can be used to make cubes, with dots on the sides.
Which of the following shapes can be folded together to form a cube that obeys the rule that the sum of opposite faces is 7? For each shape, circle either “Yes” or “No” in the table below.
Shape Obeys the rule that the sum of opposite faces is 7?
I Yes / No
II Yes / No
III Yes / No
IV Yes / No
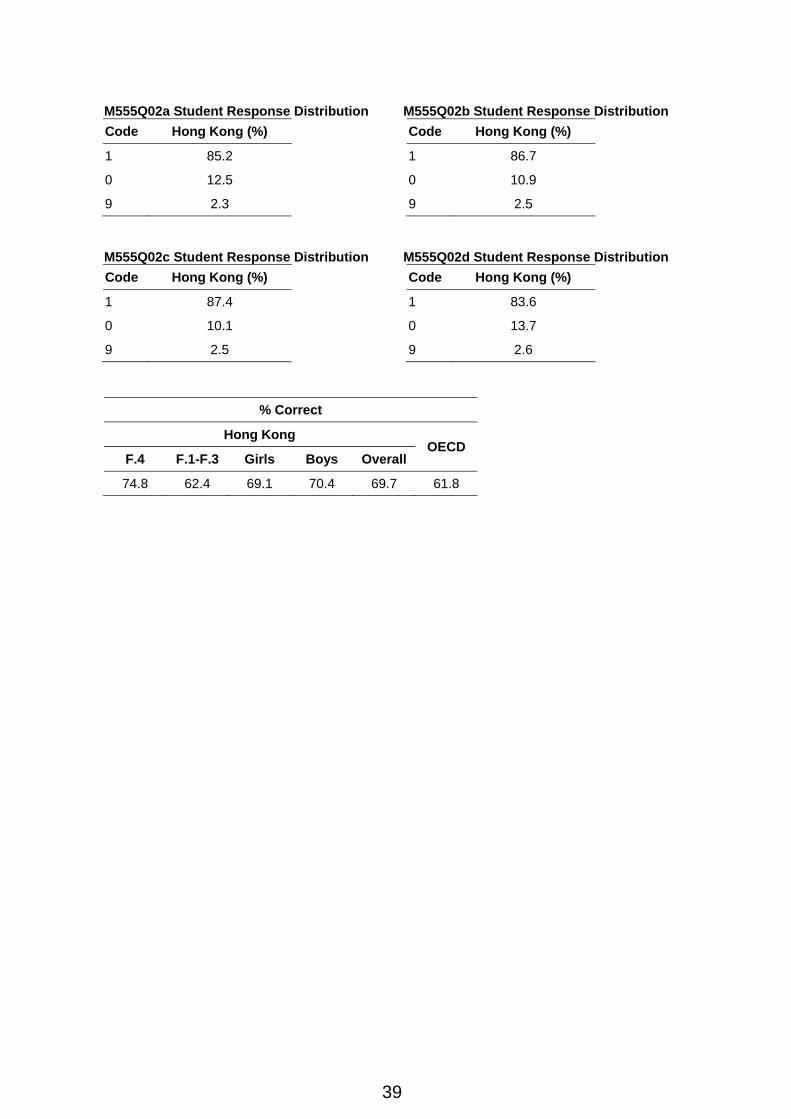
NUMBER CUBES SCORING 2
Full Credit
Code 1: No, Yes, Yes, No, in that order.
No Credit
Code 0: Other responses.
Code 9: Missing.
I II III IV
39
M555Q02a Student Response Distribution M555Q02b Student Response Distribution Code Hong Kong (%) Code Hong Kong (%)
1 85.2 1 86.7
0 12.5 0 10.9
9 2.3 9 2.5
M555Q02c Student Response Distribution M555Q02d Student Response Distribution Code Hong Kong (%) Code Hong Kong (%)
1 87.4 1 83.6
0 10.1 0 13.7
9 2.5 9 2.6
% Correct
Hong Kong OECD
F.4 F.1-F.3 Girls Boys Overall
74.8 62.4 69.1 70.4 69.7 61.8
40
SUPPORT FOR THE PRESIDENT Question 28: SUPPORT FOR THE PRESIDENT M702Q01 - 0 1 2 9
In Zedland, opinion polls were conducted to find out the level of support for the President in the forthcoming election. Four newspaper publishers did separate nationwide polls. The results for the four newspaper polls are shown below:
Newspaper 1: 36.5% (poll conducted on January 6, with a sample of 500 randomly selected citizens with voting rights)
Newspaper 2: 41.0% (poll conducted on January 20, with a sample of 500 randomly selected citizens with voting rights)
Newspaper 3: 39.0% (poll conducted on January 20, with a sample of 1000 randomly selected citizens with voting rights)
Newspaper 4: 44.5% (poll conducted on January 20, with 1000 readers phoning in to vote).
Which newspaper’s result is likely to be the best for predicting the level of support for the President if the election is held on January 25? Give two reasons to support your answer.
SUPPORT FOR THE PRESIDENT SCORING 1 Full Credit
Code 2: Newspaper 3. The poll is more recent, with larger sample size, a random selection of the sample, and only voters were asked. (Give at least two reasons). Additional information (including irrelevant or incorrect information) should be ignored. • Newspaper 3, because they have selected more citizens randomly with voting rights. • Newspaper 3 because it has asked 1000 people, randomly selected, and the date is
closer to the election date so the voters have less time to change their mind. • Newspaper 3 because they were randomly selected and they had voting rights. • Newspaper 3 because it surveyed more people closer to the date. • Newspaper 3 because the 1000 people were randomly selected.
Partial Credit
Code 1: Newspaper 3, with only one reason, or without explanation. • Newspaper 3, because the poll is closer to election date. • Newspaper 3, because more people were surveyed than newspapers 1 and 2 • Newspaper 3
No Credit
Code 0: Other responses. • Newspaper 4. More people means more accurate results, and people phoning in will
have considered their vote better.
Code 9: Missing.
41
M702Q01 Student Response Distribution Code Hong Kong (%)
2 49.4
1 3.8
0 32.6
9 14.2
% Correct
Hong Kong OECD
F.4 F.1-F.3 Girls Boys Overall
59.4 40.3 51.1 52.1 51.3 38.8
42
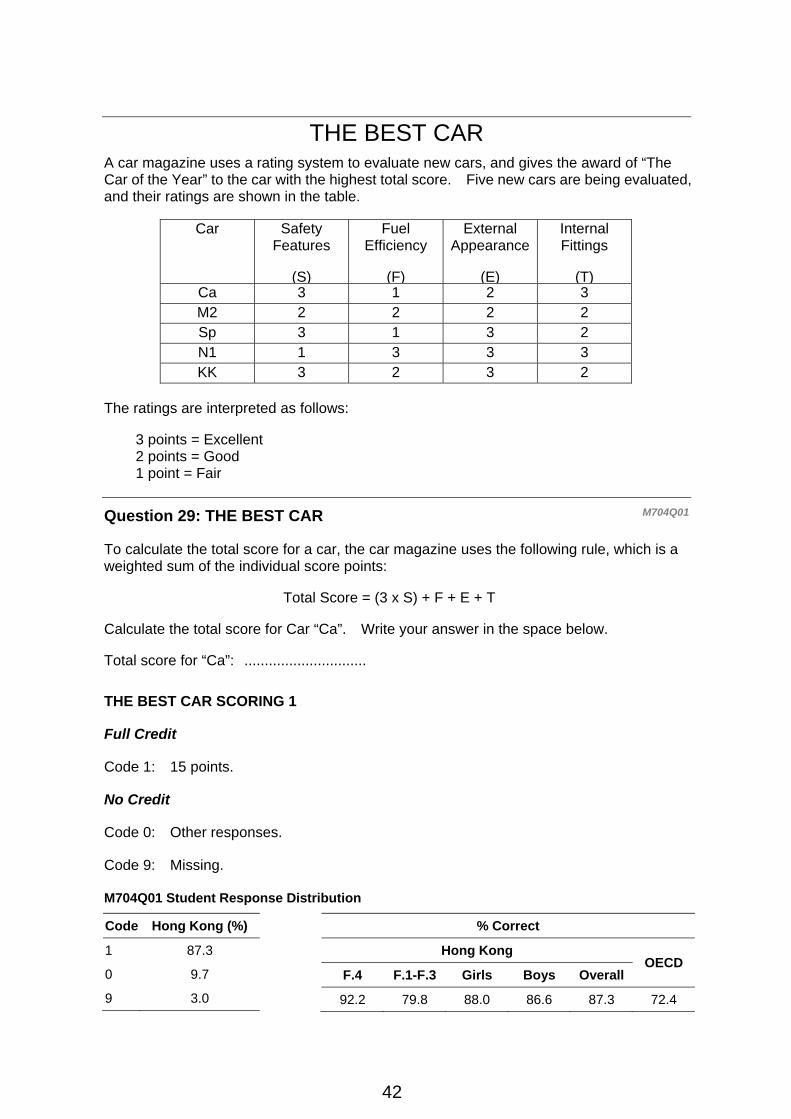
THE BEST CAR A car magazine uses a rating system to evaluate new cars, and gives the award of “The Car of the Year” to the car with the highest total score. Five new cars are being evaluated, and their ratings are shown in the table.
Car Safety Features
(S)
Fuel Efficiency
(F)
External Appearance
(E)
Internal Fittings
(T) Ca 3 1 2 3 M2 2 2 2 2 Sp 3 1 3 2 N1 1 3 3 3 KK 3 2 3 2
The ratings are interpreted as follows:
3 points = Excellent 2 points = Good 1 point = Fair
Question 29: THE BEST CAR M704Q01
To calculate the total score for a car, the car magazine uses the following rule, which is a weighted sum of the individual score points:
Total Score = (3 x S) + F + E + T
Calculate the total score for Car “Ca”. Write your answer in the space below.
Total score for “Ca”: ..............................
THE BEST CAR SCORING 1
Full Credit
Code 1: 15 points.
No Credit
Code 0: Other responses.
Code 9: Missing. M704Q01 Student Response Distribution
Code Hong Kong (%)
1 87.3
0 9.7
9 3.0
% Correct
Hong Kong OECD
F.4 F.1-F.3 Girls Boys Overall
92.2 79.8 88.0 86.6 87.3 72.4

43
Question 30: THE BEST CAR M704Q02
The manufacturer of car “Ca” thought the rule for the total score was unfair.
Write down a rule for calculating the total score so that Car “Ca” will be the winner.
Your rule should include all four of the variables, and you should write down your rule by filling in positive numbers in the four spaces in the equation below.
Total score = ………× S + ………× F + ………× E + ………× T.
THE BEST CAR SCORING 2
Full Credit
Code 1: Correct rule that will make “Ca” the winner.
No Credit
Code 0: Other responses.
Code 9: Missing.
M704Q02 Student Response Distribution
Code Hong Kong (%)
1 38.3
0 54.1
9 7.6
% Correct
Hong Kong OECD
F.4 F.1-F.3 Girls Boys Overall
47.1 25.3 34.7 42.5 38.3 25.9
44
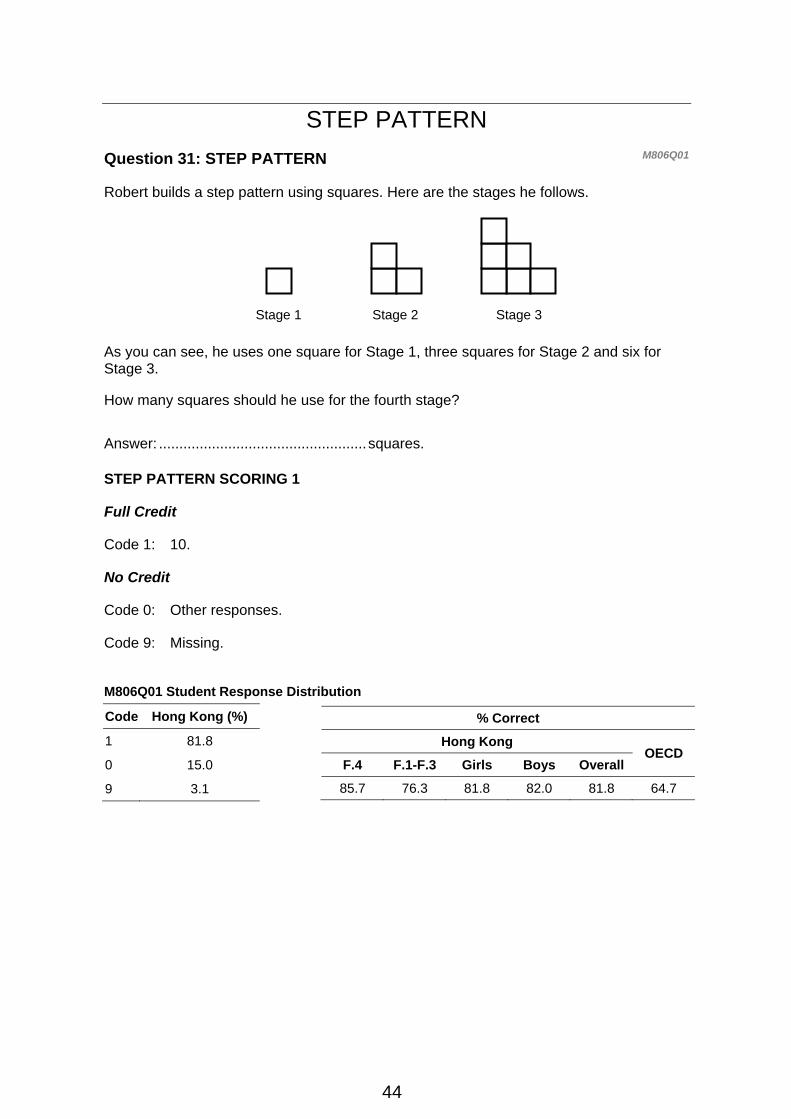
STEP PATTERN Question 31: STEP PATTERN M806Q01
Robert builds a step pattern using squares. Here are the stages he follows.
As you can see, he uses one square for Stage 1, three squares for Stage 2 and six for Stage 3.
How many squares should he use for the fourth stage?
Answer: ................................................... squares.
STEP PATTERN SCORING 1
Full Credit
Code 1: 10.
No Credit
Code 0: Other responses.
Code 9: Missing.
M806Q01 Student Response Distribution
Code Hong Kong (%)
1 81.8
0 15.0
9 3.1
% Correct
Hong Kong OECD
F.4 F.1-F.3 Girls Boys Overall
85.7 76.3 81.8 82.0 81.8 64.7
Stage 1 Stage 2 Stage 3