pitchbook a4us template - aceanalyser.comaceanalyser.com/analyst meet/132754_20090630.pdf · 2. gmr...
TRANSCRIPT

2009
Investor Presentation

2 GMR : Leading Infrastructure Player
3 Airports : Building Gateways To India
4 Power : Lighting the World
5 Urban Infrastructure & Highways : Paths To Progress
6 Strong Management Team
7Financial Highlights
India : Secular Growth In Infrastructure1
Stock Prices & Shareholding Pattern
8
Key Investment Highlights
V2 June 09

7132 20
1 2
201
150.37
76 6218 8
492
Power Roads Railways Ports Airports Total
X Plan (2002-2007) XI Plan (2007-2012)
The Indian Government has recognized Infrastructure as a key Impediment to Growth and hence encouraging Private Participation
Need to sustain the economic growthNeed to sustain the economic growth
Infrastructure spend plan targets for the XI plan were revised from 4.6% to 7.5% of GDP
Increased plan allocation for infrastructureIncreased plan allocation for infrastructure Encouraging private participationEncouraging private participation
USD bn
Source: Asian Development Outlook, 2007 ; Consultation Paper, Planning Commission, 2007; Govt of India
GDP growth
High GDP growth leads to increasing domestic consumption and higher capital expenditure
0 200 400 600
Power
Roads
Airports
Railways
Ports
Total
Others Private Sector Participation
Private Sector Participation is estimated at 29.6% of total spending in the XI plan
1

Key Investment Highlights
2 GMR : Leading Infrastructure Player
3 Airports : Building Gateways To India
4 Power : Lighting the World
5 Urban Infrastructure & Highways : Paths To Progress
6 Strong Management Team
7Financial Highlights
India : Secular Growth In Infrastructure1
Stock Prices & Shareholding Pattern
8

GMR Group: A Diversified Conglomerate
The GMR Group was established in 1976 and is a listed company on Bombay Stock Exchange (BSE) and National Stock Exchange (NSE).
GMR Group has rapidly expanded into Infrastructure and other businesses:
Airports
GMR Industries LtdSugar plant in Sankili in AP having cane crushing capacity of 5000 tonnes per dayConstructed and Commissioned Integrated Sugar complex in Haliyal having cane crushing capacity of 3,500 tonnes per day
Corporate Social Responsibility
GMR Varalakshmi FoundationThe Foundation has been working with communities in the quest of improving lives and livelihoods since 1991It focuses on Education, Health, Hygiene and Sanitation, Livelihood and Empowerment and Community Development
The Group was also engaged in the Banking (ING Vysya) & IT (iGate), which were divested with shift in focus to infrastructure.
Agro Based Business
Infrastructure
2
Energy HighwaysUrban
Infrastructure
Sports FranchiseeIPL – Delhi Daredevils
Sports Infrastructure, Development and Management – Delhi Daredevils

3,300 acres SEZ in Tamil Nadu250 acres Aviation specific SEZ on Eastern side of Hyderabad Airport250 acres Multiproduct General SEZ on Western side of Hyderabad Airport 250 acres at Delhi Airport1000 acres at Hyderabad Airport
GMR Infrastructure: Flagship company of the GMR Group
AIRPORTS
ENERGY
HIGHWAYS
URBAN INFRASTRUCTURE
Power Projects (13 Nos) Operational (3 Nos – 823 MW) Under development (10Nos-6200MW)Gross Capacity of 7023 MW
Road Projects (7 Nos: 602 km)Annuity – 255 km Toll – 347 km6 project operational
3
GMR Infrastructure Limited (GIL)
Delhi Airport Development Hyderabad Airport Development
AIRPORTS
Istanbul Airport Development
ENERGY
InterGen N.VNet Capacity – MWAssets in Operation – 7,658 MW located in UK (2,385 MW), Mexico (2,223 MW), Netherlands (820 MW) Philippines (460 MW) & Australia (1,770 MW) Assets in Construction – 428 MW Assets in Development – 2849 MW
Indi
an B
usin
esse
s
International Businesses
Infrastructure Developer, Owner & Operator

GMR Infrastructure: Indian Corporate Structure
GMR Infrastructure Limited (GIL)
ENERGY HIGHWAYS AIRPORT
GMR Tambaram-Tindivanam Expressways Private Limited (GTTEPL) - 93 KMs
GMR Tuni-Anakapalli Expressways Private Limited (GTAEPL) - 59 KMs
GMR Ambala-Chandigarh Expressways Private Limited (GACEPL) -35 KMs
GMR Jadcherla Expressways Pvt Limited (GJEPL) - 58 KMs
GMR Pochanpalli Expressways Private Limited (GPEPL) - 103 KMs
GMR Ulundurpet Expressways Private Limited (GUEPL) - 73 KMs
GMR Energy Limited (GEL) 220 MW
GMR Power Corporation Private Limited
(GPCL) 200 MW
Vemagiri Power Generation Limited (VPGL) -388.5 MW
GMR (Badrinath) Hydro Power Generation Pvt Limited (GBHP) 300 MW
GMR Kamalanga Energy Limted 1050 MW
Delhi International Airport Private Limited (DIAL)
100%
51.0%
100%
100%
100%
74.0%
100%
100%
74.0%
100%
100%
50.1%
63.0%
Operating Companies Under Development
Percentage of holding represents our Direct and Indirect Shareholding
Operating cum Development
GMR Londa Hydro Power Ltd. – 160 MW
100%
GMR Bajoli Holi Hydropower Private Limited–180MW
100%
50.1%
Sabiha Gokcen International Airport (SGIA),Instanbul, Turkey
40%
GMR Krishnagiri SEZ Limited
100%
89%
GMR Hyderabad Aerotropolis Limited (GHAPL) ##
63%
GMR Hyderabad International Airport Limited (GHIAL)
Delhi Aerotropolis Private Limited (DAPL) ##
URBAN INFRASTRUCTURE
GMR Mining and Energy Pvt Limited
GMR Aviations Private Limited (GAPL)
OTHERS
GMR Holdings Private Limited
GMR Hyderabad Aviation SEZ Limited (GHASL) ##
GMR Hyderabad Multiproduct SEZ Limited (GHMSEL) ##
63%
63%
Himtal Hydropower Company Pvt Ltd (Himtal) – 250MW
80%
GMR Energy Trading Limited
51%
GMR Upper Karnali Hydropower PublicLtd – 300MW
73.00%
The balance stake of upper karnali held 22.5% by ITD and 27% by NEA 5
GMR Infrastructure International (Isle of Man)
100%
## DAPL and GHAPL (shown under Property Development) are 100% Subsidiaries of DIAL & GHIAL respectively
GMR Chattisgarh Energy Private Ltd (1200 MW)
100%

GMR Infrastructure: International Corporate Structure
GMR Infrastructure Limited (GIL)
6
GMR Infrastructure International(Isle of Man)
100%
Ons
hore
GMR Holdings Private Limited (GHPL)
74.93%
Off
shor
e
InterGen N.V.(Netherlands)
Malta HoldCo.(Borrowing Company)
Malta HoldCo.(Bidding Company)
OCDs
50%
Potential ListCos.
100%
95%
5%
Loan Facility
100%
CCDs
GMR Energy (Global)(Isle of Man)
OCDs

GMR Infrastructure: A Compelling Investment Story
Leading Indian Infrastructure Player:Over INR 500 bn Investments planned over next five years
PPP model to play significant role in the Infrastructure sector
GMR is well positioned to benefit from this large Growth Opportunity
Entry in the MSCI India index reinforces the Company’s Credentials in Infrastructure Development
1
Broad Based Infrastructure player:- Assets PortfolioSignificant presence across high growth sectors like Airports, Power and Roads
Consistently enjoyed early mover advantage in all the Business Segments
2
Strong track record & established Player: Extensive experience of Developing and Executing projects
Established a Reputation of Reliability and Timely Project completion
3
Balanced revenue mix:Healthy mix of fixed and variable revenue streams across Airports, Power and Roads
4
Strong Management Team:Experienced Management team backed by strong Global Partnership
5
Significant Growth Opportunities:Plans to tap into new opportunities in India and Abroad in the infrastructure space
6
7

GMR Group: Partnership with Best in Class Global Players
Europe’s largest Cargo hub
Europe’s 2nd largest Passenger Airport
Operator and Manager of Malaysia’s 39 airports which comprise International, Domestic and Short Take-Off and Landing (STOL) ports
Largest Airport Retailer in Malaysia with 40 outlets in 4 airports
India’s Premier Infrastructure Finance Organization - over 332 projects financed in Power, Roads, Urban Infrastructure
One of the Worlds largest diversified Organizations with a Market Capitalization of about USD400bn
Korea’s Largest Integrated Electric utility which controls approx 88% of Koreas generating capacity
Global leader in Heavy Industries with Global presence in Shipbuilding, Offshore & Engineering, Industrial Plant & Engineering, Engine & Machinery and Construction Equipment
Malaysia's leading conglomerate in Infrastructure-Building, is a wholly-owned subsidiary of Khazanah Nasional Berhad, an Investment arm of the Government
Air
port
sPo
wer
Road
s
One of the leading Engineering and Construction companies in Turkey
8

Net Revenue EBITDA
EBITDA Margin
4
GMR Infrastructure: Key Financials for FY 09

Key Investment Highlights
2 GMR : Leading Infrastructure Player
3 Airports : Building Gateways To India
4 Power : Lighting the World
5 Urban Infrastructure & Highways : Paths To Progress
6 Strong Management Team
7Financial Highlights
India : Secular Growth In Infrastructure1
Stock Prices & Shareholding Pattern
8

Passenger Traffic: Growth in India
9

Passenger Traffic In Leading Airports of India
10
Delhi and Hyderabad Airports control 26% of Domestic & 29% of International Passenger Traffic
Domestic PAX Distribution in FY 2009 (Total PAX = 77.3 Mn)
International PAX Distribution in FY 2009 (Total PAX = 31.6 Mn)
Passenger Traffic (In Millions)

Cargo Traffic In Leading Airports of India
11
Delhi and Hyderabad Airports control 27% of Domestic & 28% of International Cargo Traffic
Domestic Cargo Distribution in FY 2009 (Total Cargo= 548 Thousand MT )
International Cargo Distribution in FY 2009(Total Cargo= 1149 Thousand MT )

Hyderabad Airport: Development of fastest growing Airport in India
Consortium PartnersConsortium Partners
12
Sponsor Shareholding
63.0%
11.0%
13.0%
13.0%
India’s First
PPP Green Field AirportOperationalized
on23rd of March 2008
Phase I
Development Highlights
Project OverviewProject Overview
Project Features
Concession Period of 30+30 years from 2008 to 2038
Land Available 5,500 acres
Concession fee 4% of revenue (deferred till 11th year)
Project Cost (Phase 1) USD 608 Mn (INR 29.20 Bn)
Means of Finance (In INR Bn) Equity :3.78; Debt:21.20; Grant: 1.07; Interest Free loan : 3.15
Air Side Facilitiesa) One of the longest Runways (4,260 m) with parallel Taxiwayb) 42 Aircraft parking stands
•30 Remote stands •12 Aerobridge facility c) 5 Cargo Parking Stands
Land Side facilitiesa) 146 Check-in counters ( self check-in – 16)b) 46 Immigration countersc) 3 nos. of 90 meter & 1 no. 70 meter Baggage carouselsd) Car Park facility (3700 cars)
Development to be done in 4 Phases
Proposed Capacities Phase I Phase IV
PAX (in Mn ) 12 40
Cargo (Metric Tonnes) 1,00,000 3,50,000
Number of Runways 1 2
Passenger Terminal Building Area
1.17 Mn Sq.ft 3.9 Mn Sq.ft
Master Planners Consortium comprising of Cowi of Norway, Avia Plan of Denmark & Stup of Mumbai
Airside and Landside Works Contractor
Larsen & Toubro
Airport Service Quality Rating (ASQ) given by Airports Council International (ACI)
Rating of 4.40 (scale 1 to 5) in service standards

Hyderabad Airport: Commercial Arrangements and Developments
Aeronautical OperationsAeronautical Operations Non-Aeronautical OperationsNon-Aeronautical Operations
UDF Development Fees (UDF)
Profile ChargesCommencement
Date
Domestic Passengers
Rs 375 (inclusive of all Taxes) per Departing Domestic Passenger
23rd August 2008
International Passengers
Rs 1000 (inclusive of all Taxes) per Departing International Passenger
23rd April 2008
Area Partner
Cargo operation JV with Menzies plc, UK
In-flight kitchens LSG Sky Chefs & Sky Gourmet
Fuel farm operator Reliance industries Ltd
Fuel farm suppliers Reliance, IOCL, BPCL, HPCL & Shell
Ground Handling Menzies Aviation & Bobba, Air India & SATs
Duty-free retail Nuance 2525 sq.mt.)
MRO JV with Malaysia Airlines
Airport advertisement Laqshya
F&B HMS Host
Lounge management Plaza Premium Lounge (3Nos)
Hospitals Apollo Hospitals (17 Beds)
Car Parking Tenaga Car parking of Malaysia
Telecom Services Tata Teleservices
Book Stores Landmark and Odyssey
Forex Counters Weizmann and Travelex
Health Health & Glow & Dabur
Airport Authority of India (AAI) Prescribed Charges
•
Passenger Service Fees (PSF)
•
Landing Charges
•
Parking Charges
•
X-Ray Baggage Charges
•
Housing Charges
13

Hyderabad Airport: Surface Connectivity
Airport Roads Connectivity
Airport Location: 25 km / 19 miles from Begumpet
The major access points to the new airport include:
a) Four-lane National Highway NH-7 with service lanes (on its west)
b)Four-lane Srisailam State Highway (on its east)
c) Proposed eight-lane 24.38 km access controlled Outer Ring Road
(ORR)
d) Widening of 52-km Inner Ring Road with many flyovers with six lanes
Four-lane 11.6 km long P V Narasimha Rao Elevated Expressway
e) Multiple traffic management initiatives to decongest city roads
f) Alternate four-lane road P7 to decongest Srisailam Highway
g)Other alternate modes being worked out with State government
include: Multi-Modal Transportation System (MMTS)
Mono Rail Transport System (MRTS)
h) Proposed Dedicated Airport Train from city to Airport 40 km stretch
to be covered in around 25 minutes
Airport Commuting Facilities
a) 700 Radio taxis with GPS Vehicle tracking system & 100
executive cars
b) 28 brand new custom designed buses service with Passenger
friendly amenities as part of Aero Express bus service
14
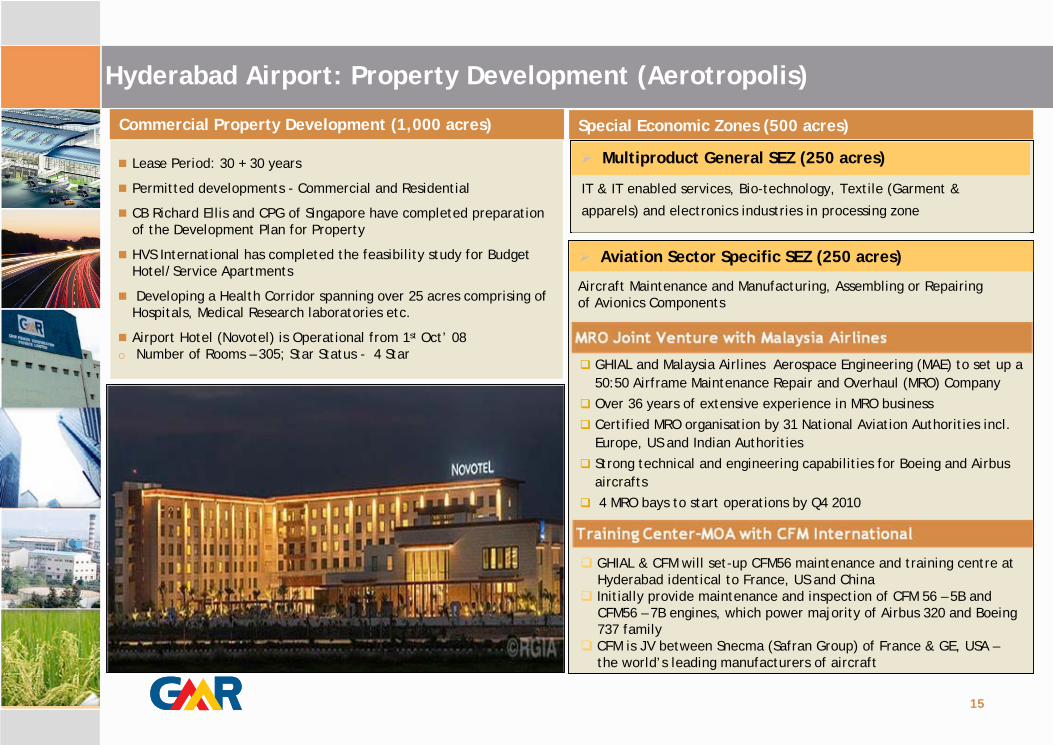
IT & IT enabled services, Bio-technology, Textile (Garment &
apparels) and electronics industries in processing zone
Lease Period: 30 + 30 years
Permitted developments - Commercial and Residential
CB Richard Ellis and CPG of Singapore have completed preparationof the Development Plan for Property
HVS International has completed the feasibility study for BudgetHotel/Service Apartments
Developing a Health Corridor spanning over 25 acres comprising of Hospitals, Medical Research laboratories etc.
Airport Hotel (Novotel) is Operational from 1st Oct’ 08o Number of Rooms – 305; Star Status - 4 Star
Commercial Property Development (1,000 acres)
Hyderabad Airport: Property Development (Aerotropolis)
GHIAL and Malaysia Airlines Aerospace Engineering (MAE) to set up a 50:50 Airframe Maintenance Repair and Overhaul (MRO) CompanyOver 36 years of extensive experience in MRO business
Certified MRO organisation by 31 National Aviation Authorities incl. Europe, US and Indian Authorities
Strong technical and engineering capabilities for Boeing and Airbus aircrafts4 MRO bays to start operations by Q4 2010
GHIAL & CFM will set-up CFM56 maintenance and training centre at Hyderabad identical to France, US and ChinaInitially provide maintenance and inspection of CFM 56 – 5B and CFM56 – 7B engines, which power majority of Airbus 320 and Boeing 737 familyCFM is JV between Snecma (Safran Group) of France & GE, USA –the world’s leading manufacturers of aircraft
Special Economic Zones (500 acres)
Multiproduct General SEZ (250 acres)
Aviation Sector Specific SEZ (250 acres)
Aircraft Maintenance and Manufacturing, Assembling or Repairing of Avionics Components
15

Hyderabad Airport: Glimpses
16

Hyderabad Airport: Business Development Initiatives
Currently:12 Foreign Airlines ( British Airways, Lufthansa, KLM, Singapore Airlines,
Thai Airways, Malaysia Airlines, Emirates, Gulf Air, Qatar Airways, etc.)
10 Domestic Airlines (Air India, Jet Airways, Kingfisher Airlines, Indigo, Spicejet, etc.)
Expected:Etihad Airways to start operations from June’09
In dialogue with China Eastern, Delta Airlines, Tiger Airways, Turkish Airlines, Kenyan Airlines, Iran Airlines
Planned:Initiated dialogues with NACIL, Jet Airways and Kingfisher Airlines to
create a hub in Hyderabad
GHIAL is one of the first Airports in South and South East Asia to be certified as ISO 27001 (Information Security Management System) complaint
Established “Internal Passenger Satisfaction Feedback” system through touch screen KIOSK to understand and analyze the passenger satisfaction levels
Introduced Web-based Suggestion Scheme
Enrolled to participate in ACI-ASQ Customer Satisfaction Benchmarking Program
Initiated Scientific Problem Solving methodology to address the process improvement and cost rationalization issues
Airlines OperationsAirlines Operations Quality InitiativesQuality Initiatives
17
Plan to set up a world class centre for perishable cargo
Animal Quarantine for movement of Laboratory animals, Pets and live stocks has been setup effective April 2009
Recent DevelopmentsRecent Developments
Airline Operations
British Airways started operations from 7th Dec’ 08Air Arabia started operations from 26th Oct’08
Recent RecognitionsRecent Recognitions
GHIAL won the Leadership in Energy and Environmental Design (LEED) “silver rating” by US Green Building (US GBC) and becomes the first airport in Asia and the third Airport globallyto have been recognized by this award
Passenger Terminal Building of GHIAL won the Outstanding Concrete Structure award 2008 of Andhra Pradesh by Indian Concrete Institute
Recognition from ORBIS for Airport Related CSR Activities

The Passenger Traffic has grown at a CAGR of 23% over the past 5 years.
For the period ended FY 09, the Composition of Domestic to International Passengers has been 75:25.
The Cargo Traffic has grown at a CAGR of 15% over the past 5 years
For the period ended FY 09, the Composition of Domestic to International Cargo has been 45:55.
The Air Traffic Movements have grown at a CAGR of 24% over the past 5 Years.
For the period ended FY 09, the Composition of Domestic to International ATMs has been 85:15.
Aircraft Movements (In Thousands)Aircraft Movements (In Thousands) Cargo Tonnage (In Thousand Tonnes)Cargo Tonnage (In Thousand Tonnes)
Total Passengers (In Millions)Total Passengers (In Millions)
32% Growth
41% Growth
35% Growth
19% Growth -2.4% Growth
27% Growth
42% Growth
43% Growth
21% Growth -11% Growth
Hyderabad Airport: Historical Growth Pattern
26% Growth6% Growth
28% Growth14% Growth 6% Growth
18
ATM PerformanceATM PerformanceTotal Passengers (in Thousands)Total Passengers (in Thousands)
Cargo Tonnage (inTonnes) Cargo Tonnage (inTonnes)
Hyderabad Airport: Operational Performance (12M: FY 09)
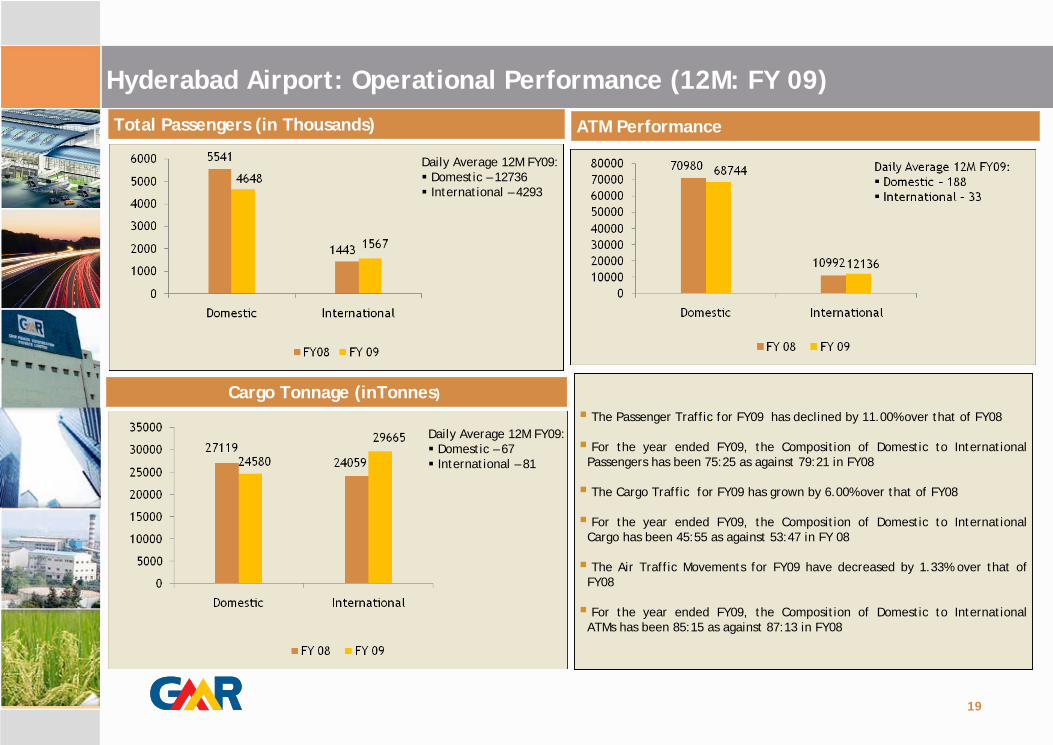
The Passenger Traffic for FY09 has declined by 11.00% over that of FY08
For the year ended FY09, the Composition of Domestic to International Passengers has been 75:25 as against 79:21 in FY08
The Cargo Traffic for FY09 has grown by 6.00% over that of FY08
For the year ended FY09, the Composition of Domestic to International Cargo has been 45:55 as against 53:47 in FY 08
The Air Traffic Movements for FY09 have decreased by 1.33% over that of FY08
For the year ended FY09, the Composition of Domestic to International ATMs has been 85:15 as against 87:13 in FY08
19
Daily Average 12M FY09:Domestic – 12736 International – 4293
Daily Average 12M FY09:Domestic – 67International – 81

Total Passengers (in Thousands)Total Passengers (in Thousands) ATMs PerformanceATMs Performance
Cargo Tonnage (InTonnes) Cargo Tonnage (InTonnes)The Passenger Traffic for FY09 Q4 has declined by 0.68% over that of FY09 Q3,
as compared to a 2.13% decrease in FY09 Q3 over that of FY09 Q2
For the period ended FY09 Q4, the Composition of Domestic to International Passengers has been 75:25 as against 73:27 in FY09 Q3 and 74:26 in FY09 Q2
The Cargo Traffic for FY09 Q4 has declined by 5.2% over that of FY09 Q3, as compared to a 4% decline in FY09 Q3 over that of FY09 Q2
For the period ended FY09 Q4, the Composition of Domestic to International Cargo has been 46:54 as against 45:55 in FY09 Q3 and FY09 Q2
The Air Traffic Movements for FY09 Q4 has decreased by 2.20% over that of FY09 Q3, as compared to a 3.85% increase in FY09 Q3 over that of FY09 Q2
For the period ended FY 09 Q3, the Composition of Domestic to International ATMs has been 84:16 as against 83:17 in FY 09 Q3 and 85:15 in FY09 Q2
Hyderabad Airport: Quarterly Operational Performance (Q4: FY 09)
20

INR mn FY09
Gross Revenues 3,860
Aeronautical Revenues 2,058
Non-Aeronautical Revenues 1,802
Less: Annual Fee to AAI 163
Net Revenues 3,697
Operating Expenses 2,266
EBIDTA 1,431
Other Income 36
Interest and Finance Charges 1,536
Depreciation 1,122
PBT (1,191)
PAT (1,210)
Cash Profits (88)
Gross Revenue (Quarterly)
1,0111,077
EBIDTA (Quarterly)
Hyderabad Airport: Financial Performance
21
In Rs millions
1,041

Delhi Airport: Modernization and Development of Premier Airports in India
Consortium PartnersConsortium Partners
Sponsor Shareholding
54.0%
10.0%
10.0%
26.0%
Financing Plan (Phase I)Financing Plan (Phase I)
Source Contribution ($ Mn)
Contribution (INR Mn)
Equity including internal accruals (*)
260 12,500
Development Fees 381 18,270
Interest Free Deposits 190 9,120
Loan from FIs/Banks 1,039 49,860
Total Estimated Project Cost 1,870 89,750
22
ModernizationOf
Existing Terminals (T1 & T2)Completed
In December 2008
ConstructionOf
Greenfield Terminal(T3)To be Completed
ByMarch 2010 Project Overview
Concession period of 30+30 years from 2006 to 2036Revenue Share 45.99 % shared with AAILand 5,100 acres
Estimaited Project Cost (Phase I)
USD 1,870 Mn (INR 89.75 Bn)
Development to be done in 5 PhasesProposed Capacities Phase1 Phase VCompletion Date 2010 2035Pax capacity 46 Mn 100 Mn Cargo capacity 0.5 Mn tons 3.6 Mn tons Runways 2 4Passenger Terminal Building Area 5.5 Mn Sq.ft 17.2 Mn Sq.ft
Design Engineers Mott McDonald Third Runway & Terminal 3 L&T Owners Engineers
TCE, Lahmeyer and Parsons Brinckerhoff
Development Highlights
* - Additional equity brought in by shareholders Rs 12500 Mn towards the project GMR acquired 3.9% stake from IDF
and issued fresh 13 mn shares of GIL in June 09

New Terminal with handling capacity of 10 Mn pax
• Area of 350,000 sq. ft.
• 72 Check in counters
• 16 Security Channels
• In line Baggage screening
Delhi Airport: Construction of Phase 1A Finalized Landside Facilities
T 2 Terminal Refurbishment
Refurbishment of International Terminal with increase in annual capacity from 5 mn pax to 8 mn pax
3-level In-line baggage screening and Handling system Increase in length of 4 Baggage Reclaim beltsEntry gates increased from 4 to 8Check in counters increase from 78 to 100Check in Concourse expansion from 4,500 sqm to 6,500 sqm No of X-ray units increase from 8 to 15Emigration counters increase from 28 to 52Immigration Counters increase from 28 to 48 Security Channels increase from 10 to 228 new In-line Baggage Screening Systems
Airside Facilities
3rd Runway of 4,430 meters and New Rapid Exit Taxiways commissioned and operational
Fire stations, New Crash Fire Tenders & associate infrastructure
New Airside Cleaning Equipments, Automated Grass cutting and Improved Lighting and Signage
23
• Capacity expansion to 8 Mn pax
Terminal T 1
Domestic Departure Terminal (A & D)
New Departure TerminalInaugurated on 26th February 2009
Commenced Operations
Domestic Arrival Terminal (C)
100% Complete and Operational
Terminal T 2 Refurbishment
100% Complete and Operational

All Major Procurement Contracts AwardedTotal Manpower at Site- DIAL & Project Management Contractor : 360- Subcontractor: 25,000 at present
Capital Work in Progress (T3 Terminal)Capital Work in Progress (T3 Terminal)
Financial Arrangement Financial Arrangement
24
DIAL working on aggressive Commissioning Schedule DIAL working on aggressive Commissioning Schedule
Airport Capacity Time
Changi Airport 22 Million 76 Months
Heathrow T5 25 Million 60 Months
Beijing Airport T3 45 Million 60 Months
IGI Airport T3 34 Million 37 Months
The Financial Closure document was signed on 7th Dec ‘07Rupee Term Loan of Rs.3650 Crores from 10 Domestic Banks
- Tenure – 17 years Door-to-door
- PLR Linked Interest Rate (Currently 10.0%-10.5%) with a reset
clause of every 3 years.
Foreign Currency Loan of USD 350 Million from 8 Banks
- Tenure – 13 years Door-to-door
- Interest Rate: Libor + 185 bps
Total Capital Expenditure till 31st March ‘09 is Rs.6,200 Crores Rupee Loan Disbursed: Rs.3,111 Crores with Debt to Equity ratio of
1.25:1 at all times
Shareholders Funds infused comprising of Equity Rs. 1200 crores,
Advance against Lease Deposits – Rs 1250 crores
Key Features Phase 1B Development ( Completion by Mar 2010) Key Features Phase 1B Development ( Completion by Mar 2010)
Airside Facilities
75 Aerobridges
48 Contact Stands
20 remote parking bays
General Aviation facilities
Landside Facilities
168 Nos Check in Counters
14 Nos In-line Baggage Reclaim belts.
Terminal Building T3 of 5.2 million sq. ft with annual capacity of
34 Million
90 Walklators, 47 Escalators, 70 Lifts & 200 Washrooms
Multi-level Car Parking, Taxi Staging & Bus Parking – 4,300 lots
Lounge Area of 10.000 sq. m.
High Speed Rail Link – DMRC
Expansion/Up gradation of Utilities (Sewerage, Power, Water)
Delhi Airport: Construction Status of Terminal T3 (Phase 1B)
Particulars FY 09 Q2 FY 09 Q3
Main Passenger Terminal Building 51% 62.31%
Integrated Terminal Piers Civil works
55% 65.20%
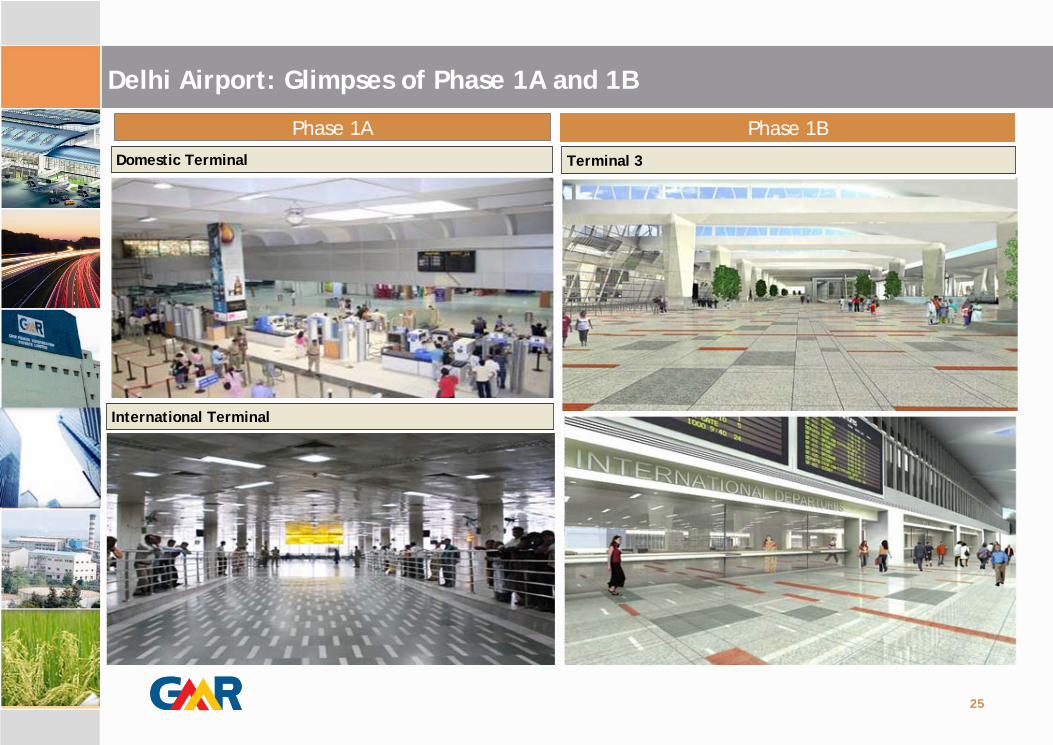
Delhi Airport: Glimpses of Phase 1A and 1B
Domestic TerminalDomestic Terminal
International TerminalInternational Terminal
25
Phase 1A Phase 1B
Terminal 3Terminal 3

Delhi Airport: Master plan for World Class Passenger Terminal by 2010, well- in-time for Commonwealth Games
Phase I Master Plan1 Phase I Master Plan1
Efficient planning to minimize impact on existing operations
26
*Figure not to scale
New Integrated Terminal (T3) by 2010
Land Bank of 250 acres
New Runway (3)
4,430 Mts
Existing Domestic Terminal (T1)
Existing International Terminal Building
Metro RailDeveloper – DMRC Operator – RelianceNo. of Stations – 6
1. New Delhi Railway Station2. Shivaji Stadium3. Moti Bagh4. Aerocity Station (inside
airport) 5. Airport Station (inside Airport)6. Dwarka Sector 2

Delhi Airport: Commercial Arrangements and Developments
Area Partner
Duty free Retail Alpha Airport till 2010
Duty free Retail (T3) Aer Rianta (2010 onwards)
Advertisement Times Innovative Media Pvt Ltd till 2010
Ground Handling Menzies Bobba and Combata, WFS and Bird Group
Cargo Handling Bird Group and World Flight Services (WFS)
Car Parking Garuda Aviation Services Pvt. Ltd. (T2)Mahesh & Sunny Car Park (T1)
In Flight Kitchen Ambassador
Hospitals Apollo
Food & Beverages (T3) SSP Catering India Ltd.; Devyani International Ltd.; Travel Food Services Pvt. Ltd.
27
Airport Development Fees (ADF)
Profile Charges
Domestic Passengers Rs 200 (inclusive of all Taxes) per Departing Domestic Passenger
International Passengers Rs 1300 (inclusive of all Taxes) per Departing International Passenger
Amount collected through DF would not in any case exceed a
ceiling of Rs.1827/- crores exclusive of Taxes (NPV as on 1.3.2009)
ADF would be charged for a period of 36 months w.e.f 01.03.2009
ADF would not be subjected to Revenue sharing
Aeronautical Charges Hike
A 10% hike in Aeronautical Charges (Landing charges, Parking charges, Passenger Service Fees, X-Ray baggage charges, Housing charges) has been approved with effect from 16th February 2009
Aeronautical OperationsAeronautical Operations Non-Aeronautical OperationsNon-Aeronautical Operations
Airport Authority of India (AAI) Prescribed Charges
•
Passenger Service Fees (PSF)
•
Landing Charges
•
Parking Charges
•
X-Ray Baggage Charges
•
Housing Charges

Airline OperationsAirline Operations
Currently
58 Foreign Airlines (Air Arabia, Air France, Air China International Corp., Air France, American Airlines, Austrian Airlines, British Airways, Emirates, Gulf Air, Malaysia Airlines, Lufthansa, Kuwait Airways etc.)
10 Domestic Airlines (Jet Airways, Kingfisher Airlines, Spice Jet, Indian Airlines, Indigo etc.)
Quality InitiativesQuality Initiatives
Received a Rating of 3.26 for Quality standards on the ASQ Rating Scale
OMDA schedule 3 compliance:•
Objective Service Quality requirement as per OMDA •
Identified processes are monitored ,measured as per target set by AAI and action initiated for improvement in grey areas.
ISO9001:2000 Quality Management System:
•
Ensure having basic system in place
•
Continual improvement of processes
•
OMDA compliance
Delhi Airport: Business Development Initiatives
28

The Passenger Traffic has grown at a CAGR of 17% over the past 5 years.
For the period ended FY 09, the Composition of Domestic to International Passengers has been 66:34.
The Cargo Traffic has grown at a CAGR of 8% over the past 5 years .
For the period ended FY 09, the Composition of Domestic to International Cargo has been 30:70.
The Air Traffic Movements have grown at a CAGR of 12% over the past 5 Years.
For the period ended FY 09, the Composition of Domestic to International ATMs has been 73:27.
Aircraft Movements (In Thousands)Aircraft Movements (In Thousands) Cargo Tonnage (In Thousand Tonnes)Cargo Tonnage (In Thousand Tonnes)
Total Passengers (In Millions)Total Passengers (In Millions)
13% Growth
22% Growth
20% Growth
14% Growth-6% Growth
23% Growth
27% Growth
26% Growth
17% Growth -4.7% Growth
Delhi Airport: Historical Growth Pattern
17% Growth11% Growth 2% Growth
11% Growth -1.6% Growth
29
Total Passengers (in Thousands)Total Passengers (in Thousands) ATMs PerformanceATMs Performance
Cargo Tonnage (InTonnes) Cargo Tonnage (InTonnes)
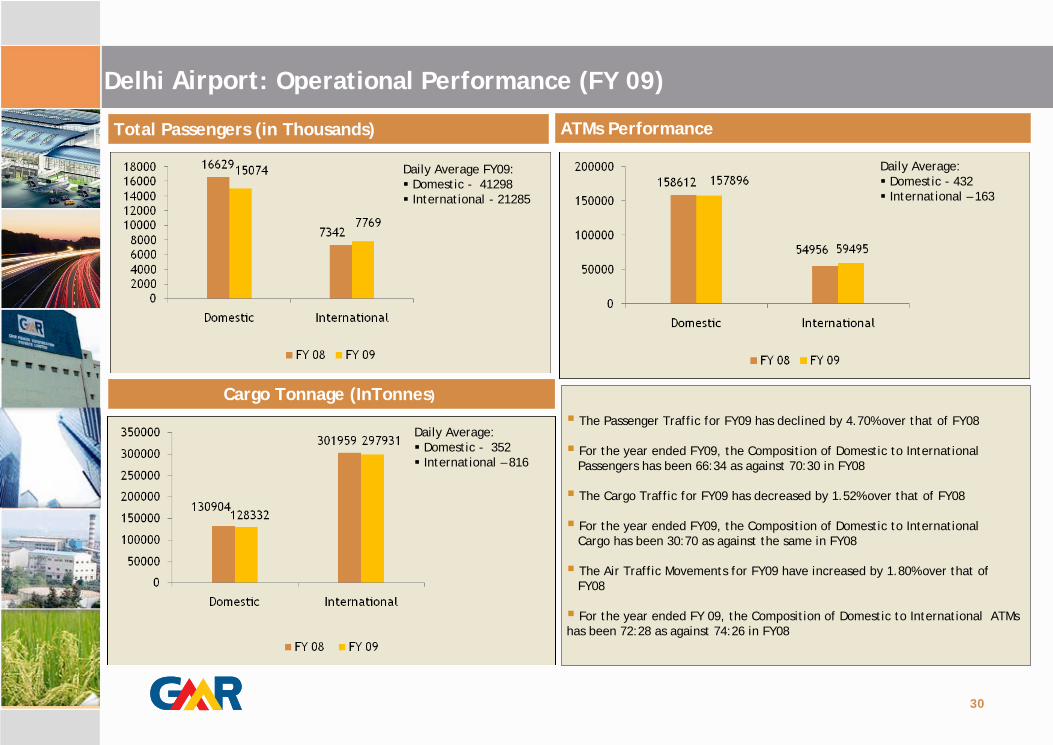
The Passenger Traffic for FY09 has declined by 4.70% over that of FY08
For the year ended FY09, the Composition of Domestic to International Passengers has been 66:34 as against 70:30 in FY08
The Cargo Traffic for FY09 has decreased by 1.52% over that of FY08
For the year ended FY09, the Composition of Domestic to International Cargo has been 30:70 as against the same in FY08
The Air Traffic Movements for FY09 have increased by 1.80% over that of FY08
For the year ended FY 09, the Composition of Domestic to International ATMs has been 72:28 as against 74:26 in FY08
Delhi Airport: Operational Performance (FY 09)
Daily Average FY09:Domestic - 41298International - 21285
Daily Average:Domestic - 432 International – 163
Daily Average:Domestic - 352International – 816
30
Total Passengers (in Thousands)Total Passengers (in Thousands) ATMs PerformanceATMs Performance
Cargo Tonnage (InTonnes) Cargo Tonnage (InTonnes)
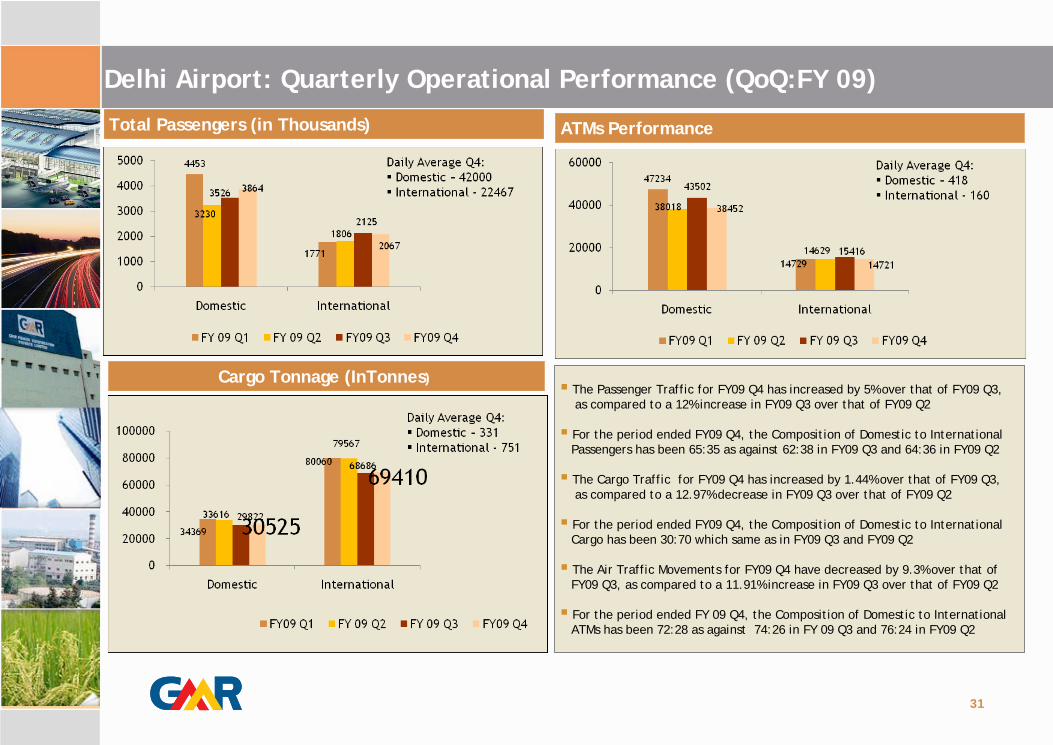
Delhi Airport: Quarterly Operational Performance (QoQ:FY 09)
31
The Passenger Traffic for FY09 Q4 has increased by 5% over that of FY09 Q3, as compared to a 12% increase in FY09 Q3 over that of FY09 Q2
For the period ended FY09 Q4, the Composition of Domestic to International Passengers has been 65:35 as against 62:38 in FY09 Q3 and 64:36 in FY09 Q2
The Cargo Traffic for FY09 Q4 has increased by 1.44% over that of FY09 Q3, as compared to a 12.97% decrease in FY09 Q3 over that of FY09 Q2
For the period ended FY09 Q4, the Composition of Domestic to International Cargo has been 30:70 which same as in FY09 Q3 and FY09 Q2
The Air Traffic Movements for FY09 Q4 have decreased by 9.3% over that of FY09 Q3, as compared to a 11.91% increase in FY09 Q3 over that of FY09 Q2
For the period ended FY 09 Q4, the Composition of Domestic to International ATMs has been 72:28 as against 74:26 in FY 09 Q3 and 76:24 in FY09 Q2

Commercial development at airport envisages development of an alternate commercial hub, right in the heart of NCR.
Master plan, by YRM & PF, details out a world class development comparable to the best & most sought after business districts in the world.
Location vis-a-vis the National Capital Territory would lend a dual advantage of extremely central location with effective connectivity and proximity to demand
Hospitality District, the first phase of development, would mainly constitute of hospitality assets across segments / categories & address the acute shortage of quality hospitality & conferencing facilities in NCR
Delhi Airport: Delhi Aerocity
IGI airport is spread over 5100 acres of land out of which 5% (250 acres) can be used for commercial development by DIAL
Land Bank to be divided into Multiple Land Parcels, which would be developed in a phased manner
~ 80% of our land bank is located next to NH-8, straddling across the main access to airport in form of large, contagious land parcels.
Land Bank Available at IGI, New DelhiLand Bank Available at IGI, New Delhi
Majority of Land Bank
NH 8
Gurgaon
Radisson
*LP = Land Parcel
Development Vision – Delhi AerocityDevelopment Vision – Delhi Aerocity
Hospitality District
Core Airport infrastructure
32

Delhi Aerocity – Phase I: Hospitality District
Hospitality District – HighlightsHospitality District – Highlights
33
First of its kind development with hotels from luxury to budget categories.
Multimodal connectivity through metro & expressway to NCR
Boasts of possibly the first Planned High Street of the country along a 800 m long landscaped, pedestrian walk way
Highly secure environment, integrated with airport security cover
Bid submission window closed on 15th December’ 08 and has attracted bids from reputed national & international hospitality players
Key Statistics
Metro station
Total Area Bid out: 22 acres (7 land parcels) to Hyatt, Accor, Lemon Tree, Dusit, Aria Hotels and Hyatt
Transaction Structure approved by AAI as follows:Annual License Fees to be quoted in Rs. Per Sq.Ft. with an Escalation of 5.5% year-on-year basisRefundable Security Deposit equivalent to 3 years average of the aggregateAnnual License Fees for the tenure of the Lease agreementsDeposits received:Upfront Lease Deposit – INR 5960 Mn ( 276 Mn per acre)Infrastructure Deposit - INR 2866 Mn (133 Mn per acre)
45 acres for Development (13 Asset areas)Total GBA (FSI) = 6.12 mn sft
Hospitality = 10 assets (5.04 mn sft)Commercial = 3 assets (1.08 mn sft)
Scope of Development
DIAL has been allowed additional eighteen usages catering from Commercial, Office to Residential which is incidental and supplemental to the airport usage.

Delhi Airport: Annual Financial Performance
INR mn 2009 2008 2007
Gross Revenues 9,477 8,706 5914
Aeronautical Revenues 3,421 3,219 2723
Non-Aeronautical Revenues 6,056 5,487 3191
Less: AAI Revenue Share 4,406 4,027 2720
Net Revenues 5,071 4,679 3194
Operating Expenses 4,444 3,748 2602
EBIDTA 627 931 592
Other Income 50 48 23
Interest and Finance Charges 494 5 101
Depreciation 525 91 39
PBT (342) 883 475
PAT (235) 567 293
Cash Profit 290 658 332
Cash Accruals 160 950 -
34

INR mn Q4 FY09 Q4 FY08
Gross Revenues 2,391 2,495
Aeronautical Revenues 866 818
Non-Aeronautical Revenues 1,525 1,677
Less: AAI Revenue Share 1,110 1,160
Net Revenues 1,281 1,335
Operating Expenses 1,156 1,177
EBIDTA 125 158
Other Income (20) 25
Interest and Finance Charges 258 2
Depreciation 232 37
PBT (385) 144
PAT (26) 7
Cash Profit 206 44
Delhi Airport: Quarterly Financial Performance
2304 2500
Gross Revenue
EBIDTA

Sabiha Gokcen International Airport at Istanbul in Turkey
Project OverviewProject Overview
36
Consortium Partners Consortium Partners Commercial PartnershipsCommercial Partnerships
Concession period of 20 years from May 2008 onwardsConcession Period 20 years (including construction period of 30
months*)
Concession Fee In lieu of revenue share, EUR1.93bn, to be paid in 20 years with no fee payable in first 3 years
Estimated capex Euro 451 millionsMeans of Finance Equity: €115; Debt: €336Airport Operations taken over on 1st May 2008
Financial Closure June 2008EPC Contractor GMR – Limak Joint VentureMaster Planner Ove Arup
F & B Contract H&CCarparks Self Operated
Cargo Warehouse Operations
System Logistics
Ground Handling Operations
Operated by subsidiary
Duty Free Business Setur, KOC Group
Construction of New Terminal Building
GMR – Limak Joint Venture
Sponsor Shareholding
40%
40%
20%
Capacity Expansionto
25 million Paxto be completed
byend 2009
Project FeaturesProject Features
International Terminal- Enclosed Area 20,000 sqm
Domestic Terminal- Enclosed Area 3,500 sqm
Capacity 6.0 mnCargo Terminal
- Enclosed Area 7,500 sqm-Capacity 145,000 tons- Cold air rooms 5Nos
Runways and Parallel Taxiway45 m x 3,000 m
Apron Parking Capacity 44 Planes
67% Capital Work in Progress achieved as on 30th April 2009

Total Passengers (in Thousands)Total Passengers (in Thousands)
Air Traffic MovementsAir Traffic Movements
Sabiha Gokcen International Airport: Operational Performance
37
2563
1229
2790
1569
0
500
1000
1500
2000
2500
3000
Domestic International
2007
2008
23811
15944
25731
19007
0
5000
10000
15000
20000
25000
30000
Domestic International
20072008
The Passenger Traffic for FY 08 has increased by 15% over that of FY08
For the year ended FY08, the Composition of Domestic to International Passengers has been 64:36 as against 68:32 in FY07
The Air Traffic Movements for FY08 have increased by 12.52% over that of FY07
For the year ended FY 08, the Composition of Domestic to International ATMs has been 58:42 as against 60:40 in FY07
Daily Average CY 08:Domestic – 7644International - 4300
Daily Average CY 08:Domestic – 71International - 52

Total Passengers (in Thousands)Total Passengers (in Thousands) ATMs PerformanceATMs Performance
The Passenger Traffic for CY09 Q1 has increased by 29% over that of CY08 Q1.
For the period ended CY09 Q1, the Composition of Domestic to International Passengers has been 72:28 as against 67:33 in CY08 Q1.
The Air Traffic Movements for CY09 Q1 has increased by 7% over that of CY08 Q1.
For the period ended CY 09 Q1, the Composition of Domestic to International ATMs has been 84:16 as against 64:36 in CY 08 Q1 and 61:39 in CY08 Q1
38
Sabiha Gokcen International Airport: Operational Performance
807
314

Development plan for the Sabiha Gokcen International Airport in IstanbulDevelopment plan for the Sabiha Gokcen International Airport in Istanbul
Sabiha Gokcen International Airport
38
Car Park
NewTerminal
Hotel
VIP
Existing Terminals

Sabiha Gokcen International Airport: Future Business Prospects
Key Development Opportunities
0
20
40
60
2009 2015 2027
3.33 5.1713.44
3.049.42
29.28
6.37
14.59
42.72
Passenger Traffic (in Mn)
Domestic International Total
0
100
200
300
400
2009 2015 2027
30 47
111
2573
207
55
120
318Air Traffic Movements (‘000)
Domestic International Total
39
Catchment Population
Istanbul’s Anatolian side has its own population of 5-6 Mn
Industrial and Residential areas like Kocaeli, Bursa and Izmit around the airport has a 20 Mn plus population
Techno park (90 hectares) and conference/Hotel facilities (20 acres) would contribute to the traffic
Racing F1 track in the vicinity has been a major attraction for the past 2 years coupled with stress on tourism
Takeoff Prospects
Ataturk Airport (the other Istanbul Airport) caters to 149 destinations compared to 64 by SGIA leaving good scope for newer routes
Ataturk is constrained by capacity leading to delays
Quick turnaround and no slot restriction
SGIA is best positioned to handle its catchment area and spillover from AtaturkMajor international destinations in Germany, UK, Scandinavia, Russia and CIS countries would contribute to growth as many turk migrants reside over there, besides tourist traffic

Sabiha Gokcen International Airport: Turkey Overview
40
Turkey’s Economic Overview
15th largest economy and among the top ten emerging markets
Total population of about 73 million with nominal GDP of about USD 657 bn (2007)
Istanbul has a population of about 14 Mn with 35% residing on the Anatolian side
Turkey’s Aviation Sector
Passenger traffic growing at 25% plus per annum since 2003 fuelled by Low cost Carriers.
Turkey comprises of 52 Airports having the State Authority responsible for operations
Tourist Traffic to Turkey is about 23 Mn pax (5.5 Mn pax from Istanbul in 2007)
The Annual Passenger Traffic in Turkey has been 66 Mn pax (Domestic – 29 Mn and International 37 Mn – CAGR 15%

Gross Revenue
EBIDTA
SGIA : Financial Performance
41
INR mnINR mn FY09*
Gross Revenues 2,669
Aeronautical Revenues -
Non-Aeronautical Revenues 2,669
Less: Revenue Share -
Net Revenues 2,669
Operating Expenses 2,573
EBIDTA 96
Other Income (67)
Interest and Finance Charges 14
Depreciation 394
PBT (379)
PAT (319)
Cash Profit 75
* 40% share of GIL

Outline of Emerging Opportunities in Airports Sector in India
Addition of Fleet Size in IndiaAddition of Fleet Size in India
42
Category Numbers
International 16
Major Domestic 22
Custom 8
Other Domestic 74
Total 120
Airport Categorization in IndiaAirport Categorization in India
Airport Infrastructure DevelopmentAirport Infrastructure Development
•The XI plan targets Infrastructure spend of USD 8bn on Airports
•
Total No. of Airlines Operating in India: 71,Domestic: 11, International: 60
•
Delhi, Hyderabad, Bangalore and Mumbai airport have already been
privatized
•
Kolkata and Chennai are being developed by AAI
•
35 non-metro airports are under the AAI’s up gradation plan
•
Airports Economic Regulatory Authority of India Act, 2008 has come into
force w.e.f. 01.01.2009
•
Development of Merchant Airport Policy is under consideration
Presently, the various airlines are operating only through 61 airports. The remaining are lying unutilised, at best handling occasional aircraftoperations.Out of the International Airports 12 are with AAI, 5 are under Joint Venturesand 2 are Greenfield Airports
Airlines Operating in IndiaAirlines Operating in India

Key Investment Highlights
2 GMR : Leading Infrastructure Player
3 Airports : Building Gateways To India
4 Power : Lighting the World
5 Urban Infrastructure & Highways : Paths To Progress
6 Strong Management Team
7Financial Highlights
India : Secular Growth In Infrastructure1
Stock Prices & Shareholding Pattern
8

Operational Power Projects
GMR Energy Limited
GMR Power Corporation Pvt. Ltd.
Vemagiri Power Generation Ltd.
Facility Mangalore, Karnataka Relocation Plan
Contracted Capacity 220 MW (235 MW post conversion) Barge-mounted power plant would be converted to gas fired power plant & relocated to Kakinada (AP) from Jan 2010Expected to be operationalized by March, 2010EGoM has cleared Gas allocation for 70% of plant requirement from KG Basin
Fuel Naptha
COD 2001
PPA 7yr PPA finished in 2008; currently merchant operation
Facility Chennai, Tamil Nadu Strengths
Contracted Capacity 200 MW GMR Energy holds 51% stakeISO 14001 and OHSAS 18001 compliantDr. M.S. Swaminathan Award for being an environment friendly project
Fuel Low Sulphur Heavy Stock
COD 1999
PPA15 Years till 2014; minimum offtake at 68.5% PLFTake or pay fixed charges
Facility Vemagiri, Andhra Pradesh Strengths
Contracted Capacity Contracted –
370 MW (Installed Capacity
–
388.5MW)PPA with APTRANSCO is being amended for selling 20% of contracted capacity (74 MW) on Merchant Basis and for reducing PPA tenure to 15 years.Gas Sale & Purchase Agreement executed with RIL and Gas being supplied from KG Basin since April 2009
Fuel Natural Gas
COD 2006
PPA23 Years at 80% PLF Take or pay of fixed
charges
43

Facility Kamalanga Chhattisgarh Vemagiri (Expansion)
Location Orissa Raipur Andhra Pradesh
Capacity 1,050 MW (3 X 350 MW) 1,200 MW 740 MW
Fuel Coal Coal Natural Gas
Type of Project BOO (MoU with Govt of Orissa) BOO (MoU with Govt of Chhattisgarh) BOO
Expected CoD 2012 2013 2012
Land Acquisition
Total Land required for the project is 1,105 acres. The land acquisition is expected to be acquired by June/July 2009.Rs. 600 Mn has been deposited with Industrial Development Corporation of Orissa for acquisition of Private Land
State Govt has granted approval for 1050 acres of land of which 200 acres of private land have been acquired.Further land would be acquired by end-July 2009.
Adequate land available for expansion in existing VPGL plant facilities
Fuel Supply Arrangement
Coal linkage of 500 MW obtained from Mahanadi Coal Fields. Tapering coal linkages for balance 550 MW has been approved112 mn MT coal from Rampia & Dip Side Rampia coal block allocated to GMR Energy.
State Govt. has recommended to the Ministry of coal for coal linkage.
Representation made to Ministry of Petroleum and Natural Gas for gas allocation
Power Off-take arrangement
PPA with GRIDCO for 25% power and remaining to PTC PTC entered in agreement with Haryana for 300 MWPlan to sell 20% power on Merchant basis
Plan to sell power through mix of long term PPA & merchant powerPPA with CSEB which has right to purchase upto 30% power during first 20 yearsPlan to sell 30% power on Merchant basis
Plan to sell 100% power on merchant basis
Environmental Clearance
Environment & pollution clearance obtained Presentation made to MoEF. Final approval expected by August 2009.
Terms of Reference for conducting EIA has been approved by MoEF
Project status
Financial Closure achieved for outlay of US$950 Mn EPC contract awarded to SEPCO, China in Sept 2008Department of Water Resources has allocated 30 Cusecs of water from River Brahamini.
Implementation Agreement signed with Govt. of Chhattisgarh.GoC has principally agreed to allocate 32 MCM from river Mahanadi.Notice Inviting Tenders released for BTG and BOP. Offers received and are under evaluation.
DPR prepared by Tata Consulting Engineering LtdNotice Inviting Tenders on ICB basis have been published.Award of EPC expected by August, 2009.
Pipeline of Power Projects Under Development
Power Assets Under DevelopmentPower Assets Under Development
44

Pipeline of Power Projects Under Development
Power Assets Under DevelopmentPower Assets Under Development
Facility Alaknanda Talong Bajoli Holi Upper Karnali Upper Marsyangdi
Location Uttaranchal Arunachal Pradesh Himachal Pradesh Nepal Nepal
Capacity 300 MW 160 MW 180 MW 300 MW 250 MW
Type of Project
Run of River on BOOT basis for 45 years from Implementation Agreement
Run of the River on BOOT basis for a concession period of 40 years from COD
Run of the River on BOOT basis for a concession period of 40 years from COD
Run of the River BOOT basis for concession period of 30 years from Generation License
Run of the River BOOT basis for concession period of 30 years from Generation License
Expected COD 2013 2014 2015 2015 2015
Land Acquisition
Land requirement is approx. 200 Acres and land acquisition is in progress
Approx. 850 acres land required Acquisition will start after DPR and MoEF clearance
Land requirement is 120 acres
Permanent Site establishment is in place
Permanent Site establishment is in place
Power OfftakePlan to have short term PPA with states in North India
Plan to have short term PPA with states in North India
Plan to have short term PPA with states in North India
Plan to export Power to sell on short term PPA to states in North India
Plan to export Power to sell on short term PPA to states in North India
Environmental Clearances
Final clearance obtained form MoEF in Mar 2008No R&R issues
Terms of Reference for Environment study approved by MOEF No R&R issues envisaged
Terms of Reference for Environment study approved by MOEFNo R&R issues envisaged
Environmental clearance expected by Nov 2010
Project statusDPR approved by CEAAppointed E&Y as consultant for CDMTender for main civil works floated and bids received are under evaluationFinancial Closure expected by March 2010.
AF Colenco of Switzerland has been appointed as the principal engineer. DPR has been preparedHydrological Studies have been submitted to CEA.
SNC– Lavalin acting as Principal Engineer and ConsultantDPR is being prepared.Financial Closure expected by Mar 2011
DPR is being preparedSchEMS appointed as EIA consultantsInitial review indicate that the project capacity can be increased to 900 MW with total annual energy of 4,052 MU
DPR is being prepared.Coyne-ET-Belliar appointed as DPR ConsultantsSchEMS appointed as EIA consultantsInitial review indicate that the project capacity can be increased to 560 MW with total annual energy of 2,476 MU
45

7,023 MW of power projects spread across the country7,023 MW of power projects spread across the country
Operating assets3 Projects(823 MW)
Under implementation/ Development10 Projects(6,200 MW)
Bajoli Holi180 MW
HydroAlaknanda300 MW1
Hydro
Orissa1,050 MWFuel type - Coal
Chattisgarh1,200 MW
Fuel Type : Coal
Vemagiri388 MWFuel type – Gas
Chennai200 MWFuel type – Sulphur
Mangalore235 MW
Fuel type – Naphtha
Upper Karnali300 MWHydro
Upper Marsyangdi250 MWHydro
Vemagiri Expansion740 MWFuel type – Natural Gas
Coastal Power Plant – Gujarat1320 MW
Fuel type - Coal
Coastal Power Plant – Andhra Pradesh700 MWFuel type - Coal
Project Pipeline (Gross Capacity MW)Project Pipeline (Gross Capacity MW)
Talong 160 MWHydro
GMR Energy : Overview of Power Assets
46

GMR acquired 33.5% stake for US$ 30 Mn on February 23, 2009HEG is having coal mines in South Africa with interest in Uranium explorationHEG investments include a 39% stake in Homeland Uranium with assets in Niger & USA and an 8% stake in Altona with coal assetsin Australia
HEG owns Mining License for
–
Kendal (74%, total mineable reserve 25 mn tons),
–
Eloff (50% with an option to increase to 74% for US$ 15 mn, total reserve 259-275 mn ton)
–
Northfeild (100% share – 1 mn ton) Annual steady rate run on mine production from
–
Kendal expected to be 1.8 mn ton
–
Eloff expected to be 12 mn ton
–
Northfield expected to be 0.3 mn tonPre-feasibility report on Eloff Project prepared by Exxaro, SA and Validated by Norwest, USAJORC standard certified resource & reserve and feasibility reports completed and mining application has been made.Plan to sell coal in spot market at mine gate to global players like Glencore
Acquired 100% stake for ~ US$ 80 mn (Staggered payment linked to start of production)
Entity has Coal Contract of Works (CCoW) license (given by federal Govt. and approved by the Parliament), has highest degree of certainty and gives mining rights of 30 years from date of issuance
Mine has resources of 288 mn ton and mineable reserves of 104 mn tons
Development period to be 2 years
Annual steady state run on mine production expected to be 6 mn ton (Life 19 Years)
Plan to export coal to India
Coal mined is expected to hauled by Road to Barge loading facility on Musi River
Crushed coal from this facility to be loaded on barges
Barges are expected to transport coal for ~320 kms to trans shipment point where the coal will be loaded on Capesize ships
Towards Securing fuel supply for Power Plants
Indonesia coal mine Homeland Energy Group(HEG)
Based on Imported Coal, planned 2020 MW Coastal Projects including 1320 MW in Gujarat and 700 MW in Andhra Pradesh
47

Power Projects: Strategy to Transform itself into an Integrated Power Producer in India
Leverage expertise to capture future growth opportunities
Diversify into allied power infrastructure businesses
1 2
Add further power assets diversified across fuel types in India.
Bid for UMPPs where fuel supply has been secured.
Invest in IPPs in neighboring developing countries with
Need for infrastructure expansion
Government support
Explore brown field opportunities through acquisitions of development rights and operating assets.
Actively explore opportunities in domestic power distribution.
State of Gujarat, Karnataka & Maharashtra have initiated private participation.
Evaluate power transmission opportunities in India.
Explore Joint Ventures and/or acquisition to realise value.
Explore options for alternate fuel to reduce reliance on any one type of fuel.
In discussion with Companies from Spain and Turkey to venture into the Solar Energy Business in India.
48

GMR Power Assets: Annual Financial Performance
49
INR mn 2009 2008 2007 2006
Gross Revenues 21,527 15,530 12,981 10,225
Contracted 20,207 15,530 12,981 10,225
Merchant 1,320 0 0 0
Net Revenues 21,527 15,530 14,029 10,107
Operating Expenses 16,186 12,031 8,915 5,836
EBIDTA 5,341 3,499 5,114 4,271
Other Income 114 511 128 4
Interest and Finance Charges 955 1,065 1,549 995
(Gains)/loss on FE Fluctuation - - -4 4
Depreciation 1,172 1,175 2,578 1,979
PBT 3,328 1,770 1,119 1,297
PAT 3,045 1,585 893 1,172
Cash Profit 4,217 2,760 3,467 3,155
Cash Accruals 1,990 -1,440
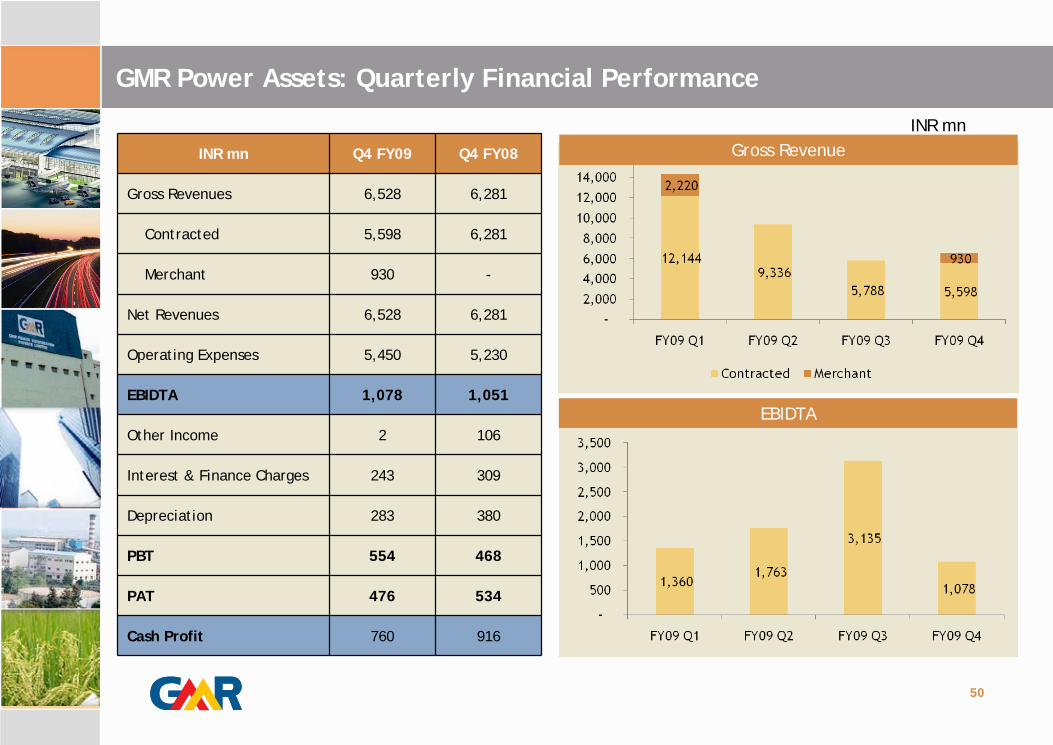
GMR Power Assets: Quarterly Financial Performance
INR mn
INR mn Q4 FY09 Q4 FY08
Gross Revenues 6,528 6,281
Contracted 5,598 6,281
Merchant 930 -
Net Revenues 6,528 6,281
Operating Expenses 5,450 5,230
EBIDTA 1,078 1,051
Other Income 2 106
Interest & Finance Charges 243 309
Depreciation 283 380
PBT 554 468
PAT 476 534
Cash Profit 760 916
Gross Revenue
EBIDTA
50

Huge Capacity additions have been planned in power generation in 11th Five Year Plan to the tune of 79 GW as against 135 GW currently installed.
Total investment opportunity of about US$ 150 billion over a 5 year horizon
De regulated power sector to contribute about 40% of additional capacity by 2012
Hydel power potential of 150,000 MW is untapped as assessed by the Government of India
Future Outlook of Power Sector
Source: UNDP, Human Development Indicators,2006 ; CEA and Crisil Research Power Annual Review 51
Low
Con
sum
ptio
n pe
r ca
pita
Per Capita Consumption in India is extremely low as compared to other countries
Capacity Additions Expected
Mega Watts (In 000’s)
Scope for Public Private Participation
Installed Capacity Breakup FY09 (Total Capacity = 148 GW)
Per Capita Consumption (Thousand Kwh/ year)* Renewable Energy Solutions (Ministry of New & Renewable Energy)
Coal Gas Diesel Nuclear HydroRES
(MNRE)
State 43 4 1 0 27 2
Private 5 5 1 0 1 11
Central 30 7 0 4 9 0
Total 78 16 2 4 37 13

Demand-Supply Gap to Catalyze Growth
Historically Capacity Addition has not kept pace with Demand, Leading to Significant Shortages
(1) Ministry of Power
Demand-Supply Gap Aggravated as Capacity Addition by Government has been far below Planned Targets and
Limited Involvement of Private SectorHistorically Characterized by Huge Energy Shortages(1)
52
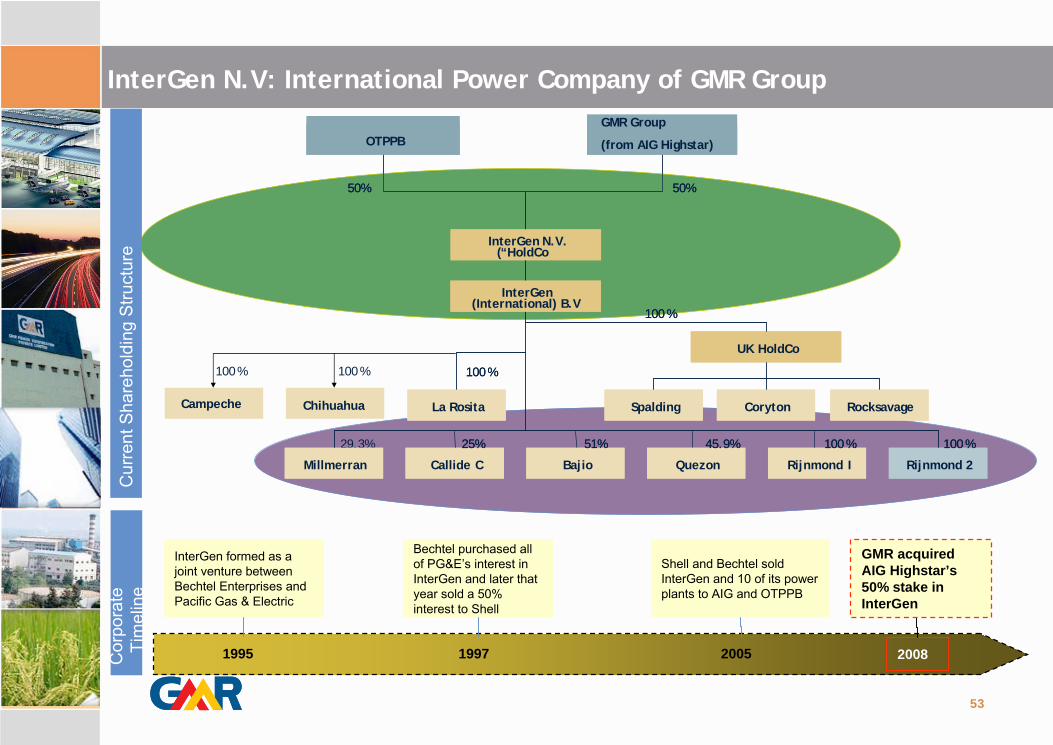
InterGen N.V: International Power Company of GMR Group
50%
OTPPB Highstar
29.3%
UK HoldCo
Coryton RocksavageSpaldingLa Rosita
Millmerran Rijnmond
50%
InterGen N.V.(“HoldCo
InterGen(International) B.V
Callide C Bajio Quezon Rijnmond I
100 %
100 %
25% 51% 45.9% 100 % 100 %
50%
OTPPBGMR Group
(from AIG Highstar)
UK HoldCo
Coryton RocksavageSpaldingLa Rosita
Millmerran Rijnmond 2
50%
InterGen N.V.(“HoldCo
InterGen(International) B.V
Callide C Bajio Quezon Rijnmond I
100 %
100 %
25% 51% 45.9% 100 % 100 %
ChihuahuaCampeche
100 %100 %
InterGen formed as a joint venture between Bechtel Enterprises and Pacific Gas & Electric
Bechtel purchased all of PG&E’s interest in InterGen and later that year sold a 50% interest to Shell
Shell and Bechtel sold InterGen and 10 of its power plants to AIG and OTPPB
1995 1997 2005 2008Cor
pora
te
Tim
elin
e
GMR acquired AIG Highstar’s 50% stake in InterGen
Cur
rent
Sha
reho
ldin
g St
ruct
ure
53

Operating assets■Rijnmond
820 MW
(100%)Assets in construction■Rijnmond II
428 MW(100%)Total 1,248 MW
Netherlands
Operating assets■Quezon
460 MW (45.87%)
Total 460 MW
Philippines
Operating assets■Millmerran
850 MW
(29.3%)
■Callide
920 MW
(25%)
Total 1,770 MW
Australia
Operating assets■Bajio
600 MW
(51%)
■La Rosita
1,100 MW
(100%)
■Campeche facility
252 MW
(100%)
■Chihuahua facility
259 MW
(100%)
Total 2,223 MW
Also includes Libramiento pipeline
Mexico
Operating assets■Rocksavage
748 MW
(100%)
■Coryton
777 MW
(100%)
■Spalding
860 MW
(100%)
Total 2,385 MW
United Kingdom
PhilippinesMexico
Australia
U.KNetherlands
Operating assets
7,658 MWAssets in construction
428 MWTotal 8,086 MWInterGen Equity
6,231 MWGMR Equity 3,116 MW
InterGen Net Capacity (net of aux)
1
Diagram legend
■CCGT
■ Coal
Details of InterGen N.V International Power Assets
C
C Contracted
54
C
C
C
C
C
C
C
C
InterGen has 7658 MW of Assets under Operation with another 428 MW under constructionInterGen also has a current development pipeline of 2,849 MW

• Opportunities in India are slow to materialise
• Competition getting fiercer at home
• Significant growth opportunities in markets overseas
• GMR has the distinctive development skills needed in emerging markets
Avenue for Growth Portfolio Diversification
• Spread risk exposure across geographies
• GMR feels a clear need for pure breed entrepreneur -
developer
Group Profile
• Aim to be well known brand, in global top 10 in key sectors
Learn from other more Skilled Markets
• Bring back new approaches and technology from global exposure
•
Exposure to nuclear technology, getting coal from overseas etc.
Access to International Talent
• Attract talent s, who do not to want to move to India
• Provide international opportunities for Indian staff
Access to International Capital
• Ability to raise capital internationally
• Desire to list on e.g., London Stock Exchange
GMR’s International
aspiration is to achieve $10b assets under
management in 5 years
InterGen N.V: Strategic Rationale & Value Proposition
Going Global complements GMR through de-risking its Portfolio, Leveraging its Partnership and its fFinancial acumen
55

Portfolio of existing assets - high quality and location in attractive markets
Strong development pipeline
International IPP market surging due to requirements for new generation capacity
Recognised management team (unique opportunity to get a team with international experience and solid track record in project development and asset operation)
Unique opportunity to develop/ acquire skills (merchant, tolling, contracted plants)
Leverage/ capitalise on GMR Group’s & InterGen teams combined capabilities to expand through building new generation capacities and replacing other ageing plants
InterGen N.V: Fits well with GMR’s Strategic Intent…
…acquisition elevates GMR to be a Global Power Generatorand elevates GMR as the largest private sector power developer in the country
56

Neil H Smith (President & Chief Executive Officer)
— Lead responsibility for development, financing, construction, operations of all InterGen projects
— Bachelor of Science in Political Science from Emory University; MBA from Harvard Business School
Tim Menzie (Chief Operating Officer)
— Responsibilities include directing all the operations and commercial management activities
— Bachelor’s degree in Business Administration from Westfield State College and Masters of Science in Taxation degree from Bentley College.
Martin Rees (Chief Financial Officer)
— Directs InterGen’s project finance, corporate finance, financial reporting, tax, treasury and information technology functions
— BA in accounting from University of Kent; member of Association of Corporate Treasurers
Susan E Gonzalez (General Counsel)
— Responsibilities include general legal services, compliance, risk management, M&A support
— BA from University of Michigan; Juris Doctor degree from Suffolk University; Certificate in Comparative Law from University Jean Moulin in Lyon, France
Professionally managed Company with strong internal controls and processes
1
2
InterGen N.V: Management Team
57
Equal representation to both OTPPB and GMR
Management is exercised through two bodies:Supervisory Board— 10 members— Equal representation by OTPPB and GMR— Veto rights to both parties on key
decisionsManagement Board— 4 members— OTPPB and GMR have right to nominate 2
members each
Day-to-day operations are run by the Management Board
All key decisions, including key appointments, investment decisions, borrowings etc, decided by the Supervisory Board
InterGen has a strong and well qualified management team in place
— Hands-on management team, very well perceived in the market
— Strong development pedigree – “grown up” in industry from developers (J Makowski, Calpine)
— 600 employees

InterGen N.V: Key Financials (CY2008)
(1) Revenue stated is before MTM Deduction(2) Revenue Consists of only Tier I plants
(3) Proportionate & Adjusted EBITDA
(USD Mn) CY 08 CY 07
Generation 31,8 GWh 30,9 GWh
Revenue(2) 1397 1113
EBIDTA(3)– Tier I 429 407
EBIDTA(3)
– Tier II 214 243
Corporate & Development
(39) (35)
Consol EBIDTA(3) 604 615
58

Key Investment Highlights
2 GMR : Leading Infrastructure Player
3 Airports : Building Gateways To India
4 Power : Lighting the World
5 Urban Infrastructure & Highways : Paths To Progress
6 Strong Management Team
7Financial Highlights
India : Secular Growth In Infrastructure1
Stock Prices & Shareholding Pattern
8

All road projects commissioned on schedule
Particulars GTAEPL GTTEPL GACEPL GJEPL GPEPL GUEPL* GHVEPL
Location Tuni-Anakapalli Tambaram- Tindivanam
Ambala-Chandigarh Faruknagar- Jadcherla
PochanpalliTindivanam- Ulundurpet
Hyderabad –
Vijayawada
Road Length 59 kms 93 kms 35 kms
Construct - 46 kms + O&M
Sweetener - 12 kms
Construct - 86 kms + O&M Sweetener
- 17 kms
Construct - 73 kms
Construct –
181 kms
Concession Period
17.5 years incl. construction period
of 2.5 yrs.
17.5 years incl. construction
period of 2.5 yrs.
20 years incl. construction period
of 2.5 years
20 years incl. construction period of 2.5
years
20 years incl. construction
Period of 2.5 years
20 years incl.
Construction Period of 2.5
years
25 years from
Date of
appointment
Concession Duration
May. 2002 – Nov. 2019
May. 2002 – Nov. 2019
May. 2006 – May. 2026
Aug. 2006 – Aug. 2026
Sep. 2006 – Sep . 2026
Oct. 2006 – Oct. 2026
-
Project Cost(Rs.Mn)
3040 3900 4985 4713 6900 795022,000
(Approx.)
Financial Closure
June 2002 June 2002 May 2006 August 2006 September 2006 October 2006 -
Commercial Operation Date
Oct 2004 Oct 2004 Nov 2008 Feb 2009 March 2009 Apr 2009 -
Concession Type
Annuity Annuity Toll Toll Annuity Toll Toll
CompletedUnder
Construction
Road Projects
59
* Construction completed , will commence commercial operational shortly

Short listed for submission of Price Bid ( 658 Kms)
RFQ Applications have been submitted for the following projects:
Project Kms Est.Cost RsM
Jaipur – Tonk – Deoli 149 7,290
Chennai ORR 30 8,640
Samikhali – Gandhidham 56 8,050
Udaipur - Ahmedabad 243 25,450
Total 478 49,430
Project Kms Est.Cost RsM
Gandhidham – Mundra Port 71.40 10,310 Ahmedabad – Godhra 117.60 10,250 Godhra – Guj / MP Border 83.85 7,470Haridwar – Dehradun 37.40 4,900Hungund – Hospet 97.89 10,470Kishangarh – Udaipur 315.00 25,340Krishnagiri – Walahjpet 148.00 12,500Rohtak – Bawal 82.53 6,690Hyderabad – Bangalore 22.11 4,500Bijapur – Hungund 97.22 8,580Chengapalli – Kerala/TN Border 55.00 8,520Pune – Satara 142.35 17,250Tumkur – Chitradurga 114.00 8,500Total 1,384.35 1,35,280
Leveraging expertise to explore Opportunities across Land Transportation Sector
60

Road Assets: Glimpses
Jadcherla Road
Ulundurpet Road Pochanpalli Road
Ambala – Chandigarh Road (Completed)
61

Roads Sector: Significant Opportunity for Private Sector Participation
India has one of the largest Road Networks in the World India has one of the largest Road Networks in the World
Source: Report of the Core Group on the Financing of the National Highway Development Program
Total length = 3.3 million km
2% 4%14%
80%
National Highways
State Highways
Major district roads
Rural & other roads
Supportive Regulatory FrameworkSupportive Regulatory Framework
Government will carry out all preparatory work including land acquisition and utility removal .
Right of way (ROW) to be made available to concessionaires free from all encumbrances.
NHAI / GOI to provide capital grant up to 40% of project cost to enhance viability on a case to case basis
100% tax exemption for 5 years and 30% relief for next 5 years, which may be availed of in 20 years.
Concession period allowed up to 30 years
Arbitration and Conciliation Act 1996 based on UNICITRAL provisions.
In BOT projects entrepreneur are allowed to collect and retain tolls
Duty free import of specified modern high capacity equipment for highway construction.
FDI up to 100% in road sector
62
Current status of Road network in IndiaCurrent status of Road network in India
National highways constitute only 2% of road network but carry ~40% of the total road traffic
Vehicle traffic has been growing at a pace of 10% per annum over the last 5 years
The roads and highways in India account for about 80 per cent of the total passenger traffic and about 60 per cent of the total freight traffic in the country
The government has embarked on the ambitious National Highway Development Project covering 13,000 km with a cost of Rs.54, 000 crore.

Roads Sector: Significant Opportunity for Private Sector Participation
NHDP has planned expenditure of ~USD 55bnNHDP has planned expenditure of ~USD 55bn
20,000km10,000km13,146km 6,500km 1,000km N/A
Opportunity for Private Sector Participation worth $23bn (08-12E)Opportunity for Private Sector Participation worth $23bn (08-12E)
Total=USD 55bn
58%42%
Private sector contribution Contribution from other sources
NHDP Phase I GQ (5,846 km) and NS-EW Corridor (981km)
NHDP Phase II NS-EW Corridor (6,161 km) and other National Highways of 486 km length.
NHDP Phase-IIIUpgradation and 4 laning of 4,035 km of National Highways. upgradation and 4 laning of 8074 km
NHDP Phase-IVUpgradation of 2000 Km of Highways into 2 lane highways
NHDP Phase V Six laning of 6,500 km of existing 4 lane highways includes 5,700 km of GQ and other stretches.
NHDP Phase VI 1000 km of expressways
NHDP Phase VII700 km of Ring Roads, Bypasses and flyovers and selected stretches
Phase wise Scope of NHDP Phase wise Scope of NHDP
Phase wise StatusPhase wise Status
63
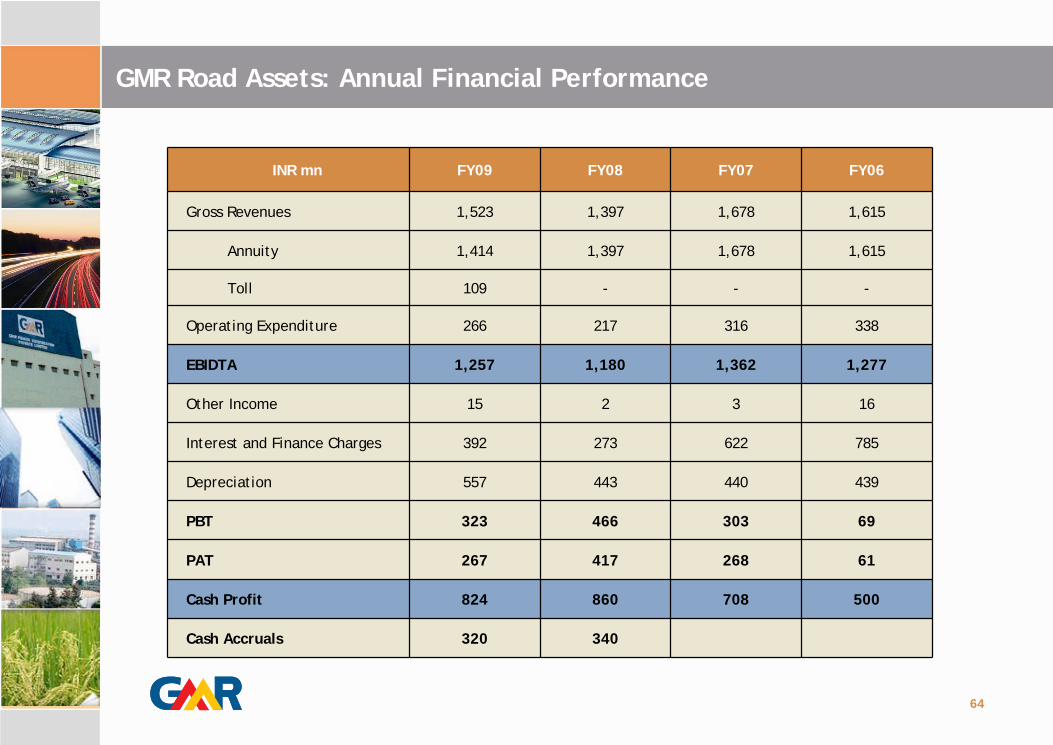
GMR Road Assets: Annual Financial Performance
INR mn FY09 FY08 FY07 FY06
Gross Revenues 1,523 1,397 1,678 1,615
Annuity 1,414 1,397 1,678 1,615
Toll 109 - - -
Operating Expenditure 266 217 316 338
EBIDTA 1,257 1,180 1,362 1,277
Other Income 15 2 3 16
Interest and Finance Charges 392 273 622 785
Depreciation 557 443 440 439
PBT 323 466 303 69
PAT 267 417 268 61
Cash Profit 824 860 708 500
Cash Accruals 320 340
64

GMR Road Assets: Quarterly Financial Performance
INR mn
INR mn Q4 FY09 Q4 FY08
Gross Revenues 464 349
Annuity 365 349
Toll 99 -
Operating Expenditure 70 45
EBIDTA 394 304
Other Income 10 1
Interest & Finance Charges 178 55
Depreciation 179 111
PBT 47 139
PAT 34 125
Cash Profit 213 236
Gross Revenue
EBIDTA
65

Krishnagiri Special Economic Zone: Recent Foray
Entire land of 3300 acres has been Identified
1500 acres of Land acquired
Balance 1800 acres of Land acquisition is in progress
Free from homestead, minimal Relocation & Rehabilitation.
Project Overview Land Acquisition by end of the current FY
Final Notification of SEZ
Completion of Development Plan for covering:
(a) Master Plan and Infrastructure Plan
(b) Business Plan
(c) Demand Assessment
Preparation of Detailed Project Report
Planned Action for next 12 months
66
Setup a Construction Division Team of 124 personnel to mitigate execution risks

Bangalore
Krishnagiri
Location advantages A Strategic Location with distinct Comparative Advantages
Targeted Industries
67
Krishnagiri Special Economic Zone: Locational Advantages
Industrial Legacy because of proximity to Hosur Town which is an automobile hub
Developed Infrastructure by way of Power supply, connectivity etc.
Forward & Backward Linkages due to proximity to Bangalore.
Availability of skilled human resources due to traditional engineering & textile workers pool.
New Technology IndustriesWind Power, Solar Thermal Systems, Photo Voltaic Systems, Aircraft Part Manufacturing.
Knowledge IndustriesIT & ITES, Contract Manufacturing, Nanotechnology, Bioinformatics, Clinical Trials, Health Tourism, Manufacturing & Drug discovery.
Traditional IndustriesAuto & Auto Components, Processed Foods, Light Engineering, Floriculture, Plastics, Garments, Electronics, Logistics.

Key Investment Highlights
2 GMR : Leading Infrastructure Player
3 Airports : Building Gateways To India
4 Power : Lighting the World
5 Urban Infrastructure & Highways : Paths To Progress
6 Strong Management Team
7Financial Highlights
India : Secular Growth In Infrastructure1
Stock Prices & Shareholding Pattern
8

GMR Infrastructure: Board of Directors
GM Rao
Group Chaiman
Srinivas Bommidala
Chairman - Urban Infrastructure & Highways
GBS Raju
Chairman – Corporate & International Business
G Kiran Kumar
Chairman - Airports
B V N Rao
Chairman – Energy & Agro
GMR Holding BoardGMR Holding Board
K. Balasubramanian
Member Group Holding Board
GMR Infra BoardGMR Infra Board
G. M. Rao
Srinivas Bommidala
G. B.S. Raju
G. Kiran Kumar
B.V. Nageswara Rao
K.Balasubramanian
O B Raju
Arun K. Thiagarajan
K.R. Ramamoorthy
Prakash G. Apte
R.S.S.L.N. Bhaskarudu
Udaya Holla
Uday M. Chitale
P M Kumar
Executive Director,
GMR Holdings Board
68

DIALDIAL
Energy SectorEnergy Sector
Urban Infrastructure & Highways SectorUrban Infrastructure & Highways Sector
Raajkumar, CEO
K V V Rao, Director & President
G.Subba Rao, President Hydro Energy
Ashish Basu, EVP–Commercial & Contracts
R. K Goel, Project Director-Transmission
S N Barde, EVP–O & M
Avinash R Shah, EVP-Business Development
O.B.Raju , MD & CEO-Highways
V Jayaraman, COO–Property Development
Gopala Krishna Kishore, COO-SEZ
D.R Santhana Krishna, CFO - Highways
Kamalakararao Y, CFO-SEZ & Property
P.S. Nair, CEO
Andrew Harrison, COO (T 3 Terminal)
Peter Noyce – COO (T1 & T2 Terminal)
I Prabhakara Rao, CEO-&EVP Airport Development
Gavin Makechnie, Chief Commercial officer
M.S.Narayanan, Head- Finance
A.S.K. Reddy – Head, HR
Ranjit Murugason, CEO
Madhu Terdal, COO
Cenk Alpsoy– CEO, Turkey
Quek Peng Ng, Head – South East Asia
Dean Marks – Head, HR
International Business DevelopmentInternational Business Development
Corporate ServicesCorporate Services
69
GHIALGHIAL
P. Sripathy, CEO
Rajinder Jalpuri, Deputy, COO
A. Vishwanath, Chief Commercial Officer
G.R.K Babu, Head-Finance
Mohan Prasad – HR, Head
GMR Infrastructure: Management Team
Airports Sector
Mr. G Kiran Kumar – Chairman
Mr. B V N Rao- Chairman
Mr. Srinivas Bommidala- Chairman Mr. GBS Raju- Chairman
Corporate FunctionsCorporate Functions
GADLGADL
Govindan Sridharan, CEO
Finance & Systems
Subba Rao, Group CFO
Ashutosh Agarwala, CFO-SFD
Johny Paramian, Group CIO
Legal & Secretarial
Y M Shivamurthy, Group President Legal
Mr. C.P.Sounderarajan, Company Secretary
Other Shared Services
G.K.Raghunandanan, CEO-Procurement
Mr Sheshan Ranganathan, Head-Strategic Planning
Dr.Vijay Vancheswar, Head Communications
Deepak Bharara–Group FMS Head & Head HR GGCL

Key Investment Highlights
2 GMR : Leading Infrastructure Player
3 Airports : Building Gateways To India
4 Power : Lighting the World
5 Urban Infrastructure & Highways : Paths To Progress
6 Strong Management Team
7Financial Highlights
India : Secular Growth In Infrastructure1
Stock Prices & Shareholding Pattern
8

GIL Shareholding Pattern
Floating Shareholding(25.07% equity of the company) – As on May 29, 2009
58
35.54%
36.67%
6.17%
21.62%
FIIs
VC/FIs/Banks/MFs
Bodies Corporate
Retail incl. resident individuals, Trusts,HUF & others
1.5528,170,669Bodies Corporate
Category No. of Shares % Holding
Promoters 1,364,296,223 74.93
Foreign Institutional Investors 162,198,663 8.91
Venture Capital/ Domestic FIs/ Banks/ MFs 167,349,338 9.19
Retail including Indian Public, HUF and others 98,643,195 5.42
Total 1,820,658,088 100.00
1.5528,170,669Bodies Corporate
Category No. of Shares % Holding
Promoters 1,364,296,223 74.93
Foreign Institutional Investors 162,198,663 8.91
Venture Capital/ Domestic FIs/ Banks/ MFs 167,349,338 9.19
Retail including Indian Public, HUF and others 98,643,195 5.42
Total 1,820,658,088 100.00

Listing of shares on August 21, 2006 on Bombay Stock Exchange/National Stock Exchange
High / Low Price Per Share (Post Split)
Since Listing on 21st August 2006 : High - 269.80 (Dec. 06, 2007) / Low – 40.00 (Aug. 21, 2006)
In Q4 during Jan. 2009 to Mar 2009 : High – 102.80 (Mar 26, 2009) / Low – 62.10 (Jan 09, 2009)
In May 2009 : High – 173.65 (May 22, 2009) / Low – 105.60 (May 14, 2009)
Market Cap (on May 29, 2009) – Rs. 299,589.29 Mn
GIL Stock Performance
59
GIL Stock Price and Indices Comparison Outperformed Indices…..
55
200
345
490
635
21-Aug-06 14-Mar-07 5-Oct-07 27-Apr-08 18-Nov-08
Base
100
data for G
IL &
indice
s
GIL Sensex S&P CNX Nifty CNX Midcap CNX Nifty Junior
29-May-0955
200
345
490
635
21-Aug-06 14-Mar-07 5-Oct-07 27-Apr-08 18-Nov-08
Base
100
data for G
IL &
indice
s
GIL Sensex S&P CNX Nifty CNX Midcap CNX Nifty Junior
29-May-09

Key Investment Highlights
2 GMR : Leading Infrastructure Player
3 Airports : Building Gateways To India
4 Power : Lighting the World
5 Urban Infrastructure & Highways : Paths To Progress
6 Strong Management Team
7Financial Highlights
India : Secular Growth In Infrastructure1
Stock Prices & Shareholding Pattern
8

GMR Infrastructure : Consolidated Profit & Loss account
72
INR mn FY 2009 FY 2008 FY 2007 FY 2006
Gross Revenues 44,762 26,979 19,967 10,617
Airports 16,729 8,770 5,900 -
Power 21,527 15,530 12,127 9,000
Roads 1,523 1,397 1,440 1,504
Other 4,981 1,282 500 113
Less: AAI Share 4,570 4,031 3,000 -
Net Revenues 40,192 22,948 16,967 10,650
Operating Expenditure 29,522 16,963 11,531 6,086
EBIDTA 10,670 5,985 5,436 4,564
Other Income 212 698 183 33
Interest and Finance Charges 3,682 1,687 1,441 1,303
Depreciation 3,898 1,785 1,346 2,200
PBT 3,301 3,210 2,832 1,094
PAT (Before Minority Interest) 2,771 2,627 2,418 936
PAT (After Minority Interest) 2,794 2,101 1,744 706
Cash Profit 6,669 4,412 4,436 5,106
Cash Accruals 3,040 -290

GMR Infrastructure : Consolidated Balance Sheet
73
Sources of Funds FY 2009 FY 2008 FY 2007 FY 2006
Shareholder’s Funds 64,780 61,170 19,923 5,704
Minority Interest 18,060 11,130 5,261 4,243
Loan Funds 120,240 79,770 37,057 29,703
(a) Secured Loans 106,604 68,438 30,220 25,925
(b) Unsecured Loans 13,636 11,332 6,837 3,778
Deferred Tax Liabilities 190 430 144 2
Total Liabilities 203,270 152,500 62,385 39,652
Application of Funds
Gross Fixed Assets 114,330 66,920 41,481 24,559
Net Fixed Assets 96,520 52,700 28,999 13,508
Capital Work in Progress 67,910 45,230 19,060 16,318
Investments 14,110 49,000 2,625 2,557
Net Current Assets 24,730 5,570 11,701 7,269
Total Assets 203,270 152,500 62,385 39,652

GMR Infrastructure : Quarterly Financial Performance
Particulars Q4 FY 09 Q4 FY 08
Gross Revenue 14,434 10,017
Airports 4,020 2,560
Power 6,528 6,281
Roads 465 349
Others 3,421 827
Less: AAI Revenue Share 1,156 1,164
Net Revenue 13,278 8,853
Operating Expenditure 10,416 7,336
EBITDA 2,862 1,517
Other Income (7) 199
Interest & Finance Charges 1,152 678
Depreciation 1,105 574
PBT 598 464
PAT (Before Minority Interest) 412 413
PAT (After Minority Interest) 532 500
Cash Profit 1,517 987
74
INR MillionGross Revenue (Quarterly)
EBIDTA (Quarterly)
10878965910008
14434

GMR Infrastructure: Strong Revenue Growth
Gross revenues (Rs Mn)Gross revenues (Rs Mn)
EBITDA (Rs.Mn) EBITDA (Rs.Mn) PAT after MI (Rs.Mn) PAT after MI (Rs.Mn)
Gross assets (Rs.Mn)Gross assets (Rs.Mn)1 2
3 4

Thank You