pitfall of genome-wide association studies: sources of...
TRANSCRIPT

J. Biomedical Science and Engineering, 2012, 5, 557-573 JBiSE http://dx.doi.org/10.4236/jbise.2012.510069 Published Online October 2012 (http://www.SciRP.org/journal/jbise/)
Pitfall of genome-wide association studies: Sources of inconsistency in genotypes and their effects
Huixiao Hong1, Lei Xu2, Zhenqiang Su3, Jie Liu4, Weigong Ge1, Jie Shen1, Hong Fang3, Roger Perkins1, Leming Shi1, Weida Tong1
1Division of Bioinformatics and Biostatistics, National Center for Toxicological Research, US Food and Drug Administration, Jefferson, AR 72079, USA 2School of Materials Science and Engineering, Chang’an University, Xi’an, China 3ICF International at National Center for Toxicological Research, US Food and Drug Administration, Jefferson, AR 72079, USA 4Bioinformatics Graduate Program, University of Arkansas at Little Rock/University of Arkansas for Medical Sciences, Little Rock, AR 72079, USA Email: [email protected] Received 24 July 2012; revised 28 August 2012; accepted 6 September 2012
ABSTRACT
Personalized medicine will improve heath outcomes and patient satisfaction. However, implementing per- sonalized medicine based on individuals’ biological information is far from simple, requiring genetic bio- markers that are mainly developed and used by the pharmaceutical companies for selecting those patients who benefit more, or have less risk of adverse drug reactions, from a particular drug. Genome-wide Asso- ciation Studies (GWAS) aim to identify genetic vari- ants across the human genome that might be utilized as genetic biomarkers for diagnosis and prognosis. During the last several years, high-density genotyping SNP arrays have facilitated GWAS that successfully identified common genetic variants associated with a variety of phenotypes. However, each of the identified genetic variants only explains a very small fraction of the underlying genetic contribution to the studied phenotypic trait. The replication studies demon- strated that only a small portion of associated loci in the initial GWAS can be replicated, even within the same populations. Given the complexity of GWAS, multiple sources of Type I (false positive) and Type II (false negative) errors exist. The inconsistency in gen- otypes that caused either by the genotypeing experi- ment or by genotype calling process is a major source of the false GWAS findings. Accurate and reprodu- cible genotypes are paramount as inconsistency in genotypes can lead to an inflation of false associa- tions. This article will review the sources of inconsis- tency in genotypes and discuss its effect in GWAS findings. Keywords: Genotype; Association; Reproducibility; Inconsistency; Batch Effect; Genotyping Platform
1. INTRODUCTION
1.1. Personalized Medicine
The term “personalized medicine” was first used some 13 years ago [1] in the context widely understood today of “the right drug for the right patient with the right dose at the right time through the right route”. A more com- prehensive definition comes from the President’s Coun- cil of Advisors on Science Technology (PCAST): “‘Per- sonalized medicine’ refers to the tailoring of medical treatment to the individual characteristics of each patient. It does not literally mean the creation of drugs or medical devices that are unique to a patient, but rather the ability to classify individuals into subpopulations that differ in their susceptibility to a particular disease or their re- sponse to a specific treatment. Preventive or therapeutic interventions can then be concentrated on those who will benefit, sparing expense and side effects for those who will not [2].” The definition does not encompass design- ing drugs for sensitive subpopulations, a goal that may remain elusive absent the support and incentives for those who would carry out the requisite research and development.
A rapid increase in published articles referring to per- sonalized medicine as shown in Figure 1 is a testament to the significant and increasing scientific interest [3] that is driven by real medical needs and fostered by rapid advances in high density molecular technologies. The trend also reflects that personalized medicine has ev- olved from futuristic to the here and now, and portends that it will be a predominant challenge for the pharma- ceutical industry and regulatory science in the current century.
There is no doubt that personalized medicine will im- prove heath outcomes and patient satisfaction. However,
OPEN ACCESS

H. X. Hong et al. / J. Biomedical Science and Engineering 5 (2012) 557-573 558
Figure 1. Annual number of publications related to personal- ized medicine from 2001 to 2012 based on a keyword search in PubMed. Keyword used: personalized medicine; Fields search- ed: title and abstract. (Search was conducted on June 29, 2012). implementing personalized medicine based on individu- als’ biological information is far from simple, requiring translating scientific discoveries into therapies as well as fully applying scientific knowledge to ensure safety [4]. The pathway to bringing the safe therapies to the bedside and transforming clinical practice is a wide range of new biomarkers useful for prediction, diagnosis and prognosis. Biomarkers can be any specific and sensitive measures to reflect diseases or states of diseases for diagnosis, for predicting responses to drugs, and for disease monitoring during a therapy. They can be used as surrogate end- points in clinical practices and in drug development, or as components integrated in diagnostic tools for person- alized therapeutics.
According to the NIH Biomarkers Definitions Work- ing Group, a biomarker is “a characteristic that is object- tively measured and evaluated as an indicator of normal biological processes, pathogenic processes or a pharma- cological response to a therapeutic intervention [5].” This broad definition encompasses biomarkers used in diagnostic tests and any other measurement of a person’s health status or response to drugs. The discussion of biomarkers in this review will be constrained to molecu-lar biomarkers, which are defined to be a molecule or set of DNA, RNA, protein or metabolite molecules that can be measured and used as biomarkers for purposes such as assessment of clinical responses, identification of risks, or selection of doses and patients in drug development and clinical practices [6].
The use of molecular biomarkers in clinical practices, drug development, regulatory decision making, and post- market surveillance can facilitate the development of safer and more effective medicines and enhance the benefit-risk profile of approved drugs and the imple- mentation of personalized medicine. In the past two decades, advances in the development of molecular bio- markers have been made primarily by the pharmaceutical
companies and academic institutions. Many of the mo- lecular biomarkers have evolved as supportive evidence in proof-of-concept studies, but have not been further utilized to support regulatory apprsoval of drug products. However, some molecular biomarkers, including varia-tions in DNA, alterations in the levels of genes expressed and functional proteins, have been successfully used in support of drug approval by the FDA and in clinical practices.
1.2. Genetic Biomarkers for Personalized Medicine
DNA is the genetic code used in the development and functioning of all mammals. Variations in DNA se- quences (genetic variations) are the polymorphisms in a population or species caused by chromosome crossovers, genetic mutations, genetic drift, including single nucleo- tide polymorphisms (SNP), mutations, differences in copy number, insertions, deletions, duplications, and re- arrangements. A SNP, the most common polymorphism, is a single base mutation at a specific genomic locus. It consists of two alleles, where the rare allele frequency is at least 1%. Inter-individual variations in the DNA se- quences can be related with how humans develop dis- eases and respond to drugs. These genetic variations, in turn, can be used for discovery and validation of bio- markers for personalized medicine.
Genetic biomarkers are mainly developed and used by the pharmaceutical companies for selecting those pa- tients who benefit more, or have less risk of adverse drug reactions (ADRs), from a particular drug. Some of the genetic biomarkers currently on the market are used to personalize therapy. For example, human leukocyte an- tigen (HLA) allelic marker, HLA-B*5701, is a genetic biomarker that can be used to predict increased risk to develop abacavir-associated hypersensitivity reactions. Thus, it is recommended that its presence is assessed in patients with human immunodeficiency virus (HIV) prior to treatment with the antiretroviral drug, abacavir [7-9]. An example of how genetic biomarkers might prove useful for drug safety is the investigation of genes that encode proteins such as the cytochrome P450 enzymes that are responsible for metabolizing exogenous toxi- cants such as drugs. Genetic polymorphisms are preva- lent in these enzymes. Gene deletions, missense, non- sense, and splice-site mutations can abolish enzyme ac- tivity, whereas mutations causing amino acid substitu- tions can lead to markedly modified enzyme action.
A good example is the anticoagulant warfarin that is a drug for preventing blood clots. Individual response to warfarin varies so greatly that patients have to be closely monitored to adjust the dose during treatment to prevent hemorrhage that can result in fatal strokes, etc. Warfarin
Copyright © 2012 SciRes. OPEN ACCESS

H. X. Hong et al. / J. Biomedical Science and Engineering 5 (2012) 557-573 559
is mainly metabolized by enzyme CYP2C9 that exhibits wide genetically-based activity variation among patients [10,11]. Vitamin K epoxide reductase (VKORC1) is the target of this drug. Genetic variations of VKORC1 gene account for some of the dosing variation between indi- viduals. To reach safe therapeutic levels, some haplotype groups require larger doses while other haplotype groups require lower doses. Studies are underway to identify if genotyping patients for CYP2C9 and for VKORC1 polymorphisms can reduce the risk of adverse events and save money [12].
Another example of biomarkers enabling personalized medicine is the genetic testing of mutations in the KRAS gene (Kirsten ras) that cause lack of response to panitu- mumab and cetuximab in patients with metastatic colo- rectal cancer. KRAS is a protein that in humans is en- coded by the KRAS gene [13]. While the protein product of the non-mutated KRAS gene performs an essential function in normal tissue signaling, the mutated KRAS genes are potent oncogenes that play a role in many can- cers [14]. Recently, genetic studies revealed that the presence of mutations in the KRAS gene was associated with the response to panitumumab or cetuximab therapy in patients with colorectal cancer. The US Food and Drug Administration (FDA) accordingly updated the labels of these two anti-epidermal growth factor receptor (EGFR) antibody drugs, cetuximab (Erbitux®) and pani- tumumab (Vectibix®), incorporating information about testing for KRAS gene for mutations when treating for metastatic colorectal cancer. Testing allows physicians to rule out Erbitux® and Vectibix® as an option for pa- tients with mutated KRAS tumors, avoiding unnecessary treatments in patients who are unlikely to benefit.
A germline mutation is a genetic change in the lineage of germ cells and can be transmitted to offspring, while a somatic mutation is a genetic variation that neither in- herit from ancestor nor pass to offspring. Somatic muta- tions can occur in any types of cells except the germ cells (sperm and egg) and can (but do not always) cause can- cer or other diseases and different responses to drugs. Table 1 lists the genetic biomarkers mentioned in some drug labels approved by the FDA. All but the last are SNPs. However, interest and research are increasing for other DNA variants such as insertions and deletions as well as copy number variations.
1.3. GWAS for Discovery of Genetic Biomarkers
1.3.1. GWAS History In GWAS, genetic variants (SNPs) associated with phe- notypic traits such as disease status and drug response are identified through comparing case and control popu- lations. In 1996, Lander proposed the common disease, common variant model [15]. Based on both theoretical
Table 1. Genetic biomarkers mentioned in labels of drug prod- ucts approved by FDA [6].
Biomarker Drug Section in Label
PLAVIX® Clinical Pharmacology; Precautions; Dosage and Administration
VFEND® Clinical Pharmacology
EFFIENT® Use in Specific Populations; Clinical Pharmacology; Clinical Studies
CYP2C19
CELEBREX® Clinical Pharmacology
CELEBREX® Clinical Pharmacology
EFFIENT® Use in Specific Populations; Clinical Pharmacology; Clinical Studies
CYP2C9
COUMADIN® Clinical Pharmacology; Precautions
CELEBREX® Clinical Pharmacology
CYP3A4 Codeine sulfate
Drug Interactions; Clinical Pharmacology
CYP3A5 EFFIENT® Use in Specific Populations; Clinical Pharmacology; Clinical Studies
CYP2B6 EFFIENT® Use in Specific Populations; Clinical Pharmacology; Clinical Studies
STRATTERA®Dosage and Administration; Warnings and Precautions; Drug Interactions; Clinical Pharmacology
PROZAC® Clinical Pharmacology; PrecautionsCYP2D6
Codeine sulfate tablets
Warnings and Precautions; Drug Interactions; Use in Specific Populations; Clinical Pharmacology
VKORC1 COUMADIN® Clinical Pharmacology; Precautions
CAMPTOSAR® Clinical Pharmacology; Warnings; Dosage and Administration
UGT1A1
TASIGNA® Drug Interactions; Clinical Pharmacology
HLA-B*1502 TEGRETOL® Warnings; Precautions
HLA-B*5701 ZIAGEN® Warnings and Precautions
Deletion 5q REVLIMID®Hematologic Toxicity; Clinical Studies; Precautions; Adverse Reactions
arguments and examples of heterogeneity of disease- associated alleles, this model hypothesized that the ge- netic profile of widespread diseases is determined by genetic variants that are common in the population (fre- quency > 0.01) and have, individually, a small effect on the disease. This fits well in the scope of GWAS as, if this model is correct, the genetic basis of diseases can be discovered by searching for common variants with dif-
Copyright © 2012 SciRes. OPEN ACCESS

H. X. Hong et al. / J. Biomedical Science and Engineering 5 (2012) 557-573 560
ferent allele frequencies between cases and controls. To conduct a GWAS, both a map of all possible com-
mon genetic variants of human and a technology for massive parallel measurements of these variants are re- quired. Millions of common SNPs in human populations were determined and a genome-wide map of SNP-tagged haplotypes was derived from the SNPs by the Interna- tional HapMap project [16,17]. Concurrently, high- throughput SNP genotyping technology has advanced dramatically and now scientists can simultaneously in- terrogate hundreds of thousands of SNPs. GWAS has become a feasible and promising research field for ex- ploring associations between genetic variations and health outcomes.
In 2005, the first GWAS was published in which a functional SNP in the complement factor H was identi- fied to be associated with age-related macular degenera- tion [18]. Since then, GWAS has been successfully ap- plied to identify genetic variants associated with a vari- ety of phenotypes [19-39].
1.3.2. GWAS Workflow In a GWAS, markers across the genomes (complete sets of DNA) of many individuals are interrogated to find the associations between genetic variations and the disease for developing better strategies to detect, treat and pre- vent the disease. A GWAS is a complicated process de- picted in Figure 2. There are a few excellent review arti- cles that describe each step in a GWAS in great detail [40-42].
To carry out a GWAS, a case-control design is typi- cally used: people with the phenotypic trait being studied and normal individuals. A DNA sample from each par- ticipant is obtained, usually from blood, purified, and
Figure 2. Overview of workflow for a GWAS. First, cases and controls are selected and samples are genotyped. The raw data from the genotyping experiment are used to determine geno- types for SNPs of the samples. Downstream association analy- ses are conducted using the genotype data to identify signifi- cantly associated SNPs for the trait in study. Finally, interpreta- tion of the possible biological functions of significant SNPs may aid understanding of the trait.
placed on a small chip and measured on a machine automatically. In this way, each participant’s genome is interrogated for strategically selected genetic markers (SNPs). Thereafter, the raw data are used for determining genotypes of SNPs using a genotype calling algorithm. By comparing the genotypes, the SNPs with significantly different genotype frequencies between cases and con- trols are identified to be associated with the disease in study. However, the associated SNPs themselves may not directly cause the disease. Often, additional steps are needed to determine the causal genetic variation of the disease.
1.3.3. Sources of Inconsistency in Genotypes The basis of GWAS is the hypothesis common trait- common variant: the genetic architecture of complex traits comprises many common alleles, each of which could contribute a small risk to the individual [43]. The probability of identifying a significant SNP association is low. Therefore, a large number of samples are needed to achieve adequate statistical power. In addition, accu- rately determining genotypes is a crucial requirement for reliability of GWAS findings. Given the complexity of a GWAS and the huge amount of data generated, multiple sources of inconsistency in genotypes exist. The incon- sistency in genotypes caused in the genotyping experi- ment or in the genotype calling process is one of the most important factors that introduce both Type I and Type II errors in GWAS. Table 2 lists the potential sources of inconsistency in genotypes.
2. INCONSISTENCY IN GENOTYPES
2.1. Genotyping Experiments
Consistency in genotypes is important for GWAS be- cause inconsistency in genotypes can lead to spurious genetic associations. Repeatability and reproducibility of genotyping experiments are the measurements of consis- tency in the genotypes that can be determined from the experiments. Low repeatability and reproducibility in genotyping experiments diminish the accuracy of geno- types and may inflate the Type I and Type II error rate in GWAS.
2.1.1. Reproducibility of Genotyping Platforms A fundamental component of a GWAS is the platform (Figure 2) that is used to interrogate genotypes of SNPs of patients and control subjects. Errors generated in genotyping, especially if they are distributed different- tially between patients and controls, are potential sources of spurious associations in GWAS findings. Many diffi- culties exist for correcting or reducing errors or biases introduced in genotyping experiments.
The debates about SNP selection [44,45] that domi-
Copyright © 2012 SciRes. OPEN ACCESS

H. X. Hong et al. / J. Biomedical Science and Engineering 5 (2012) 557-573 561
Table 2. Potential sources of inconsistency in genotypes.
Step in GWAS Potential sources
Genotyping platforms Experiment
Generations of a genotyping platform
Genotype calling algorithms
Parameter settings of a calling algorithm Genotype calling
Genotype calling batch effect
nated the early discussions on GWAS are now mostly resolved and simplified to the choice of genotyping plat- forms, mainly between the two leaders, Affymetrix and Illumina. Despite the fact that these two offer similar coverage of common variants in the HapMap [41], dif- ferences in SNP coverage between Affymetrix and Illu- mina exist and are a potential source of Type II errors (losing significant associations). Since the designs of probe sets on SNP arrays, as well as the experimental protocols, are quite different between these two plat- forms, the consistency of common SNPs interrogated in both platforms is vital for obtaining reliable GWAS re- sults. This type of inconsistency may cause both Type I errors and Type II errors in GWAS [46]. Evaluation of variations between platforms has been reported [47] and is expected to be thoroughly assessed in the future.
We examined the reproducibility of genotyping tech- nology using two platforms, Affymetrix SNP array 6.0 (called Affy6 hereafter) and Illumina 1MDuo chip (called Illu1M hereafter), by assessing the consistency in genotypes between technical replicates of six subjects assayed in the same laboratories. DNA samples for the three HapMap subjects (NA10385, NA12449, and NA12448, coded as A, B, and C, respectively, in this review) are from a trio and were obtained from the HapMap consortium. The DNA samples of another three subjects (coded as D, E, and F in this review) are ex- tracted from anonymous human liver specimens and were obtained from the US Cooperative Human Tissue Network (CHTN).
To measure genotyping reproducibility, genotype con- cordances were calculated for all pair-wise comparisons between the technical replicates of the DNA samples from six subjects for each genotyping site. Heatmaps of results for Affy6 from three laboratories and for Illu1M from two laboratories are shown in Figures 3 and 4, re- spectively. The concordances between technical repli- cates of DNA samples from the same subject within a genotyping platform and within a genotyping labora- tory are greater than 99%. The averaged intra-platform and intra-laboratory genotype concordances for Affy6 are 99.04%, 99.48%, and 99.69% for genotyping Lab-1, Lab-2 and Lab-3, respectively, for an average of 99.40%
Figure 3. Concordance of genotypes between technical repli- cates from genotyping laboratories by using Affy6 platform. Each column and each row represent a technical replicate of a sample indicated by the sample codes at the x-axis and y-axis. with a standard deviation of 0.29%. Concordances for Illu1M are 99.90% and 99.85% for genotyping sites Lab-1 and Lab-2, respectively, for an average of 99.87% with a standard deviation of 0.10%. Therefore, high in- tra-platform and intra-laboratory genotyping reproduci- bility is observed by using technical replicates.
Copyright © 2012 SciRes. OPEN ACCESS

H. X. Hong et al. / J. Biomedical Science and Engineering 5 (2012) 557-573 562
Figure 4. Concordance of genotypes between technical repli- cates from genotyping laboratories by using Illu1M platform. Each column and each row represent a technical replicate of a sample indicated by the sample codes at the x-axis and y-axis.
2.1.2. Inconsistency between SNP Arrays Consistency in genotypes between different generations of the same genotyping platform is another concern and remains a challenge for GWAS. Different generations of genotyping platforms from both Affymetrix and Illumina have been delivered to the market and used in GWAS. For example, the Affymetrix GeneChip Human Mapping 500K array set (called Affy500K hereafter) has been used in published GWAS [32,48,49], but later Affy- metrix released the Affy6 to the market. As it is impor- tant to know whether genotypes determined with these two generations of SNP array are the same, we evaluated their consistency [47].
Genotypes of common SNPs were interrogated in both Affy500K and Affy6 SNP arrays using the 270 HapMap samples and were determined using the same calling algorithm, Birdseed. There are 482,215 SNPs common to both arrays. The scatter-plot in Figure 5(a) compares the missing call rates per SNP (percentage of SNPs that are not assigned to one of the three genotypes: homozygote, heterozygote, and variant homozygote) in the Affy500K
(x-axis) and in the Affy6 (y-axis). Each of the points represents one of the common SNPs. When a SNP is located on or near the diagonal line, it indicates that the missing call rate for the SNP is consistent between the Affy500k and the Affy6. From Figure 5(a), it can be seen that a large number of SNPs are not consistent in the missing call rates, some of which are very different between these two arrays. The scatter-plot in Figure 5(b) depicts the missing call rates of the 270 HapMap samples based on the common SNPs in the Affy500K (x-axes) and Affy6 (y-axes) arrays. From Figure 5(b), it can be seen that the inconsistencies in missing call rates per sample are much smaller than the missing call rates per SNP (Figure 5(a)). Moreover, it is observed that the missing call rates from the newer-generation Affy6 array are slightly lower than the missing call rates from the
(a)
(b)
Figure 5. Comparison of genotype calls be- tween SNP arrays. The missing call rates per SNP (a) and per sample (b) between arrays Affy500K and Affy6 are plotted for the com- parison. The diagonal lines indicate the loca- tions of SNPs (a) and samples (b) when their missing call rates are the same between the two arrays [47].
Copyright © 2012 SciRes. OPEN ACCESS

H. X. Hong et al. / J. Biomedical Science and Engineering 5 (2012) 557-573
Copyright © 2012 SciRes.
563
OPEN ACCESS
older-generation Affy500K array. The p-values of a paired two-sample t-test for comparing the missing call rates per SNP (Figure 5(a)) and missing call rates per sample (Figure 5(b)) are 0 and 5.057 × 10−60, respec- tively, indicating that the difference of missing call rates per SNP and per sample between the Affy500K and the Affy6 are statistically significant.
2.2. Genotype Calling
In GWAS, a genotype-calling algorithm assigns geno- types for SNPs from the raw intensity data prior to downstream association analysis for identifying associ- ated genetic variants. It is vital to know how reliable are the genotypes determined by the genotype calling proc- ess for assessing the utilization of GWAS findings.
2.2.1. Inconsistency between Calling Algorithms Many genotype calling algorithms have been developed. Thus, it is important to know how consistent are the genotypes determined by using the different genotype- calling algorithms, though each of the algorithms re-ported a high successful call rate and accuracy. We evaluated inconsistency in genotypes determined using three genotype calling algorithms (DM, BRLMM, and Birdseed) that were released along with three generations of SNP arrays from Affymetrix [47].
Raw data (CEL files) for the 270 HapMap samples were downloaded from the International HapMap project website (www.hapmap.org/downloads/raw_data/affy 500k/). These CEL files correspond to the Affy500K ar- ray. The file format is described on Affymetrix’s devel- oper pages (www.affymetrix.com/support/developer/ fusion/file_formats.zip). The chip description files (cdf) for both Nsp and Sty chips in the Affy500K and the files for annotating SNPs on chromosome X were also used when calling genotypes. They were downloaded from the Affymetrix website. The training set for using Birdseed on the Affy500K data was downloaded from the Broad Institute: www.broad.mit.edu/mpg/birdsuite/birdseed html.
Before calling genotypes, the quality of the raw data was assessed. All genotype calling by DM, BRLMM, and Birdseed reported in this review were conducted using apt-probeset-genotype of APT. The function apt-pro- beset-genotype enables many parameters to be changed by a user for each of the algorithms. The default values recommended by Affymetrix were used for all parame- ters.
The missing call rates per SNP and per sample were compared. Different missing call rates for many SNPs and samples were observed between the three algorithms. Furthermore, DM (single-chip based algorithm) has higher missing call rates compared to BRLMM and Bird- seed (multiple-chip based algorithms). However, the in- consistency between BRLMM and Birdseed is much smaller. The paired two-sample t-test was used to test if the call rates per SNP and per sample are significantly different between the three algorithms. The calculated p-values are listed in Table 3. They are less than 0.05 and thus the missing call rates are significantly different among the three algorithms.
Table 4 gives the consistency in genotypes between the three genotype calling algorithms. 538,774 (0.41%), 285,788 (0.21%), and 200,592 (0.15%) genotypes are different between DM and Birdseed, between Birdseed and BRLMM, and between DM and BRLMM, respec-tively. Figure 6(a) compares the concordance of geno-types between BRLMM and Birdseed stratified on three genotypes. The concordance for homozygous calls is higher than for heterozygous calls. Moreover, discor-dance between heterozygous and homozygous genotypes is higher than that between the two homozygous geno-types. The same comparisons between DM and Birdseed and between DM and BRLMM are shown in Figure 6(b) and 6(c), respectively. The similar trends are observed: homozygous calls being more consistent than heterozy- gous calls.
2.2.2. Genotype Calling Parameter Setting Genotype-calling usually requires many user-specified
Table 3. Statistical testing for genotype call rates.
Tested pair 95% confidence: mean
Calling 1 Calling 2 p-value
Low High
SNP rates Birdseed SNP rates BRLMM 5.1 × 10⁻¹⁸ −0.0319 −0.0201
Sample rates Birdseed Sample rates BRLMM 0.0003 −0.0400 −0.0120
SNP rates Birdseed SNP rates DM 0 2.1734 2.1967
Sample rates Birdseed Sample rates DM 1.3 × 10−142 2.1025 2.2676
SNP rates BRLMM SNP rates DM 0 2.2010 2.2211
Sample rates BRLMM Sample rates DM 1.3 × 10−149 2.1327 2.2894

H. X. Hong et al. / J. Biomedical Science and Engineering 5 (2012) 557-573 564
Table 4. Concordance of successful genotype calls.
Consistency Comparison Success Calls
Calls %
BRLMM vs. Birdseed 133925623 133639835 99.79
BRLMM vs. DM 131044600 130844008 99.85
Birdseed vs. DM 130897355 130358581 99.59
parameters be adjusted for a particular algorithm. For example, it should be decided a) whether normalization is conducted before a genotype-calling algorithm is ap- plied to determine genotypes based on the intensity data, and b) which normalization method, if required, should be used. There are also many algorithm-specific parame- ters that need to be set.
BLRMM first derives an initial guess for each SNP’s genotype using the DM algorithm [50] and then analyzes across SNPs to identify cases of non-monomorphisms. Thereafter, a prior distribution for cluster centers and variance-covariance matrices is estimated using the non-monomorphism SNPs. The prior distribution infor- mation of the SNPs and the clusters and variances of the initial genotype guesses are combined using a Bayesian procedure to calculate a posterior of cluster centers and variances. Genotypes of other SNPs are determined based on their Mahalanobis distances from the three cluster centers. Therefore, the parameters that specify the p-value cutoff for DM algorithm to include SNPs (de- fault is set to 0.17) and the number of SNPs to be used (default is set to 10,000) affect the prior distribution.
Different parameter values may cause inconsistent genotypes called. We investigated the effect of changing confidence threshold in the genotype-calling algorithm BRLMM [51].
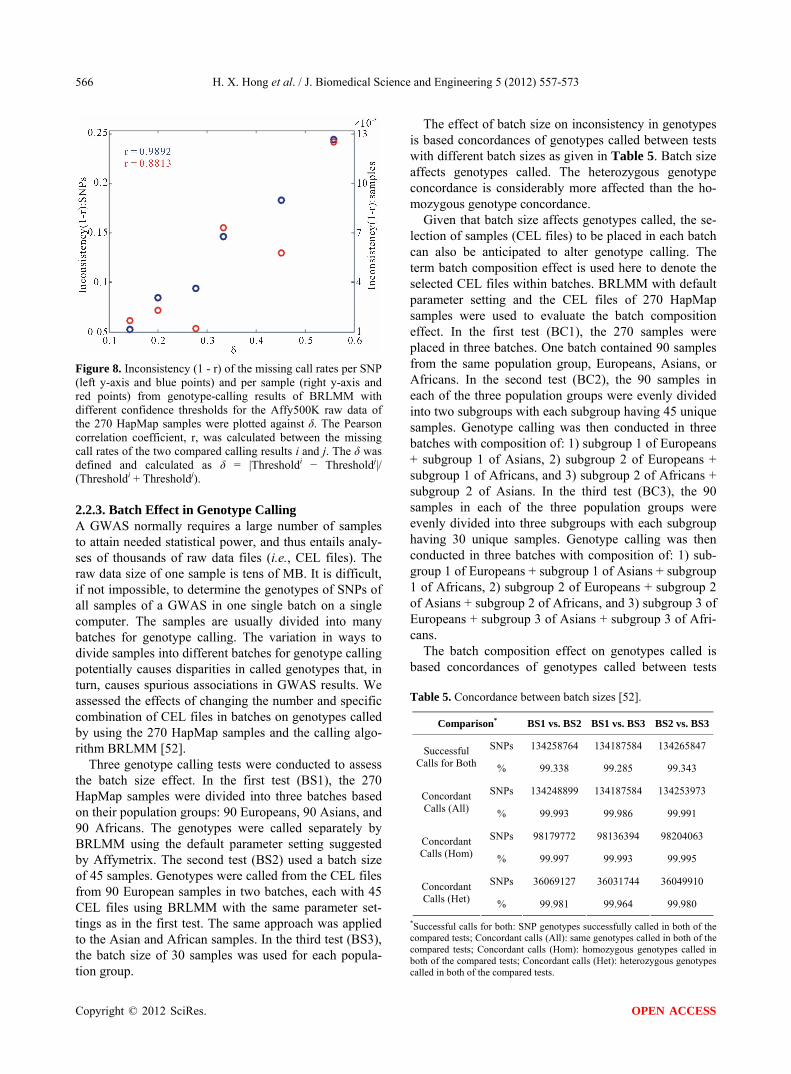
The comparisons of missing call rates per SNP (Fig- ure 7(a)) and per sample (Figure 7(b)) demonstrate that inconsistent genotype calls were generated from the same raw data when using BRLMM at confidence thresholds of 0.17, 0.30, 0.45, and 0.60 on the dataset of 270 HapMap samples. The Pearson-correlation coeffi- cients of the corresponding comparisons are given at the top of the scatter plots. T-tests were performed to deter- mine whether two sets of missing call rates from a nor- mal distribution could have the same mean when the unknown standard deviations are assumed equal. The resulting p-values for the comparisons are less than 0.0001, indicating that missing call rates per sample and per SNP are statistically different. Furthermore, the in- consistency (defined as 1 - r) of missing call rates are positively related to the corresponding differences be- tween the thresholds used, and negatively related to the sum of thresholds of the compared calling experiments (Figure 8).
(a)
(b)
(c)
Figure 6. Comparison of genotype calls between calling algo- rithms. The concordances of homozygote calls (AA), het- erozygote calls (AB), and variant homozygote calls (BB) be- tween BRLMM and Birdseed (a), between DM and Birdseed (b), and between DM and BRLMM (c) are shown by the bars in the left panels (left y-axes). The blue bars represent ratios ( 1 2 1
g gA A An n , g = AA or AB or BB) of the numbers of specific
genotypes by both algorithms ( 1 2gA An ) to the totals of corre-
sponding genotypes from the first algorithm A1 ( 1gAn ) (A1 =
BRLMM (a) and DM ((b) and (c)). The red bars are for
1 2 2g gA A An n where 2
gAn are totals from the second algorithms
(A2 = Birdseed (a) and (b) and BRLMM (c)). The discordant successful genotype calls between two algorithms are depicted in the right panels of (a)-(c) (right y-axes) [47].
Copyright © 2012 SciRes. OPEN ACCESS

H. X. Hong et al. / J. Biomedical Science and Engineering 5 (2012) 557-573 565
(a)
(b)
Figure 7. The missing call rates per SNP (a) and per sample (b) from geno- type-calling results of BRLMM with different thresholds for the Affy500K raw data of the 270 HapMap samples are plotted for pair-wise comparisons. The diagonal lines indicate that the missing call rates are the same in the two compared calling results. The Pearson correlation coefficients between the missing call rates of the two compared calling results are given on the top of corresponding scatter plots [51].
Copyright © 2012 SciRes. OPEN ACCESS
H. X. Hong et al. / J. Biomedical Science and Engineering 5 (2012) 557-573 566
Figure 8. Inconsistency (1 - r) of the missing call rates per SNP (left y-axis and blue points) and per sample (right y-axis and red points) from genotype-calling results of BRLMM with different confidence thresholds for the Affy500K raw data of the 270 HapMap samples were plotted against δ. The Pearson correlation coefficient, r, was calculated between the missing call rates of the two compared calling results i and j. The δ was defined and calculated as δ = |Thresholdi − Thresholdj|/ (Thresholdi + Thresholdj).
2.2.3. Batch Effect in Genotype Calling A GWAS normally requires a large number of samples to attain needed statistical power, and thus entails analy- ses of thousands of raw data files (i.e., CEL files). The raw data size of one sample is tens of MB. It is difficult, if not impossible, to determine the genotypes of SNPs of all samples of a GWAS in one single batch on a single computer. The samples are usually divided into many batches for genotype calling. The variation in ways to divide samples into different batches for genotype calling potentially causes disparities in called genotypes that, in turn, causes spurious associations in GWAS results. We assessed the effects of changing the number and specific combination of CEL files in batches on genotypes called by using the 270 HapMap samples and the calling algo-rithm BRLMM [52].
Three genotype calling tests were conducted to assess the batch size effect. In the first test (BS1), the 270 HapMap samples were divided into three batches based on their population groups: 90 Europeans, 90 Asians, and 90 Africans. The genotypes were called separately by BRLMM using the default parameter setting suggested by Affymetrix. The second test (BS2) used a batch size of 45 samples. Genotypes were called from the CEL files from 90 European samples in two batches, each with 45 CEL files using BRLMM with the same parameter set- tings as in the first test. The same approach was applied to the Asian and African samples. In the third test (BS3), the batch size of 30 samples was used for each popula- tion group.
The effect of batch size on inconsistency in genotypes is based concordances of genotypes called between tests with different batch sizes as given in Table 5. Batch size affects genotypes called. The heterozygous genotype concordance is considerably more affected than the ho- mozygous genotype concordance.
Given that batch size affects genotypes called, the se- lection of samples (CEL files) to be placed in each batch can also be anticipated to alter genotype calling. The term batch composition effect is used here to denote the selected CEL files within batches. BRLMM with default parameter setting and the CEL files of 270 HapMap samples were used to evaluate the batch composition effect. In the first test (BC1), the 270 samples were placed in three batches. One batch contained 90 samples from the same population group, Europeans, Asians, or Africans. In the second test (BC2), the 90 samples in each of the three population groups were evenly divided into two subgroups with each subgroup having 45 unique samples. Genotype calling was then conducted in three batches with composition of: 1) subgroup 1 of Europeans + subgroup 1 of Asians, 2) subgroup 2 of Europeans + subgroup 1 of Africans, and 3) subgroup 2 of Africans + subgroup 2 of Asians. In the third test (BC3), the 90 samples in each of the three population groups were evenly divided into three subgroups with each subgroup having 30 unique samples. Genotype calling was then conducted in three batches with composition of: 1) sub- group 1 of Europeans + subgroup 1 of Asians + subgroup 1 of Africans, 2) subgroup 2 of Europeans + subgroup 2 of Asians + subgroup 2 of Africans, and 3) subgroup 3 of Europeans + subgroup 3 of Asians + subgroup 3 of Afri- cans.
The batch composition effect on genotypes called is based concordances of genotypes called between tests Table 5. Concordance between batch sizes [52].
Comparison* BS1 vs. BS2 BS1 vs. BS3 BS2 vs. BS3
SNPs 134258764 134187584 134265847Successful Calls for Both % 99.338 99.285 99.343
SNPs 134248899 134187584 134253973Concordant Calls (All) % 99.993 99.986 99.991
SNPs 98179772 98136394 98204063Concordant Calls (Hom) % 99.997 99.993 99.995
SNPs 36069127 36031744 36049910Concordant Calls (Het) % 99.981 99.964 99.980
*Successful calls for both: SNP genotypes successfully called in both of the compared tests; Concordant calls (All): same genotypes called in both of the compared tests; Concordant calls (Hom): homozygous genotypes called in both of the compared tests; Concordant calls (Het): heterozygous genotypes called in both of the compared tests.
Copyright © 2012 SciRes. OPEN ACCESS

H. X. Hong et al. / J. Biomedical Science and Engineering 5 (2012) 557-573 567
with different batch compositions as given in Table 6. Batch composition affects the genotypes called. Fur- thermore, the effect on heterozygous genotypes is con- siderably larger than for homozygous genotypes, since the concordance for heterozygous genotypes is lower than the corresponding concordance for homozygous genotypes.
3. IMPACT OF INCONSISTENCY IN GENOTYPES
The objective of GWAS is to identify associated genetic markers. It is critical to evaluate whether and how incon-sistency in genotypes impacts the significant SNPs iden-tified in the downstream association analysis.
3.1. Discordant Genotypes Generated in Genotyping Experiment Affect GWAS Findings
Inconsistency in genotypes generated in genotyping ex- periment could be considered small. However, since most genetic markers identified in GWAS confer very small relative risks, a very small error in genotyping could inflate in GWAS, resulting false associations.
To assess the effect of discordant genotypes on the associated SNPs identified in GWAS, simulations were conducted to estimate the effect of discordant genotypes on the associated SNPs identified in GWAS. First, a data set with a case population of 5000 samples and a control population of 5000 samples was generated in which the same minor allele frequency was applied to the case and control populations separately. Thus, the original data had an odds ratio of exactly one. Thereafter, a fixed concordant rate in genotypes was randomly applied to the data set and an odds ratio was calculated on the Table 6. Concordance between batch compositions [52].
Comparison* BC1 vs. BC2 BC1 vs. BC3 BC2 vs. BC3
SNPs 134128046 134063768 134107787Successful Calls for Both % 99.241 99.194 99.226
SNPs 134109060 134036623 134095792Concordant Calls (All) % 99.986 99.980 99.991
SNPs 98050788 97992008 98016851Concordant Calls (Hom) % 99.989 99.983 99.993
SNPs 36058272 36044165 36078941Concordant Calls (Het) % 99.977 99.970 99.985
*Successful calls for both: genotype successfully called in both of the com- pared tests; Concordant calls (All): same genotype called in both of the compared tests; Concordant calls (Hom): homozygous genotype called in both of the compared tests; Concordant calls (Het): heterozygous genotype called in both of the compared tests.
simulated data. The process was repeated 50,000 times for a pair of minor allele frequency and concordant rate. Therefore, 50,000 odds ratio values were obtained for a pair of minor allele frequency and concordant rate. Then, minor allele frequency and concordant rate were changed from 0 to 0.4 and from 1.00 to 0.94 in steps of 0.01 and 0.001, respectively. In the similar way, 50,000 odds ra- tios were simulated for each of all of the combinations of minor allele frequency values and concordant rates.
Figure 9 shows the simulation results. The odds ratios are not caused by differences in minor allele frequencies for control and case populations in the simulations but
(a)
(b)
Figure 9. Results of simulating the effect of inconsistency of genotypes on the significant genetic biomarkers identified in GWAS. Odds ratios were simulated for 50,000 times for each pair of a genotype concordance (from 0.94 to 1.00 with a step of 0.001) and a minor allele frequency (MAF from 0.01 to 0.40 with a step of 0.01) by using a case population of 5000 samples and a control sample size of 5000 samples. Relationship be- tween top 5% the 50,000 odds ratio values, concordance in genotypes, and minor allele frequency is depicted in (a). The intersection curves at minor allele frequency values 0.05, 0.10, and 0.20 are shown in (b).
Copyright © 2012 SciRes. OPEN ACCESS

H. X. Hong et al. / J. Biomedical Science and Engineering 5 (2012) 557-573 568
are caused by inconsistency in genotypes simulated. Figure 9(a) gives the top five percentile values of the odds ratios and Figure 9(b) plots the relationship be- tween the five percentile odds ratio and concordance in genotypes for some fixed minor allele frequency values. The trend is obvious in which the smaller the minor al- lele frequency and the larger the inconsistency in geno- types (the lower the consistency in genotypes), the larger the spurious (simulated) odds ratio. Therefore, the results demonstrate that a very small inconsistency in genotypes could substantially change odds ratios of genetic markers and thereby alter the final GWAS findings.
3.2. Propagation of Inconsistency of Calling Algorithm to Associated SNPs
To assess propagation of the inconsistency in genotypes determined by different calling algorithms to the signify- cant SNPs identified in the downstream analysis in GWAS, three case-control mimics based association analyses were conducted for each of the sets of geno- types obtained using calling algorithms DM, BRLMM, and Birdseed. These analyses used 270 HapMap samples interrogated using the Affy500K (see section 2.2.1 for details). The lists of SNPs significantly associated with the case-control mimics were compared between the three calling algorithms.
The comparisons of the significant SNPs obtained from the one degree of freedom allelic association tests and the two degree of freedom genotypic association tests are given in Figures 10(a) and (b), respectively. It is clear that, for all case-control mimics and for both allelic and genotypic tests, the inconsistency in genotypes be- tween the three algorithms causes disparity among lists of significant SNPs. For example, 1593, 1349, and 1873 SNPs from DM, BRLMM, and Birdsee, respectively, are identified using genotypic association testing to be sig- nificantly associated with the mimic using European as “case” but not significant when the other two algorithms are used to genotype call these SNPs. These SNPs could be false positive associations when using one algorithm or true positive associations that may be lost when using the other two algorithms. There are 941 SNPs from both DM and BRLMM, 254 SNPs from both DM and Bird- seed, and 9473 SNPs from both BRLMM and Birdseed that are significantly associated with the mimic using European as “case” by the same genotypic association testing but not significant for Birdseed, BRLMM, and DM, respectively. Therefore, these SNPs might be true positive associations that could be lost when using one calling algorithms or false positive associations when using the other two algorithms. The similar observations can be seen from Figures 10(a) and (b) for all allelic as- sociation and genotypic association analyses with the
(a)
(b)
Figure 10. Comparisons of the lists of associated SNPs be- tween calling algorithms DM, BRLMM, and Birdseed for as- sessing propagations of the inconsistency in genotypes to asso- ciation SNPs. The significantly associated SNPs identified using allelic association test (a) and genotypic association test (b) were compared between algorithms DM (numbers in the circles with solid lines), BRLMM (numbers in the circles with dash lines), and Birdseed (numbers in the circles with dot lines). EU: the association analyses results for European versus others; AF: for African versus others; AS: for Asian versus others [47]. mimics using Asian or African as “case”.
We examined in which procedure of the downstream analysis, the quality control (QC) or the statistical testing for association, the inconsistency in genotypes between the three algorithms propagates into, by tracing the whole process of the downstream analysis and identify- ing whether the inconsistent SNPs failed to pass the QC or the statistical testing.
For the SNPs that are identified as significant using one algorithms but not significant using the other two algorithms, the distributions of SNPs failed in QC and in statistical test for all the association analyses are shown in Figure 11. QC is more affected by the SNPs missed from DM, while statistical testing for association con- tributes relatively more to the missed SNPs by BRLMM and Birdseed.
For the SNPs that are identified as significant using two algorithms but not significant using the other algo- rithm, the distributions of SNPs failed in QC and in sta- tistical test for all the association analyses are given in Figure 12. QC is more affected for the SNPs missed by DM and Birdseed, while statistical testing for association contributes relatively more to the SNPs missed by BRLMM.
3.3. Propagation of Algorithmic Parameter Effect to Associated SNPs
The comparisons of the significantly associated SNPs
Copyright © 2012 SciRes. OPEN ACCESS

H. X. Hong et al. / J. Biomedical Science and Engineering 5 (2012) 557-573 569
Figure 11. Significant SNPs identified by one algorithm but not by the other two. The red bars (genotypic association tests) and the blue bars (allelic association tests) give the numbers of SNPs identified as significant in association tests by DM but not by BRLMM and Birdseed, the magenta bars (genotypic association tests) and the cyan bars (allelic association tests) represent the numbers of SNPs identified as significant in asso- ciation tests by BRLMM but not by DM and Birdseed, and the yellow bars (genotypic association tests) and the green bars (allelic association tests) indicate the numbers of SNPs identi- fied as significant in association tests by Birdseed but not by DM and BRLMM. In each group of bars (by color), the first bar is for the design using African as “case”, the second using Asian as “case”, and the third using European as “case”. The percentages of the SNPs failed in QC among the totals are plotted in solid circles (for DM), solid diamons (for BRLMM), solid up-triangles (for Birdseed) and the ones that failed the association tests denoted by the empty shapes for the corre- sponding bars. obtained from calling results with different parameter settings (see section 2.2.2 for detail) are given in Figure 13. Threshold effect on genotype calling is propagated into the downstream association analyses since, for any statistical tests (genotypic: left column; allelic: right column) and case-control mimics (Asian as case: first row; European as case: second row; African as case: last row), there are discordances for the significantly associ- ated SNPs identified between different thresholds.
Interestingly, the mimic using African as “case” iden- tified more significantly associated SNPs compared with the mimics using Asian or European as “case”. Addition- ally, the significantly associated SNPs from the African mimic are less discordant than those from the Asian and European mimics when comparing between different parameter settings. This finding is related with genetic diversity of different population groups of the HapMap samples used: the African is more genetically distinct compared to the Asian and European. Therefore, incon- sistency in genotypes might be more amplified in the significantly associated SNPs for weaker traits than for stronger traits. The traits of reported GWAS are usually much weaker compared with the population differences
Figure 12. Significant SNPs identified in two algorithms but failed in the other one. The red bars (genotypic association tests) and the blue bars (allelic association tests) give the numbers of SNPs identified as significant in association tests by BRLMM and Birdseed but not by DM, the magenta bars (genotypic as- sociation tests) and the cyan bars (allelic association tests) rep- resent the numbers of SNPs identified as significant in associa- tion tests by Birdseed and DM but not by BRLMM, and the yellow bars (genotypic association tests) and the green bars (allelic association tests) indicate the numbers of SNPs identi-fied as significant in association tests by DM and BRLMM but not by Birdsed. In each group of bars (by color), the first bar is for the design using African as “case”, the second using Asian as “case”, and the third using European as “case”. The per- centages of the SNPs that failed in QC among the totals are plotted in solid circles (for DM), solid diamond (for BRLMM), solid up-triangles (for Birdseed) and the ones that failed the association tests denoted by the empty shapes for the corre-sponding bars. of the HapMap samples. A smaller number of concordant significantly associated SNPs are expected in real GWAS.
3.4. Propagation of Batch Effect to Associated SNPs
To assess propagation of the batch effect to the down- stream analysis in GWAS, association analyses on the genotypes determined by BRLMM with different batch sizes and compositions (see section 2.2.3 for detail) were conducted by using the same three case-control mimics: European versus Asian and African; Asian versus Euro- pean and African; African versus Asian and European. Before association testing, low quality SNPs were re- moved by QA/QC. Venn diagrams in Figure 14 compare the SNPs significantly associated with the same popula- tion group in genotypic association test using the geno- types determined by BRLMM with different batch sizes and compositions.
Figure 14 demonstrates that the batch size and com- position effects on inconsistency in genotypes propagate
Copyright © 2012 SciRes. OPEN ACCESS

H. X. Hong et al. / J. Biomedical Science and Engineering 5 (2012) 557-573
Copyright © 2012 SciRes.
570
Figure 13. Comparisons of the significantly associated SNPs identified in the association analyses using the genotype calling results with thresholds. The numbers in ellipses are the significantly associated SNPs identi- fied in association analyses using calling results from different thresholds: pink for threshold = 0.17, blue for threshold = 0.30, green for threshold = 0.45, and purple for threshold = 0.60. Numbers in the sections of el- lipses represent the significantly associated SNPs shared by the corresponding thresholds. Left column (a), (c), (e) are the results from genotypic associations; right column (b), (d), (f) are from the allelic associations. First row (a), (b): The association analyses results using Asian population as case; Second row (c), (d): The results using European as case; and the last row (e), (f): The results using African as case [51].
The more homogeneity in the samples of the batches, the smaller the inconsistency in genotypes called and the more the common significantly associated SNPs identi- fied in the downstream analysis. Thus, we suggest that genotype calling should be conducted using large and uniform batch sizes with high homogeneity of samples in the same batches.
into the downstream association analyses. Further exam- ining the significantly associated SNPs common to the compared batch sizes and compositions observe that the larger the batch size differences, the fewer the common significantly associated SNPs; the larger the batch com- position difference in genetic homogeneity, the fewer the common significantly associated SNPs.
In summary, batch size and composition affect incon- sistency in genotypes called by using BRLMM and downstream analysis results in GWAS. The larger the batch size differences, the larger the inconsistency in genotypes called and the fewer the common significantly associated SNPs identified in the downstream analysis.
4. FUTURE PERSPECTIVES
GWAS, as well as the subsequent replication studies, have been used to identify and validate genetic variants associated with many phenotypic traits. However, these associated genetic variants tend to exhibit very small
OPEN ACCESS

H. X. Hong et al. / J. Biomedical Science and Engineering 5 (2012) 557-573 571
(a)
(b)
Figure 14. Comparisons of the lists of significantly associated SNPs between batch sizes (a) and batch compositions (b) for assessing propagations of batch effect to association SNPs. The numbers in circles are the significantly associated SNPs identi- fied using genotype calling results from different batch sizes (a): BS1 (circles of solid lines); BS2 (circles of dash lines); BS3 (circles of dot lines); and from different batch compositions (b): BC1 (circles of solid lines); BC2 (circles of dash lines); BC3 (circles of dot lines). EU: the association analyses results for European versus others; AF: for African versus others; AS: for Asian versus others [52]. effects on the studied phenotypic traits and only explain a rather small portion of the heritability. Therefore, there is a long way to go before scientists approach complete understanding of mechanisms of complex phenotypic traits and dissect their genetic architecture.
In addition to many possible sources of spurious asso- ciations such as sample size and population stratification that have been investigated and discussed intensively, consistent genotypes are required for concordant GWAS results from different studies. However, inconsistency in genotypes generated in the genotyping experiment and in the genotype calling may cause both Type I and Type II errors. In our opinion, translation of GWAS findings to clinical practices and personalized medicine and nutria- tion remains a huge challenge. We still need to under- stand the potential spurious association results caused by inconsistency in genotypes and derive methods to de- crease such inconsistency and consequential spurious associations.
Next-generation sequencing is fundamentally chang- ing the way in which genomic information of individuals at the DNA level is being obtained for better under- standing of the human genome [53-58]. It is expected that the genotypes determined by using next-generation sequencing technologies are much more accurate than those obtained from the SNP array technology and thus the inconsistency in genotypes will be reduced, if not
near elimination. Therefore, we can look to a brighter future wherein advances in genotyping technologies lead to improved consistency in genotypes that, in turn, lead to more reliable GWAS findings.
5. ACKNOWLEDGEMENTS
The views presented in this article do not necessarily reflect those of
the US Food and Drug Administration.
REFERENCES
[1] Langreth, R. and Waldholz, M. (1999) New era of per-sonalized medicine: Targeting drugs for each unique ge-netic profile. Oncologist, 4, 426-427.
[2] President’s Council of Advisors on Science Technology (2008) Priorities for personalised medicine. http://www.whitehouse.gov/files/documents/ostp/PCAST/pcast_report_v2.pdf
[3] Jorgensen, J.T. (2009) New era of personalized medicine: A 10-year anniversary. Oncologist, 14, 557-558. doi:10.1634/theoncologist.2009-0047
[4] Hamburg, M.A. and Collins, F.S. (2010) The path to personalized medicine. The New England Journal of Medicine, 363, 301-304. doi:10.1056/NEJMp1006304
[5] Biomarkers Definitions Working Group (2001) Bio-markers and surrogate endpoints: Preferred definitions and conceptual framework. Clinical Pharmacology & Therapeutics, 69, 89-95. doi:10.1067/mcp.2001.113989
[6] Hong, H., Goodsaid, F., Shi, L. and Tong, W. (2010) Molecular biomarkers: A US FDA effort. Biomarkers in Medicine, 4, 215-225. doi:10.2217/bmm.09.81
[7] Lucas, A., Nolan, D. and Mallal, S. (2007) HLA-B*5701 screening for susceptibility to abacavir hypersensitivity. Journal of Antimicrobial Chemotherapy, 59, 591-593. doi:10.1093/jac/dkl557
[8] Mallal, S., Phillips, E., Carosi, G., et al. (2008) HLA- B*5701 screening for susceptibility to abacavir hypersen-sitivity. The New England Journal of Medicine, 358, 568-569. doi:10.1056/NEJMoa0706135
[9] Table of valid genomic biomarkers in the context of ap-proved drug labels. http://www.fda.gov/Drugs/ScienceResearch/ResearchAreas/Pharmacogenetics/ucm083378.htm
[10] Sanderson, S., Emery, J. and Higgins, J. (2005) CYP2C9 gene variants, drug dose, and bleeding risk in warfarin- treated patients: A HuGEnet™ systemic review and meta-analysis. Genetics in Medicine, 7, 97-104. doi:10.1097/01.GIM.0000153664.65759.CF
[11] Takahashi, H., Wilkinson, G.R., Nutescu, E.A., et al. (2006) Different contributions of polymorphisms in VKORC1 and CYP2C9 to intra- and inter-population differences in maintenance doses of warfarin in Japanese, Caucasians and African Americans. Pharmacogenet Ge-nomics, 16, 101-110. doi:10.1097/01.fpc.0000184955.08453.a8
[12] Kim, M.J., Huang, S.M., Meyer, U.A., et al. (2009) A
Copyright © 2012 SciRes. OPEN ACCESS

H. X. Hong et al. / J. Biomedical Science and Engineering 5 (2012) 557-573 572
regulatory science perspective on warfarin therapy: A pharacogenetic opportunity. The Journal of Clinical Phar- macology, 49, 138-146. doi:10.1177/0091270008328098
[13] McGrath, J.P., Capon, D.J., Smith, D.H., et al. (1983) Structure and organization of the human Ki-ras proto- oncogene and a related processed pseudogene. Nature, 304, 501-506. doi:10.1038/304501a0
[14] Kranenburg, O. (2005) The KRAS oncogene: Past, pre-sent, and future. Biochimica et Biophysica Acta, 1756, 81-82.
[15] Lander, E.S. (1996) The new genomics: Global views of biology. Science, 274, 536-539. doi:10.1126/science.274.5287.536
[16] The International HapMap Consortium (2005) A haplo- type map of the human genome. Nature, 437, 1299-1320. doi:10.1038/nature04226
[17] The International HapMap Consortium (2007) A second generation human haplotype map of over 3.1 million SNPs. Nature, 449, 851-862. doi:10.1038/nature06258
[18] Klein, R.J., Zeiss, C., Chew, E.Y., et al. (2005) Comple- ment factor H polymorphism in age-related macular de- generation. Science, 308, 385-389. doi:10.1126/science.1109557
[19] Dupuis, J., Langenberg, C., Prokopenko, I., et al. (2010) New genetic loci implicated in fasting glucose homeosta-sis and their impact on TYPE 2 DIABETES risk. Nature Genetics, 42, 105-116. doi:10.1038/ng.520
[20] Saxena, R., Hivert, M.F., Langenberg, C., et al. (2010) Genetic variation in GIPR influences the glucose and in- sulin responses to an oral glucose challenge. Nature Ge- netics, 42, 142-148. doi:10.1038/ng.521
[21] Sparsø, T., Bonnefond, A., Andersson, E., et al. (2009) G-allele of intronic rs10830963 in MTNR1B confers in-creased risk of impaired fasting glycemia and TYPE 2 DIABETES through an impaired glucose-stimulated in-sulin release: Studies involving 19,605 Europeans. Dia-betes, 58, 1450-1456. doi:10.2337/db08-1660
[22] Lavedan, C., Licamele, L., Volpi, S., et al. (2008) Asso-ciation of the NPAS3 gene and five other loci with re-sponse to the antipsychotic iloperidone identified in a whole genome association study. Molecular Psychiatry, 14, 804-819. doi:10.1038/mp.2008.56
[23] Turner, S.T., Bailey, K.R., Fridley, B.L., et al. (2008) Genomic association analysis suggests chromosome 12 locus influencing antihypertensive response to thiazide diuretic. Hypertension, 52, 359-365. doi:10.1161/HYPERTENSIONAHA.107.104273
[24] Takeuchi, F., McGinnis, R., Bourgeois, S., et al. (2009) A genome-wide association study confirms VKORC1, CYP2- C9, and CYP4F2 as principal genetic determinants of warfarin dose. PLOS Genetics, 5, Article ID: E1000433. doi:10.1371/journal.pgen.1000433
[25] Kindmark, A., Jawaid, A., Harbron, C.G., et al. (2008) Genome-wide pharmacogenetic investigation of a hepatic adverse event without clinical signs of immunopathology suggests an underlying immune pathogenesis. The Phar- macogenomics Journal, 8, 186-195. doi:10.1038/sj.tpj.6500458
[26] Daly, A.K., Donaldson, P.T., Bhatnagar, P., et al. (2009) HLA-B*5701 genotype is a major determinant of drug in-duced liver injury due to flucloxacillin. Nature Genetics, 41, 816-819. doi:10.1038/ng.379
[27] Zeggini, E., Weedon, M.N., Lindgren, C.M., et al. (2007) Replication of genome-wide association signals in UK samples reveals risk loci for type 2 diabetes. Science, 316, 1336-1341. doi:10.1126/science.1142364
[28] Scott, L.J., Mohlke, K.L., Bonnycastle, L.L., et al. (2007) A genome-wide association study of type 2 diabetes in Finns detects multiple susceptibility variants. Science, 316, 1341-1345. doi:10.1126/science.1142382
[29] Sladek, R., Rocheleau, G., Rung, J., et al. (2007) A ge- nome-wide association study identifies novel risk loci for type 2 diabetes. Nature, 445, 881-885. doi:10.1038/nature05616
[30] Steinthorsdottir, V., Thorleifsson, G., Reynisdottir, I., et al. (2007) A variant in CDKAL1 influences insulin re- sponse and risk of type 2 diabetes. Nature Genetics, 39, 770-775. doi:10.1038/ng2043
[31] Rung, J., Cauchi, S., Albrechtsen, A., et al. (2009) Ge- netic variant near IRS1 is associated with type 2 diabetes, insulin resistence and hyperinsulinemia. Nature Genetics, 41, 1110-1115. doi:10.1038/ng.443
[32] Wellcome Trust Case Control Consortium (2007) Ge- nome-wide association study of 14,000 cases of seven common diseases and 3000 shared controls. Nature, 447, 661-678. doi:10.1038/nature05911
[33] Raelson, J.V., Little, R.D., Ruether, A., et al. (2007) Ge-nome-wide association study for Crohn’s disease in the Quebec Founder Population identifies multiple validated disease loci. Proceedings of the National Academy of Sciences USA, 104, 14747-14752. doi:10.1073/pnas.0706645104
[34] Smyth, D.J., Cooper, J.D., Bailey, R., et al. (2006) A genome-wide association study of nonsynonymous SNPs identifies a type 1 diabetes locus in the interferon-induced helicase (IFIH1) region. Nature Genetics, 38, 617-619. doi:10.1038/ng1800
[35] Gudmundsson, J., Sulem, P., Manolescu, A., et al. (2007) Genome-wide association study identifies a second pros-tate cancer susceptibility variant at 8q24. Nature Genetics, 39, 631-637. doi:10.1038/ng1999
[36] van Heel, D.A., Franke, L., Hunt, K.A., et al. (2007) A genome-wide association study for celiac disease identi-fies risk variants in the region harboring IL2 and IL21. Nature Genetics, 39, 827-829. doi:10.1038/ng2058
[37] Tomlinson, I., Webb, E., Carvajal-Carmona, L., et al. (2007) A genome-wide association scan of tag SNPs identifies a susceptibility variant for colorectal cancer at 8q24.21. Nature Genetics, 39, 984-988. doi:10.1038/ng2085
[38] Buch, S., Schafmayer, C., Völzke, H., et al. (2007) A genome-wide association scan identifies the hepatic cho- lesterol transporter ABCG8 as a susceptibility factor for human gallstone disease. Nature Genetics, 39, 995-999. doi:10.1038/ng2101
[39] Winkelmann, J., Schormair, B., Lichtner, P., et al. (2007)
Copyright © 2012 SciRes. OPEN ACCESS

H. X. Hong et al. / J. Biomedical Science and Engineering 5 (2012) 557-573
Copyright © 2012 SciRes.
573
OPEN ACCESS
Genome-wide association study of restless legs syndrome identifies common variants in three genomic regions. Nature Genetics, 39, 1000-1006. doi:10.1038/ng2099
[40] Zondervan, K.T. and Cardon, L.R. (2007) Designing candidate gene and genome-wide case-control association studies. Nature Protocols, 2, 2492-2501. doi:10.1038/nprot.2007.366
[41] McCarthy, M.I., Abecasis, G.R., Cardon, L.R., et al. (2008) Genome-wide association studies for complex traits: Consensus, uncertainty and challenges. Nature Reviews Genetics, 9, 356-369. doi:10.1038/nrg2344
[42] Pearson, T.A. and Manolio, T.A. (2008) How to interpret a genome-wide association study. Journal of the Ameri- can Medical Association, 299, 1335-1344. doi:10.1001/jama.299.11.1335
[43] Reich, D.E. and Lander, E.S. (2001) On the allelic spec- trum of human disease. Trends Genetics, 17, 502-510. doi:10.1016/S0168-9525(01)02410-6
[44] Barrett, J.C. and Cardon, L.R. (2006) Evaluating cover- age of genome-wide association studies. Nature Genet- ics, 38, 659-662. doi:10.1038/ng1801
[45] Pe’er, I., Bakker, P.I., Maller, J., et al. (2006) Evaluating and improving power in whole-genome association stud-ies using fixed marker sets. Nature Genetics, 38, 663- 667. doi:10.1038/ng1816
[46] Hong, H., Shi, L., Fuscoe, J.C., et al. (2009) Potential sources of spurious associations and batch effects in ge- nome-wide association studies. In: Scherer, A., Ed., Batch effects and noise in microarray experiments: Sources and solutions, John Wiley & Sons, New York, pp. 191-201. doi:10.1002/9780470685983.ch16
[47] Hong, H., Shi, L., Su, Z., et al. (2010) Assessing sources of inconsistencies in genotypes and their effects on ge- nome-wide association studies with HapMap samples. The Pharmacogenomics Journal, 10, 364-374. doi:10.1038/tpj.2010.24
[48] Takeuchi, F., Serizawa, M., Yamamoto, K. et al. (2009) Confirmation of multiple risk loci and genetic impacts by a genome-wide association study of TYPE 2 diabetes in the Japanese population. Diabetes, 58, 1690-1699. doi:10.2337/db08-1494
[49] Saxena, R., Voight, B.F., Lyssenko, V., et al. (2007) Ge- nome-wide association analysis identifies loci for TYPE
2 diabetes and triglyceride levels. Science, 316, 1331- 1336. doi:10.1126/science.1142358
[50] Di, X., Matsuzaki, H., Webster, T.A., et al. (2005) Dy- namic model based algorithms for screening and geno- typing over 100K SNPs on oligonucleotide microarrays. Bioinformtics, 21, 1958-1963. doi:10.1093/bioinformatics/bti275
[51] Hong, H., Su, Z., Ge, W., et al. (2010) Evaluating varia- tions of genotype calling: A potential source of spurious associations in genome-wide association studies. Journal of Genetics, 89, 55-64. doi:10.1007/s12041-010-0011-4
[52] Hong, H., Su, Z., Ge, W., et al. (2008) Assessing batch effects of genotype calling algorithm BRLMM for the affymetrix genechip human mapping 500 K array set us-ing 270 HapMap samples. BMC Bioinformatics, 9, S17. doi:10.1186/1471-2105-9-S9-S17
[53] Margulies, M., Egholm, M., Altman, W.E., et al. (2005) Genome sequencing in microfabricated high-density pi-colitre reactors. Nature, 437, 376-380.
[54] Fullwood, M.J., Wei, C.L., Liu, E.T. and Ruan, Y. (2009) Next-generation DNA sequencing of paired-end tags (PET) for transcriptome and genome analyses. Genome Research, 19, 521-532. doi:10.1101/gr.074906.107
[55] Bansal, V., Harismendy, O., Tewhey, R., et al. (2010) Accurate detection and genotyping of SNPs utilizing population sequencing data. Genome Research, 20, 537- 545. doi:10.1101/gr.100040.109
[56] Nielsen, R., Paul, J.S., Albrechtsen, A. and Song, Y.S. (2011) Genotype and SNP calling from next-generation sequencing data. Nature Reviews Genetics, 12, 443-451. doi:10.1038/nrg2986
[57] Bus, A., Hecht, J., Huettel, B., Reinhardt, R. and Stich, B. (2012) High-throughput polymorphism detection and genotyping in Brassica napus using next-generation RAD sequencing. BMC Genomics, 13, 281. doi:10.1186/1471-2164-13-281
[58] Skotte, L., Korneliussen, T.S. and Albrechtsen, A. (2012) Association testing for next-generation sequencing data using score statistics. Genetic Epidemiology, 36, 430-437. doi:10.1002/gepi.21636