pittsburgh 2030 district progress report · pittsburgh 2030 district progress report district ......
TRANSCRIPT

PITTSBURGH2030 DISTRICT
PROGRESSREPORT
D I S T R I C T
P I T T S B U R G H
2030
2016

The Pittsburgh 2030 District is an internationally recognized, locally driven, voluntary initiative that empowers, supports, and inspires business and building owners and managers across four Pittsburgh neighborhoods1 as they collaboratively work toward 50% reductions in energy use, water consumption, and transportation emissions (below baselines) by the year 2030. Since 2012, Pittsburgh 2030 District efforts have helped save money, increased buildings’ operational efficiencies, connected best practices and thought-leadership, and strengthened Pittsburgh’s triple bottom line. Property Partners are committed to achieving the 2030 Challenge’s2 aggressive building performance goals – and are supported in those efforts by Community stakeholders and Resource providers. Part of the international 2030 Districts Network, the Pittsburgh 2030 District’s signatories represent 491 buildings totaling over 78.7 million square feet of real estate. This private-public partnership is facilitated by Green Building Alliance (GBA).
Participation in the Pittsburgh 2030 District has quantifiable benefits for property developers, building owners, and facility managers. Partners share, learn, and collaborate
at monthly Partner Meetings, where best practices are communicated and connections are made. The District also provides Property Partners with centralized access to relevant local and national projects and initiatives; funding incentives; financing opportunities; the nationwide 2030 District group purchasing marketplace; confidential, contextualized, peer-facility building performance comparisons; and public recognition of participation.
Together, GBA and Pittsburgh 2030 District Partners demonstrate that high performing buildings can simultaneously increase business and property profitability, enhance real estate asset values, reduce environmental impacts, and improve occupant health. This type of collaborative action is a strategic undertaking to invest in Pittsburgh’s future by keeping it resilient and innovative, while addressing ongoing regional, national, and global challenges.
This annual report summarizes the Pittsburgh 2030 District’s 2016 progress toward attaining the bold 2030 Challenge goals that are earnestly being pursued by participants on behalf of the Pittsburgh region.
ABOUT THE PITTSBURGH 2030 DISTRICT
ENERGY USE
WATER USE
CO2 FROM TRANSPORTATIONEMISSIONS (2015)
INDOOR AIR QUALITY
0% 10% 20% 35% 50%
2015 2020 2025 2030
PERCENT REDUCTION
10.7%
7.4%
24.2%
IN DEVELOPMENT
DISTRICT PROGRESS YEAR END 2016
Figure 1
2 | PITTSBURGH 2030 DISTRICT

BY THE NUMBERS
72.5%DISTRICTCOMMITTED
OFTHE
PARTNERSCOMMUNITY&
RESOURCE
42
56 P
RESE
NTAT
IONS
2,0
48 E
VENT
ATT
ENDE
ES
103 PARTNERS
PROPERTY78.7MILLION
SQ FEET
Pittsburgh 2030 District Launched
35 Million Sq Ft Committed 68 Million Sq Ft
Committed
77 Million Sq Ft Committed
66 Million Sq Ft Committed
Boundary expansion: Oakland & Uptown
70% Participation & 100th Property Partner
2012
2013
20152014 2016
2017
Boundary Expansion: Northside
57% Participation within the District
2016 PROGRESS REPORT | 3

The Pittsburgh 2030 District is part of the international 2030 Districts Network, which develops and sustains the 15 established and other emerging 2030 Districts as they empower and inspire members and partners to achieve 2030 Challenge goals. Across North America, 318 million square feet of real estate has been committed to a 2030 District. Of that space, nearly 25% (78.7 million square feet) is in Pittsburgh. Given the Pittsburgh 2030 District’s leadership among established 2030 District cities and strategic geographic location, the Pittsburgh 2030 District frequently acts as a resource for other 2030 Districts, Emerging Districts, and cities interested in forming new 2030 Districts.
Established DistrictsAlbuquerque, Austin, Cleveland, Dallas, Denver, Grand Rapids, Ithaca, Los Angeles, Pittsburgh, Portland (ME), San Antonio, San Francisco, Seattle, Stamford, and Toronto
Emerging DistrictsAnn Arbor, Burlington, Detroit, New York City, Philadelphia, and Tucson
2030 DISTRICTS NETWORK
WHAT IS ENERGY/WATER USE INTENSITY?Just as a car’s fuel efficiency is calculated in miles per gallon and a baseball pitcher’s performance measured using earned run average, a building can employ energy use intensity (EUI) and water use intensity (WUI) as performance metrics.(kBtu)
TOTAL ANNUALENERGY
USE
BUILDING AREASQUARE FEET
EUIkBtu sqftPER YEAR
NEARLY 25% OF THE BUILDING SPACE
COMMITTED TO 2030 DISTRICTS WORLDWIDE
IS IN PITTSBURGH
Figure 2

The 2030 District goals are based on the international “2030 Challenge for Planning” targets shown in Figure 3, originally issued in 2006 by Architecture 2030. Separate 2030 Challenge tracks exist for new construction and existing buildings, each having incremental goals seeking to drastically improve building performance by 2030. New construction and major renovation projects are working toward carbon neutrality, while existing buildings are pursuing 50% energy use reductions (below baseline). All buildings are committed to water use and transportation emission reductions of 50% below baselines. Individual improvement is aggregated to provide this annual summary of Pittsburgh 2030 District progress toward each goal, with property-level specifics held in confidence and shared only with each respective Property Partner.
The Pittsburgh 2030 District is one District comprised of two boundaries - one in Downtown Pittsburgh (including portions of the Northside and Uptown neighborhoods)
and another in Oakland. As the second- and third-largest commercial business districts in the Commonwealth of Pennsylvania, Downtown and Oakland together include the participation of more than 25 distinct building use types, each with energy and water use intensity baselines that reflect their size and usage mix. Baselines specific to building use types are imperative for performance context, comparison, and progress measurement.
While Downtown includes more office buildings, Oakland has a significant number of higher education and healthcare facilities that tend to be more energy- and water-use intensive. For example, on average, a hospital has greater energy use per square foot than an office building, resulting in a higher EUI baseline. Thus, when looking at the two boundaries, building use type plays a significant role in understanding energy and water use.
GOALS AND PARTICIPATION
2030 CHALLENGE GOALS:EXISTING BUILDINGS
2030 CHALLENGE GOALS:NEW BUILDINGS & MAJOR RENOVATIONS
203020252020BASELINE
20%
35%
50%
203020252020BASELINE
50%50% 50%CA
RBON
NEU
TRAL
80%
90%
0
10
20
30
40
50
60
70
80
90
100
0
10
20
30
40
50
60
70
80
90
100
PERC
ENT
RED
UC
TIO
N
PERC
ENT
RED
UC
TIO
N
ENERGY USE
WATER USE
CO2 FROM TRANSPORTATIONEMISSIONS
Figure 3
2016 PROGRESS REPORT | 5
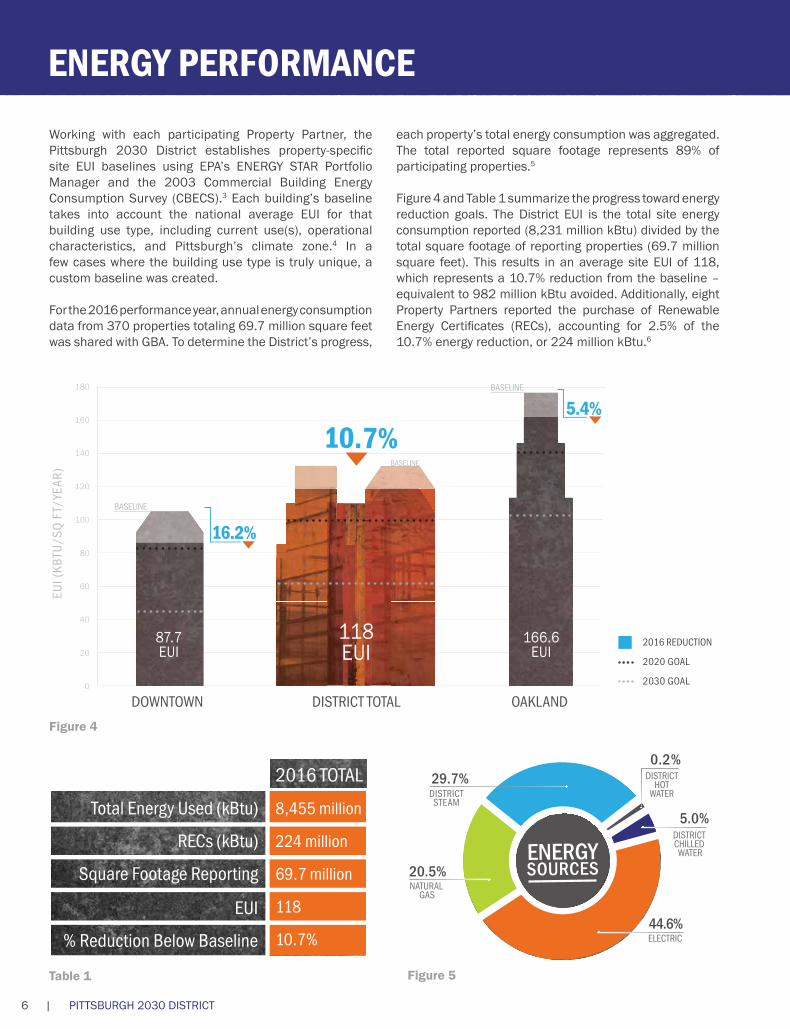
Working with each participating Property Partner, the Pittsburgh 2030 District establishes property-specific site EUI baselines using EPA’s ENERGY STAR Portfolio Manager and the 2003 Commercial Building Energy Consumption Survey (CBECS).3 Each building’s baseline takes into account the national average EUI for that building use type, including current use(s), operational characteristics, and Pittsburgh’s climate zone.4 In a few cases where the building use type is truly unique, a custom baseline was created.
For the 2016 performance year, annual energy consumption data from 370 properties totaling 69.7 million square feet was shared with GBA. To determine the District’s progress,
each property’s total energy consumption was aggregated. The total reported square footage represents 89% of participating properties.5
Figure 4 and Table 1 summarize the progress toward energy reduction goals. The District EUI is the total site energy consumption reported (8,231 million kBtu) divided by the total square footage of reporting properties (69.7 million square feet). This results in an average site EUI of 118, which represents a 10.7% reduction from the baseline – equivalent to 982 million kBtu avoided. Additionally, eight Property Partners reported the purchase of Renewable Energy Certificates (RECs), accounting for 2.5% of the 10.7% energy reduction, or 224 million kBtu.6
ENERGY PERFORMANCE
BASELINE
0
20
40
60
80
120
140
180
100
160
OAKLANDDISTRICT TOTALDOWNTOWN
EUI (
KBTU
/SQ
FT/
YEAR
)
10.7%
87.7EUI
166.6EUI
118EUI
5.4%
16.2%
2016 REDUCTION
2020 GOAL
2030 GOAL
BASELINE
BASELINE
ENERGYSOURCES
44.6%
20.5%
29.7%0.2%
5.0%
ELECTRIC
DISTRICT CHILLED
WATER
DISTRICT HOT
WATER DISTRICTSTEAM
NATURAL GAS
Figure 4
Table 1 Figure 5
2016 TOTAL
Total Energy Used (kBtu) 8,455 million
RECs (kBtu) 224 million
Square Footage Reporting 69.7 million
EUI 118
% Reduction Below Baseline 10.7%
6 | PITTSBURGH 2030 DISTRICT

ENERGY PERFORMANCEPE
RCEN
T RED
UCTIO
N
50%
30%
40%
20%
10%
BASELINE
+20%
+10%
+30% 2016 PERFORMANCE
2020 GOAL
2030 GOAL
2020
2030
200,000+ SQ FT OFFICE BUILDINGS
OFFICE BUILDINGS 200,000+ SQ FT: 2016 PERFORMANCE
Each bar in Figure 7 represents a single office building and its progress toward achieving its energy reduction goal. As a group, large office buildings are making significant progress. There are 28 office buildings larger than 200,000 square feet (including government offices) reporting in the Pittsburgh 2030 District, representing 24% of the total committed square footage. As a cohort, they are 28.7% below baseline and 64% have already achieved their 2020 energy reduction goal of 20% below baseline.
TOTAL ENERGY USE AVOIDED7
52,253,000SAVED
kBtu AVOIDED200
400
600
800
1,000
2016201520142013
MIL
LIO
N k
Btu
2,643,515,813
Figure 6
Figure 7
2016 PROGRESS REPORT | 7
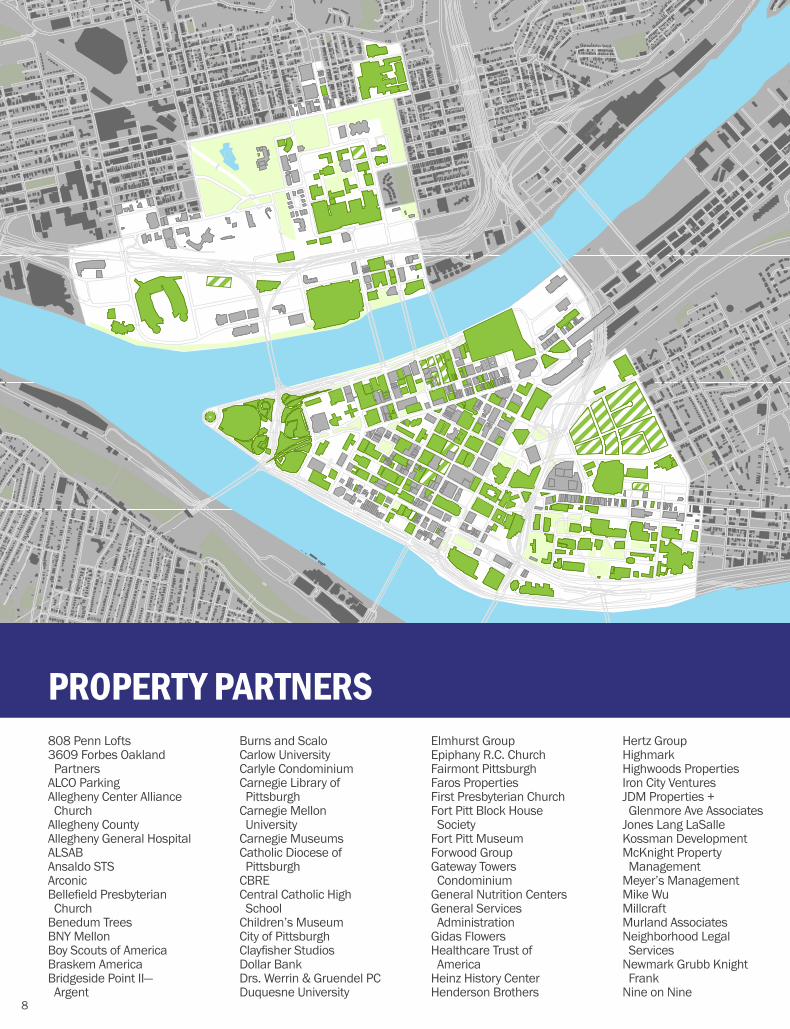
PROPERTY PARTNERS 808 Penn Lofts3609 Forbes Oakland Partners ALCO ParkingAllegheny Center Alliance Church Allegheny CountyAllegheny General Hospital ALSABAnsaldo STSArconicBellefield Presbyterian ChurchBenedum TreesBNY MellonBoy Scouts of AmericaBraskem AmericaBridgeside Point II— Argent
Burns and ScaloCarlow UniversityCarlyle CondominiumCarnegie Library of PittsburghCarnegie Mellon University Carnegie MuseumsCatholic Diocese of PittsburghCBRECentral Catholic High SchoolChildren’s MuseumCity of PittsburghClayfisher StudiosDollar BankDrs. Werrin & Gruendel PCDuquesne University
Elmhurst GroupEpiphany R.C. ChurchFairmont PittsburghFaros PropertiesFirst Presbyterian ChurchFort Pitt Block House SocietyFort Pitt Museum Forwood GroupGateway Towers CondominiumGeneral Nutrition CentersGeneral Services AdministrationGidas FlowersHealthcare Trust of AmericaHeinz History Center Henderson Brothers
Hertz GroupHighmarkHighwoods PropertiesIron City VenturesJDM Properties + Glenmore Ave AssociatesJones Lang LaSalleKossman DevelopmentMcKnight Property ManagementMeyer’s ManagementMike WuMillcraftMurland AssociatesNeighborhood Legal ServicesNewmark Grubb Knight FrankNine on Nine
PROPERTY PARTNERS
8
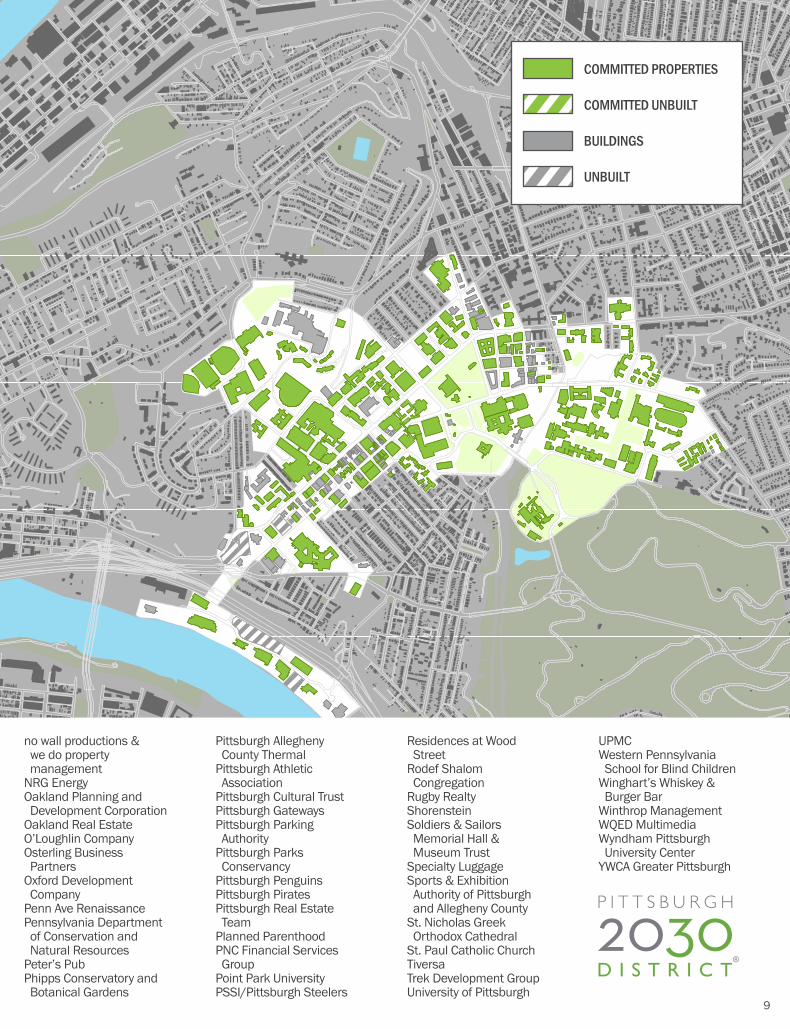
no wall productions & we do property managementNRG EnergyOakland Planning and Development CorporationOakland Real EstateO’Loughlin Company Osterling Business PartnersOxford Development CompanyPenn Ave RenaissancePennsylvania Department of Conservation and Natural ResourcesPeter’s PubPhipps Conservatory and Botanical Gardens
Pittsburgh Allegheny County ThermalPittsburgh Athletic AssociationPittsburgh Cultural TrustPittsburgh GatewaysPittsburgh Parking AuthorityPittsburgh Parks ConservancyPittsburgh PenguinsPittsburgh PiratesPittsburgh Real Estate TeamPlanned ParenthoodPNC Financial Services GroupPoint Park UniversityPSSI/Pittsburgh Steelers
Residences at Wood StreetRodef Shalom CongregationRugby RealtyShorensteinSoldiers & Sailors Memorial Hall & Museum Trust Specialty LuggageSports & Exhibition Authority of Pittsburgh and Allegheny CountySt. Nicholas Greek Orthodox CathedralSt. Paul Catholic ChurchTiversaTrek Development GroupUniversity of Pittsburgh
UPMCWestern Pennsylvania School for Blind ChildrenWinghart’s Whiskey & Burger BarWinthrop ManagementWQED MultimediaWyndham Pittsburgh University Center YWCA Greater Pittsburgh
COMMITTED PROPERTIES
COMMITTED UNBUILT
BUILDINGS
UNBUILT
D I S T R I C T
P I T T S B U R G H
20309

Unlike energy, a large, national water dataset does not exist for the commercial building sector. From 2012 to 2015, GBA worked with the Pittsburgh Water and Sewer Authority (PWSA) to establish a water baseline for both the Downtown and Oakland boundaries using historic water consumption information. To date, water use intensity (WUI) baselines for 15 different use types have been established.8
For the 2016 performance year, the annual water consumption of 247 properties representing 58% of committed square feet was shared.9 As shown in Figure 8, this results in a site WUI of 20.7, representing a 7.4% reduction below the baseline, equivalent to 74.5 million gallons avoided.
WATER PERFORMANCE
0
5
10
15
20
25
OAKLANDDISTRICT TOTALDOWNTOWN
2016 REDUCTION
2020 GOAL
2030 GOAL
20.2WUI
21.7WUI
8.4%5.8%
7.4%BASELINE
20.7WUI
BASELINEBASELINE
WUI
(GAL
LON
S/SQ
FT/
YEAR
)
4,680,000SAVED
1,526HOMES ANNUAL USEM
ILLI
ON
GAL
LON
S
20
40
60
80
100
201620152014
GALLONS AVOIDED
222,870,840
OAKLANDDISTRICT TOTALDOWNTOWN
4,680,000SAVED
1,526HOMES ANNUAL USEM
ILLI
ON
GAL
LON
S
20
40
60
80
100
201620152014
GALLONS AVOIDED
222,870,840
OAKLANDDISTRICT TOTALDOWNTOWN
Figure 8
Figure 9
TOTAL WATER USE AVOIDED10
10 | PITTSBURGH 2030 DISTRICT
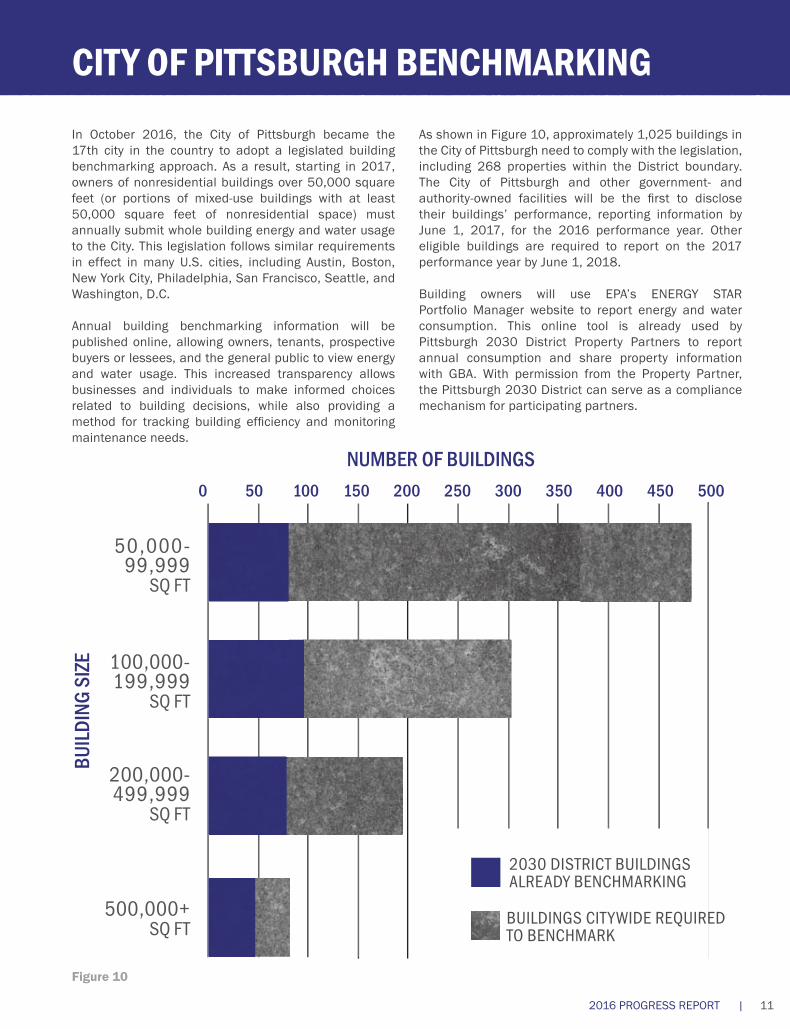
In October 2016, the City of Pittsburgh became the 17th city in the country to adopt a legislated building benchmarking approach. As a result, starting in 2017, owners of nonresidential buildings over 50,000 square feet (or portions of mixed-use buildings with at least 50,000 square feet of nonresidential space) must annually submit whole building energy and water usage to the City. This legislation follows similar requirements in effect in many U.S. cities, including Austin, Boston, New York City, Philadelphia, San Francisco, Seattle, and Washington, D.C.
Annual building benchmarking information will be published online, allowing owners, tenants, prospective buyers or lessees, and the general public to view energy and water usage. This increased transparency allows businesses and individuals to make informed choices related to building decisions, while also providing a method for tracking building efficiency and monitoring maintenance needs.
As shown in Figure 10, approximately 1,025 buildings in the City of Pittsburgh need to comply with the legislation, including 268 properties within the District boundary. The City of Pittsburgh and other government- and authority-owned facilities will be the first to disclose their buildings’ performance, reporting information by June 1, 2017, for the 2016 performance year. Other eligible buildings are required to report on the 2017 performance year by June 1, 2018.
Building owners will use EPA’s ENERGY STAR Portfolio Manager website to report energy and water consumption. This online tool is already used by Pittsburgh 2030 District Property Partners to report annual consumption and share property information with GBA. With permission from the Property Partner, the Pittsburgh 2030 District can serve as a compliance mechanism for participating partners.
CITY OF PITTSBURGH BENCHMARKING
2030 DISTRICT BUILDINGSALREADY BENCHMARKING
BUILDINGS CITYWIDE REQUIREDTO BENCHMARK
10050 1500 200 250 300 350 400 450 500
50,000-99,999
SQ FT
100,000-199,999
SQ FT
200,000-499,999
SQ FT
500,000+SQ FT
NUMBER OF BUILDINGS
BUILD
ING
SIZE
Figure 10
2016 PROGRESS REPORT | 11

From 2013 through 2015, GBA worked with the Southwestern Pennsylvania Commission (SPC) to determine a Pittsburgh 2030 District transportation emissions baseline for Downtown Pittsburgh. The modeled baseline established a 2013 average mode split by person trips and associated emissions from commuter transportation to and from Downtown. The baseline was developed using SPC’s “Regional Travel Demand Model,” which estimates commuter trips into and out of the District’s Downtown boundary from the 10-county Southwestern Pennsylvania region. It also specifies emission impacts for each mode of transportation.11
In estimating regional commuter transportation patterns inbound to Downtown, the Pittsburgh 2030 District Downtown Transportation Baseline represents the modeled commuting patterns of over 60 million annual person trips over a variety of mode choices. As depicted in Figure 12, each mode has associated carbon dioxide (CO2) emissions, the transportation metric against which the 2030 Challenge is measured. For example, a single-occupancy vehicle emits 4.5 kg of CO2 per average trip, whereas an average bus trip emits only 1.6 kg of CO2 per person.
Led by GBA and 10 regional transportation stakeholders, the 2015 Make My Trip Count (MMTC) commuter survey asked respondents a series of questions related to residence zip code, commute destination, and transportation modes for commuting to and from work or school.12 Over 20,700 responses were collected, including 9,598 from people commuting to Downtown. Those heading to buildings committed to the Pittsburgh 2030 District’s Downtown boundary comprised 7,801 of the responses and were analyzed for measured performance against the modeled SPC Downtown baseline as shown in Figure 11.
In addition to tracking districtwide emission performance, MMTC responses helped determined mode splits for both
boundaries. People commuting to and from Oakland provided 7,013 of the responses. Figure 13 illustrates how MMTC respondents’ mode use varied between Downtown and Oakland destinations. Overall transit use (bus and light rail) was higher for Downtown commuters, while cyclists and walkers represented a larger portion of Oakland commuters.
TRANSPORTATION PERFORMANCE
Drive Alone4.49
Carpool (3+) 3.54
Vanpool 3.41
Light Rail (T) 2.05
Bus 1.58
Walk 0.00
Bike 0.00
Carpool 3.61
CO2 (kg) per person trip
0
200
400
600
800
1,000
1,200
1,400
1,600
1,800
DOWNTOWN
EMIS
SIO
NS
(KG
CO
2 /P
ERSO
N/Y
EAR)
EMISSIONS REDUCTION (2015)
2020 GOAL
2030 GOAL
1,359.6PER
KG CO PERSON
2
24.2%
CO2 EMISSIONS BY MODE
Figure 12
Figure 11
12 | PITTSBURGH 2030 DISTRICT

p4 PERFORMANCE MEASURESA collaboration between the City of Pittsburgh and The Heinz Endowments, the p4 initiative was created to “forge a new model of urban growth and development that is innovative, inclusive, and sustainable,” centered around People, Planet, Place, and Performance.13 It was launched at an April 2015 summit, with activities continuing to the present.
In October 2016, 12 p4 Performance Measures were released, with a goal of providing investment prioritization for Pittsburgh development projects in the following categories: Community, Opportunity, Economy, Housing, Land, Public, Connect, Rainwater, Air, Energy, Innovation, and Design.14 Each category offers 10 points based on quantifiable metrics, including the Energy Performance Measure, which is built around 2030 Challenge goals.
Over 100 technical and community experts contributed to the p4 Performance Measures, including numerous GBA staff and board members, Pittsburgh 2030 District Partners, GBA members, and other stakeholders. The measures are being used by public agencies, funders, developers, building owners, project design teams, and communities.
TRANSPORTATION PERFORMANCE
OTHER
TELECOMMUTE
WALK
BIKE
PARK AND RIDE
LIGHT RAIL
BUS
CARPOOL
DRIVE ALONE
COMMUTERMODE
38%
31%6%
10%
4%3%
3%3%
2%
COMMUTERMODE
27%
6%
1%2%
6%
8%
1%
49%
OAKLANDMMTC SURVEY RESULTS
DOWNTOWNMMTC SURVEY RESULTS
PlanetCreating a Green and Healthy Environment
PlacePromoting Innovation in Urban Design
PerformanceBuilding an Inclusive Economy
PeopleAdvancing the Just and Sustainable City
Figure 13
2016 PROGRESS REPORT | 13

To help Property Partners enhance indoor air quality (IAQ) while striving toward other reductions, GBA has partnered with the University of Pittsburgh’s Mascaro Center for Sustainable Innovation to develop a standard protocol for IAQ measurement, tracking, and benchmarking.
Indoor air quality is important – consensus within academia conclude both physical and mental health gains, as well as a decrease in absenteeism can be attributed to improved IAQ. As employee salaries and healthcare costs dominate expenditures in the workplace, even minor improvements in health and productivity can result in tremendous financial gains for companies.
A Pittsburgh 2030 District IAQ Pilot has been ongoing since 2014, with an interim goal of evaluating direct and indirect impacts of energy reductions on IAQ (e.g., changes to the building and life cycle impacts on regional outdoor air quality, respectively). Six Pittsburgh 2030 District Property Partners have participated in an IAQ Pilot, which included on-site testing, HVAC equipment evaluation, and improvement recommendations. The testing protocol was modeled on the EPA’s Building Assessment Survey and Evaluation.15 Each evaluation included a site visit, selection of a target study area and monitoring location,
characterization and sampling of the building, data analysis, and an occupant satisfaction survey.
This ongoing effort supports the ultimate objective of developing scalable, districtwide IAQ goals and strategies for improvement in IAQ measures, metrics, and performance.
INDOOR AIR QUALITY
COMMUNITY PARTNERSAmerican Institute of Architects PittsburghAllegheny Conference on Community DevelopmentAllegheny County, County Executive, Rich Fitzgerald American Society of Heating, Refrigeration, and Air-Conditioning Engineers - PittsburghBike PittsburghBuilding Owners & Managers Association of PittsburghCitizens for Pennsylvania’s FutureCity of Pittsburgh, Office of the Mayor, William PedutoConservation Consultants, Inc.Design Center PittsburghEnvision DowntownGreen Building AllianceGroup Against Smog and PollutionHealthy RideInternational Facility Management Association, Pittsburgh ChapterInternational Union of Operating Engineers, Local 95Master Builders’ Association of Western PennsylvaniaNAIOP PittsburghNorthside/Northshore Chamber of CommerceOakland Business Improvement DistrictOakland Planning and Development Corporation
Oakland Task ForceOakland Transportation Management AssociationPennsylvania Environmental CouncilPittsburgh Climate InitiativePittsburgh Downtown Community Development CorporationPittsburgh Downtown PartnershipPittsburgh Parks ConservancyRiverlife PittsburghSmartPowerStudent Conservation AssociationSustainable PittsburghULI PittsburghVisitPittsburgh
RESOURCE PARTNERSArchitecture 2030Duquesne Light Watt ChoicesNRG EnergyPeoples Natural GasPittsburgh Allegheny County ThermalPittsburgh Water and Sewer AuthoritySouthwestern Pennsylvania CommissionUrban Redevelopment Authority of Pittsburgh
14 | PITTSBURGH 2030 DISTRICT

FOOTNOTES1 The Pittsburgh 2030 District boundaries encompass all of Downtown Pittsburgh and Oakland, as well as parts of Uptown and the Northside.
2 Architecture 2030. (2017). The 2030 Challenge. architecture2030.org/2030_challenges/2030-challenge/.
3 U.S. Energy Information Administration. (2008). 2003 Commercial Building Energy Consumption Survey (CBECS). eia.gov/consumption/commercial/data/2003/.
4 Green Building Alliance. (2013). Pittsburgh 2030 District Energy Baseline. November 2013. 2030districts.org/sites/default/files/atoms/files/Pittsburgh_2030_District-Energy_Baseline.pdf.
5 Although their 2016 energy consumption was reported to GBA, 37 properties are not included in energy summaries for one of two reasons: 1) imprecise baselines due to nonstandard building uses OR 2) data inconsistencies (i.e., gaps in 2017 utility consumption, missing tenant information, or unavailability of all utility meters).
6 The 2030 Challenge allows for 20% of the required reduction to come from the purchase of renewable energy and/or certified renewable energy credits. This allowance is on a per building basis.
7 $52.2 million in avoided energy costs was calculated using an average cost of $0.09/kWh for electricity, $8.92/MCF for gas, $18.98/Mlb for steam, $0.34/ton-hour for chilled water, and $15.70/mmBTU for hot water. CO2e is based on EPA conversion factors for each fuel type.
U.S. Environmental Protection Agency. (2017). Greenhouse Gases Equivalencies Calculator - Calculations and References. epa.gov/energy/greenhouse-gases-equivalencies-calculator-calculations-and-references.
8 Green Building Alliance. (2015). Pittsburgh 2030 District Water Baseline. February 2015. go-gba.org/pittsburgh-2030-district-releases-water-baseline-report.
9 Although their 2016 water consumption was reported to GBA, 40 properties are not included in water summaries for one of two reasons: 1) imprecise baselines due to nonstandard building uses OR 2) data inconsistencies (i.e., gaps in 2017 utility consumption, missing tenant information, or unavailability of all utility meters).
10 $4.6 million in avoided water and sewage costs was calculated using an average cost of $0.02 per gallon for water and sewer. The average four-person home uses approximately 146,000 gallons of water annually. U.S. Geological Survey. (2016). Water Questions & Answers. water.usgs.gov/edu/qa-home-percapita.html.
11 Southwestern Pennsylvania Commission. (2017). “Data & Modeling.” spcregion.org/trans_data_model.shtml.
12 Green Building Alliance. (2016). 2015 Make My Trip Count Pittsburgh Commuter Survey. January 2016. makemytripcount.org.
13 p4 initiative. (2017). p4 Pittsburgh. p4pittsburgh.com.
14 p4 initiative. (2016). p4 Performance Measures. October 2016. p4pittsburgh.org/pages/p4-performance-measures.
15 U.S. Environmental Protection Agency. (2006). Building Assessment Survey and Evaluation Study. EPA 402-C-06-002, January 2006. epa.gov/indoor-air-quality-iaq/ building-assessment-survey-and-evaluation-study.
ABOUT GBAGreen Building Alliance (GBA) is a nonprofit organization that inspires the creation of healthy, high performing places for everyone through leadership that connects knowledge, transformative ideas, and collaborative action. GBA was founded in 1993, was the first U.S. Green Building Council (USGBC) affiliate, and remains an aligned USGBC chapter. Headquartered in Pittsburgh and serving the 26 counties of Western Pennsylvania, we at GBA advance our mission through education, technical assistance, advocacy, and two programs: the Pittsburgh 2030 District and Green & Healthy Schools Academy (GHSA).
IMAGE CREDITSPage 13: p4 initiativePage 14: Mascaro Center for Sustainable Innovation, University of Pittsburgh
PREPARED BY:Angelica Ciranni, LEED AP O+M, CEM, Pittsburgh 2030 District DirectorIsaac Smith, LEED Green Associate, Building Performance AnalystQuinn Zeagler, LEED AP O+M, Program Outreach Specialist
WITH ASSISTANCE FROM:Kim Dinh, Pittsburgh 2030 District InternAurora Sharrard, PhD, LEED AP BD+C, Executive DirectorNatalie Stewart, Communications Director
SPECIAL THANKS TO:Duquesne Light, Peoples Natural Gas, and Pittsburgh Water and Sewer Authority
2016 PROGRESS REPORT | 15
Copyright © 2017Pittsburgh 2030 DistrictGreen Building Alliance
33 Terminal Way, Suite 331Pittsburgh, PA 15219
Printed on 100% recycled content paper.
THANK YOU TO OUR SPONSORS AND FUNDERS: