pka determinations of xanthene derivates in aqueous solutions by
TRANSCRIPT
pa
VSHa
b
c
a
ARRA
KFEXpMC
1
tfli[kT[ogttwcmtg
1d
Spectrochimica Acta Part A 79 (2011) 889– 897
Contents lists available at ScienceDirect
Spectrochimica Acta Part A: Molecular andBiomolecular Spectroscopy
j ourna l ho me page: www.elsev ier .com/ locate /saa
Ka determinations of xanthene derivates in aqueous solutions by multivariatenalysis applied to UV–Vis spectrophotometric data
agner Roberto Batistelaa, Diogo Silva Pellosi a, Franciane Dutra de Souzaa, Willian Ferreira da Costaa,ilvana Maria de Oliveira Santina, Vagner Roberto de Souzaa, Wilker Caetanoa,ueder Paulo Moisés de Oliveirab, Ieda Spacino Scarminioc, Noboru Hiokaa,∗
Departamento de Química, Universidade Estadual de Maringá, Av. Colombo, 5.790, CEP 87.020-900, Maringá, Paraná, BrazilUniversidade Camilo Castelo Branco, Rod. Presidente Dutra, Km 138, CEP 12.247-004, São José dos Campos, São Paulo, BrazilDepartamento de Química, Laboratório de Quimiometria em Ciências Naturais, Universidade Estadual de Londrina, CEP 86.051-990, Londrina, Paraná, Brazil
r t i c l e i n f o
rticle history:eceived 22 November 2010eceived in revised form 24 February 2011ccepted 11 March 2011
eywords:luorescein
a b s t r a c t
Xanthenes form to an important class of dyes which are widely used. Most of them present three acid–basegroups: two phenolic sites and one carboxylic site. Therefore, the pKa determination and the attributionof each group to the corresponding pKa value is a very important feature. Attempts to obtain reliablepKa through the potentiometry titration and the electronic absorption spectrophotometry using the firstand second orders derivative failed. Due to the close pKa values allied to strong UV–Vis spectral over-lap, multivariate analysis, a powerful chemometric method, is applied in this work. The determination
osin YantheneKa
ultivariate analysishemometry
was performed for eosin Y, erythrosin B, and bengal rose B, and also for other synthesized derivativessuch as 2-(3,6-dihydroxy-9-acridinyl) benzoic acid, 2,4,5,7-tetranitrofluorescein, eosin methyl ester, anderythrosin methyl ester in water. These last two compounds (esters) permitted to attribute the pKa ofthe phenolic group, which is not easily recognizable for some investigated dyes. Besides the pKa deter-mination, the chemometry allowed for estimating the electronic spectrum of some prevalent protolyticspecies and the substituents effects evaluation.
. Introduction
Fluorescein, a xanthene C.I. Solvent Yellow 94 (FSC), is one ofhe most widely used dyes due to its high light absorption and highuorescence yield. It is employed as a fluorescent probe in medical
nvestigations [1–5], in chemical analysis [6,7], and in industries8–10]. Some other interesting fluorescein derivatives are the wellnown xanthenes such as eosin Y, erythrosin B, and bengal rose B.hese compounds are employed in cell analysis [11], in diagnosis12,13] and in industries [14,15] as commercial dyes. The structuresf these compounds, as illustrated in Fig. 1, show several acid–baseroups. The solution’s pH is important, then, as it drives the pro-olytic species present in a media, which consequently determinesheir physical, chemical, and photophysical properties. Althoughidely utilized, there is divergence in the pKa values of these
ompounds in the literature due to the inefficiency of traditional
ethodologies in analyzing complex protolytic systems mainly dueo the close pKa values of the phenolic groups and the carboxylicroup (in the o-position relative to the core carbon atom). Another
∗ Corresponding author. Tel.: +55 44 32613654; fax: +55 44 32614125.E-mail address: [email protected] (N. Hioka).
386-1425/$ – see front matter © 2011 Elsevier B.V. All rights reserved.oi:10.1016/j.saa.2011.03.027
© 2011 Elsevier B.V. All rights reserved.
difficulty is the reliable attribution of each pKa value to the cor-responding acid–base center. Usually the carboxylic group showshigher acidity than the phenolic group; however, inversion wouldbe expected depending on the structure of each compound stud-ied. Additionally, there are several tautomeric structures for eachprotolytic form, which makes the determination and attribution ofthe pKa very complex [16–20].
This work presents a detailed determination of the pKa values ofseveral fluorescein compounds in aqueous media using absorptionspectrophotometry data allied to chemometric tools based on mul-tivariate analysis [21,22]. The compounds investigated are eosinY (acid red 87) EOS, erythrosin B (acid red 51) ERI, and bengalrose B (acid red 94) RBB, as well as other synthesized derivatives,such as 2-(3,6-dihydroxy-9-acridinyl) benzoic acid–azafluorescein(N-FSC), eosin methyl ester (EOSMET), erythrosin methyl ester(ERIMET), and 2,4,5,7-tetranitrofluorescein (TNF). Their structuresare shown in Fig. 1.
The most usual chemometric method for the data treatmentis the Principal Components Analysis (PCA) [23–25], which is
employed as a generic procedure for the description of the interre-lations of a set of variables, and whose main goal is the reduction ofthe number of variables analyzed. This methodology implies a newdata representation considering only the most representative com-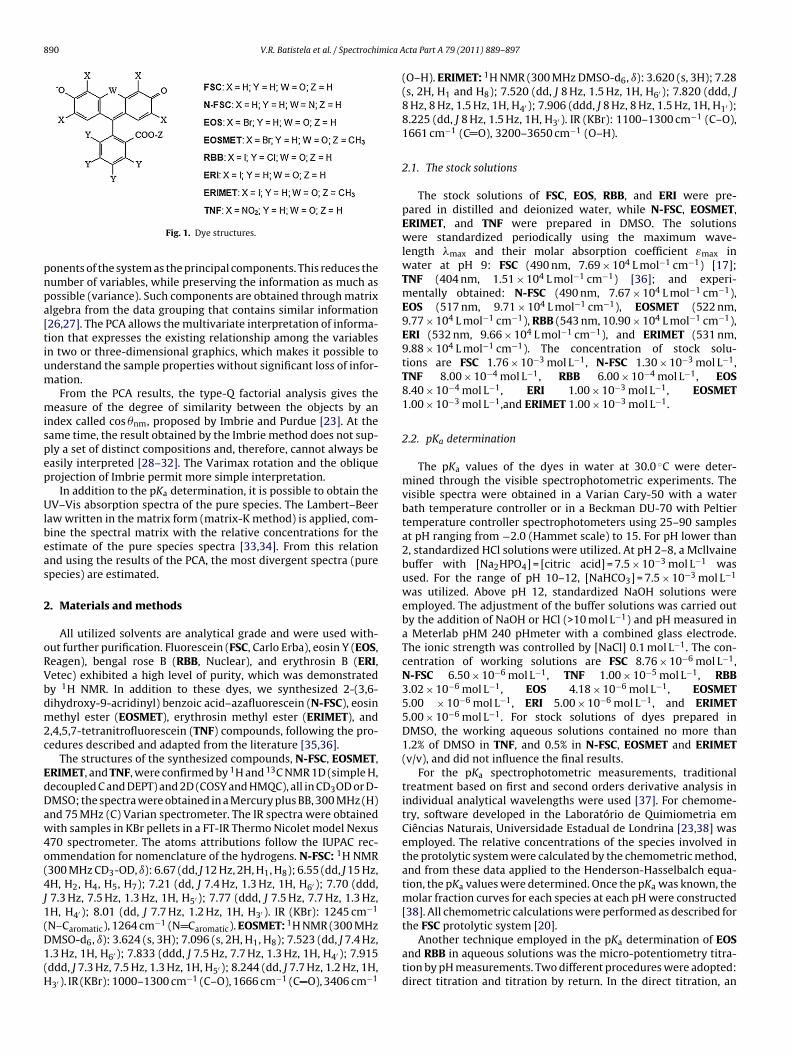
890 V.R. Batistela et al. / Spectrochimica A
pnpa[tium
mispep
Ulbeas
2
oRVbdm2c
EdDaw4o(4J1(D1(H
Fig. 1. Dye structures.
onents of the system as the principal components. This reduces theumber of variables, while preserving the information as much asossible (variance). Such components are obtained through matrixlgebra from the data grouping that contains similar information26,27]. The PCA allows the multivariate interpretation of informa-ion that expresses the existing relationship among the variablesn two or three-dimensional graphics, which makes it possible tonderstand the sample properties without significant loss of infor-ation.From the PCA results, the type-Q factorial analysis gives the
easure of the degree of similarity between the objects by anndex called cos �nm, proposed by Imbrie and Purdue [23]. At theame time, the result obtained by the Imbrie method does not sup-ly a set of distinct compositions and, therefore, cannot always beasily interpreted [28–32]. The Varimax rotation and the obliquerojection of Imbrie permit more simple interpretation.
In addition to the pKa determination, it is possible to obtain theV–Vis absorption spectra of the pure species. The Lambert–Beer
aw written in the matrix form (matrix-K method) is applied, com-ine the spectral matrix with the relative concentrations for thestimate of the pure species spectra [33,34]. From this relationnd using the results of the PCA, the most divergent spectra (purepecies) are estimated.
. Materials and methods
All utilized solvents are analytical grade and were used with-ut further purification. Fluorescein (FSC, Carlo Erba), eosin Y (EOS,eagen), bengal rose B (RBB, Nuclear), and erythrosin B (ERI,etec) exhibited a high level of purity, which was demonstratedy 1H NMR. In addition to these dyes, we synthesized 2-(3,6-ihydroxy-9-acridinyl) benzoic acid–azafluorescein (N-FSC), eosinethyl ester (EOSMET), erythrosin methyl ester (ERIMET), and
,4,5,7-tetranitrofluorescein (TNF) compounds, following the pro-edures described and adapted from the literature [35,36].
The structures of the synthesized compounds, N-FSC, EOSMET,RIMET, and TNF, were confirmed by 1H and 13C NMR 1D (simple H,ecoupled C and DEPT) and 2D (COSY and HMQC), all in CD3OD or D-MSO; the spectra were obtained in a Mercury plus BB, 300 MHz (H)nd 75 MHz (C) Varian spectrometer. The IR spectra were obtainedith samples in KBr pellets in a FT-IR Thermo Nicolet model Nexus
70 spectrometer. The atoms attributions follow the IUPAC rec-mmendation for nomenclature of the hydrogens. N-FSC: 1H NMR300 MHz CD3-OD, ı): 6.67 (dd, J 12 Hz, 2H, H1, H8); 6.55 (dd, J 15 Hz,H, H2, H4, H5, H7); 7.21 (dd, J 7.4 Hz, 1.3 Hz, 1H, H6′ ); 7.70 (ddd,
7.3 Hz, 7.5 Hz, 1.3 Hz, 1H, H5′ ); 7.77 (ddd, J 7.5 Hz, 7.7 Hz, 1.3 Hz,H, H4′ ); 8.01 (dd, J 7.7 Hz, 1.2 Hz, 1H, H3′ ). IR (KBr): 1245 cm−1
N–Caromatic), 1264 cm−1 (N Caromatic). EOSMET: 1H NMR (300 MHz
MSO-d6, ı): 3.624 (s, 3H); 7.096 (s, 2H, H1, H8); 7.523 (dd, J 7.4 Hz,.3 Hz, 1H, H6′ ); 7.833 (ddd, J 7.5 Hz, 7.7 Hz, 1.3 Hz, 1H, H4′ ); 7.915ddd, J 7.3 Hz, 7.5 Hz, 1.3 Hz, 1H, H5′ ); 8.244 (dd, J 7.7 Hz, 1.2 Hz, 1H,3′ ). IR (KBr): 1000–1300 cm−1 (C–O), 1666 cm−1 (C O), 3406 cm−1
cta Part A 79 (2011) 889– 897
(O–H). ERIMET: 1H NMR (300 MHz DMSO-d6, ı): 3.620 (s, 3H); 7.28(s, 2H, H1 and H8); 7.520 (dd, J 8 Hz, 1.5 Hz, 1H, H6′ ); 7.820 (ddd, J8 Hz, 8 Hz, 1.5 Hz, 1H, H4′ ); 7.906 (ddd, J 8 Hz, 8 Hz, 1.5 Hz, 1H, H1′ );8.225 (dd, J 8 Hz, 1.5 Hz, 1H, H3′ ). IR (KBr): 1100–1300 cm−1 (C–O),1661 cm−1 (C O), 3200–3650 cm−1 (O–H).
2.1. The stock solutions
The stock solutions of FSC, EOS, RBB, and ERI were pre-pared in distilled and deionized water, while N-FSC, EOSMET,ERIMET, and TNF were prepared in DMSO. The solutionswere standardized periodically using the maximum wave-length �max and their molar absorption coefficient εmax inwater at pH 9: FSC (490 nm, 7.69 × 10⁴ L mol−1 cm−1) [17];TNF (404 nm, 1.51 × 10⁴ L mol−1 cm−1) [36]; and experi-mentally obtained: N-FSC (490 nm, 7.67 × 10⁴ L mol−1 cm−1),EOS (517 nm, 9.71 × 10⁴ L mol−1 cm−1), EOSMET (522 nm,9.77 × 104 L mol−1 cm−1), RBB (543 nm, 10.90 × 10⁴ L mol−1 cm−1),ERI (532 nm, 9.66 × 10⁴ L mol−1 cm−1), and ERIMET (531 nm,9.88 × 104 L mol−1 cm−1). The concentration of stock solu-tions are FSC 1.76 × 10⁻³ mol L−1, N-FSC 1.30 × 10⁻³ mol L−1,TNF 8.00 × 10⁻⁴ mol L−1, RBB 6.00 × 10⁻⁴ mol L−1, EOS8.40 × 10−4 mol L−1, ERI 1.00 × 10⁻³ mol L−1, EOSMET1.00 × 10−3 mol L−1,and ERIMET 1.00 × 10⁻³ mol L−1.
2.2. pKa determination
The pKa values of the dyes in water at 30.0 ◦C were deter-mined through the visible spectrophotometric experiments. Thevisible spectra were obtained in a Varian Cary-50 with a waterbath temperature controller or in a Beckman DU-70 with Peltiertemperature controller spectrophotometers using 25–90 samplesat pH ranging from −2.0 (Hammet scale) to 15. For pH lower than2, standardized HCl solutions were utilized. At pH 2–8, a Mcllvainebuffer with [Na2HPO4] = [citric acid] = 7.5 × 10⁻³ mol L−1 wasused. For the range of pH 10–12, [NaHCO3] = 7.5 × 10⁻³ mol L−1
was utilized. Above pH 12, standardized NaOH solutions wereemployed. The adjustment of the buffer solutions was carried outby the addition of NaOH or HCl (>10 mol L−1) and pH measured ina Meterlab pHM 240 pHmeter with a combined glass electrode.The ionic strength was controlled by [NaCl] 0.1 mol L−1. The con-centration of working solutions are FSC 8.76 × 10⁻⁶ mol L−1,N-FSC 6.50 × 10⁻⁶ mol L−1, TNF 1.00 × 10⁻⁵ mol L−1, RBB3.02 × 10−6 mol L−1, EOS 4.18 × 10⁻⁶ mol L−1, EOSMET5.00 × 10−6 mol L−1, ERI 5.00 × 10⁻⁶ mol L−1, and ERIMET5.00 × 10−6 mol L−1. For stock solutions of dyes prepared inDMSO, the working aqueous solutions contained no more than1.2% of DMSO in TNF, and 0.5% in N-FSC, EOSMET and ERIMET(v/v), and did not influence the final results.
For the pKa spectrophotometric measurements, traditionaltreatment based on first and second orders derivative analysis inindividual analytical wavelengths were used [37]. For chemome-try, software developed in the Laboratório de Quimiometria emCiências Naturais, Universidade Estadual de Londrina [23,38] wasemployed. The relative concentrations of the species involved inthe protolytic system were calculated by the chemometric method,and from these data applied to the Henderson-Hasselbalch equa-tion, the pKa values were determined. Once the pKa was known, themolar fraction curves for each species at each pH were constructed[38]. All chemometric calculations were performed as described forthe FSC protolytic system [20].
Another technique employed in the pKa determination of EOSand RBB in aqueous solutions was the micro-potentiometry titra-tion by pH measurements. Two different procedures were adopted:direct titration and titration by return. In the direct titration, an

V.R. Batistela et al. / Spectrochimica Acta Part A 79 (2011) 889– 897 891
F ples at several pH values: (a) 0.18, (b) 3.49, (c) 5.04, (d) 7.21, (e) 14.00. (B) Absorbancev
aH(a0i
3
3
atssmcdwTt
3
Ibtad
Fsp[l[toa4atarc
ig. 2. N-FSC. (A) Absorption spectra (6.50 × 10⁻⁶ mol L−1) of aqueous solution samariation versus pH at specific wavelengths. Ionic strength = 0.1 mol L−1, 30.0 ◦C.
queous solution of EOS (2.01 × 10⁻³ mol L−1) was titrated withCl (9.96 × 10⁻² mol L−1). For the titration by return [39], EOS
6.09 × 10⁻⁴ mol L−1) and RBB (7.45 × 10⁻⁴ mol L−1) were initiallycidified by HCl (1.17 mol L−1), and the excess HCl was titrated with.13 mol L−1 of NaOH. The pKa values were calculated by the mod-
fied Gran method [40,41] through software developed in Fortran.
. Results and discussion
.1. pKa determination of xanthene dyes in water
The pKa results in water were determined for EOS, RBB, and ERI,nd for the synthesized N-FSC, EOSMET, ERIMET, and TNF (struc-ures in Fig. 1). The pKa value depends on experimental parametersuch as solvent, ionic strength, and temperature; however, the cho-en instrumental methods and the mathematical datum analysisay compromise the reliability of the pKa results. At working con-
entrations, the Beer law is obeyed for all dyes; however, smalleviations were observed for some hydrophobic xanthenes forhich the non-charged protolytic species prevails (acid solutions).
he sequence of pKa results started with the N-FSC due to its struc-ural similarity to FSC.
.2. The azafluorescein (N-FSC)
The N-FSC (Fig. 1) was obtained by direct modification of FSC.ts structure was confirmed by the disappearance of the 1173 cm−1
and that corresponds to C–Opyran bound (of FSC) in the IR spec-rum, and the appearance of two bands, at 1245 cm−1 (N–Caromatic)nd at 1264 cm−1 (N Caromatic) of the N-FSC molecule. The NMRata is presented in Section 2.
The structural similarity between N-FSC and FSC (structures inig. 1) suggests that both dyes should present similar absorptionpectra and close pKa values. However, while FSC presents threerotolytic equilibriums, pKaOH1 (the most acid), pKaOH2 , and pKaCOOH
17], the N-FSC system is more complex due to an additional equi-ibrium related to the acridinium nitrogen (pKaN ), whose value42] occurs around pH 5.5. The sequence of the absorption spec-ra for N-FSC as the pH was changed is showed in Fig. 2A. As can bebserved, there are strong band superimpositions. Monitoring thebsorption intensity at some selected analytical wavelength (435,76, and 490 nm, Fig. 2B) allied to mathematical treatment, suchs first and second orders derivatives [37,43], the presence of only
hree pKa was observed, instead of four, as expected for N-FSC. Thebsorbance variation at 435 nm (Fig. 2B, curve a) illustrates thisesult. Therefore, this traditional methodology fails in analysis ofomplex systems, as in this case. Nevertheless, the three valuesFig. 3. Fractions of N-FSC protolytic species at several pH values: (a) NH-FSCH3+,
(b) NH-FSCH2, (c) NH-FSCH− , (d) N-FSCH2− , and (e) N-FSC3− .
obtained were: one around the 1.9–2.3 region, another at 4.3, andthe last one at 6.2.
These traditional determinations by absorbance data at someselected analytical wavelength are difficult due to the band super-position and the close proximity of the pKa values. This univariatemethod is not convenient for systems that present pKa differenceslower than 3 pH units and strong spectral band superposition [44],allied with the presence of several tautomeric structures for eachprotolytic species [17–20]. However, in similar experimental con-ditions, the chemometric tool was successfully applied to the FSCprotolytic system [20]. The PCA was applied in 90 samples of N-FSC, and taking explanation of 99.980% of the variance contained inthe spectral information it was assured five protolytic species (fourpKa values). The PCA results and the matrix-K method permitted toobtain the relative concentrations curves for each protolytic species[33,34] at several pH values (illustrated in Fig. 3).
The fractions of each protolytic species at each pH for N-FSC(Fig. 3) resulted in pKa values of 2.81, 3.88, 5.62, and 6.23. As can beseen, the most acidic species prevails at pH lower than 2, and the tri-anionic species is predominant at pH higher than 8, while the otherthree species co-exist in a complex equilibrium system (pH rangingfrom 2.5 to 6.0). Among those values, pKa of 5.62 is attributed to
pKaN , the aminic group, by comparison to FSC [20] (pKaOH1 = 2.5,pKaCOOH = 3.8, and pKaOH2 = 6.1). Therefore for N-FSC, the com-plete attribution is pKaOH1 = 2.81, pKaCOOH = 3.88, pKaN = 5.62, andpKaOH2 = 6.23, Fig. 4, illustrated utilizing the most representative
892 V.R. Batistela et al. / Spectrochimica Acta Part A 79 (2011) 889– 897
Fig. 4. Protolytic equilibriums illustrated with the mos
FN
tts
nFop
results. The problems of weak base titration and precipitation were
F(
ig. 5. Spectra of N-FSC protolytic species calculated with the matrix-K method: (a)H-FSCH3
+, (b) NH-FSCH2, (c) NH-FSCH− , (d) N-FSCH2− , and (e) N-FSC3− .
automeric structures for each protolytic form. Moreover, the spec-rum of each N-FSC protolytic species calculated by matrix-K ishown in Fig. 5.
In Fig. 5, we observe that the spectra corresponding to theeutral (NH-FSCH2), monoanionic (NH-FSCH−), and dianionic (N-
SCH2−) forms are entirely superimposed. Besides to spectralverlapping, the low �pKa values (for example, 0.6 units betweenKaN and pKaOH2 ) make this protolytic system very complex.ig. 6. EOS. (A) Direct potentiometric micro-titration curve (2.01 × 10⁻³ mol L−1)
6.09 × 10⁻⁴ mol L−1), previous acidity with HCl and before addition of NaOH at 25.0 ◦C.
t representative tautomeric structures of N-FSC.
3.3. The eosin Y (EOS) and the eosin methyl ester (EOSMET)
According to the literature, the pKaOH1 of EOS is −2.0 (Hammetscale: average value found in mixtures of water/H2SO4, water/HCl,and water/HClO4) [45]. This lower value, as compared to FSC(pKaOH1 = 2.5), is due to the presence of four bromine substituents(electron withdrawing group) which increases the EOS acidity(structure in Fig. 1). This acid region was not studied in the presentwork.
Our first attempt to obtain the pKa values of eosin Y was throughmicro-potentiometry titration. The pH variation for the EOS solu-tion with direct addition of HCl is shown in Fig. 6A. From 0 to 100 �Lof HCl, the pH variations correspond solely to the acid addition.At higher volumes of HCl, two inflection points corresponding totwo pKa [45,46] were expected, however only one was detected, atapproximately 450 �L. Applying the modified Gran method to thevalues of the potential (E) and HCl volumes, the pKa was found tobe ∼4.4.
Additionally, despite the low concentration employed in themicro-titration, precipitation was observed at pH < 2.5, as someEOS protolytic species are hydrophobic [47]. Another limitationis the basic strength of the EOS. The Kw determined experimen-tally is 2.35 × 10⁻¹⁴, and the Ka is 3.98 × 10⁻⁴, so the Kb is verylow (Kb = Kw/Ka = 5.90 × 10⁻¹¹). This very weak base limits the reli-ability of the value obtained. All these problems affect the pKa
prevented using titration by return at low dye concentration. Themeasured potentials of sample previously acidified with HCl fol-lowed by NaOH titration is presented in Fig. 6B. The curve presents
with HCl addition (9.96 × 10⁻² mol L−1). (B) Potentiometric titration curve

V.R. Batistela et al. / Spectrochimica Acta Part A 79 (2011) 889– 897 893
Fig. 7. EOS spectra (4.18 × 10⁻⁶ mol L−1) in an aqueous buffer environment at3(
t9fat
ctptsFf
itmet
oefm
Nota(vtTdbtps
dpttg
Table 1Molar absorptivity coefficients of protolytic species of EOS reported in the literatureand the values calculated by chemometric methods.
Species Literaturea Chemometry�max (nm); ε (L mol−1 cm−1) �max (nm); ε (L mol−1 cm−1)
Neutral. EH2 483; 8.500 470; 7.500Monoanionic. EH− 518; 81.900 519; 51.700Dianionic. E2− 515; 96.700 515; 96.700a,b
similar to the other investigated dyes.
0.0 ◦C, ionic strength 0.1 mol L−1 and solutions at pH: (a) 0.31, (b) 1.53, (c) 2.29,d) 2.95, (e) 7.25.
wo inflection points: the first one, for an equivalent volume around00 �L, is due to the excess of HCl, whereas the second inflection,or around 1100 �L, corresponds to the dye deprotonation. Oncegain, for EOS, only one pKa value (∼4.0) was detected, instead ofhe expected two values.
As compared to potentiometry titration, one advantage of thehosen spectrophotometric methods is the low substrate concen-ration (around 10−6 mol L−1), which reduces the precipitation andossible self-aggregation processes [43,48]. However, the absorp-ion spectra of EOS in aqueous media at several pH levels showedtrong band superposition, as illustrated in Fig. 7, similarly to the N-SC system. As the pH increased, the color of the solutions changedrom rose to orange.
The absorbance intensities in 517 and 490 nm as the pHncreased are shown in Fig. 8A. The pH-absorbance profiles exhibithe classical “S” shape and through first and second order derivative
ethods, once again, just one pKa was “wrongly” observed. How-ver, instead of a value around 4.0–4.4 (potentiometry), in this case,he pKa value found was around 2.0–2.8.
The absence of an isosbestic point in Fig. 7 implies the existencef more than one consecutive step [49], which in turn reflects thexistence of more than one pKa in the pH range investigated. There-ore, all attempts to calculate reliable pKa values using traditional
ethods failed.To solve it, the chemometry was similarly employed as for the
-FSC and FSC [20] systems. The PCA showed that the presencef three species is reliable to 99.967% of the information con-ained in the data set. Therefore, the relative concentration curvesnd the fractions of each EOS protolytic species were determinedFig. 8B), resulting in two pKa values, 2.02 and 3.80. This last pKa
alue is similar to that reported in the literature (3.7–3.8), whilehe other (2.02) is quite different (ranging from 2.8 to 3.3) [45,46].his difference can be attributed not only to the experimental con-itions used (ionic strength, temperature, dye concentration, etc.),ut also to the difficulties arising from the mathematical calcula-ions employed and from the dyes molecular properties, such asKa values close to each other, high spectral superposition, andelf-aggregation followed by precipitation.
Additionally, the Mchedlov-Petrossyan studies [45] exposed theifficulty in detecting the presence of EH− specie (intermediaryrotolytic specie between EH2 and E2−). The spectra of all EOS pro-
olytic forms were calculated by the matrix-K method, confirminghat the other species totally overlap the EH− spectrum. Table 1ives the estimated molar absorptivities (ε) for each species at theira From Ref. [42].b Taken as referential value for the calculations.
�max found in the literature [45], as well as the values calculated inthe present work.
Despite the close pKa values for EOS (�pKa = 1.8 units), the useof the entire spectrum by chemometry, together with the largenumber of samples (28 samples), allowed for reliable pKa determi-nation. However, it is well documented that the protolytic speciesof EOS present several tautomeric structures [50–52]. In the presentwork, some of the most representative structures of each protolyticspecies and the proposed pKa are illustrated (Fig. 9).
As indicated in Fig. 9, it is proposed that EOS pKa 3.80 is relatedto the carboxylic group, whose value is the same as that obtainedfor FSC [20] and N-FSC. The pKa 2.02 is attributed to the phenolicgroup (pKaOH ), while for FSC and N-FSC, this is around 6.1–6.2. Thisintense increment of the OH acidity compared to FSC is providedby the four bromine atoms connected to the xanthene ring of EOS(Fig. 1). The carboxylic group is less dependent than the phenolgroup on the bromine presence, probably due to the orthogonal-ity between the xanthene and benzoic moiety, as verified in FSC[20]. The dihedral angle between both rings for FSC, around 90◦,restrains the electronic conjugation in the xanthene part, confiningthe excited electron in this ring, which is responsible for the highfluorescence yield [20,50,53,54].
In order to assure the EOS pKa attribution, the eosin Y esterderivative was synthesized with the methyl substituent, EOSMET(structure in Fig. 1). This compound exhibits only the phenolacid–base group, and its experimental pKa was 2.11. This resultconfirms that the pKa 2.02 observed for the EOS is related tothe phenolic center. It should be mentioned that the neutral pro-tolytic form of EOSMET tends to self aggregate despite the lowconcentration employed. For this dye, the solutions were analyzedimmediately after the substrate addition. Additionally, the valuefound for the eosin methyl ester (2.11) is in accordance with thevalue registered in the literature, 1.9 [51,19]. Our experimentalvalue is also coherent with the pKa in water–ethanol solutions(40% in ethanol, v/v), 2.9 [55], since for less polar solvent, the pKa
increases due to the preferential stabilization of the neutral species.
3.4. The rose bengal B (RBB), erythrosin B (ERI), and erythrosinmethyl ester (ERIMET)
The RBB direct micro-potentiometry titration with NaOH pre-sented the same characteristics observed in the case of EOS,resulting in a single value of pKa ∼ 4.3. The spectrophotomet-ric investigation of 44 samples showed that in very acid media,the samples are colorless. However, as the pH increased, a bandat 543 nm with a shoulder in the 507 nm region also increased(not shown). The curve of absorbance versus pH in some specificanalytical wavelengths in the visible region was S-shaped again,suggesting wrongly just one pKa (∼3.7), consistent with the valuedescribed in the literature [47,56] of 3.72. For RBB, once again,no isosbestic point was observed, indicating a multi-equilibrium
The PCA at explanation of 99.908% of the information containedin the experimental set indicates the presence of three protolyticspecies, resulting in pKa values of 1.89 and 3.93. The pKa in very acid

894 V.R. Batistela et al. / Spectrochimica Acta Part A 79 (2011) 889– 897
F FractioE
cug
tmtotpo
aTv[22rotyt[tsh
(Haoqfi
ig. 8. EOS. (A) Absorbance variation in 490 and 517 nm at several pH values. (B)
H− , (c) E2− .
onditions (pH < 0) was not investigated. The point that remainsnclear is the attribution of these pKa values to the functionalroups in the RBB molecule.
It is known that the protonation of the phenolate group (xan-hene ring) affects the chromophore portion of the dye, providing
ore pronounced UV–Vis spectral changes than the protonation ofhe carboxylate group (benzene ring) [50,57]. In fact, for the previ-us EOS dye, only the pKa related to the OH group was detected byhe traditional methodology (S-shaped curve in the pH-absorbancerofile). Therefore, for RBB, the pKa of 3.93 is attributed to the OHf the xanthene ring and the other, 1.89, to the carboxylic group.
Similarly, two pKa were found for ERI (around 2.35 and 3.79,ttributed, respectively, to the carboxylic and the phenolic groups).he obtained second value for ERI (pKaOH2 3.79) is lower than thealues registered in the literature: 5.16 [16], 5.05 [58] and 4.0059]. In the same way, the first value obtained for ERI (pKaCOOH
.35) is lower than the values cited: 3.92 [16], 3.79 [58], and
.54 [59]. In order to clarify this, the determination for ERI wasepeated; however, the results (2.33 and 3.67) are very close tour previous values. Probably different experimental conditions ofemperature, dye concentration, ionic strength, methods of anal-sis, analyzed wavelength range, and the ERI self-aggregationendency in water caused these variations. Tests at pH 1.7 withERI] at 1.00 × 10⁻⁵ mol L−1 (which was twice the working concen-ration employed) exhibited aggregation processes in water. Theelf-aggregation of dyes in water is a very important process forydrophobic molecules [43,48] such as erythrosin B [16,60].
Nearly equivalent pKaOH2 values found for RBB (3.93) and ERI3.79) are due to the identical xanthene part of both compounds.owever, for the carboxylic group, the presence of four chlorinetoms bound to the benzene ring should diminish the pKaCOOH valuef RBB (1.89) as compared to ERI (2.35). On the other hand, it is
uite difficult to explain the ERI pKaCOOH (2.35) lower than the valueor EOS (3.80). Perhaps the mentioned self-aggregation, the exper-mental conditions, and some differences in the most prevalentFig. 9. Protolytic equilibriums illustrated with the mo
ns of species calculated by pKa obtained with chemometric methods: (a) EH2, (b)
tautomeric structure caused this difference. Protonation equilib-riums and the obtained pKa for RBB are illustrated in Fig. 10.
At high alkaline media (pH > 12), RBB suffers very fast degrada-tion (the same occurs with other derivatives, such as TNF). This factcan be attributed to the cleavage reaction by alkaline hydrolysis ofthe pyran ring, favored by specific effects that occur with iodineand nitro as substituents in the xanthene [36].
Finally, to assure the attribution of the RBB and ERI pKa,the erythrosin methyl ester derivative, named ERIMET (struc-ture in Fig. 1), an ester similar to EOSMET, was synthesized.The pKa of ERIMET was 3.74, which corresponds to the phe-nol group due to the absence of the carboxylic substituent.Therefore, the pKa values of 3.93 for RBB and 3.79 for ERIare related to the phenol group, which confirms the previousattribution.
3.5. The tetranitrofluorescein (TNF)
The TNF solutions in very acid media (pH < 1) are practicallycolorless, showing an intense absorption band at around 330 nm,as illustrated in Fig. 11A. As the pH is increased, the solutionsbecome colored showing a band at 505 nm that reaches maximumabsorbance at pH 1.8. Similar behavior is observed at 404 nm, whereband intensities did not change in the pH range of 3.5–12. However,at pH > 12, a kinetic process of bleaching was observed that involvesthe pyran ring rupture, as mentioned for RBB [36]. After 5 min, thesolution became almost colorless. This process is not detailed in thepresent work.
Fig. 11B shows the absorbance profile at some analyticalwavelengths. While the intensities at 330 nm and 404 nm onceagain suggest a single pKa point, the absorptions at 505 nm indi-
cate two pKa points whose values are equal to that found in50% water in ethanol [61]. In that work, the determination inpure water was not performed, probably due to the low TNFsolubility.st representative tautomeric structures of EOS.

V.R. Batistela et al. / Spectrochimica Acta Part A 79 (2011) 889– 897 895
Fig. 10. Protolytic equilibriums illustrated with the most representative tautomeric structures of RBB.
F ol L−
0 length
(spm
Ttaha[fodltaT
pd[bthmtpvta
The replacement of the oxygen by nitrogen atoms (FSC to N-FSC)resulted in small changes in the pKa values. The largest differenceof only 0.3 units occurs in pKaOH1 . This result can be justified by adouble-bond nitrogen–carbon that increases the electronic density
ig. 11. TNF (1.00 × 10⁻⁵ mol L−1) in an aqueous environment, ionic strength = 0.1 m.31, (c) 2.29, (d) 2.69, and (e) 7.25. (B) Absorbance variation in some specific wave
The chemometric analysis performed in the pH region from −1.1Hammet scale) to 7.0 showed that the presence of three protolyticpecies explains 99.959% of the information. It was obtained twoKa, 0.38 and 2.48, while the lowest pKa at pH < 0 was not deter-ined.According to the literature, the neutral TH2 and the dianionic
2− forms of TNF (Fig. 1) are present as lactone structures, whereashe monoanionic form is present as phenolate in organic solventsnd aqueous media [61,62]. Furthermore, the lactone T2− showsigh stability even in aqueous solutions with high water percent-ge, which is responsible for the maximum absorption at 404 nm62]. Usually, the dianionic form of oxyxanthene derivatives isound as phenolate or quinoid structures absorbing in the regionf 490–560 nm, as observed for fluorescein [20] and for all othererivatives studied in the present work. However, this unusual
actone structure observed for T2− of TNF is typical for nitro deriva-ives [54] sustained by the electro-withdrawing nitro substituentst positions 2- and 7- of the xanthene ring [61]. The spectra of theNF protolytic species are present in Fig. 12.
In the TH− deprotonation to T2−, with pKa = 2.48, a blue shift dis-lacement of the absorption band (505–404 nm) is observed. Thisisplacement is attributed to the conversion to a lactone structure62,63]. The lactone form is not a highly absorbing chromophoreecause its core carbon atom is sp3-hybridized, which interruptshe conjugation [61]. The lactonization can be responsible for theigh self-aggregation tendency observed and the decrease in itsolar absorptivity as compared to other xanthene dyes. Whereas
he neutral and the dianion species exist in solution as lactones, the
Ka values of TNF must be considered apparent pKa, because someariations include the opening and closing processes of the lac-one ring. Moreover, these pKa cannot be associated with a specificcid–base group.1, 30.0 ◦C. (A) Absorption spectra as a function of pH: (a) −0.68 (Hammet scale), (b)s.
3.6. Substituent effects on the pKa for the xanthene derivatives
The acidity of the phenolic groups (pKaOH1 and pKaOH2 )and the carboxylic groups (pKaCOOH ) can be correlated to thepresence of substituents on these dyes, considering the mostrepresentative tautomeric structures. The pKa values obtainedby chemometry are summarized in Table 2, including the FSCdata [20].
Fig. 12. Spectra of TNF estimated by the matriz-K method: (a) TH2, (b) TH− , (c) T2− .The experimental spectrum of the neutral TH2 form is included.

896 V.R. Batistela et al. / Spectrochimica A
Table 2pKa values of xanthene dyes in aqueous solutions calculated by chemometry at30.0 ◦C and ionic strength 0.1 mol L−1.
pKaOH1 pKaCOOH pKaOH2
FSC 2.50a ± 0.06 3.81a ± 0.08 6.10a ± 0.04N-FSCb 2.81 ± 0.07 3.88 ± 0.10 6.23 ± 0.09EOS <0 3.80 ± 0.06 2.02 ± 0.05EOSMET <0 Absent 2.11 ± 0.03ERI <0 2.35 ± 0.09 3.79 ± 0.08ERIMET <0 Absent 3.74 ± 0.07RBB <0 1.89 ± 0.06 3.93 ± 0.07
os
t[sitipOs(t
ttAtewtisF
tisFteedtpodaxxo
4
ebtmss
[[[[
[
[
[[[[[
[[[[
[
[
[[
[[
[
[
[
[[
[
[
[[[
a Values from Ref. [32].b pKaN = 5.62 ± 0.07.
n the O–H bond, favoring the maintenance of the hydrogen, whichlightly increases the pKaOH1 for N-FSC.
The results in Table 2 show similar pKa values for some inves-igated compounds. The pKa of the phenolic hydrogen is usually42] around ten. However, effects that reduce the electronic den-ity of the O–H bond lead to an increase in the phenol acidity. Thiss the case for all investigated dyes, since the aromatic ring boundo OH reduces its electronic density by resonance. Additionally, its clear that the electron-withdrawing substituents on carbons atositions 2-, 4-, 5-, and 7- of the xanthene strongly increase theH acidity (pKaOH1 and pKaOH2 ). The sequence of withdrawing sub-
tituent effects is: H (FSC and N-FSC) < I (RBB, ERI, and ERIMET) < BrEOS and EOSMET), which follows the sequence of the experimen-al pKaOH2 decreases.
Typical pKa of benzoic acid [42] is around 4.2. In xanthene dyes,he replacement of the ortho hydrogen to carboxylic group leadso higher –COOH acidity due to the electron withdrawing effect.mong the investigated dyes, only RBB presents substituents in
he benzene moiety that can directly affect the pKaCOOH – four stronglectron-withdrawing chlorine atoms instead of hydrogen atoms –hich justifies the lowest pKaCOOH observed for RBB, 1.89. However,
he benzene and xanthene rings must be approximately orthogonaln these derivatives. This geometry makes the carboxylic center lessensitive to substituents in the xanthene structure. For example,SC, N-FSC, and EOS show pKaCOOH around 3.8.
However, for EOS, there is an inversion between the pKa ofhe carboxylic and the phenolic groups: pKaCOOH > pKaOH2 . Thisnversion is justified by the presence of four electron-withdrawingubstituents (X = Br, Fig. 1) in the xanthene ring, as reported [56].or FSC and N-FSC (X = H, Fig. 1) and RBB and ERI (X = I, Fig. 1),he acidity follows pKaCOOH < pKaOH2 due to the presence of slightlylectron-withdrawing atoms in the xanthene ring. It is worthmphasizing the importance of EOSMET and ERIMET, methyl estererivatives of eosin Y and erythrosin B, respectively. The pKa ofhese ester compounds allowed for unequivocal attributing of thoseKaOH2 values, which for EOS, RBB, and ERI dyes are not easily rec-gnizable. Regarding the pKaCOOH of ERI (2.35) and EOS (3.80), airect comparison based on iodine and bromine substituents is notdequate. Indeed, for the COOH–COO− equilibrium, ERI has theanthene ring connected to the phenolate group, while EOS has theanthene ring connected to the phenolic group, due to the inversionf the EOS pKa.
. Conclusions
The investigated xanthene dyes showed complex acid–basequilibriums in water, presenting close pKa values and a strongand overlapping among the protolytic species, which did not leads
o reliable pKa values by traditional methodologies. Chemometricethods demonstrated high potential for the complex protolyticystem analysis. The values found showed coherence by the pre-umed effects for each substituent, and the electronic absorption
[[
[
cta Part A 79 (2011) 889– 897
spectra of some protolytic species were estimated. Even for the N-FSC system, which exhibits four close protolytic equilibriums, thechemometric methodology resulted in reliable pKa values. In addi-tion, the pKa attribution to the corresponding acid–base center maybe helpful in future studies.
Acknowledgements
This work was supported by the Brazilian granting agen-cies Fundac ão Araucária/Paraná, FAPESP/São Paulo, CNPq andCAPES/NanoBiotec. The authors are grateful to Laerte J. da Silva forthe English language revision.
References
[1] J. Slavik, Fluorescent Probes in Cellular and Molecular Biology, CRC Press,Florida, 1994.
[2] G.K. Walkup, S.C. Burdette, S.J. Lippard, R.Y. Tsien, J. Am. Chem. Soc. 122 (2000)5644–5645.
[3] T. Hirano, K. Kikuchi, Y. Urano, T. Higuchi, T. Nagano, J. Am. Chem. Soc. 122(2000) 12399–12400.
[4] S.S. Hayreh, M.B. Zimmerman, Ophthalmology 114 (9) (2007) 1763–1772.[5] M.E. Martinez-Perez, A.D. Hughes, S.A. Thom, A.A. Bharath, K.H. Parker, Med.
Image Anal. 11 (2007) 47–61.[6] A. Saha, S.K. Basiruddin, R. Sarkar, N. Pradhan, N.R. Jana, J. Phys. Chem. C 113
(43) (2009) 18492–18498.[7] N. Baccan, J.C. Andrade, O.E.S. Godinho, J.S. Barone, Química Analítica Quanti-
tativa, third ed., Edgard Blücher, São Paulo, 2001.[8] W. Tan, Z. Shi, Y. Kopelman, Anal. Chem. 64 (23) (1992) 2985–2990.[9] E.P. Chagas, L.R. Durrant, Enzyme Microb. Technol. 29 (2001) 473–477.10] R.H. Bisby, R. Brooke, S. Navaratnam, Food Chem. 108 (2008) 1002–1007.11] G. Clark, Staining Procedures, fourth ed., Williams & Wilkins, Baltimore, 1981.12] D. Zoukhri, Exp. Eye Res. 82 (5) (2006) 885–898.13] N.G. Nikitakis, H. Rivera, C. Lariccia, J.C. Papadimitriou, J.J. Sauk, Oral Surg. Oral
Med. Oral Pathol. Oral Radiol. Endod. 96 (1) (2003) 42–47.14] A.J. Gava, Princípio da Tecnologia de Alimentos, third ed., Nobel, São Paulo,
1981.15] N.S. Allen, J.F. Mc Keller, Photochemistry of Dyed and Pigmented Polymers, first
ed., Applied Science Publishers, London, 1980.16] N.O. Mchedlov-Petrossyan, Russ. J. Org. Chem. 19 (4) (1983) 797–805.17] R. Sjöback, J. Nygren, M. Kubista, Spectrochim. Acta A 51 (1995) L7–L21.18] N. Klonis, W.H. Sawyer, J. Fluorescence 6 (3) (1996) 147–156.19] N.O. Mchedlov-Petrossyan, Russ. J. Gen. Chem. 73 (2) (2003) 267–274.20] V.R. Batistela, J.C. Cedran, H.P.M. Oliveira, I.S. Scarminio, L.T. Ueno, A.E.H.
Machado, N. Hioka, Dyes Pigments 86 (2010) 15–24.21] B.B. Neto, I.S. Scarmínio, R.E. Bruns, Quím. Nova 29 (6) (2006) 1401–1406.22] R.G. Brereto, Analyst 125 (2000) 2125–2154.23] M.M. Sena, I.S. Scarmínio, K.E. Collins, C.H. Collins, Talanta 53 (2000) 453–461.24] I.S. Scarmínio, D.N. Ishikawa, W.J. Barreto, E.L. Paczkowski, I.C. Arruda, Quím.
Nova 21 (5) (1998) 590–596.25] K.R. Beebe, R.J. Pell, M.B. Seasholtz, Chemometrics: A Practical Guide, Wiley,
New York, 1998.26] B.S. Everitt, G. Dunn, Applied Multivariate Data Analysis, John Wiley & Sons,
New York, 1991.27] P.R.M. Correia, M.M.C. Ferreira, Quím. Nova 30 (2) (2007) 481–487.28] M.A. Sharaf, D.L. Illman, B.R. Kowalski, Chemometrics, John Wiley & Sons, New
York, 1986.29] A.T. Miesch, Comput. Geosci. 1 (1976) 147–159.30] R.A. Reyment, K.G. Jöreskog, J.E. Klovan, Geological Factor Analysis, Elsevier,
Amsterdam, 1976.31] J.C. Davis, Statistics and Data Analysis in Geology, third ed., John Wiley & Sons,
New York, 2002.32] W.W. Cooley, P.R. Lohnes, Multivariate Data Analysis, John Wiley & Sons, New
York, 1971.33] R. Kramer, Chemometric Techniques for Quantitative Analysis, Marcel Dekker,
New York, 1998.34] P.M. Lang, J.H. Kalivas, J. Chemom. 7 (1993) 153–163.35] F. Amat-Guerri, M.M.C. López-González, R. Martínez-Utrilla, R. Sastre, Dyes
Pigments 12 (1990) 249–272.36] D.V. Samoilov, V.P. Martynova, A.V. El’tsov, Russ. J. Gen. Chem. 69 (9) (1999)
1450–1460.37] B.A.F. Previdello, F.R. Carvalho, A.L. Tessaro, V.R. Souza, N. Hioka, Quím. Nova
29 (3) (2006) 600–606.38] P.H. Marc o, I.S. Scarminio, Anal. Chim. Acta 583 (2007) 138–146.39] A.I. Vogel, Análise Química Quantitativa, sixth ed., LTC, Rio de Janeiro, 1992.40] W.F. Costa, L.M. Aleixo, O.E.S. Godinho, Anal. Chim. Acta 257 (1992) 35–39.
41] W.F. Costa, L.M. Aleixo, O.E.S. Godinho, Microchem. J. 35 (1987) 153–157.42] D.R. Lide (Ed.), CRC Handbook of Physics and Chemistry, eighty-fifth ed., CRCPress, New York, 2005.43] A.L. Tessaro, D.M. Fernandes, A.J. Terezo, V.R. Souza, N. Hioka, J. Porphyrins
Phthalocyanines 9 (9) (2005) 609–616.

mica A
[
[
[[[
[
[
[
[
[
[
[[[
[
[
[
[
V.R. Batistela et al. / Spectrochi
44] A. Albert, E.P. Serjeant, The Determination of Ionization Constants: A LaboratoryManual, second ed., Chapman and Hall, London, 1971.
45] N.O. Mchedlov-Petrossyan, V.N. Kleshchevnikova, J. Chem. Soc., Faraday Trans.90 (4) (1994) 629–640.
46] P. Levillain, D. Fompeydie, Anal. Chem. 57 (13) (1985) 2561–2563.47] O. Valdes-Aguilera, D.C. Neckers, Acc. Chem. Res. 22 (1989) 171–177.48] F.I. Simplício, R.R.S. Soares, F. Maionchi, O. Santin Filho, N. Hioka, J. Phys. Chem.
A 108 (43) (2004) 9384–9389.49] J.H. Espenson, Chemical Kinetics and Reactions Mechanism, first ed., McGraw-
Hill, New York, 1987.50] T. Ueno, Y. Urano, K. Setsukinai, H. Takakusa, H. Kojima, K. Kikuchi, K. Ohkubo,
S. Fukuzumi, T. Nagano, J. Am. Chem. Soc. 126 (2004) 14079–14085.51] N.O. Mchedlov-Petrossyan, O.N. Tychina, T.A. Berezhnaya, V.I. Alekseeva, L.P.
Savvina, Dyes Pigments 43 (1999) 33–46.52] N.O. Mchedlov-Petrossyan, V.I. Kukhtik, V.D. Bezugliy, J. Phys. Org. Chem. 16
(2003) 380–397.53] T. Miura, Y. Urano, K. Tanaka, T. Nagano, K. Ohkubo, S. Fukuzumi, J. Am. Chem.
Soc. 125 (28) (2003) 8666–8671.
[
[
cta Part A 79 (2011) 889– 897 897
54] S. Ghelli, G. Rastelli, D. Barlocco, M. Rinaldi, D. Tondi, P. Pecorari, M.P. Costi,Bioorg. Med. Chem. Lett. 4 (10) (1996) 1783–1794.
55] H. Birkedal-hansen, Histochimie 36 (1973) 73–87.56] D.C. Neckers, J. Chem. Educ. 64 (8) (1987) 649–656.57] D.L. Pavia, G.M. Lampan, G.S. Kriz, Introduction to Spectroscopy, second ed.,
Saunders, Orlando, 1996.58] É.P. Shkrobot, N.V. Lukashenkova, N.S. Tolmacheva, G.I. Rodman, Metallurgiya
34 (1971) 22.59] M.A. Matveets, D.P. Shcherbov, S.D. Akhmetova, Zh. Anal. Khim. 34 (1979)
1049.60] N.O. Mchedlov-Petrosyan, L.P. Adamovich, L.E. Nikishina, Zh. Anal. Khim. 35
(1980) 1495.61] D.V. Samoilov, N.O. Mchedlov-Petrosyan, V.P. Martynova, A.V. El’tsov, Russ. J.
Gen. Chem. 70 (8) (2000) 1259–1271.62] N.O. Mchedlov-Petrossyan, N.A. Vodolazkaya, Y.N. Surov, D.V. Samoilov, Spec-
trochim. Acta A 61 (2005) 2747–2760.63] N.I. Rtishchev, D.V. Samoilov, V.P. Martynova, A.V. El’tsov, Russ. J. Gen. Chem.
71 (9) (2001) 1467–1478.