pl757 case 2:13-cv-00193 document 671-19 filed in txsd on ...5. my cv is provided as appendix a to...
TRANSCRIPT

IN THE UNITED STATES DISTRICT COURT FOR THE SOUTHERN DISTRICT OF TEXAS
CORPUS CHRISTI DIVISION
UNITED STATES OF AMERICA,
Plaintiff, TEXAS LEAGUE OF YOUNG VOTERS EDUCATION FUND and IMANI CLARK,
Plaintiff-Intervenors,
v. STATE OF TEXAS; NANDITA BERRY, in
her official capacity as Texas Secretary of State; and STEVE McCRAW, in his official capacity as Director of the Texas Department of Public Safety,
Defendants.
) ) ) ) ) ) ) ) ) ) ) ) ) ) ) ) ) )
Civ. No. 2:13-cv-00263
AMENDED EXPERT REPORT
OF Coleman Bazelon
ON BEHALF OF PLAINTIFF-INTERVENORS TEXAS LEAGUE OF YOUNG VOTERS EDUCATION FUND AND IMANI CLARK
August 15, 2014
PL7579/2/20142:13-cv-00193
Case 2:13-cv-00193 Document 671-19 Filed in TXSD on 11/11/14 Page 1 of 207

Table of Contents
I. Summary of Conclusions ............................................................................................................. 1
II. Qualifications ............................................................................................................................... 1
III. Statement of Inquiry ................................................................................................................... 2
III.A. Assignment ......................................................................................................................... 2
III.B. Materials Considered ......................................................................................................... 2
IV. Case Background ......................................................................................................................... 2
V. Outline of Methodology .............................................................................................................. 3
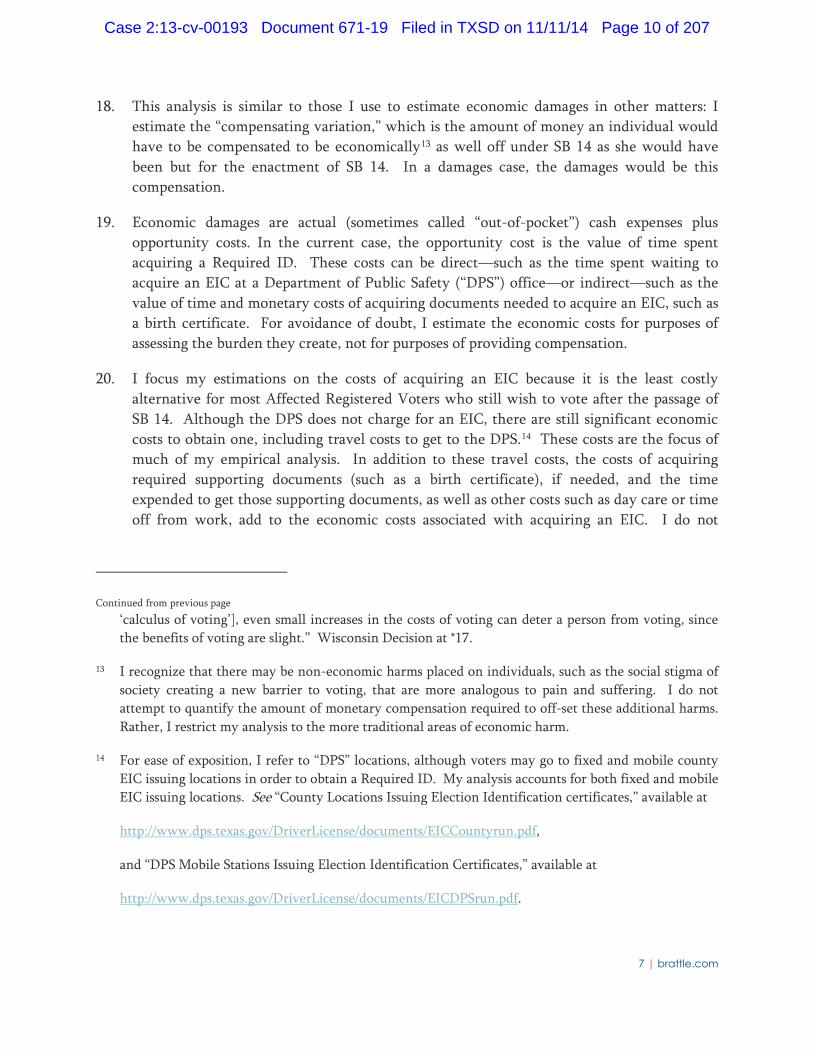
V.A. Methodology for Testing Whether SB 14 Has a Differential Impact By Race ............... 4
V.B. Prevalence: Racial Composition of Affected Registered Voters ...................................... 5
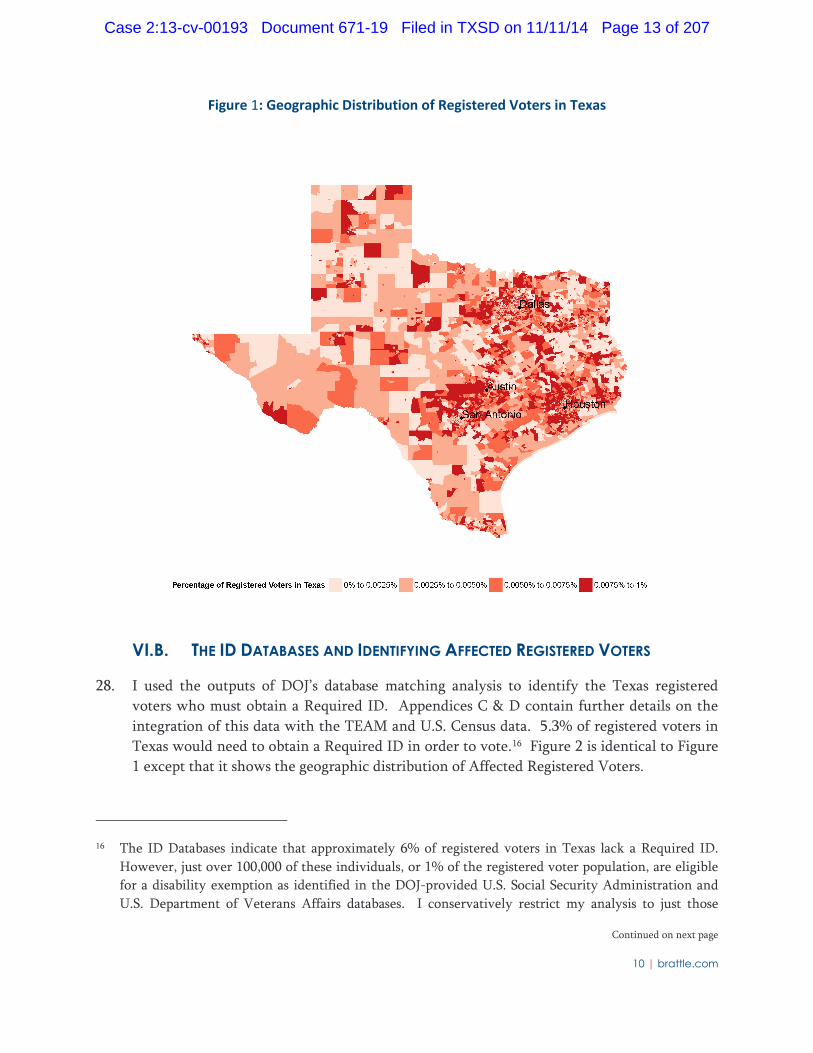
V.C. The Economic Costs Imposed by SB 14 ............................................................................ 6
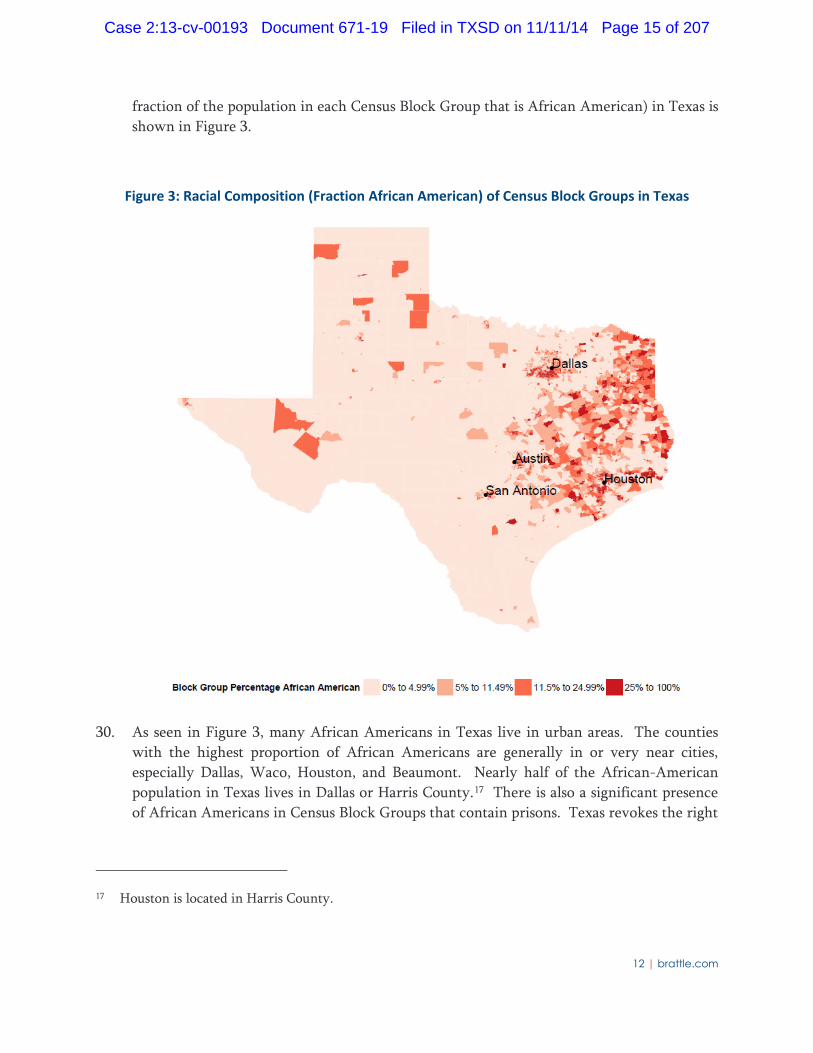
V.D. The Burden Imposed by SB 14 .......................................................................................... 8
VI. Prevalence: The Racial Composition of Affected Registered Voters ........................................ 8
VI.A. The TEAM Database .......................................................................................................... 9
VI.B. The ID Databases and Identifying Affected Registered Voters ..................................... 10
VI.C. Racial Composition of Affected Registered Voters ........................................................ 11
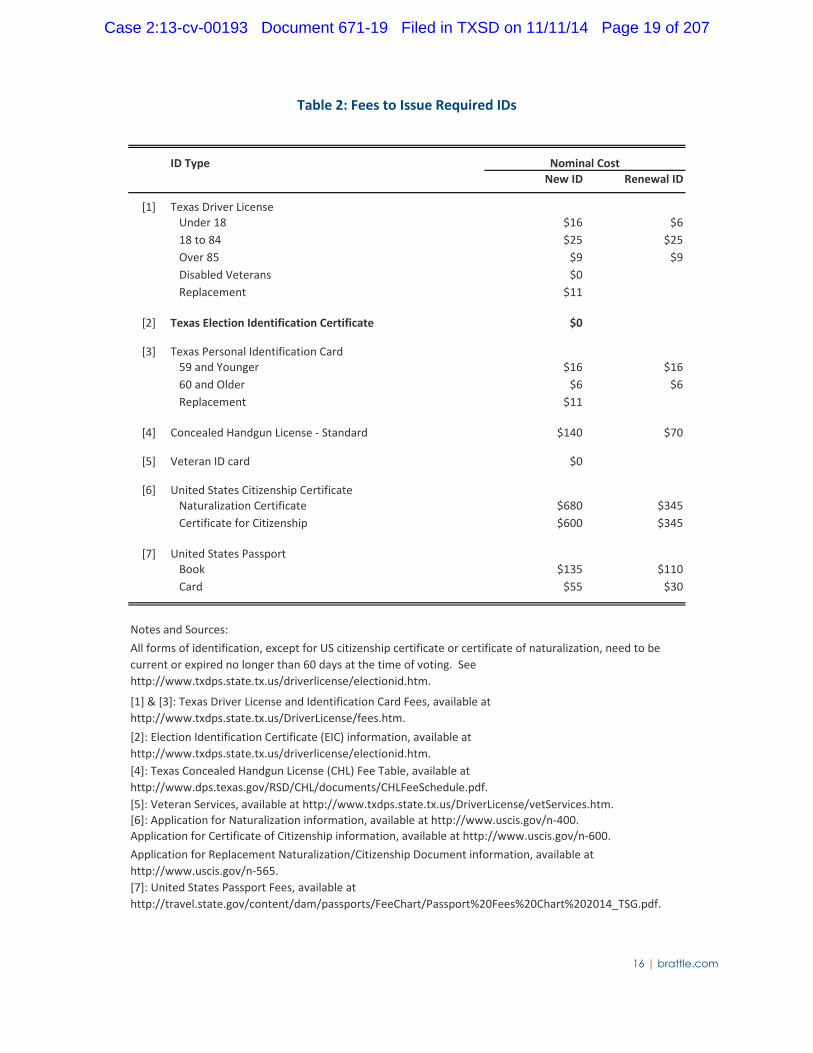
VII. The Economic Costs Imposed by SB 14 .................................................................................... 15
VII.A. A “Free” EIC Is Not Costless to Obtain .................................................................. 18
VII.B. The Costs of Documents Required to Obtain an EIC ........................................... 19
VII.C. Travel Costs to Obtain an EIC ................................................................................ 22
VII.D. Total Costs to Obtain an EIC by Race.................................................................... 29
VIII. Obtaining the Required IDs is More Burdensome for African Americans ............................ 31
VIII.A. African Americans in Texas have Lower Incomes than White Texans ............... 31
Case 2:13-cv-00193 Document 671-19 Filed in TXSD on 11/11/14 Page 2 of 207

VIII.B. African Americans in Texas have Less Wealth than White Texans .................... 33
VIII.C. African Americans in Texas are More Likely to be Poor than White Texans .... 34
VIII.D. African Americans in Texas Score Lower on Other Measures of Socioeconomic Status than White Texans ...................................................................... 35
VIII.E. SB 14 Creates a Higher Expected Burden for Affected Registered Voters Who are African American than for those Who are White .......................................... 36
IX. Registered African-American Student Voters in Texas .......................................................... 37
Appendix A – Curriculum Vitae of Coleman Bazelon ...................................................................... 38
Appendix B – Materials Relied Upon ................................................................................................ 39
Appendix C – Geocoding Methodology ............................................................................................ 44
I. Racial Composition of Registered Voters ................................................................................. 44
II. Transportation Costs by Block Group ...................................................................................... 44
Appendix D – Determination of Affected Registered Voter Probability by Race .......................... 45
Appendix E: Documentation Required to Obtain an EIC ................................................................ 48
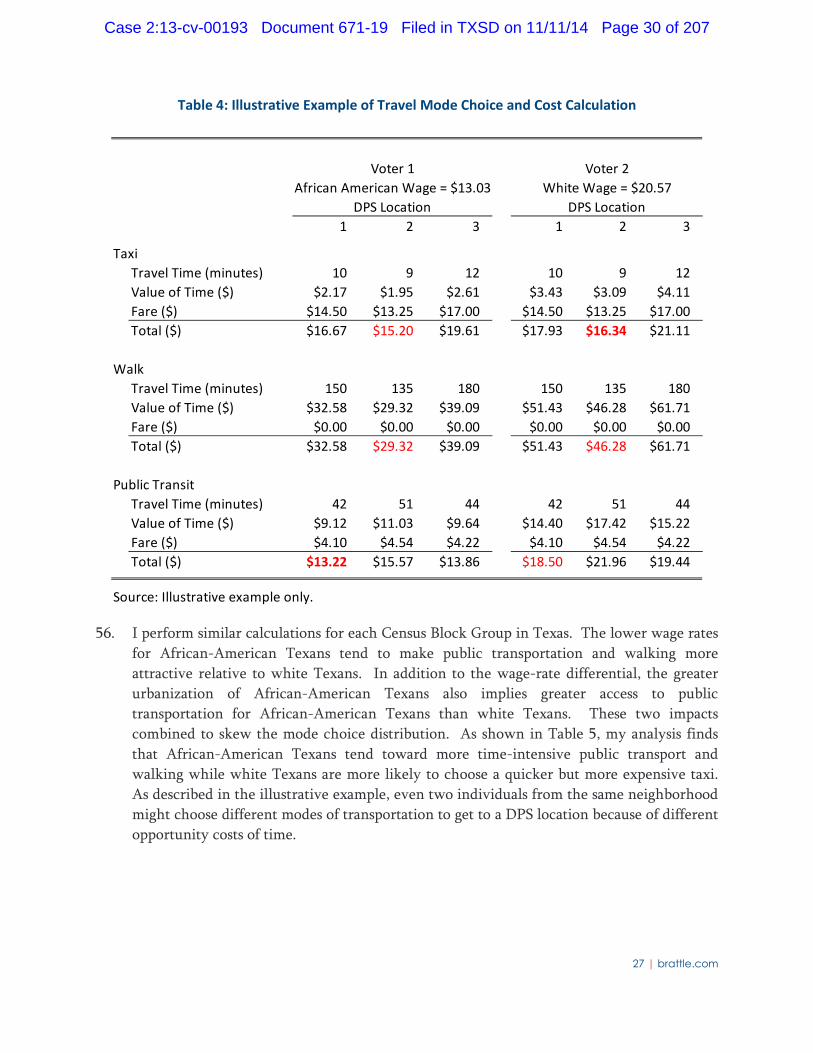
Case 2:13-cv-00193 Document 671-19 Filed in TXSD on 11/11/14 Page 3 of 207

1 | brattle.com
I. Summary of Conclusions
1. I examined the distribution and racial composition of registered voters in Texas who, as a result of Texas Senate Bill 14 (“SB 14”), will not be able to vote without acquiring a form of photo ID permitted by SB 14. My analysis leads to three conclusions:
• A disproportionate share of registered voters who will need a new ID to continue to be able to vote are African American.
• Acquiring an ID for the purpose of voting, including a nominally free ID, comes with real economic costs. As an example, I have estimated that the average travel cost to obtain an Election Identification Certificate (“EIC”) is $42.18.
• The burden of the costs imposed by SB 14 is substantially higher for African-American Texans, who are disproportionately poorer, than for white Texans. For example, the share of wealth represented by the travel costs needed to acquire an EIC is more than four times higher for African-American Texans than they are for white Texans.
II. Qualifications
2. I am a principal in the Washington, DC office of The Brattle Group (“Brattle”), an economic consulting firm that provides litigation support in a wide variety of areas. Prior to joining Brattle, I was a vice president with Analysis Group, an economic and strategy consulting firm. I also served as a Principal Analyst in the Microeconomic and Financial Studies Division of the Congressional Budget Office.
3. I received a Ph.D. and M.S. in Agricultural and Resource Economics from the University of California at Berkeley, a Diploma in Economics from the London School of Economics and Political Science, and a B.A. from Wesleyan University.
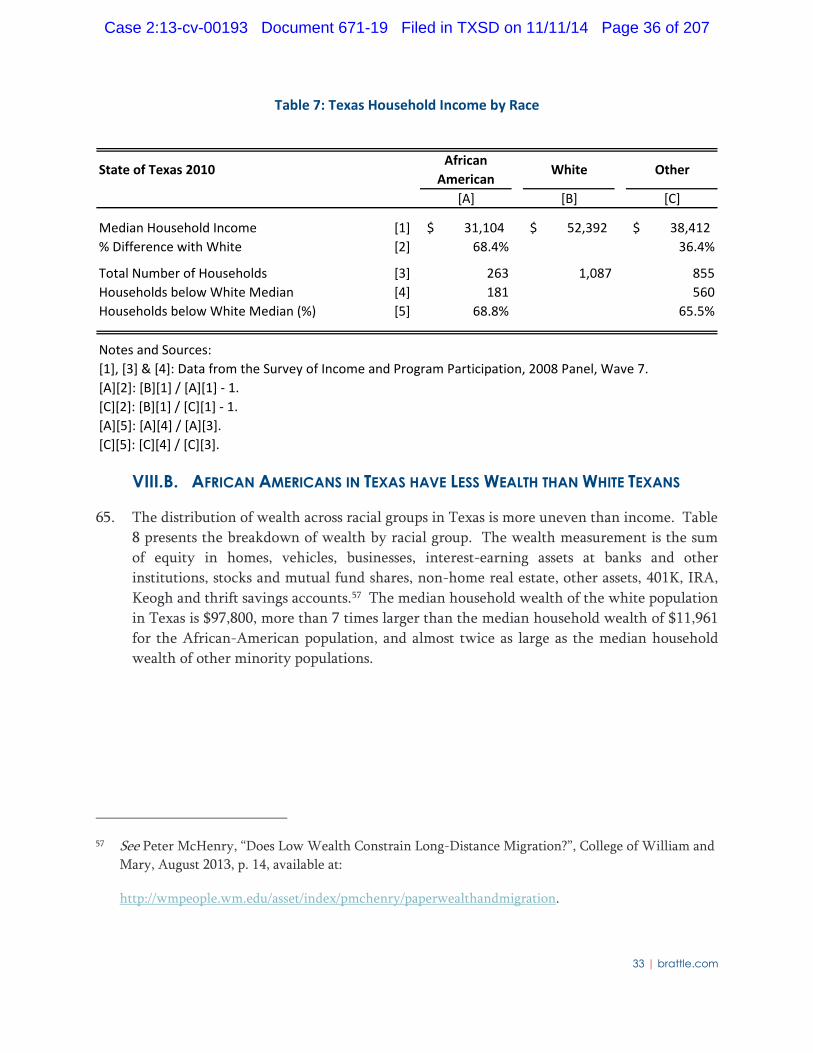
4. For the past two decades, I have been a practicing economist applying economic principles to questions of valuation, regulation, policy and strategy. In doing so, I frequently provide testimony to federal and state courts and to arbitrators, as well as advise regulatory and legislative bodies, including the U.S. Federal Communications Commission and the U.S. Congress. In carrying out economic analysis, I regularly utilize statistical analysis and work with large datasets.
5. My CV is provided as Appendix A to this Expert Report. I am being compensated at my customary rate of $550 per hour for my work on this report, including any deposition
Case 2:13-cv-00193 Document 671-19 Filed in TXSD on 11/11/14 Page 4 of 207

2 | brattle.com
testimony or testimony in court; however, Brattle has agreed to limit total compensation in this matter.
III. Statement of Inquiry
III.A. ASSIGNMENT
6. I have been asked to evaluate the economic burden that SB 14 imposes on Texas voters and to assess whether that burden varies depending on the voter’s race.
III.B. MATERIALS CONSIDERED
7. I relied on numerous documents produced in this matter and data and documents available from public sources. A full list of materials considered is provided in Appendix B.
IV. Case Background
8. In 2011, SB 14 was signed into law. In relevant part, SB 14 requires voters who vote in person to show proof of identity through the presentation of one of a specific set of state or federal issued IDs that include the voter’s picture (“Required IDs”).1 The law requires would-be voters who do not have a Required ID to obtain one in order to vote. Plaintiff-Intervenors assert that this burden falls disproportionately and severely on voters in specific sub-groups, including racial sub-groups, in violation of the Voting Rights Act (“VRA”) and the U.S. Constitution, and challenge SB 14 on that basis.
9. In 2012, the State of Texas sued the U.S. Department of Justice (“DOJ”) in the United States District Court for the District of Columbia under Section 5 of the VRA to gain “preclearance” to allow SB 14 to go into effect. In blocking SB 14 from going into effect, the court found that Texas failed to meet its burden to show that the law would not be retrogressive to minority voters.2 In 2013, the U.S. Supreme Court struck down Section
1 These IDs include a Texas driver’s license, Texas personal identification card, United States military identification card, United States citizenship certificate that contains a photograph, United States passport, a Texas license to carry a concealed handgun, or a Texas Election Identification Certificate. See
http://votesmart.org/bill/12588/voter-identification-requirements#.U6Nunp3D8TQ. Except for the U.S. citizenship certificate, these IDs must either be current or expired for no more than 60 days.
2 Texas v. Holder, 888 F.Supp.2d 113 (D.D.C. 2012).
Case 2:13-cv-00193 Document 671-19 Filed in TXSD on 11/11/14 Page 5 of 207

3 | brattle.com
4(b), the provision of the VRA that applied Section 5 to Texas and other jurisdictions covered by that provision.3 That decision allowed SB 14 to go into effect and led to the current litigation brought under Section 2 of the VRA.
10. My understanding from counsel is that, unlike Section 5 of the VRA, in which the burden is on the jurisdiction itself to demonstrate that the voting change at issue is not discriminatory, Section 2 of the VRA requires the party challenging the law at issue to show that the voting change at issue is discriminatory. In the current case filed under Section 2 of the VRA, the Plaintiffs are required to make a positive showing of, among other things, the burden imposed by SB 14. This report explains my analysis of the economic costs—one type of burden—imposed by SB 14. I find that these costs are meaningful and fall disproportionately on African Americans. Because African Americans in Texas generally have lower incomes and less wealth than white Texans, the impact of these costs is even more disproportionate than are the costs themselves.
V. Outline of Methodology
11. I examine the burden that SB 14 creates on Texans using three complementary analyses. In each case, I find that SB 14 burdens African-American Texans more heavily than white Texans. I find that:
a. With regard to “Prevalence” — Registered voters in Texas who do not have a Required ID (“Affected Registered Voters”)4 are disproportionately African American.5
3 Shelby County v. Holder, 570 U.S. __, 133 S. Ct. 2612 (2013).
4 I define “Affected Registered Voters” to be those registered voters whose only option is to obtain a Required ID in order to vote. Other registered voters may also be affected by SB 14. For example, individuals with a disability rating of 50% or higher with the U.S. Social Security Administration or the U.S. Department of Veterans Affairs may apply for exemption status from a Required ID. Until they apply for and receive the disability exemption, however, they will not be able to vote without a Required ID. As my analysis is restricted to only those individuals who must obtain a Required ID in order to vote, I exclude persons eligible for a disability exemption. See
http://votetexas.gov/register-to-vote/need-id/.
5 By focusing on registered voters, I am ignoring some potential avenues that could cause SB 14 to impact African Americans differently from non-minorities. For example, I do not investigate issues related to eligible but unregistered voters, including whether or not their costs of acquiring a required photo ID exhibit disproportionate burdens associated with race. Voter integrity issues have been
Continued on next page
Case 2:13-cv-00193 Document 671-19 Filed in TXSD on 11/11/14 Page 6 of 207

4 | brattle.com
b. With regard to “Cost” — Acquiring a Required ID solely for the purpose of voting is costly, including for the nominally free EIC.
c. With regard to “Burden” — The burden of the economic costs imposed by SB 14 is higher for African Americans in Texas because they are disproportionately poor.
V.A. METHODOLOGY FOR TESTING WHETHER SB 14 HAS A DIFFERENTIAL IMPACT BY RACE
12. I test to see whether the burden created by SB 14 has a disproportionate impact on minorities, specifically African Americans. General reliance on statistical analysis to detect the disproportionate impact of a government or business practice, process, or policy on minorities is well established. In response to courts and policymakers, a number of important and influential articles and books on the topic of differential impacts of various policies on minorities have been published.6 Since those early studies, disparate treatment analyses have been applied in a variety of settings including housing, employment, lending, and education. In all of these settings, statistical analyses are employed to measure differences in observed outcomes from the application of a particular process or practice that appeared facially neutral.
Continued from previous page raised to support SB 14, but most of those issues are addressed by the voter registration process. For example, issues related to voter eligibility, such as age and citizenship, are directly addressed in the voter registration process. See
http://votetexas.gov/register-to-vote/register-to-vote.
Other voter eligibility issues, such as felony status, are addressed in the voter registration process and are not enhanced by voter picture ID requirements because the IDs do not require identification of felony status. Even residency, which is addressed at the voter registration stage, is only confirmed by some Required IDs. Even when the Required ID is one that has the voter’s address, however, the confirmation is weak in that if an individual moves but retains her original voter registration, she may also easily keep a photo ID with the prior (previously valid) address.
6 David C. Baldus and James W.L. Cole, Statistical Proof of Discrimination, Colorado Springs: Shepard’s McGraw Hill, 1980; Michael Fix and Raymond J. Struyk editors, Clear and Convincing Evidence Measurement of Discrimination in America, Washington D.C.: The Urban Institute Press, 1993 (hereinafter “Fix and Struyk”); and Alicia H. Munnell et.al. (1996) “Mortgage Lending in Boston: Interpreting HMDA Data.” The American Economic Review 86:25-53 (hereinafter “Munnell et al. 1996”).
Case 2:13-cv-00193 Document 671-19 Filed in TXSD on 11/11/14 Page 7 of 207

5 | brattle.com
13. The general approach to determining the existence of a differential impact or burden of a policy or practice involves first establishing a benchmark—an expected outcome absent discrimination.
a. In the case of housing, this may be a distribution of rental agreement outcomes based on the distribution of applicants possibly controlling for decision factors such as income.7 These outcomes are compared statistically to actual acceptance rates or expected acceptance rates while controlling for other decision factors.
b. In the case of mortgage lending, statistical analysis is used to establish whether a facially neutral lending decision process results in disparate results for similarly situated applicants across race and ethnic groups.8 Again, actual rates are compared to expected rates based on application distributions and decision factors such as income or credit score.
c. A similar approach is taken in the employment context to review hiring and promotion decisions.9 Actual rates are compared to expected rates controlling for job qualifications such as education, test scores, and experience.
14. Traditional differential impact analysis that distinguishes between acceptable and unacceptable causes of variation in impacts is not applied here. The current analysis, however, is analogous to those analyses in that it posits that, absent a difference in impact based on race, the burden of SB 14 would be the same for African Americans as for all other Texas voters. Empirical evidence sufficient to reject this hypothesis therefore would imply a differential impact and that SB 14 imposes a greater burden on African Americans.
V.B. PREVALENCE: RACIAL COMPOSITION OF AFFECTED REGISTERED VOTERS
15. An analysis of differential impact begins with an expectation about what various data would show absent any differential impacts. In the current case, that baseline expectation regarding the racial composition of Affected Registered Voters is that it is proportional to the racial composition of all registered voters in Texas. To test this expectation, I examine whether African-American registered voters are more likely than other Texan registered
7 John Yinger, “Access Denied, Access Constrained: Results and Implications of the 1989 Housing
Discrimination Study,” in Fix and Struyk, 1993, pp. 69-112.
8 Munnell et.al, 1996.
9 Glen Cain (1986), “The Economic Analysis of Labor Market Discrimination,” in O. Ashenfelter and R. Layards editors, Handbook of Labor Economics 1: 693-785.
Case 2:13-cv-00193 Document 671-19 Filed in TXSD on 11/11/14 Page 8 of 207

6 | brattle.com
voters to need to obtain a Required ID in order to vote. For my analysis, the association of race with Affected Registered Voters relies on two separate algorithms:
a. Matching Texas’ registered voters to various state and federal ID databases to identify the registered voters who would need to obtain a Required ID to retain their ability to vote.10
b. Assigning these Affected Registered Voters to Census Block Groups based on their geocoded addresses, and inferring racial composition based on the racial composition of the Census Block Groups. As further explained in Section VI.C, my method is conservative in that by focusing on geographic variation at the Block Group level, I do not capture all of the expected racial variation in Affected Registered Voters.
16. I find that the proportion of Affected Registered Voters who are African American is greater than if SB 14 were race neutral. In other words, if all one knows about a registered voter is her race, then it is more likely that SB 14 imposes a burden on her if she is African American than if she is not.
V.C. THE ECONOMIC COSTS IMPOSED BY SB 14
17. But for the passage of SB 14, Affected Registered Voters still would be able to vote without incurring any additional expenses.11 Using standard economic and statistical methods, I estimate the additional economic costs due to the passage of SB 14 that these voters would face if they wish to vote.12
10 The matching of registered voters with state and federal ID databases was performed by DOJ.
11 Prior to the passage of SB 14, Texas had a voter ID law, but photo IDs were not required. The previous law allowed voters to establish identity with items such as “official mail addressed to the person by name from a governmental entity” or “a copy of a current utility bill, bank statement, government check, paycheck, or other government document that shows the name and address of the voter,” which would create much less of a burden than a photo ID requirement. Tex. Elec. Code Ann. § 63.0101 (valid through December 31, 2011).
12 This approach is consistent with the test set out in Frank v. Walker, 2014 WL 1775432, at *25 (E.D.Wis. Apr. 29, 2014) (hereinafter “Wisconsin Decision”): “Based on the text, then, I conclude that Section 2 protects against a voting practice that creates a barrier to voting that is more likely to appear in the path of a voter if that voter is a member of a minority group than if he or she is not.”
The current analysis does not measure burden based on the outcome of voting. There is a rich literature on the determinants of voting, beginning with Anthony Downs, AN ECONOMIC THEORY OF
DEMOCRACY, (New York: Harper & Brothers, 1957). Recent scholarship finds that, “Under [the
Continued on next page
Case 2:13-cv-00193 Document 671-19 Filed in TXSD on 11/11/14 Page 9 of 207
7 | brattle.com
18. This analysis is similar to those I use to estimate economic damages in other matters: I estimate the “compensating variation,” which is the amount of money an individual would have to be compensated to be economically13 as well off under SB 14 as she would have been but for the enactment of SB 14. In a damages case, the damages would be this compensation.
19. Economic damages are actual (sometimes called “out-of-pocket”) cash expenses plus opportunity costs. In the current case, the opportunity cost is the value of time spent acquiring a Required ID. These costs can be direct—such as the time spent waiting to acquire an EIC at a Department of Public Safety (“DPS”) office—or indirect—such as the value of time and monetary costs of acquiring documents needed to acquire an EIC, such as a birth certificate. For avoidance of doubt, I estimate the economic costs for purposes of assessing the burden they create, not for purposes of providing compensation.
20. I focus my estimations on the costs of acquiring an EIC because it is the least costly alternative for most Affected Registered Voters who still wish to vote after the passage of SB 14. Although the DPS does not charge for an EIC, there are still significant economic costs to obtain one, including travel costs to get to the DPS.14 These costs are the focus of much of my empirical analysis. In addition to these travel costs, the costs of acquiring required supporting documents (such as a birth certificate), if needed, and the time expended to get those supporting documents, as well as other costs such as day care or time off from work, add to the economic costs associated with acquiring an EIC. I do not
Continued from previous page
‘calculus of voting’], even small increases in the costs of voting can deter a person from voting, since the benefits of voting are slight.” Wisconsin Decision at *17.
13 I recognize that there may be non-economic harms placed on individuals, such as the social stigma of society creating a new barrier to voting, that are more analogous to pain and suffering. I do not attempt to quantify the amount of monetary compensation required to off-set these additional harms. Rather, I restrict my analysis to the more traditional areas of economic harm.
14 For ease of exposition, I refer to “DPS” locations, although voters may go to fixed and mobile county EIC issuing locations in order to obtain a Required ID. My analysis accounts for both fixed and mobile EIC issuing locations. See “County Locations Issuing Election Identification certificates,” available at
http://www.dps.texas.gov/DriverLicense/documents/EICCountyrun.pdf,
and “DPS Mobile Stations Issuing Election Identification Certificates,” available at
http://www.dps.texas.gov/DriverLicense/documents/EICDPSrun.pdf.
Case 2:13-cv-00193 Document 671-19 Filed in TXSD on 11/11/14 Page 10 of 207

8 | brattle.com
estimate these additional costs of acquiring an EIC; rather, I focus on the travel costs of acquiring an EIC that will be borne by almost all Affected Registered Voters. The additional costs beyond travel costs, however, are among the economic costs created by SB 14. As a result, the costs estimated in this report are conservative; for many Affected Registered Voters, the total cost of obtaining an EIC will be higher than the costs estimated in this report.
21. I estimate travel costs separately for African-American and other Texan Affected Registered Voters. I find that the economic costs imposed on both African-American and other Texan Affected Registered Voters are meaningful, and average $42.18 for all registered voters in Texas.
V.D. THE BURDEN IMPOSED BY SB 14
22. Beyond the difference in prevalence of these costs for African-American and white Texans, the “burden” that the same economic cost imposes on different individuals varies as their ability to bear those costs varies: all else equal, a wealthy or high income individual will find a given economic cost less burdensome than a poor or low income individual. Economists explain this as stemming from the diminishing marginal utility of wealth. In layman’s—or common sense—terms it means that an extra $100 to a wealthy individual adds less to her well-being than does an extra $100 to a poor individual. Similarly, losing $100 is a greater loss to someone with a low income compared to someone with a high income. The implication of this is that any cost, whether $25 or $50, impacts the well-being of lower income individuals more acutely than higher income individuals.
23. I evaluate SB 14’s burden on African-American and other Texans using data on income, wealth, and other social measures. I find that the burden created by SB 14 is higher for African-American voters than for white voters in Texas because African Americans in Texas have disproportionately low incomes and are disproportionately poor.
VI. Prevalence: The Racial Composition of Affected Registered Voters
24. I estimate the racial composition of Affected Registered Voters by combining information from three sources.
a. The Texas Election Administration Management (“TEAM”) database lists all registered voters in Texas and provides their addresses, but does not provide information on race.
b. DOJ has determined which registered voters lack a Required ID by matching individuals in the TEAM database to numerous other databases that list individuals who hold various Required IDs (the “ID databases”). Individuals in the TEAM
Case 2:13-cv-00193 Document 671-19 Filed in TXSD on 11/11/14 Page 11 of 207

9 | brattle.com
database who do not appear (do not “match”) in any of the ID databases are considered to not possess a Required ID and are the Affected Registered Voters.
c. DOJ has also determined which registered voters may be eligible for disability exemption by matching individuals in the TEAM database to Social Security Administration and Veterans Affairs databases. Individuals in the TEAM database who appear in any of the disability exemption databases are considered not to be Affected Registered Voters.
d. The U.S. Census provides information on the racial composition of various geographical areas; I base my analysis on “Census Block Groups.”15 I estimate the racial composition of Affected Registered Voters by assigning to each Affected Registered Voter a probability of being African American or non–African American based on the racial proportion in that Affected Registered Voter’s Census Block Group. Note that the use of Census Block Groups instead of Census Blocks biases downwards any racial differences that I find.
25. I explain each database and how I use it in my analysis below.
VI.A. THE TEAM DATABASE
26. The publicly available TEAM database contains the name, voter ID number, address (residential and mailing), and party affiliation of each registered voter in Texas. Appendices C & D provide further details on my data manipulations with the TEAM data.
27. The geographic distribution of registered voters in the TEAM database is shown in Figure 1. In subsequent steps of my analysis, I combine the geographic distribution of voters with information from the U.S. Census on the racial and economic characteristics of geographical areas to estimate the racial and geographic characteristics of the Affected Registered Voters.
15 Census Blocks are the smallest geographic unit used for Census data. Blocks are aggregated into
Census Block Groups, which in turn are aggregated into Census Tracts. The state of Texas is divided into 914,231 Census Blocks, 15,811 Census Block Groups and 5,265 Census Tracts. See
https://www.census.gov/geo/maps-data/data/tallies/tractblock.html.
Case 2:13-cv-00193 Document 671-19 Filed in TXSD on 11/11/14 Page 12 of 207
10 | brattle.com
Figure 1: Geographic Distribution of Registered Voters in Texas
VI.B. THE ID DATABASES AND IDENTIFYING AFFECTED REGISTERED VOTERS
28. I used the outputs of DOJ’s database matching analysis to identify the Texas registered voters who must obtain a Required ID. Appendices C & D contain further details on the integration of this data with the TEAM and U.S. Census data. 5.3% of registered voters in Texas would need to obtain a Required ID in order to vote.16 Figure 2 is identical to Figure 1 except that it shows the geographic distribution of Affected Registered Voters.
16 The ID Databases indicate that approximately 6% of registered voters in Texas lack a Required ID.
However, just over 100,000 of these individuals, or 1% of the registered voter population, are eligible for a disability exemption as identified in the DOJ-provided U.S. Social Security Administration and U.S. Department of Veterans Affairs databases. I conservatively restrict my analysis to just those
Continued on next page
Case 2:13-cv-00193 Document 671-19 Filed in TXSD on 11/11/14 Page 13 of 207

11 | brattle.com
Figure 2: Geographic Distribution of Affected Registered Voters in Texas
VI.C. RACIAL COMPOSITION OF AFFECTED REGISTERED VOTERS
29. Minorities are not evenly distributed throughout Texas. The odds that a given Affected Registered Voter is African American vary greatly depending on where that voter resides. The U.S. Census provides information on the racial composition of the populations living in various geographical areas. The racial composition of Census Block Groups (i.e., the
Continued from previous page
registered voters who, strictly speaking, must obtain a Required ID in order to vote and who wouldn’t be able to avoid the burden of obtaining a Required ID by virtue of applying instead for a disability exemption. Disability-eligible voters likely face additional burdens to vote imposed by SB 14 that I do not measure. Additionally, there are a variety of reasons for which some disability-eligible voters might choose to apply for an EIC; such voters would face the same burdens of obtaining an EIC discussed in this report.
Case 2:13-cv-00193 Document 671-19 Filed in TXSD on 11/11/14 Page 14 of 207
12 | brattle.com
fraction of the population in each Census Block Group that is African American) in Texas is shown in Figure 3.
Figure 3: Racial Composition (Fraction African American) of Census Block Groups in Texas
30. As seen in Figure 3, many African Americans in Texas live in urban areas. The counties with the highest proportion of African Americans are generally in or very near cities, especially Dallas, Waco, Houston, and Beaumont. Nearly half of the African-American population in Texas lives in Dallas or Harris County.17 There is also a significant presence of African Americans in Census Block Groups that contain prisons. Texas revokes the right
17 Houston is located in Harris County.
Case 2:13-cv-00193 Document 671-19 Filed in TXSD on 11/11/14 Page 15 of 207

13 | brattle.com
to vote for convicted felons, and I conservatively remove all Census Block Groups with federal and state prisons from my analysis.18
31. For the purpose of the current analysis, it is not necessary to identify the race of each voter with precision; it is sufficient to estimate the number of Affected Registered Voters that are African American or not African American. I do so in three steps:
a. First, I estimate the proportion of registered voters in each Census Block Group that is African American.19
b. Second, I assign each Affected Registered Voter to a Census Block Group based on addresses in the TEAM database using geocoding software.20
c. Third, I assign to each Affected Registered Voter a probability of being African American equal to the proportion of registered voters in each Census Block Group that is African American (as estimated in step (a)).
32. My method is “conservative” in the sense that, if there is a disparity in prevalence between the races, then I am likely to systematically underestimate it. Given that, as discussed below, my conservative method shows a significant racial disparity, I would expect a less aggregated analysis, or one bringing to bear additional information regarding racial composition, to show a larger racial disparity. Essentially, my method only detects a racial disparity based on where Affected Registered Voters live. If there is a racial disparity
18 See http://tdcj.state.tx.us/unit directory/ for a list of all state prisons in Texas.
See http://www.bop.gov/locations/list.jsp for a list of all federal prisons in Texas.
19 I calculate this proportion as the ratio of (i) the number of registered voters in the Census Block Group who are African American to (ii) all registered voters in the Census Block Group. I calculated (i) as the number of African Americans in the Census Block Group (taken from Census data) multiplied by the state-wide fraction of African Americans who are registered to vote. I calculated (ii) as the sum of the equivalent quantity as in (i) for each race. At a state-wide level, in 2012 the Census reports that 72% of white Texans are registered to vote, about 71% of African-American Texans are registered to vote, and about 39% of Hispanic Texans are registered to vote.
Source: U.S. Census Bureau, Voting and Registration in the Election of November 2012 – Detailed Tables, Table 4b, available at
https://www.census.gov/hhes/www/socdemo/voting/publications/p20/2012/tables.html .
20 See Appendix C for details on the geocoding algorithm.
Case 2:13-cv-00193 Document 671-19 Filed in TXSD on 11/11/14 Page 16 of 207
14 | brattle.com
beyond controlling for where Affected Registered Voters live, my method will not capture it. Intuitively, one can see this by imagining a case where all Affected Registered Voters were actually African American (so 0% were not African American), and considering what my method would estimate. So long as some Affected Registered Voters lived in Census Block Groups that were racially mixed, my method would estimate that at least some of those Affected Registered Voter were not African-American, which necessarily understates the assumed racial disparity. In other words, by averaging over a Census Block, I lose granularity of the analysis. In Appendix D, I repeat my estimate using more aggregated Census regions and verify that the more granular the analysis regarding racial composition, the greater the number of Affected Registered Voters that are African American. In sum, I would expect to find greater racial disparity using a more granular analysis.
33. Table 1 provides my calculations of the number and share of Affected Registered Voters by race. Using my conservative method, I find that 6.8% of African-American registered voters would need to obtain a Required ID in order to vote. This is larger than the overall population of Affected Registered Voters, where I find that 5.3% of all registered voters would need to obtain a Required ID.21 It is also larger than the white population of Affected Registered Voters, where I find that 4.5% of white registered voters in Texas would need to obtain a Required ID.
21 As noted above, see supra footnote 15, I have restricted my analysis to those registered voters who do
not have the option of applying for a disability exemption and therefore must obtain a Required ID in order to vote.
Case 2:13-cv-00193 Document 671-19 Filed in TXSD on 11/11/14 Page 17 of 207

15 | brattle.com
Table 1: Affected Registered Voters by Race
VII. The Economic Costs Imposed by SB 14
34. Every Required ID has a direct fee, except for Veteran IDs and the EIC, as shown in Table 2.22
22 For full voting requirements in Texas, see “Required Identification for Voting in Person,” available at
http://votetexas.gov/register-to-vote/need-id/ .
All TexansAll Registered Texan Voters
All Affected Registered
Texan Voters
Affected Share of
Registered Voters
[A] [B] [C] [D]
African American 2,835,493 1,721,682 117,563 6.8%White 11,311,834 7,686,747 344,038 4.5%Hispanic 9,389,496 3,385,463 219,554 6.5%
All 24,932,741 13,350,209 EIC required 706,366 5.3%EIC required, or
disability exempt800,471
6.0%
Notes and Sources:
[C]: Results of DOJ Matching data and Brattle racial coding algorithm.[D]: [C] / [B].
U.S. Census Bureau 2010 population counts; U.S. Census Bureau, Current Population Survey, November 2012; TEAM database.[B]: TEAM consists of a total of 13,564,410 voters; 13,510,908 of whom were not known to be deceased as of July 2014; 13,406,038 of these voters have addresses or zipcodes that are able to be mapped to Census Block Groups; 13,350,209 of these voters map to Census Block Groups without prisons.
Case 2:13-cv-00193 Document 671-19 Filed in TXSD on 11/11/14 Page 18 of 207
16 | brattle.com
Table 2: Fees to Issue Required IDs
ID TypeNew ID Renewal ID
[1] Texas Driver LicenseUnder 18 $16 $618 to 84 $25 $25Over 85 $9 $9Disabled Veterans $0Replacement $11
[2] Texas Election Identification Certificate $0
[3] Texas Personal Identification Card59 and Younger $16 $1660 and Older $6 $6Replacement $11
[4] Concealed Handgun License - Standard $140 $70
[5] Veteran ID card $0
[6] United States Citizenship CertificateNaturalization Certificate $680 $345Certificate for Citizenship $600 $345
[7] United States PassportBook $135 $110Card $55 $30
Notes and Sources:
[5]: Veteran Services, available at http://www.txdps.state.tx.us/DriverLicense/vetServices.htm.[6]: Application for Naturalization information, available at http://www.uscis.gov/n-400.Application for Certificate of Citizenship information, available at http://www.uscis.gov/n-600.
[7]: United States Passport Fees, available at http://travel.state.gov/content/dam/passports/FeeChart/Passport%20Fees%20Chart%202014_TSG.pdf.
Nominal Cost
All forms of identification, except for US citizenship certificate or certificate of naturalization, need to be current or expired no longer than 60 days at the time of voting. See http://www.txdps.state.tx.us/driverlicense/electionid.htm.
[1] & [3]: Texas Driver License and Identification Card Fees, available at http://www.txdps.state.tx.us/DriverLicense/fees.htm.[2]: Election Identification Certificate (EIC) information, available at http://www.txdps.state.tx.us/driverlicense/electionid.htm.[4]: Texas Concealed Handgun License (CHL) Fee Table, available at http://www.dps.texas.gov/RSD/CHL/documents/CHLFeeSchedule.pdf.
Application for Replacement Naturalization/Citizenship Document information, available at http://www.uscis.gov/n-565.
Case 2:13-cv-00193 Document 671-19 Filed in TXSD on 11/11/14 Page 19 of 207

17 | brattle.com
35. In addition to the issuance fee, all other Required IDs (except the Texas Personal Identification Card) have eligibility requirements, such as military service or learning to drive, that make them unreasonable alternatives for the purpose of enabling voting. I focus on the costs to obtain an EIC because it is the least costly remedy for most Affected Registered Voters.23
36. Although there is no direct fee associated with acquiring an EIC, a voter without a Required ID bears economic costs in acquiring one. For purposes of my analysis, I categorize these economic costs as direct or indirect, and as monetary or non-monetary.
a. Direct versus Indirect
i. Direct Economic Costs are costs associated with the narrow act of applying for and receiving an EIC, such as the time and expense it takes to go to the DPS and apply for an EIC.
ii. Indirect Economic Costs are costs that are incurred to support applying for and receiving an EIC, such as the cost of obtaining a birth certificate or securing childcare while obtaining the EIC.
b. Monetary versus Non-Monetary
i. Monetary Economic Costs include any cash expenditures related to acquiring an EIC or supporting documents.
ii. Non-Monetary Economic Costs include the non-cash economic costs associated with acquiring an EIC, such as waiting in line at the DPS or the time spent acquiring a birth certificate.
37. Note that both direct versus indirect economic costs and monetary versus non-monetary economic costs are independent characteristics, such that both direct and indirect economic costs can be either monetary or non-monetary. These may include the time and monetary costs of obtaining supporting documentation (such as a birth certificate), the costs in time and money of traveling to a DPS or other facility that issues EICs, lost wages,
23 Note that in addition to a fee, the Texas Personal Identification Card requires the same sort of
documentation as the EIC. See
http://www.txdps.state.tx.us/DriverLicense/applyforid.htm.
Case 2:13-cv-00193 Document 671-19 Filed in TXSD on 11/11/14 Page 20 of 207
18 | brattle.com
the cost of child care services,24 and the potential risk of job loss. The EIC is valid for 6 years, so some of the costs related to physical renewal of an EIC would be periodically repeated.
VII.A. A “FREE” EIC IS NOT COSTLESS TO OBTAIN
38. I understand that Texas has claimed that the EIC is “free” and that there is therefore no economic cost imposed by SB 14.25 This claim is incorrect. First, there are indirect monetary costs involved in obtaining an EIC, such as transportation costs, child care costs while traveling and waiting at the DPS, and the cost of obtaining supporting documents. Second, it is widely recognized—in the economics literature,26 in business practice, and in U.S. government- and state-sponsored studies27—that non-monetary costs, such as wait or travel times, are economic costs and are an important consideration in the overall cost of a decision.
24 The Texas Workforce Commission reported that median child-care costs for part-day services range
from $11 for school-age children in registered child-care homes to $26 for infants in licensed child-care centers. See Texas Workforce Commission (April 2011), “2010 Texas Child Care Market Rate Survey – Final Report,” at 15. Report available at:
http://www.twc.state.tx.us/svcs/childcare/child-care-market-rate-report.pdf.
25 Defendant’s Motion to Dismiss, ECF No. 52, at 2, 17-18.
26 For example, noted statistician and economist Harold Hotelling and antitrust economist Steven Salop give equal weight to both travel costs and the direct price of purchasing a good, noting the importance of distance from a firm in determining whether an individual will buy from the firm or its rival. See Harold Hotelling (1929) “Stability in Competition” The Economic Journal 39: 41-57 and Steven Salop (1979) “Monopolistic Competition with Outside Goods” The Bell Journal of Economics 10: 141-156.
27 Empirical studies of the value of time, particularly in travel decisions, play an explicit role in transportation planning, including highway build out, congestion management, the determination of tolls, and the setting of transit fares for buses and subway systems. See, for example, Texas A&M Transportation Institute (December 2012), “TTI’s 2012 Urban Mobility Report”; David Ellis (May 2008), “Technical Memorandum: Cost Per Hour and Value of Time Calculations for Passenger Vehicles and Commercial Trucks for Use in the Urban Mobility Study”; Maricopa Association of Governments (February 2012), “Toll Road Modeling Support: Final Report”; and, U.S. Department of Transportation (September 28, 2011), “Revised Departmental Guidance on Valuation of Travel Time in Economic Analysis.”
Case 2:13-cv-00193 Document 671-19 Filed in TXSD on 11/11/14 Page 21 of 207

19 | brattle.com
VII.B. THE COSTS OF DOCUMENTS REQUIRED TO OBTAIN AN EIC
39. Although I do not directly estimate the costs of acquiring the documents that are required to support an application for an EIC, if needed, they are nevertheless real costs. Individuals who have to obtain these documents would bear these costs in addition to the travel costs I estimate.
40. To qualify for an EIC, voters must provide:28
a. documentation of identity, and
b. documentation of U.S. Citizenship, and
c. a valid Texas voter registration card.
41. Documentation of Identity is divided into three categories: primary, secondary, and supporting. One primary, two secondary, or one secondary and two supporting identification documents must be provided for identity verification and EIC eligibility.29
28 Election Identification Certificate (EIC) information, available at:
http://www.dps.texas.gov/DriverLicense/electionID.htm.
Additionally, one must be a Texas resident and be 17 years and 10 months or older, and not possess another legitimate form of voting identification.
A summary of the documents required to support an application for an EIC are provided in Table 13 in Appendix E.
29 Primary identification is a Texas driver’s license expired more than 60 days but within two years of the expiration date. Secondary identification includes original or certified copies of a birth certificate issued by the appropriate State Bureau of Vital Statistics or equivalent agency, United States Department of State Certification of Birth, a court order with name and date of birth indicating an official change of name and/or gender, or U.S. citizenship or naturalization papers without an identifiable photo. Supporting identification includes twenty eight different categories of documents, including a voter registration card, Texas vehicle or boat title or registration, Social Security card, a driver’s license or photo ID issued by DC or another U.S. state or territory, or school records. Election Identification Certificate (EIC) – Documentation Requirements lists all acceptable forms of documentation, available at:
http://www.txdps.state.tx.us/DriverLicense/eicDocReqmnts.htm.
Case 2:13-cv-00193 Document 671-19 Filed in TXSD on 11/11/14 Page 22 of 207

20 | brattle.com
42. Documentation of U.S. citizenship can be satisfied by several forms of identification.30 Since some such commonly held IDs—U.S. passports or citizenship papers with photo—are sufficient to vote in their own right, it is generally the various forms of birth certificates that are relevant for obtaining an EIC.
43. For Texas-born residents, the monetary cost of obtaining a birth certificate is $22. I understand that an individual who obtains a birth certificate in person (as opposed to by mail) for purposes of obtaining an EIC can have this fee waived.31 However, photo ID requirements to obtain a birth certificate may lead to additional costs. Applicants must submit or show a valid photo ID,32 such as a current driver’s license or U.S. Passport in order to apply for a birth certificate. Alternatively, applicants must provide a number of secondary identification documents, which also require at least one photo ID.33
44. For residents born outside of Texas, the monetary cost of obtaining a birth certificate varies by state. Every U.S. state offers an option to obtain a birth certificate either online or by mail.34 Required documentation varies by state, but in general a valid photo ID is required in order to apply for a birth certificate.
30 These include: a U.S. passport book or card, birth certificate issued by a U.S state, territory, or District
of Columbia, Certificate of Report of Birth, Consular Report of Birth issued by the U.S. Department of State, U.S. Certificate of Citizenship or Certificate of Naturalization, or U.S. Department of Justice Immigration and Naturalization Service U.S. Citizen ID card.
31 See
http://www.dshs.state.tx.us/Layouts/ContentPage.aspx?PageID=56719&id=8589981487&terms=election+identification.
32 An application for birth certificate can be submitted online, by mail, or in person. This potentially eliminates the direct travel costs associated with obtaining a birth certificate. See
http://www.dshs.state.tx.us/vs/reqproc/certified copy.shtm.
33 For a list of acceptable primary or secondary identification requirements for a Texas birth certificate, see:
http://info.sos.state.tx.us/pls/pub/readtac$ext.TacPage?sl=R&app=9&p dir=&p rloc=&p tloc=&p ploc=&pg=1&p tac=&ti=25&pt=1&ch=181&rl=28.
34 All states except Wyoming and Vermont allow online application of vital records via the commercial vendor VitalChek, https://www.vitalchek.com/. Most also host their own online vital records service. Wyoming has a by-mail application service. See
Continued on next page
Case 2:13-cv-00193 Document 671-19 Filed in TXSD on 11/11/14 Page 23 of 207
21 | brattle.com
45. I have not found any analyses considering whether African Americans in Texas have lower possession rates of these supporting documents than white Texans. Indirect evidence, however, suggests that African Americans in Texas are less likely to possess such documentation. A 2006 survey by the Brennan Center found that one-quarter of voting-age African Americans lack a government issued photo ID, versus 8% of white citizens.35 Another study found that 26.7% of African-American 18 to 29 year-olds lacked a birth certificate, compared to only 15.7% of white youth.36 According to this same study, African-American “youth reported that the lack of required identification prevented them from voting at nearly four times the rate of white youth (17.3 percent compared with 4.7 percent).”37 Evidence provided at trial in the recent Wisconsin voter ID case of Frank v. Walker found that “[m]issing birth certificates are also a common problem for older African American voters who were born at home in the South because midwives did not issue birth certificates.”38 Furthermore, significant numbers of Katrina evacuees relocated to Texas39 and a much higher percentage of African-American evacuees did not return to their pre-Katrina counties,40 suggesting that a disproportionately high number of African-
Continued from previous page
http://www.health.wyo.gov/rfhd/vital records/birthcertificate.html. Vermont has an online and by-mail application service. See
https://secure.vermont.gov/VSARA/vitalrecords/.
35 See “Citizens without Proof: A Survey of Americans’ Possession of Documentary Proof of Citizenship and Photo Identification,” available at:
http://www.brennancenter.org/sites/default/files/legacy/d/download_file_39242.pdf.
36 Jon Rogowski and Cathy Cohen, “Black and Latino Youth Disproportionately Affected by Voter Identification Laws in the 2012 Election,” at 5. Report available at:
http://research.blackyouthproject.com/files/2013/03/voter-ID-laws-feb28.pdf.
37 Id. at 1.
38 Wisconsin Decision at *16 n.17; see also id. at *30 n.36.
39 Jeffrey A. Groen and Anne E. Polivka (March 2008), “Hurricane Katrina evacuees: who they are, where they are, and how they are faring,” BLS Monthly Labor Review, at 40. (Hereinafter, “Groen & Polivka”.)
40 Groen & Polivka, at 44.
Case 2:13-cv-00193 Document 671-19 Filed in TXSD on 11/11/14 Page 24 of 207

22 | brattle.com
American Katrina evacuees settled in Texas. Many of these evacuees lost their IDs in the storm.41
VII.C. TRAVEL COSTS TO OBTAIN AN EIC
46. Travel costs include monetary costs such as bus or taxi fares, as well as non-monetary costs such as travel time. To estimate travel costs, I assume that potential voters would seek to obtain an EIC from whichever DPS or other EIC issuing location that minimizes the overall travel cost of getting to that location.
47. If the only travel option to get to a DPS were walking, then most potential voters would travel to the DPS closest to their home.42 Figure 4 provides an illustrative example of this selection method for the Houston area. Each DPS is denoted by a black dot, and the collection of Census Block Groups whose residents would find that DPS to be the nearest are shown as like-colored dots surrounding the black dot.43 For example, the area of South Houston has a single DPS, and it is surrounded by magenta dots, which represent all of the Block Groups (and potential voters) who would choose to walk to that DPS rather than any other because it is the nearest EIC-granting location. Just east of South Houston is a collection of grey-colored dots identifying Block Groups that would choose to go to an alternate DPS location rather than the location in South Houston.
41 Bob Sullivan (September 13, 2005), “Katrina victims face identity crisis,” NBC News, available at:
http://www.nbcnews.com/id/9316512/ns/technology and science-security/t/katrina-victims-face-identity-crisis/#.U58Jq ldWVM. Last accessed June 16, 2014.
42 It is possible that some people would travel to a DPS from work or while commuting to or from work. I do not have any information on the work addresses (or times at work) for registered Texas voters, so I model travel from home.
43 In this particular chart, distance is measured by the Euclidean distance metric, often referred to “as the crow flies.” It is an approximation of the walking distance, although actual street patterns would distort the distances somewhat.
Case 2:13-cv-00193 Document 671-19 Filed in TXSD on 11/11/14 Page 25 of 207

23 | brattle.com
Figure 4: Block Groups with Shortest Distance to Each DPS Location (Houston)
48. Figure 4 does not account for differences in travel time or costs associated with different travel modes (walking, bus, taxi, or being driven by a friend or family member). For example, some Block Groups may sit on transit lines that significantly shrink the travel time to a particular DPS location, suggesting that the preferred DPS location may not be the nearest one.
49. In this section, I explain how I account for these factors by calculating the total cost of travel, including the economic costs of travel time, for each of three possible modes of travel—walking, transit, or taxi—and selecting the lowest cost method.44
44 Obviously, driving oneself is not an option—otherwise the individual would already have a valid
photo ID in the form of a driver’s license. The cost of a taxi also stands in for the “cost” of getting a ride from a friend or relative.
Case 2:13-cv-00193 Document 671-19 Filed in TXSD on 11/11/14 Page 26 of 207
24 | brattle.com
VII.C.1. Value of Time
50. The amount of money an individual would be willing to pay to avoid travel time is known as the “Value of Time” in the economics and transportation literature.45 Everyone has a limited budget of time to allocate towards work and leisure activities, and time spent going to the DPS reduces the time available for other productive or pleasurable pursuits. Transportation departments at the state and federal levels have long recognized this fact, and the value of commuters’ time plays a key role in their decisions regarding road construction and maintenance, as well as congestion management.
51. The Texas Transportation Institute issued a report in December 2012 that valued the cost of delays while traveling at $16.79 per hour for personal (as opposed to commercial) drivers.46 Other transportation agencies derive similar values for the value of travel time savings. Many identify a value of time that is approximately equal to 50 percent of average wages.47 This valuation is also recommended by the U.S. Department of Transportation (“USDOT”) for local personal travel, which notes explicitly that with 2009 nationwide median annual household income of $49,777, the average value of travel time savings would be $12.00 per hour.48 The USDOT also notes that “Personal time spent walking or waiting outside vehicles, as well as time spent standing in vehicles or bicycling [presumably when not for pleasure], should be evaluated at 100 percent of hourly income.”49 This latter measure better captures the value of time expended to acquire an ID solely for the purpose of retaining the ability to vote.
45 See Small, Kenneth A. and Erik T. Verhoef, The Economics of Urban Transportation, New York:
Routledge, 2007, at 45-46.
46 See Texas A&M Transportation Institute (December 2012), “TTI’s 2012 Urban Mobility Report.” For a description of methodology, see David Ellis (May 2008), “Technical Memorandum: Cost Per Hour and Value of Time Calculations for Passenger Vehicles and Commercial Trucks for Use in the Urban Mobility Study.”
47 See Maricopa Association of Governments (February 2012), “Toll Road Modeling Support: Final Report” for a useful summary of many state and federal transportation agencies’ modeling efforts. Common methodologies include stated preference surveys, revealed preference analysis using observed mode choice data, and speed choice models.
48 See U.S. Department of Transportation (September 28, 2011), “Revised Departmental Guidance on Valuation of Travel Time in Economic Analysis.”
49 Id. at p. 13.
Case 2:13-cv-00193 Document 671-19 Filed in TXSD on 11/11/14 Page 27 of 207

25 | brattle.com
52. Accordingly, I value the cost of time spent travelling to an EIC granting location at 100 percent of the median (within Tract) wage rate. I do this separately for each race and census tract.50 The distribution of median (within Tract) wage rates in Texas is presented in Table 3. African-American Texans earn on average $13.69 per hour, compared to $23.08 for white Texans. There is also considerable variability across Census Tracts. The bottom 25% of Census Tracts have an African-American wage rate of less than $10.20, while the top 25% of Census Tracts have an African-American wage rate exceeding $16.44.
Table 3: Wage Rates by Race
VII.C.2. The Economic Costs of Travel to Obtain an EIC
53. The total cost of travel to a DPS location includes both monetary (e.g., transit and taxi fares) and non-monetary (value of time) costs. I determine each of these based on a geocoding algorithm that allows me to calculate expected travel times and distances for each of three travel modes: walking, taxi, and public transit. I assume that voters wishing
50 Although I model the expected amount of travel time to EIC locations separately by Block Group, I
rely on publically available Census data for income statistics, which only describe income at the Census Tract level.
StatisticAfrican
AmericanWhite Hispanic
[1] Overall Average $13.69 $23.08 $11.28[2] Average Across Tracts $13.12 $21.75 $11.75[3] Standard Deviation $5.25 $10.49 $4.70[4] Median $13.03 $20.57 $10.39[5] 25th Percentile $10.20 $16.39 $8.71[6] 75th Percentile $16.44 $26.84 $12.88
Source: Census Bureau American Community SurveyNotes:
[1]: Calculated as census tract wages weighted by total labor hours by race.
[2] - [3]: Unweighted statistics across census tracts.[4] - [6]: Statistics weighted by labor hours by race.
Case 2:13-cv-00193 Document 671-19 Filed in TXSD on 11/11/14 Page 28 of 207

26 | brattle.com
to obtain an EIC will select the DPS location and travel mode that minimize the total cost of travel. Appendix C includes specific details on the algorithm.
54. Table 4 provides an illustrative example of the registered voter’s decision process for two different voters living in the same location choosing a DPS location and travel mode to obtain an EIC. Each hypothetical voter is presented with three potential DPS locations to visit via any of the three travel mode options. For example, for Voter 1 to travel to DPS Location 1, she could take a taxi, with a total travel time of 10 minutes and an expected fare of $14.50.51 If she were to walk instead, she would bear no direct monetary costs, but the walk would take 150 minutes. Finally, if instead she were to use public transit, the total trip time in this illustrative example would be 42 minutes and she would pay a fare of $4.10. Voter 1’s wage rate is equal to the median wage rate for African-American Texans of $13.03/hour,52 from which I can calculate the value of time across each option. In this instance, Voter 1 would choose to take public transit to DPS Location 1, at a total one-way travel cost of $13.22, composed of $4.10 in fare charges and $9.12 in travel time costs.
55. Voter 2 in the illustrative example would make a different decision. Her wage rate is equal to the median wage rate for white Texans of $20.57. As a consequence, two options with the same travel times and fare expenses can lead Voter 2 to choose a different DPS location. In this example, the lowest travel cost for Voter 2 is to take a taxi to DPS location 2, which costs her $3.09 in travel time costs and $13.25 in fare charges, for a total trip cost of $16.34. If she had chosen the same options as Voter 1, she would bear $14.40 in travel time costs and $4.10 in transit charges, for a total travel cost of $18.50. Importantly, the main impact of Voter 2’s higher wage and subsequent value of time is to lead her to make a different travel choice than Voter 1 when faced with the same expected travel times and fare charges.
51 For this analysis, I assume that the total taxi fare is the sum of a $2.50 base fare and an additional $2.00
per mile for distance traveled. These numbers were determined by taking the average of the taxi rates reported by the cities of Houston and Fort Worth. See
http://www.houstontx.gov/ara/regaffairs/taxicabs rates.html and
http://fortworthtexas.gov/uploadedFiles/Municipal Court/About Us/Administration/Taxicab%20Rates%20and%20Approximate%20Fares.pdf, last visited June 22, 2014.
52 In the actual travel cost analysis, the wage rate for each Block Group is specific to the Census Tract within which the Block Group is located. See Table 3.
Case 2:13-cv-00193 Document 671-19 Filed in TXSD on 11/11/14 Page 29 of 207
27 | brattle.com
Table 4: Illustrative Example of Travel Mode Choice and Cost Calculation
56. I perform similar calculations for each Census Block Group in Texas. The lower wage rates for African-American Texans tend to make public transportation and walking more attractive relative to white Texans. In addition to the wage-rate differential, the greater urbanization of African-American Texans also implies greater access to public transportation for African-American Texans than white Texans. These two impacts combined to skew the mode choice distribution. As shown in Table 5, my analysis finds that African-American Texans tend toward more time-intensive public transport and walking while white Texans are more likely to choose a quicker but more expensive taxi. As described in the illustrative example, even two individuals from the same neighborhood might choose different modes of transportation to get to a DPS location because of different opportunity costs of time.
Voter 1 Voter 2African American Wage = $13.03 White Wage = $20.57
DPS Location DPS Location1 2 3 1 2 3
TaxiTravel Time (minutes) 10 9 12 10 9 12Value of Time ($) $2.17 $1.95 $2.61 $3.43 $3.09 $4.11Fare ($) $14.50 $13.25 $17.00 $14.50 $13.25 $17.00Total ($) $16.67 $15.20 $19.61 $17.93 $16.34 $21.11
WalkTravel Time (minutes) 150 135 180 150 135 180Value of Time ($) $32.58 $29.32 $39.09 $51.43 $46.28 $61.71Fare ($) $0.00 $0.00 $0.00 $0.00 $0.00 $0.00Total ($) $32.58 $29.32 $39.09 $51.43 $46.28 $61.71
Public TransitTravel Time (minutes) 42 51 44 42 51 44Value of Time ($) $9.12 $11.03 $9.64 $14.40 $17.42 $15.22Fare ($) $4.10 $4.54 $4.22 $4.10 $4.54 $4.22Total ($) $13.22 $15.57 $13.86 $18.50 $21.96 $19.44
Source: Illustrative example only.
Case 2:13-cv-00193 Document 671-19 Filed in TXSD on 11/11/14 Page 30 of 207

28 | brattle.com
Table 5: Frequency of Travel Mode Choice to DPS Locations by Race
57. Table 6 provides a summary of the expected travel costs associated with these travel mode choices across different segments of the Texas population. Across all Affected Registered Voters in Texas, the expected travel costs to obtain an EIC are $42.18. Among Affected Registered Voters, African Americans have an expected average travel cost to a DPS location of $27.46, composed of an expected average travel time of 82 minutes and $12.65 in expected average fare charges. Among white Affected Registered Voters, the expected average travel cost to a DPS location is $48.68, composed of an expected average travel time of 38 minutes and $35.71 in expected average fare charges. These numbers reflect the different options available and constraints imposed across racial groups in Texas.
ModeAfrican
American White
All Registerd Voters
[A] [B] [C]
Driving [1] 44% 79% 62%Transit [2] 41% 14% 26%Walking [3] 15% 7% 12%
Notes and Sources:Results from The Brattle Group Google API Analysis.[1]: Frequency of driving mode by race.[2]: Frequency of transit mode by race.[3]: Frequency of walking mode by race.
Case 2:13-cv-00193 Document 671-19 Filed in TXSD on 11/11/14 Page 31 of 207

29 | brattle.com
Table 6: Summary of Travel Costs by Race
58. Given that the prevalence of African-American Texans needing to acquire an EIC to retain the right to vote is about twice as high as for white Texans, the expected travel costs for a random Affected Registered Voter, conditioned on race, are not so different and are probably higher for African-American Texans. Nevertheless, because these cost differences are largely driven by differences in earnings, they are not directly comparable for purposes of evaluating burden. See Section VIII.
VII.D. TOTAL COSTS TO OBTAIN AN EIC BY RACE
59. The total cost to acquire an EIC will depend on many factors, specific to each voter. Some voters will live near a DPS and have a copy of their birth certificate, while others will live far away, will need to acquire a birth certificate, and possibly will incur other costs as well. Such costs could include:
• Travel costs. I found that the average cost for an Affected Registered Voter to travel to a DPS was $42.18. This cost varies by the voter’s location. It also varies, on
Breakdown of Travel Costs
African- American Affected Voters
White Affected Voters
All Registerd Voters
[A] [B] [C]
Travel Time (minutes) [1] 82 38 48Value of Time ($) [2] $14.81 $12.97 $13.17Fare ($) [3] $12.65 $35.71 $29.01
Total Cost ($) [4] $27.46 $48.68 $42.18
Notes and Sources:Results from The Brattle Group Google API Analysis, TEAM Data, and DOJ matching data.
[A] - [C]: Average values across all block groups in Texas by race.
ACS Survey 2010.
taxi and transit rates based.
[1]: Calculated travel times to mimimum-cost DPS location.[2]: Calculated using wage rates by race by Census tract from the
[3]: Calculated using travel distance to minimum-cost DPS
[4]: Sum of [2] & [3].
Case 2:13-cv-00193 Document 671-19 Filed in TXSD on 11/11/14 Page 32 of 207
30 | brattle.com
average, by race, with African-American Affected Registered Voters experiencing $27.46 in travel costs and white Affected Registered Voters experiencing $48.68 in travel costs. Additional travel costs could be incurred for individuals who need to acquire other documentation to support their EIC application.
• Documentation costs. Applying for an EIC requires additional documentation. These documents usually require payment of fees. Additionally, the requirements to obtain such documents may lead to additional costs.
• Time spent at DPS applying for EIC. Some Affected Registered Voters are likely to experience long wait times at the DPS location, increasing the total time costs to acquire an EIC.53
• Time lost at work. Some Affected Registered Voters are likely to have inflexible work schedules and either suffer lost vacation time or forego lost wages for time spent acquiring an EIC. I found that the average African-American Affected Voter would spend 82 minutes in travel to and from a DPS location in order to obtain an EIC. DPS wait times could increase the total time spent acquiring an EIC to 2 hours or more. This would amount to at least $26 in lost wages for a typical working African American in Texas.
• Child care costs. Some Affected Registered Voters may need to secure child care services for at least a partial day in order to obtain an EIC. Such costs could range from $11 up to $26.
60. While these costs are not necessarily additive for all Affected Registered Voters, the total cost to obtaining an EIC for an Affected Registered Voter will likely include some combination of each of these costs and accumulate to potentially several multiples of the total travel costs calculated here. So, for example, an African-American Affected
53 These wait times could range from 15-45 minutes, to as much as several hours.
See
http://www.nbcdfw.com/investigations/DPS-Wait-Times-Shorter-at-New-Mega-Center-License-Offices-200942911.html. Last visited June 26, 2014.
See also
http://www.khou.com/news/local/DPS-wait-times-are-longer-than-ever-161146955.html. Last visited June 26, 2014.
Case 2:13-cv-00193 Document 671-19 Filed in TXSD on 11/11/14 Page 33 of 207
31 | brattle.com
Registered Voter that needs a birth certificate and child care could incur the following costs:
• travel costs -$27.46,
• one hour spent at DPS - $13.03,
• one hour spent acquiring birth certificate - $13.03,
• birth certificate fees - $22, 54 and
• partial day of child care services - $11.
This hypothetical voter would incur total costs of $86.52, approximately three times the travel costs alone.
VIII. Obtaining the Required IDs is More Burdensome for African Americans
61. As demonstrated in the previous sections, African Americans are more likely to need to acquire an ID to vote and acquiring an ID for the purpose of voting comes with a cost. As noted above, whatever its level, a cost is more burdensome the lower is the socioeconomic standing of an individual.
62. As I show below, African Americans in Texas tend to be poorer than whites in Texas, making the burden of acquiring an ID to vote higher for African-American voters than for white voters. Stated slightly differently, if all that is known about a potential Texas voter is that she is African-American, the data analyzed in this report show that the burden of acquiring an ID to vote is expected to be higher for her than if she were a white Texan.
VIII.A. AFRICAN AMERICANS IN TEXAS HAVE LOWER INCOMES THAN WHITE TEXANS
63. It is well established that African Americans generally have substantially lower income55 and wealth56 than white Americans. I have examined income and wealth distributions in
54 I assume that this voter would be mailing in his application for a copy of his birth certificate.
55 In a study titled on income and poverty, the U.S. Census reported that “Comparing the 2012 income of non-Hispanic White households to that of other households shows that […] the ratio of Black to non-Hispanic white income was .58.” See Carmen DeNavas-Walt, Bernadette D. Proctor, Jessica C. Smith
Continued on next page
Case 2:13-cv-00193 Document 671-19 Filed in TXSD on 11/11/14 Page 34 of 207

32 | brattle.com
Texas and find this generally to be true in this state as well, both state-wide and across households in Texas. As shown in Table 3 above, African Americans in Texas on average have significantly lower wages (59% lower) than white Texans.
64. As shown in Table 7, in 2010, white Texas residents had an annual median income of $52,392, approximately 68% greater than the median income of $31,104 for African-American residents of Texas and approximately 36% greater than the median income of other minority residents. Additionally, approximately 69% of Texas’s African-American population had an income less than the median income of white residents, while approximately 66% of Texas’s other minority population had an income less than the median income of white residents. If the income distribution were random across racial groups, only 50% of residents would be expected to have an income less than the white group’s median income.
Continued from previous page
(September 2013) “Income, Poverty, and Health Insurance Coverage in the United States: 2012” (p. 8), available at:
https://www.census.gov/prod/2013pubs/p60-245.pdf .
56 The U.S. census reports that 2010 median wealth for white (non-Hispanic) households was $110,729. For African-American households the median net worth was $4,955, or about 22 times less than the net worth of white households. See U.S. Census “Net Worth and Asset Ownership of Households: 2010,” available at:
http://www.census.gov/people/wealth/files/Wealth Tables 2010.xls.
Case 2:13-cv-00193 Document 671-19 Filed in TXSD on 11/11/14 Page 35 of 207
33 | brattle.com
Table 7: Texas Household Income by Race
VIII.B. AFRICAN AMERICANS IN TEXAS HAVE LESS WEALTH THAN WHITE TEXANS
65. The distribution of wealth across racial groups in Texas is more uneven than income. Table 8 presents the breakdown of wealth by racial group. The wealth measurement is the sum of equity in homes, vehicles, businesses, interest-earning assets at banks and other institutions, stocks and mutual fund shares, non-home real estate, other assets, 401K, IRA, Keogh and thrift savings accounts.57 The median household wealth of the white population in Texas is $97,800, more than 7 times larger than the median household wealth of $11,961 for the African-American population, and almost twice as large as the median household wealth of other minority populations.
57 See Peter McHenry, “Does Low Wealth Constrain Long-Distance Migration?”, College of William and
Mary, August 2013, p. 14, available at:
http://wmpeople.wm.edu/asset/index/pmchenry/paperwealthandmigration.
State of Texas 2010African
AmericanWhite Other
[A] [B] [C]
Median Household Income [1] 31,104$ 52,392$ 38,412$ % Difference with White [2] 68.4% 36.4%
Total Number of Households [3] 263 1,087 855Households below White Median [4] 181 560Households below White Median (%) [5] 68.8% 65.5%
Notes and Sources:[1], [3] & [4]: Data from the Survey of Income and Program Participation, 2008 Panel, Wave 7.[A][2]: [B][1] / [A][1] - 1.[C][2]: [B][1] / [C][1] - 1.[A][5]: [A][4] / [A][3].[C][5]: [C][4] / [C][3].
Case 2:13-cv-00193 Document 671-19 Filed in TXSD on 11/11/14 Page 36 of 207

34 | brattle.com
Table 8: Texas Household Wealth by Race
66. The disparity in wealth appears to be at all income levels. Nationally, white Americans increase their wealth more quickly than African Americans do as their income rises. One study found that over a 25 year period, every dollar increase in income raised white family wealth by $5.19, whereas over the same period a dollar increase in income raised African-American family wealth by $0.69.58
VIII.C. AFRICAN AMERICANS IN TEXAS ARE MORE LIKELY TO BE POOR THAN WHITE TEXANS
67. As shown in Table 9, one-quarter of all African Americans in Texas live below the poverty line. This is a rate that is two-and-a-half times as high as the poverty rate for white Texans, but similar to other minority Texans.
58 Thomas Shapiro, Tatjana Meschede and Sam Osoro, “The Roots of the Widening Racial Wealth Gap:
Explaining the Black-White Economic Divide” (February 2013), Figure 3, available at:
http://iasp.brandeis.edu/pdfs/Author/shapiro-thomas-m/racialwealthgapbrief.pdf.
State of Texas 2010African
AmericanWhite Other
[A] [B] [C]
Median Household Wealth [1] 11,961$ 97,800$ 34,490$ % Difference with White [2] 717.7% 183.6%
Total Number of Households [3] 263 1,087 855Households below White Median [4] 217 634Households below White Median (%) [5] 82.5% 74.2%
Notes and Sources:[1], [3] & [4]: Data from the Survey of Income and Program Participation, 2008 Panel, Wave 7.[A][2]: [B][1] / [A][1] - 1.[C][2]: [B][1] / [C][1] - 1.[A][5]: [A][4] / [A][3].[C][5]: [C][4] / [C][3].
Case 2:13-cv-00193 Document 671-19 Filed in TXSD on 11/11/14 Page 37 of 207

35 | brattle.com
Table 9: Texas Poverty Status by Race
VIII.D. AFRICAN AMERICANS IN TEXAS SCORE LOWER ON OTHER MEASURES OF SOCIOECONOMIC STATUS THAN WHITE TEXANS
68. The disparity seen in wage rates is consistent with disparities in unemployment rates. As shown in Table 10, African-American unemployment in Texas is more than twice the rate of white unemployment in Texas.
Table 10: Texas Employment Status by Race
69. This disparity in income and wealth is also consistent with disparities observed in other measures of social and economic well-being. For example, income and wealth is known to
% Difference Between
White and African
American
At or Above the Poverty Line 2,046,954 77% 10,061,576 91% 7,627,095 76% 15%Below the Poverty Line 627,862 23% 956,513 9% 2,387,679 24% -15%
Note: "African American" and "White" race categories do not include individuals that also identify as "Hispanic" or "Latino."
Source: U.S. Census Bureau, 2006-2010 American Community Survey.
WhiteAfrican American Other
Employed 1,186,242 88% 5,627,211 95% 4,312,163 92%Unemployed 158,430 12% 317,602 5% 361,199 8%
% Difference Between White and African American Unemployment -6%
Note: "African American" and "White" race categories do not include individuals that also identify as "Hispanic" or "Latino."
Source: U.S. Census Bureau, 2006-2010 American Community Survey.
WhiteAfrican American Other
Case 2:13-cv-00193 Document 671-19 Filed in TXSD on 11/11/14 Page 38 of 207

36 | brattle.com
be strongly correlated to education59 and, as seen in Table 11, the educational achievement gap between African-Americans and whites is significant.
Table 11: Texas Education Attainment by Race
VIII.E. SB 14 CREATES A HIGHER EXPECTED BURDEN FOR AFFECTED REGISTERED VOTERS WHO ARE AFRICAN AMERICAN THAN FOR THOSE WHO ARE WHITE
70. Of the Affected Registered Voters in Texas, those who are African American are expected to experience a higher burden of acquiring an EIC to vote than the Affected Registered Voters who are white. The higher expected burden comes from the non-trivial costs of acquiring an EIC and the greater impact any cost has on lower income voters, as African-American Texans are more likely to be. The cost of acquiring an EIC, whether $25, $50, or $100, will have a much bigger impact on individuals who, on average, earn $31,104 and have household wealth of $11,961 than on individuals who, on average, earn $52,392 and have household wealth of $97,800.
71. To put my findings in perspective, the travel costs for an African-American Affected Registered Voter of $27.46 represents approximately 26% of a day’s earnings, but the typical African-American Texan only has 115 days of earnings stored as wealth. In comparison, the travel costs for an white Affected Registered Voter of $48.68 represents
59 See, for example, Steven Strauss, “The Connection Between Education, Income Inequality, and
Unemployment,” available at:
http://www.huffingtonpost.com/steven-strauss/the-connection-between-ed b 1066401.html.
African American 260,738 16% 977,674 58%White 688,064 9% 4,011,559 51%Other 2,072,196 38% 2,257,395 41%
-7% -8%
Source: U.S. Census Bureau, 2006-2010 American Community Survey.
Less than High School Diploma
Less than Undergraduate Degree
% Difference Between White and African American Educational Attainment
Note: "African American" and "White" race categories do not include individuals that also identify as "Hispanic" or "Latino."
Case 2:13-cv-00193 Document 671-19 Filed in TXSD on 11/11/14 Page 39 of 207

37 | brattle.com
approximately 30% of a day’s earnings, but the typical white Texan has 594 days of earnings stored as wealth. For only the travel-cost portion of the burden created by SB 14, an African-American Affected Registered Voter is required to expend a share of their wealth that is more than four times higher than the share required for a white Texan.
72. When combined with the prevalence analysis above of who is more likely to need to acquire an EIC to retain their right to vote, the burden imposed on African Americans in Texas to acquire an EIC will tend to be much greater than the burden imposed on white Texans to acquire an EIC.
IX. Registered African-American Student Voters in Texas
73. I identified nine Historically Black Colleges and Universities (HBCUs) in Texas.60 As
expected, the Census Block Groups that these HBCUs reside in have high numbers of African-American residents—60% in the HBCU Census Block Groups versus 12% overall in Texas. Voter registration, however, was significantly higher on HBCU Census Block Groups than average voter registration rates per Census Block Groups in these areas. The nine Census Block Groups with HBCUs had an average of 86% voter registration compared with the 54% state-wide average. These same Block Groups also have a higher percentage of Affected Registered Voters, 17% versus 5% state-wide. Student IDs—even those from public institutions—are not an allowable form of photo ID under SB 14. The data thus suggests that the student population at HBCUs is disproportionately affected by SB 14 as compared to the registered voter population state-wide.
Respectfully submitted, Date: August 15, 2014 Coleman Bazelon, Ph.D.
60 The nine HBCUs are Huston-Tillotson University; Paul Quinn College; Southwestern Christian
College; Texas College; Wiley College; Jarvis Christian College; Prairie View A&M University; St. Philips College; and Texas Southern University.
Case 2:13-cv-00193 Document 671-19 Filed in TXSD on 11/11/14 Page 40 of 207

38 | brattle.com
Appendix A – Curriculum Vitae of Coleman Bazelon
Case 2:13-cv-00193 Document 671-19 Filed in TXSD on 11/11/14 Page 41 of 207

Coleman Bazelon Principal
Washington, D.C. +1.202.955.5050 [email protected]
1
Dr. Coleman Bazelon is a principal in the Washington, DC office of The Brattle Group. He is an expert in regulation and strategy in the wireless, wireline, and video sectors. He has consulted and testified on behalf of clients in numerous telecommunications matters, ranging from wireless license auctions, spectrum management, and competition policy, to patent infringement, business valuation, and broadband deployment.
Dr. Bazelon frequently advises regulatory and legislative bodies, including the U.S. Federal Communications Commission and the U.S. Congress. He also has expertise in the federal government’s use of discount rates for policy and regulatory analysis, intellectual property valuation, economic impact analysis, and antitrust and damages analysis.
Throughout his career, Dr. Bazelon has had extensive experience with spectrum license auctions. He advises on and evaluates numerous auction designs and regularly serves as an auction advisor for bidders in spectrum license auctions.
Prior to joining Brattle, Dr. Bazelon was a vice president with Analysis Group, an economic and strategy consulting firm. During that time, he expanded the firm’s telecommunications practice area. He also served as a principal analyst in the Microeconomic and Financial Studies Division of the Congressional Budget Office where he researched reforms of radio spectrum management; estimated the budgetary and private sector impacts of spectrum-related legislative proposals; and advised on auction design and privatization issues for all research at the CBO.
SELECTED CONSULTING PROJECTS Litigation
• Evaluated damages in the applications market. • Assessed allocation theories in an international bankruptcy. • Evaluated damages from a programming contract termination. • Evaluated damages from allegations of reputational harm. • Evaluated damages from non-working wireless network equipment. • Assessed Domestic Industry requirement in ITC 337 case involving wireless equipment
patents. • Assessed commercial viability of full text searching of books business model. • Assessed Domestic Industry requirement in ITC 337 case involving portable storage
device patents. • Estimated value of satellite assets in bankruptcy. • Estimated damages from denial of pole attachments.
Case 2:13-cv-00193 Document 671-19 Filed in TXSD on 11/11/14 Page 42 of 207

Coleman Bazelon
2
• Provided written testimony evaluating the performance of a numbering resource administrator.
• Provided written testimony on the ability to estimate damages for a class of satellite phone users.
• Provided written testimony on the economic value of Rights-of-Ways in Massachusetts. • Estimated damages for a broadcast tower permit revocation. • Provided oral testimony on the proprietary nature of specific information contained in a
statewide public safety network bid. • Provided written testimony on economic value associated with items provided in a labor
neutrality agreement. • Estimated damages associated with USF and other telephone taxes paid by a calling card
reseller. • Assessed the damages associated with the infringement of patents related to VoIP
technology and the likely impact of a permanent injunction. • Estimated recoverable data costs for two pesticides. • Estimated cost of delay in granting local cable franchise. • Analyzed the economic underpinnings of an exclusivity clause of a mobile phone
affiliation agreement. • Assessed commonality issues of physicians for class certification of RICO action against a
set of health insurance companies. • Estimated “Loss of Use” damages for a severed fibre optic cable. • Provided written testimony estimating the value of a surety bond in a contract dispute
involving toll free phone numbers used in an enhanced service application. • Assessed damages associated with infringement of patents used to provide Voice over
Internet Protocol (VoIP). • Assessed basis for guidance of a large telecommunications firm in a 10-b securities
litigation. • Valued digital television radio spectrum in St. Louis in the pre-litigation phase of a breach
of contract dispute. • Estimated damages in a breach of contract case involving the sale of a fibre optic network. • Researched the basis for generally optimistic forecasts of broadband deployment in the
later 1990s and early 2000s in an anti-trust litigation. • Researched the basis for generally optimistic beliefs about the telecommunications sector
.in the late 1990s in a 10-b securities litigation. • Assessed the market for Competitive Local Exchange Carriers in an SEC fraud case. • Assessed a bankruptcy sale proposal for a national tier 1 broadband backbone provider. • Examined the business case asserted for a small wireless reseller in a breach of contract
litigation. • Assessed damages associated with infringement of patents used in DNA fingerprinting
applications. • Assessed changes in contributions to the Cable Royalty Fund on behalf of Sports
Claimants in a Copyright Arbitration Royalty Panel (CARP) proceeding.
Case 2:13-cv-00193 Document 671-19 Filed in TXSD on 11/11/14 Page 43 of 207

Coleman Bazelon
3
• Assessed the capital adequacy of the U.S. branch of a foreign bank.
Regulatory Proceedings • Provided testimony in prison phone rate proceeding. • Estimated economic impact of LNP on RLECs. • Assessed relevance of U.S. UNE-L experience for New Zealand benchmarking
proceeding. • Authored analysis of harm from revoking LightSquared’s ATC authorization. • Estimated value of pairing Upper 700 MHz A Block with public safety. • Estimated impact of increased regulatory uncertainty on spectrum value. • Estimated value of government provision of GPS service to private industry. • Coauthored analysis of feasibility of reallocating broadcast television through the use of
incentive auctions. • Analyzed impact on spectrum value of pairing AWS III spectrum. • Coauthored analysis of the merits of licensed versus unlicensed allocation of the TV
White Spaces. • Estimated the value of TV White Spaces. • Provided written testimony on the economic harm of using proprietary information in
retention marketing. • Provided written testimony on the economics of pole attachment rates. • Estimated the value of the PCS H-Block spectrum band. • Estimated the economic impact of ITC Exclusion Order on cell phone handsets. • Authored several reports on the 700 MHz auction rules. • Analyzed the relationship between the size of cable systems and the economics of the
programming market. • Presented analysis on pricing differentials in overlapping cable markets. • Assessed proposed regulation of mobile phone roaming rates. • Analyzed impact of local franchise requirements on competition in the video
marketplace. • Developed and assessed Indian spectrum management proposals. • Analyzed economic ramifications of à la carte cable channel pricing on consumers and
the cable and television programming industries. • Examined the relative merits of licensed versus unlicensed radio spectrum and the effects
of “underlay” licenses on existing commercial licensees. • Examined federalism issues related to mobile telephony regulation. • Examined and refuted arguments suggesting that the California Telecommunications
Consumer Bill of Rights was an appropriate response to market failures. • Assessed the impact on consumers of California’s Telecommunications Consumer Bill of
Rights proposal. • Provided written testimony refuting analysis purporting to show a positive relationship
between UNE-P and telecom network investment.
Case 2:13-cv-00193 Document 671-19 Filed in TXSD on 11/11/14 Page 44 of 207

Coleman Bazelon
4
• Provided written testimony examining the effects of unbundling regulations on capital spending in the telecommunications sector.
• Estimated the adjustment to the TELRIC pricing formula to account for irreversible investment in the local telephone network.
• Examined the impact of irreversible investments in the local telephone network on the TELRIC pricing methodology.
• Assessed the degree of market overlap of two food service firms for purposes of merger review.
• Provided written testimony that assessed the validity of an analysis of the costs of a DTV tuner mandate.
• Provided written testimony of a forecast of toll free number demand for the toll free number administrator, SMS/800, in a rate case proceeding.
Other • Advised bidder in Canadian 700 MHz auction. • Evaluated performance of TV stations when repacked in an Incentive Auction. • Analyzed differences in U.S. and European wireless markets. • Assessed business case and value of HF license holder. • Analyzed likely auction outcomes for TV broadcaster participating in incentive auction. • Assessed value of commercial mobile spectrum bands. • Analyzed economic impacts of the commercial casino industry. • Evaluated impact of digitization on copyright industries. • Analyzed economic and employment effects of Dutch gas hub. • Advised bidder in Indian 3G spectrum license auction. • Estimated economic and employment effects of network neutrality regulation. • Analyzed relative costs of wireless and wireline deployments in rural areas. • Analyzed potential harms from Internet gambling. • Estimated economic value of reallocating TV spectrum for wireless broadband. • Estimated economic and employment effects of electric power transmission construction
in support of new wind generation facilities. • Estimated economic and employment effects of broadband stimulus grant applications. • Estimated employment effects of an ATC-mobile satellite network deployment. • Analyzed the impact of reducing international mobile phone roaming charges. • Developed an auction platform for an electricity procurement auction. • Analyzed the economic impacts of reduced mobile phone taxes in Africa and the Middle
East. • Evaluated the impact of reducing ethanol requirements on gasoline prices. • Analyzed FRAND licensing requirements for intellectual property in the DTV standard. • Advised bidder in Canadian AWS spectrum license auction. • Advised bidder in FCC 700 MHz spectrum license auction. • Evaluated a business plan for proposed dam removals. • Assessed a business plan involving the WiMAX market.
Case 2:13-cv-00193 Document 671-19 Filed in TXSD on 11/11/14 Page 45 of 207
Coleman Bazelon
5
• Estimated the value of a portfolio of spectrum licenses. • Assessed the budgetary impacts of legislation to license TV white spaces. • Analyzed the economics of the military’s build versus buy decision for broadband satellite
communications capacity. • Advised bidder in FCC AWS spectrum license auction. • Provided framework to estimate impact of the effect of designation of TV white spaces as
unlicensed on 700 MHz auction receipts. • Analyzed Universal Service Fund expenditures. • Analyzed cable franchising requirements. • Valued proposals to re-band the Upper 700 MHz Band of radio spectrum. • Analyzed proposed accelerated digital television transition impacts on society and the
federal budget. • Coauthored a report on the value of a portfolio of patents used to provide Voice over
Internet Protocol (VoIP). • Coauthored a report to the U.S. Chamber of Commerce on the economic effects of
telecommunications deregulation. • Assessed the business cases for IRU swaps of a large international fibre optic network
owner. • Examined the effects of unbundling regulations on broadband penetration
internationally.
Case 2:13-cv-00193 Document 671-19 Filed in TXSD on 11/11/14 Page 46 of 207
Coleman Bazelon
6
TESTIMONY AND DECLARATIONS
“Rebuttal Expert Report of Coleman Bazelon, Ph.D.,” In the Matter of the Companies’ Creditors Arrangement Act, R.S.C. 1985, c. C-36, As Amended, and in the Matter of a Plan of Compromise or Arrangement of Nortel Networks Corporation, Nortel Networks Limited, Nortel Networks Global Corporation, Nortel Networks International Corporation and Nortel Networks Technology Corporation United States Bankruptcy Court for the District of Delaware, Case No. 09-10138 (KG), February 28, 2014.
“Supplemental Expert Report of Coleman Bazelon, Ph.D.,” In the Matter of Sky Angel U.S., LLC, against Discovery Communications, LLC, Animal Planet, LLC, United States District Court for the District of Maryland, Case No. 8:13-cv-00031-DKC, January 31, 2014.
“Expert Report of Coleman Bazelon, Ph.D.,” In the Matter of the Companies’ Creditors Arrangement Act, R.S.C. 1985, c. C-36, As Amended, and in the Matter of a Plan of Compromise or Arrangement of Nortel Networks Corporation, Nortel Networks Limited, Nortel Networks Global Corporation, Nortel Networks International Corporation and Nortel Networks Technology Corporation United States Bankruptcy Court for the District of Delaware, Case No. 09-10138 (KG), January 24, 2014.
“Expert Report of Coleman Bazelon, Ph.D.,” In the Matter of Sky Angel U.S., LLC, against Discovery Communications, LLC, Animal Planet, LLC, United States District Court for the District of Maryland, Case No. 8:13-cv-00031-DKC, December 6, 2013.
“Expert Report of Coleman Bazelon, Ph.D. and Armando Levy, Ph.D,” In the Matter of LT Game International Ltd., against Shuffle Master, Inc., United States District Court for the District of Nevada, Case No. 2:12-cv-01216-JAD-GWF, October 4, 2013.
“Expert Report of Coleman Bazelon, Ph.D.,” In the Matter of Certain Electronic Devices, Including Wireless Communications Devices, Tablet Computers, Media Players, and Televisions, and Components Thereof, United States International Trade Commission, Investigation No. 337-TA-862 (Judge Shaw), July 5, 2013.
“Declaration of Coleman Bazelon” In the Matter of PTA-FLA, Inc, Daredevil, Inc., NTCH-WEST TENN., Inc., NTCH-WA, Inc., and Eric Steinmann against ZTE Corporation, and ZTE USA, Inc. Florida Arbitration, Case No.: 50-494-T-00665-11, February 26, 2013.
“Rebuttal Testimony of Coleman Bazelon,” In re: Petition for Suspension or Modification of Application of the Requirements of 47 U.S.C. § 251(b) and (c), pursuant to 47 U.S.C. § 251(f)(2) regarding Time Warner Cable Information Services (Maine) LLC’s Request, State of Maine Public Utilities Commission, Docket No. 2012-198, Docket No. 2012-218, Docket No. 2012-219, Docket No. 2012-220, Docket No. 2012-221, October 12, 2012.
Case 2:13-cv-00193 Document 671-19 Filed in TXSD on 11/11/14 Page 47 of 207

Coleman Bazelon
7
“Testimony of Coleman Bazelon, Ph.D.,” In re: Petition for Suspension or Modification of Application of the Requirements of 47 U.S.C. § 251(b) and (c), pursuant to 47 U.S.C. § 251(f)(2) regarding Time Warner Cable Information Services (Maine) LLC’s Request, State of Maine Public Utilities Commission, Docket No. 2012-198, Docket No. 2012-218, Docket No. 2012-219, Docket No. 2012-220, Docket No. 2012-221, August 20, 2012.
“Expert Report of Dr. Coleman Bazelon,” Salsgiver Communications, Inc., Salsgiver Telecom, Inc., and Salsgiver Inc. v. Consolidated Communications Holdings, Inc., North Pittsburgh Systems, Inc., and North Pittsburgh Telephone Company, Inc., Court of Common Pleas, Allegheny County, Pennsylvania, Civil Division, No. GD 08-7616, May 10, 2012.
“Oral Testimony of Coleman Bazelon, The Brattle Group, Inc. before the U.S. House of Representatives, Committee on Energy and Commerce Subcommittee on Communication and Technology,” April 12, 2011. (spectrum)
“Testimony of Coleman Bazelon, Principal, The Brattle Group, before the U.S. House of Representatives, Committee on Energy and Commerce, Subcommittee on Communications, Technology, and the Internet,” June 17, 2010 (spectrum valuation).
“Supplemental Expert Report of Coleman Bazelon,” Gemalto PTE LTD and Gemplus S.A. v. Telecommunications Industry Association, United States District Court for the Eastern District of Virginia, Alexandria Division, Case 1:08-cv-00776-LMB-TRJ, December 16, 2008.
“Expert Report of Coleman Bazelon,” Gemalto PTE LTD and Gemplus S.A. v. Telecommunications Industry Association, United States District Court for the Eastern District of Virginia, Alexandria Division, Case 1:08-cv-00776-LMB-TRJ, November 6, 2008.
“Prefiled Rebuttal Testimony of Coleman D. Bazelon,” In re: Complaint and Request for Emergency Relief Against Verizon Florida LLC for anticompetitive behavior in violation of Sections 364.01(4), 364.3381, and 364.10, F.S., and for failure to facilitate transfer of customers’ numbers to Bright House Networks Information Services (Florida) LLC, and its affiliate, Bright House Networks, LLC, Florida Public Service Commission, Docket No. 070691-TP, July 25, 2008.
“Prefiled Direct Testimony of Coleman D. Bazelon,” In re: Complaint and Request for Emergency Relief Against Verizon Florida LLC for anticompetitive behavior in violation of Sections 364.01(4), 364.3381, and 364.10, F.S., and for failure to facilitate transfer of customers’ numbers to Bright House Networks Information Services (Florida) LLC, and its affiliate, Bright House Networks, LLC, Florida Public Service Commission, Docket No. 070691-TP, May 30, 2008.
“Declaration of Coleman Bazelon in Support of Plaintiffs’ Motion for Class Certification,” Kenneth Stickrath, et al v. Globalstar, Inc., United States District Court for the Northern District of California, San Francisco Division, Case No. 07-CV-01941 TEH, April 25, 2008.
Case 2:13-cv-00193 Document 671-19 Filed in TXSD on 11/11/14 Page 48 of 207

Coleman Bazelon
8
“Testimony of Coleman Bazelon, Principal, The Brattle Group, before the U.S. House of Representatives, Committee on Energy and Commerce, Subcommittee on Telecommunications and the Internet,” April 15, 2008 (reviewing the 700 MHz auction).
“Concerning the Meaning of ‘Fair and Reasonable Compensation’ in Section 253(c) of the Telecommunications Act of 1996 and the Comparability of the Rights-of-Way Fees Paid by Level 3 in Massachusetts and Elsewhere,” The Massachusetts Turnpike Authority v. Level 3 Communications, LLC, et al., The United States District Court for the District of Massachusetts, Civ. Act. No. 06-11816, December 17, 2007.
“Concerning the Effects of the Fixed Rent Charged for Access to the Massachusetts Turnpike,” The Massachusetts Turnpike Authority v. Level 3 Communications, LLC, et al., The United States District Court for the District of Massachusetts, Civ. Act. No. 06-11816, November 12, 2007.
“Affidavit of Dr. Coleman Bazelon,” Gulfside Casino Partnership v. Mississippi Riverboat Council, et al., United States District Court for the Southern District of Mississippi, Southern Division, Cause No. 1:07-CV-110-LG-JMR, May 4, 2007.
“Rebuttal Report of Dr. Coleman Bazelon,” Level 3 Communications, LLC, v. City of St. Louis, Missouri, United States District Court for the Eastern District of Missouri, Eastern Division, Consolidated Case No. 4:04-CV-871 CAS, June 17, 2005.
“Affidavit of Dr. Coleman Bazelon,” Informed Communications Systems, Inc. v. Intelogistics Corp., d/b/a Prosodie Interactive, United States District Court, Southern District of Florida, Miami Division, Case No.: 04-61245 CIV Huck/Turnoff (October 12, 2004).
EXPERT DESIGNATIONS
• Touch America, Inc. v. Qwest Communications International, Inc.
o Designated as an expert in Arbitration (June 2003)
• Informed Communications Systems, Inc. v. Intelogistics Corp., d/b/a Prosodie Interactive, United States District Court, Southern District of Florida, Miami Division, Case No.: 04-61245 CIV Huck/Turnoff
o Filed affidavit (October 12, 2004)
• Level 3 Communications, LLC v. City of St. Louis, Missouri, United States District Court for the Eastern District of Missouri, Eastern Division, Consolidated Case No. 4:04-CV-871 CAS
o Filed Rebuttal Report (June 17, 2005)
o Deposition (July 14, 2005)
Case 2:13-cv-00193 Document 671-19 Filed in TXSD on 11/11/14 Page 49 of 207

Coleman Bazelon
9
• Cable Merger before the FTC
o Presented analysis to FTC staff (March 20, 2007)
• Gulfside Casino Partnership v. Mississippi Riverboat Council, et al., United States District Court for the Southern District of Mississippi, Southern Division, Cause No. 1:07-CV-110-LG-JMR
o Filed affidavit (May 4, 2007)
• Motorola, Inc. v. State of Mississippi Department of Information Technology Services and M/ACom, Inc., Chancery Court of Hinds County, Mississippi, Cause No. G2006-2179 S/2
o Testified (May 23, 2007)
• American Towers, Inc. v. Jackson & Campbell, P.C., et al., DC Superior Court, No. 003277-06
o Deposition (March 19, 2009)
o Filed Affidavit (May 22, 2009)
• The Massachusetts Turnpike Authority v. Level 3 Communications, LLC, et al., The United States District Court for the District of Massachusetts, Civ. Act. No. 06-11816
o Filed Expert Report (November 12, 2007)
o Filed Rebuttal Report (December 17, 2007)
o Deposition (January 21, 2008)
• Kenneth Stickrath, et al v. Globalstar, Inc., United States District Court for the Northern District of California, San Francisco Division, Case No. 07-CV-01941 THE
o Filed Declaration (April 25, 2008)
o Deposition (June 11, 2008)
• In re: Complaint and request for emergency relief against Verizon Florida LLC for anticompetitive behavior in violation of Sections 364.01(4), 364.3381, and 364.10, F.S., and for failure to facilitate transfer of customers’ numbers to Bright House Networks Information Services (Florida) LLC, and its affiliate, Bright House Networks, LLC, Florida Public Service Commission, Docket No. 070691-TP
o Filed Direct Testimony (May 30, 2008)
o Filed Rebuttal Testimony (July 25, 2008)
o Deposition (August 13, 2008)
• Gemalto PTE LTD and Gemplus S.A. v. Telecommunications Industry Association, United States District Court for the Eastern District of Virginia, Alexandria Division, Case 1:08-cv-00776- LMB-TRJ
o Filed Expert Report (November 6, 2008)
Case 2:13-cv-00193 Document 671-19 Filed in TXSD on 11/11/14 Page 50 of 207
Coleman Bazelon
10
o Deposition (December 2, 2008)
o Filed Supplemental Expert Report (December 16, 2008)
• Salsgiver Communications, Inc., Salsgiver Telecom, Inc., and Salsgiver Inc. v. Consolidated Communications Holdings, Inc., North Pittsburgh Systems, Inc., and North Pittsburgh Telephone Company, Inc., Court of Common Pleas, Allegheny County, Pennsylvania, Civil Division, No. GD 08-7616
o Filed Damages Analysis (February 27, 2009)
o Deposition (April 3, 2012)
o Filed Expert Report (May 10, 2012)
• Certain Products Containing Interactive Program Guide and Parental Control Technology United States International Trade Commission, Investigation No. 337-TA-820
o Designated as an expert (June 8, 2012)
• In re: Petition for Suspension or Modification of Application of the Requirements of 47 U.S.C. § 251(b) and (c), pursuant to 47 U.S.C. § 251(f)(2) regarding Time Warner Cable Information Services (Maine) LLC’s Request, State of Maine Public Utilities Commission, Docket No. 2012-198, Docket No. 2012-218, Docket No. 2012-219, Docket No. 2012-220, Docket No. 2012-221
o Filed Direct Testimony (August 20, 2012)
o Filed Rebuttal Testimony (October 12, 2012)
o Testified (October 23, 2012)
• In the matter of PTA-FLA, Inc , Daredevil, Inc., NTCH-WEST TENN., Inc., NTCH-WA, Inc., and Eric Steinmann against ZTE Corporation, and ZTE USA, Inc. Florida Arbitration, Case No.: 50-494-T-00665-11
o Filed Expert Report (February 26, 2013)
o Deposed (March 15, 2013)
o Testified (August 30, 2013)
• Certain Electronic Devices, Including Wireless Communications Devices, Tablet Computers, Media Players, and Televisions, and Components Thereof, United States International Trade Commission, Investigation No. 337-TA-862 (Judge Shaw)
o Filed Rebuttal Testimony (July 5, 2013)
• In the matter of LT Game International Ltd., against Shuffle Master, Inc., United States
District Court for the District of Nevada, Case No. 2:12-cv-01216-JAD-GWF
o Filed Expert Report (October 4, 2013)
Case 2:13-cv-00193 Document 671-19 Filed in TXSD on 11/11/14 Page 51 of 207
Coleman Bazelon
11
o Deposed (November 12, 2013)
• In the Matter of Sky Angel U.S., LLC, against Discovery Communications, LLC, Animal
Planet, LLC, United States District Court for the District of Maryland, Case No. 8:13-cv-
00031-DKC
o Filed Expert Report (December 6, 2013)
o Filed Supplemental Report (January 31, 2014)
o Deposed (February 14, 2014)
• In the Matter of the Companies’ Creditors Arrangement Act, R.S.C. 1985, c. C-36, As
Amended, and in the Matter of a Plan of Compromise or Arrangement of Nortel
Networks Corporation, Nortel Networks Limited, Nortel Networks Global Corporation,
Nortel Networks International Corporation and Nortel Networks Technology
Corporation United States Bankruptcy Court for the District of Delaware, Case No. 09-
10138 (KG)
o Filed Expert Report (January 24, 2014)
o Filed Rebuttal Expert Report (February 28, 2014)
o Deposed (April 3, 2014; May 30, 2014)
o Testified (June 2, 2014; June 5, 2014)
• State of Texas v. Eric H. Holder, Jr., in his Official Capacity as Attorney General of the United States, United States District Court for the District of Columbia, Case No. 1:12-CV-00128
• Certain Wireless Devices, Including Mobile Phones And Tablets II, United States International Trade Commission, Investigation No. 337-TA-905 (Judge Pender)
PUBLICATIONS
Articles and Book Chapters
Coleman Bazelon and Giulia McHenry, “Spectrum Value,” Telecommunications Policy, Forthcoming.
John Jarosz, Robin Heider, Coleman Bazelon, Christine Bieri and Peter Hess, “Patent Auctions: How Far Have We Come?” les Nouvelles, March 2010, pp. 11-30.
Case 2:13-cv-00193 Document 671-19 Filed in TXSD on 11/11/14 Page 52 of 207

Coleman Bazelon
12
“Too Many Goals: Problems with the 700 MHz Auction,” Information Economics and Policy, June 2009, pp. 115-127.
“Licensed or Unlicensed: The Economic Considerations in Incremental Spectrum Allocations,” IEEE Communications Magazine, March 2009, pp. 110-116.
Michael H. Rothkopf and Coleman Bazelon, “Interlicense Competition: Spectrum Deregulation Without Confiscation or Giveaways,” OBTAINING THE BEST FROM REGULATION AND COMPETITION, Michael A. Crew and Menahem Spiegel, eds., Kluwer Academic Publishers (2005), pp. 135-159.
“Next Generation Frequency Coordinator,” Telecommunications Policy 27 (2003), pp. 517-525.
Coleman Bazelon and Kent Smetters, “Discounting in the Long Term,” Loyola of Los Angeles Law Review, Vol. 35, Issue 1, November 2002.
Coleman Bazelon and Kent Smetters, “Discounting Inside the Washington DC Beltway,” Journal of Economic Perspectives, Fall 1999.
“The Movement of Markets,” Wesleyan Economic Journal, Spring 1986.
“Is the Psychogenic Theory of History Scientific?” Journal of Psychohistory, Fall 1985.
White Papers, Reports, Studies, and Reviews
Kevin Hearle, Giulia McHenry, James Reitzes, Jeremy Verlinda and Coleman Bazelon, “Canadian Wireless Market Performance and the Potential Effect of an Additional Nationwide Carrier,” Prepared for the Canadian Competition Bureau, May 12, 2014.
Coleman Bazelon and Giulia McHenry, “Spectrum Sharing: Taxonomy and Economics,” Office of Science and Technology Policy, filed comment March 18, 2014.
Coleman Bazelon and Giulia McHenry, “Spectrum Sharing: Taxonomy and Economics,” sponsored by Verizon, February 6, 2014.
Coleman Bazelon and Giulia McHenry, “The Economics of Spectrum Sharing,” Telecommunications Policy Research Conference, 2013.
Coleman Bazelon and Giulia McHenry, “Violating Your Privacy: An Economic Perspective,” Telecommunications Policy Research Conference, September 24, 2013.
Coleman Bazelon and Giulia McHenry, “The Economics of Spectrum Sharing,” Global Media and Communications Quarterly, Autumn 2013, pp. 47-51.
Robert Shapiro, Douglas Holtz-Eakin and Coleman Bazelon, “The Economic Implications of Restricting Spectrum Purchases in the Incentive Auctions,” Georgetown University Center for Business & Public Policy, April 2013.
Case 2:13-cv-00193 Document 671-19 Filed in TXSD on 11/11/14 Page 53 of 207

Coleman Bazelon
13
Lisa Cameron and Coleman Bazelon, “The Impact of Digitization on Business Models in Copyright-Driven Industries: A Review of the Economic Issues,” National Research Council (NRC) Committee on the Impact of Copyright Policy on Innovation in the Digital Era, February 26, 2013.
Robert A. Rogowsky, Pallavi Seth, and Coleman D. Bazelon, "An Economic View of ITC 337 Cases and the Public Interest," Law360, November 21, 2012.
Coleman Bazelon and Giulia McHenry, “Spectrum Value,” Telecommunications Policy Research Conference, 2012.
Robert A. Rogowsky, Pallavi Seth, and Coleman D. Bazelon, "An Economic View Of The ITC's Domestic Industry," Law360, June 18, 2012.
Coleman Bazelon and Greg Duncan, “The Status of UNE-L in the United States,” Prepared for the Commerce Commission of New Zealand, April 12, 2012.
“Implications of Regulatory Inefficiency for Innovative Wireless Investments,” Sponsored by LightSquared, March 15, 2012.
Coleman Bazelon, Kevin Neels and Pallavi Seth, “Beyond the Casino Floor: Economic Impacts of the Commercial Casino Industry,” sponsored by the American Gaming Association, 2012.
Coleman Bazelon, Charles Jackson and Giulia McHenry, “An Engineering and Economic Analysis of the Prospects of Reallocating Radio Spectrum from the Broadcast Band through the Use of Voluntary Incentive Auctions,” Telecommunications Policy Research Conference, 2011.
“Cost of Regulatory Risk for Wireless Spectrum Values,” sponsored by LightSquared, August 23, 2011.
“Expected Receipts from Proposed Spectrum Auctions,” sponsored by the Wireless Broadband Coalition, July 28, 2011.
“GPS Interference: Implicit Subsidy to the GPS Industry and Cost to LightSquared of Accommodation,” sponsored by LightSquared, June 22, 2011.
Lisa Cameron and Coleman Bazelon, “The Impact of Digitization on Business Models in Copyright-Driven Industries: A Review of the Economic Issues,” National Research Council (NRC) Committee on the Impact of Copyright Policy on Innovation in the Digital Era, June 7, 2011.
“The Economic Basis of Spectrum Value: Pairing AWS-3 with the 1755 MHz Band is More Valuable than Pairing it with Frequencies from the 1690 MHz Band,” sponsored by T-Mobile and CTIA, April 11, 2011.
“Economists Letter to Obama Regarding Incentive Auctions,” April 6, 2011.
“The Indian 3G and BWA Auctions,” Telecommunications Policy Research Conference, 2010.
Case 2:13-cv-00193 Document 671-19 Filed in TXSD on 11/11/14 Page 54 of 207

Coleman Bazelon
14
“Economic Impact of the Dutch Gas Hub Strategy on the Netherlands,” by Dan Harris, Coleman D. Bazelon, Brad Humphreys, and Penelope Dickson, Netherlands Ministry of Economic Affairs, Agriculture and Innovation, September 2010.
“The Employment and Economic Impacts of Network Neutrality Regulation: An Empirical Analysis,” sponsored by Mobile Future, 2010.
“The Benefits of Wireless Broadband for Rural Deployments,” sponsored by Qualcomm, Inc, 2010.
Malcolm K. Sparrow, Coleman Bazelon and Charles Jackson, “Can Internet Gambling Be Effectively Regulated? Managing the Risks,” sponsored by Wired Safety, 2009.
“The Need for Additional Spectrum for Wireless Broadband: The Economic Benefits and Costs of Reallocations,” sponsored by Consumer Electronics Association, 2009.
Coleman Bazelon and William Zarakas, “Measuring Concentration in Radio Spectrum License Holdings,” Telecommunications Policy Research Conference, 2009.
“Licensed or Unlicensed: The Economic Considerations in Incremental Spectrum Allocations,” in New Frontiers in Dynamic Spectrum Access Networks, 2008, DySPAN 2008.
“Overreaching: The Policy Failures of the 700 MHz Auction,” Telecommunications Policy Research Conference, 2008.
“Cream Skimming,” Telecommunications Policy Research Conference, 2007.
Thomas W. Hazlett and Coleman Bazelon, “Market Allocation for Radio Spectrum,” prepared for the International Telecommunications Union Workshop on Market Mechanisms for Spectrum Management, Geneva, Switzerland, January, 2007.
“Licensed or Unlicensed: The Economics of Incremental Spectrum Allocations,” Telecommunications Policy Research Conference, 2006.
“Analysis of an Accelerated Digital Television Transition,” sponsored by Intel Corporation, 2005.
Thomas W. Hazlett and Coleman Bazelon, “Regulated Unbundling of Telecommunications Networks: A Stepping Stone to Facilities-Based Competition?” Telecommunications Policy Research Conference, 2005.
Thomas W. Hazlett, Coleman Bazelon, John Rutledge, and Deborah Allen Hewitt, Sending the Right Signals: Promoting Competition Through Telecommunications Reform: A Report to the U.S. Chamber of Commerce, September 22, 2004.
Thomas W. Hazlett, Arthur M. Havenner, and Coleman Bazelon, “Regulation and Investment in Local Telecommunications Networks,” Working Paper, January 2004.
Case 2:13-cv-00193 Document 671-19 Filed in TXSD on 11/11/14 Page 55 of 207

Coleman Bazelon
15
Michael H. Rothkopf and Coleman Bazelon, “Interlicense Competition: Spectrum Deregulation Without Confiscation or Giveaways,” New America Foundation, Spectrum Series Working Paper #8, August, 2003.
“Review of Discounting and Intergenerational Equity,” by Paul Portney and John Weyant, Resources for the Future (1999), in the Society of Government Economists Newsletter, Volume 34, No. 10, November 2002.
“Completing the Transition to Digital Television,” Congressional Budget Office, September 1999.*
“Two Approaches for Increasing Spectrum Fees,” Congressional Budget Office, November 1998 (Coauthored with David Moore*).
“Where Do We Go From Here? The FCC Auctions and the Future of Radio Spectrum Management,” Congressional Budget Office, April 1997 (Coauthored with Perry Beider and David Moore*).
* CBO publications do not cite authors’ names.
Federal Communications Commission Filings
“Declaration of Coleman Bazelon,” Comments of Martha Wright, et. al., Exhibit C, WC Docket No. 12-375, March 25, 2013 (prison payphone rates).
“Unlicensed Use of the TV White Spaces: Wasteful and Harmful,” FCC Filling, with Charles L. Jackson and Dorothy Robyn, Ex Parte Comments, ET Docket No. 04-186, ET Docket No. 02-380, August 20, 2008 (benefits of licensed over unlicensed allocation of the TV White Spaces).
“Comments of Charles L. Jackson, Dorothy Robyn and Coleman Bazelon,” Comments, WC Docket No. 06-150, PS Docket No. 06-229, June 20, 2008 (value of TV White Spaces).
“Comments of Coleman Bazelon,” Comments, WC Docket No. 06-150, PS Docket No. 06-229, WT Docket No. 96-86, June 20, 2008 (700 MHz D Block).
“Declaration of Coleman Bazelon,” Reply Comments, WC Docket No. 07-245, April 22, 2008 (economics of pole attachment rates).
“Why the Exclusive Use of Large Licenses in the Upper or Lower 700 MHz Bands Would Reduce the Efficiency of the 700 MHz Auction,” Comments, WT Docket No. 06-150, April 20, 2007.
“Principles for Choosing 700 MHz Block License Sizes,” Ex Parte Comments, WT Docket No. 06-150, March 6, 2007.
“The Economics of License Sizes in the FCC’s 700 MHz Band Auction,” Ex Parte Comments, WT Docket No. 06-150, January 2007.
Case 2:13-cv-00193 Document 671-19 Filed in TXSD on 11/11/14 Page 56 of 207
Coleman Bazelon
16
“Declaration of Thomas W. Hazlett, Ph.D., Prof. Arthur M. Havenner, and Coleman Bazelon, Ph.D.,” Comments, WC Docket No. 03-173, December 16, 2003. (Wireline investment, UNE-P)
“Declaration of Thomas W. Hazlett, Ph.D., Arthur M. Havenner, Ph.D., and Coleman Bazelon, Ph.D.,” Comments, WC Docket No. 03-157, September 2, 2003. (Wireline investment, UNE-P)
“Spectrum Deregulation Without Confiscation or Giveaways,” with Michael Rothkopf, Comment, ET Docket No. 02-135, January 9, 2003.
Thomas W. Hazlett, Coleman Bazelon and Arthur Havenner, “Forecast of Toll Free Number Demand: 2002-2004,” Attachment A, SMS/800 Transmittal No. 22, F.C.C. Tariff No. 1, November 15, 2002.
“Comments of Coleman D. Bazelon and T. Christopher Borek Relating to Arthur D. Little, Inc.’s Assessment of the Impact of DTV on the Cost of Consumer Television Receivers,” Ex Parte Comments MM Docket 00-39, August 1, 2002.
“Use Administrative Law Judges to Adjudicate Interference Disputes Between Licensees,” Comment, ET Docket No. 02-135, July 8, 2002.
SEMINARS AND PRESENTATIONS
Ferrum College Forum: “Internet Privacy, Civil Liberties, National Security, Law, and Economics: In Search of a Coherent Policy Path Forward,” March 19, 2014.
Bloomberg BNA Webinar: “Spectrum Auctions Are Back: What you need to know”, February 19, 2014.
Violating Your Privacy: An Economic Perspective, 41st Annual Telecommunications Policy Research Conference (TPRC), Arlington, VA, September 28, 2013.
Other Recent and Planned Spectrum Auctions: What They Portend for the Future: Economic Perspectives on the Auctions, Law Seminars International, Washington, D.C., July 22, 2013.
Spectrum Auction Policy: Potential Outcomes for Economic Growth and Public Safety, Georgetown University McDonough School of Business, Rayburn House Office Building, Washington, D.C., May 14, 2013.
Markets in Wireless Spectrum, Towards Dynamic Markets in Electric Power, Water, and Wireless Spectrum Seminar, University of Colorado Law School, Boulder, CO, April 23, 2013.
Annual College of Social Studies Spring Banquet/ the Underwood Memorial Lecture and Hoggendorn lecture for the Economic Department, Wesleyan University, Middletown, CT, April 17 – 18, 2013.
SNL Knowledge Center Webinar: “FCC Incentive Auction Rules: Estimating Clearing Prices and Policy Impacts", February 27, 2013.
Case 2:13-cv-00193 Document 671-19 Filed in TXSD on 11/11/14 Page 57 of 207

Coleman Bazelon
17
Reverse Auction Design: Dynamic or Sealed, Algorithmic Issues, Market Power, Reserves, Reference Prices, Conference on the FCC Incentive Auction, Stanford Institute for Economic Policy Research, Stanford, CA, February 26, 2013.
Mobile Impact on Economic Growth and Job Creation, Consumer Electronics Show, LIT Program Innovation Policy Summit, Las Vegas, NV, January 8, 2013.
Incentive Auctions: What Broadcasters Need to Know, Crossfire Media Webinar, December 19, 2012.
Spectrum Value, 40th Annual Telecommunications Policy Research Conference (TPRC), Arlington, VA, September 22, 2012.
FCBA Seminar: Getting from Here to There: The Road Ahead for Spectrum Auctions, Washington, DC, June 6, 2012.
Incentive Auctions, 39th Annual Telecommunications Policy Research Conference (TPRC), Arlington, VA, September 24, 2011.
Competition in the Wireless Environment: How to Get More Handsets or More Networks, Broadband Breakfast Club, Washington, DC, February 15, 2011.
Introducing TV White Spaces, Spectrum Bridge webinar, October 28, 2010.
The Indian 3G and BWA Auctions, 38th Annual Telecommunications Policy Research Conference (TPRC), Arlington, VA, October 2, 2010.
How Smart Public Policies Can Drive the Mobile Broadband Transformation, Information Technology and Innovation Foundation’s The Emerging Mobile Broadband Economy and its New Business Models, Washington, DC, September 14, 2010.
Community Broadband-A Blessing or Curse?, K&L Gates LLP Municipal Broadband Webcast, July 29, 2010.
Towards A Sustainable Spectrum Policy: Rethinking Federal Spectrum, Public Knowledge, Washington, DC, June 3, 2010.
Unraveling Net Neutrality: Should the FCC Regulate Broadband, Independence Institute, Denver, CO, May 26, 2010.
CQ-Roll Call Policy Breakfast on the Future of Wireless Broadband, Washington, DC, May 20, 2010.
Congressional Staff Briefings on “The Need for Additional Spectrum for Wireless Broadband: The Economic Benefit and Costs of Reallocations,” Washington, DC, December 8, 2009.
Case 2:13-cv-00193 Document 671-19 Filed in TXSD on 11/11/14 Page 58 of 207

Coleman Bazelon
18
The Progress and Freedom Foundation’s “Let’s Make a Deal: Broadcasters, Mobile Broadband, and a Market in Spectrum,” Washington, DC, December 1, 2009.
FCBA’s Intellectual Property Practice Committee Brown Bag Lunch, Washington, DC, November 30, 2009.
FCC Broadband Spectrum Workshop, Washington, DC, September 17, 2009.
Measuring Concentration in Radio Spectrum License Holdings, 37th Annual Telecommunications Policy Research Conference (TPRC), Arlington, VA, September 26, 2009.
Broadband Stimulus Plan, 2009 FLATOA-FCBA Conference, Tampa, FL, June 26, 2009.
Leveraging the Broadband Stimulus and Licensed Spectrum, Webinar, April 29, 2009.
Keynote Address, Enterprise Wireless08, Scottsdale, AZ, November 6, 2008.
Licensed or Unlicensed: The Economic Considerations in Incremental Spectrum Allocations, DySPAN, Chicago, IL, October 16, 2008.
Overreaching: The Policy Failures of the 700 MHz Auction, 36th Annual Telecommunications Policy Research Conference (TPRC), Arlington, VA, September 27, 2008.
Cream Skimming, 35th Annual Telecommunications Policy Research Conference (TPRC), Arlington, VA, September 29, 2007.
Auction Revenues are not the Only Revenues that Should Drive Spectrum Policy, Law Seminars International: Spectrum Management, Washington, DC, September 17, 2007.
Market Allocation for Radio Spectrum, International Telecommunications Union Workshop on Market Mechanisms for Spectrum Management, Geneva, Switzerland, January 2007.
Licensed vs. Unlicensed Spectrum: A New Economic Model for Determining the Trade-offs, 34th Annual Telecommunications Policy Research Conference (TPRC), Arlington, VA, September 30, 2006.
Decoding the Future of IP-TV, Northern California Chapter of the Federal Communications Bar Association, San Francisco, February 2006.
Accelerating the Digital Television Transition, COMPTEL Executive Business & Policy Summit, Washington, DC, December 2005.
Regulated Unbundling of Telecommunications Networks: A Stepping Stone to Facilities Based Competition? Telecommunications Policy Research Conference, Arlington, VA, September 2005.
Case 2:13-cv-00193 Document 671-19 Filed in TXSD on 11/11/14 Page 59 of 207

Coleman Bazelon
19
Sending the Right Signals: Promoting Competition Through Telecommunications Reform: A Report to the U.S. Chamber of Commerce, presentation of report to the US Chamber of Commerce, October 6, 2004.
Telecommunications Reform, presentation to the U.S. Chamber of Commerce’s Technology Policy Committee, April 29, 2004.
Interlicense Competition, Telecommunications Policy Research Conference, Arlington, VA, September 2003.
Marketing & Legal Strategies: Hope, Hype & Crash Landings, WCAI 2003, Washington, DC, July 10, 2003.
Spectrum Policy Task Force Interference Recommendations, Manhattan Institute Conference, Washington, DC, February 13, 2002.
FCC License Auctions, Society of Government Economists Conference, Washington, DC, November 22, 2002.
Spectrum Management Panel, CTIA Wireless 2002, Orlando, FL, March 18, 2002.
A Note on Correlation, ASSA Annual Meetings, Atlanta, GA, January 6, 2002.
Regulatory Forbearance, Powerline Communications Conference, Washington, DC, December 13, 2001. Spectrum License Valuations, CTIA Wireless Agenda 2001, Dallas, TX, May 2001.
Old Spectrum in the New Economy, with David Moore, invited paper, Society of Government Economists Conference “The New ‘Economy’: What Has Changed and Challenges for Economic Policy,” Washington, DC, November 2000.
Discounting Inside the Washington DC Beltway, Energy Information Agency Seminar Series, Washington, DC, March 2000.
Discounting Inside the Washington DC Beltway, Congressional Budget Office Seminar Series, Washington, DC, November 1999.
Completing the Transition to Digital Television, Telecommunications Policy Research Conference, Arlington, VA, September 1999.
Digital Television Transition, Congressional Budget Office Seminar Series, Washington, DC, April 1999.
The Budgetary Treatment of Asset Sales, briefing for the staff of the Senate Budget Committee, Washington, DC, February 1997.
Case 2:13-cv-00193 Document 671-19 Filed in TXSD on 11/11/14 Page 60 of 207

Coleman Bazelon
20
The Value Added from Multilateral Bargaining Theory for Applied Research, with Greg Adams, Selected Paper, AAEA Annual Meeting, Baltimore, MD, August 1992.
The Importance of Political Markets in Formulating Economic Policy Recommendations, Selected Paper, AAEA Annual Meeting, Manhattan, KS, August 1991.
L.D.C. Debt and Policy Linkages in the Determination of World Commodity Prices, with Gordon Rausser, Selected Paper, AAEA Annual Meeting, Vancouver, B.C., Canada, August 1990.
REVIEWER • American Journal of Agricultural Economics (1989 – 1994)
• Congressional Budget Office Reports
• Telecommunications Policy
• Telecommunications Policy Research Conference Program Committee (2011-2013)
• George Mason University
PROFESSIONAL AFFILIATIONS
• American Bar Association
• American Economic Association
• Federal Communications Bar Association
• National Research Council - Committee on a Survey of the Active Scientific Use of the
Radio Spectrum
Case 2:13-cv-00193 Document 671-19 Filed in TXSD on 11/11/14 Page 61 of 207
Coleman Bazelon
21
EDUCATION
Dr. Bazelon received his Ph.D. and M.S. in Agricultural and Resource Economics from the University of California at Berkeley. He also holds a Diploma in Economics from the London School of Economics and Political Science and a B.A. from Wesleyan University.
June 18, 2014
Case 2:13-cv-00193 Document 671-19 Filed in TXSD on 11/11/14 Page 62 of 207

39 | brattle.com
Appendix B – Materials Relied Upon
Books 1. Baldus, David C., and James W.L. Cole, Statistical Proof of Discrimination, Colorado
Springs: Shepard’s McGraw Hill, 1980.
2. Downs, Anthony, An Economic Theory of Democracy, New York: Harper & Brothers, 1957.
3. Fix, Michael, and Raymond J. Struyk, Clear and Convincing Evidence: Measurement of Discrimination in America, Washington D.C.: The Urban Institute Press, 1993.
4. Small, Kenneth A. and Erik T. Verhoef, The Economics of Urban Transportation, New York: Routledge, 2007.
Articles and Book Chapters 5. Brennan Center for Justice, “Citizens Without Proof: A Survey of Americans’
Possession of Documentary Proof of Citizenship and Photo Identification,” November 2006.
6. Cain, Glen, “The Economic Analysis of Labor Market Discrimination”; in O. Ashenfelter and R. Layards, The Handbook of Labor Economics, Vol. 1, 1986, pp. 693-785.
7. DeNavas-Walt, Carmen, et al., “Income, Poverty, and Health Insurance Coverage in the United States: 2012,” United States Census Bureau, September 2013.
8. Ellis, David, “Cost Per Hour and Value of Time Calculations for Passenger Vehicles and Commercial Trucks for Use in the Urban Mobility Study,” Technical Memorandum, Texas Transportation Institute, May 2008.
9. Groen, Jeffrey A., and Anne E. Polivka, “Hurricane Katrina evacuees: who they are, where they are, and how they are faring,” Monthly Labor Review, March 2008, pp. 40-44.
10. Hotelling, Harold, “Stability in Competition,” Economic Journal 39, 1929, pp. 41-57.
11. McHenry, Peter, “Does Low Wealth Constrain Long-Distance Migration?” College of William and Mary, August 2013, retrieved from <http://wmpeople.wm.edu/asset/index/pmchenry/paperwealthandmigration> (accessed 06/24/2014).
12. Munnell, Alicia H., et al., “Mortgage Lending in Boston: Interpreting HMDA Data,” American Economic Review, 86 (1), March 1996, pp. 25-53.
Case 2:13-cv-00193 Document 671-19 Filed in TXSD on 11/11/14 Page 63 of 207

40 | brattle.com
13. Rogowski, Jon and Cathy Cohen, “Black and Latino Youth Disproportionately Affected by Voter Identification Laws in the 2012 Election.”
14. Salop, Steven, “Monopolistic Competition with Outside Goods,” Bell Journal of Economics 10, 1979, pp. 141-156.
15. Schrank, David, et al., “TTI’s 2012 Urban Mobility Report,” Texas A&M Transportation Institute, December 2012.
16. Shapiro, Thomas, et al., “The Roots of the Widening Racial Wealth Gap: Explaining the Black-White Economic Divide,” February 2013.
17. “Toll Road Modeling Support: Final Report,” Maricopa Association of Governments, February 2012.
18. Yinger, John, “Access Denied, Access Constrained: Results and Implications of the 1989 Housing Discrimination Study”; in Fix and Struyk, Clear and Convincing Evidence: Measurement of Discrimination in America, Washington D.C.: The Urban Institute Press, 1993, pp. 69-112.
News Articles 19. Friedman, Scott, “DPS Wait Times Shorter at New Mega Center License Offices,”
NBC News, April 2, 2013, retrieved from <http://www.nbcdfw.com/investigations/DPS-Wait-Times-Shorter-at-New-Mega-Center-License-Offices-200942911.html> (accessed 06/26/2014).
20. Strauss, Steven, “The Connection Between Education, Income Inequality, and Unemployment,” Huffington Post, November 2, 2011, retrieved from <http://www.huffingtonpost.com/steven-strauss/the-connection-between-ed_b_1066401.html> (accessed 06/26/2014).
21. Sullivan, Bob, “Katrina Victims face identity crisis,” NBC News, September 13, 2005, retrieved from <http://www.nbcnews.com/id/9316512/ns/technology_and_science-security/t/katrina-victims-face-identity-crisis/#.U6oESfldUt5> (accessed 06/24/2014).
22. Woodard, Brad, “DPS Wait Times are Longer than Ever,” KHOU News, July 3, 2012, retrieved from <http://www.khou.com/news/local/DPS-wait-times-are-longer-than-ever-161146955.html> (accessed 06/26/2014).
Court Documents 23. Decision and Order by the United States District Court Eastern District of Wisconsin,
Case No. 11-CV-01128, filed April 29, 2014.
24. Defendant’s Motion to Dismiss, ECF No. 52.
Case 2:13-cv-00193 Document 671-19 Filed in TXSD on 11/11/14 Page 64 of 207

41 | brattle.com
25. Syllabus of the Supreme Court of the United States in Shelby County, Alabama v. Holder, Attorney General, et al., decided June 25, 2013.
26. Tex. Elec. Code Ann. § 63.0101 (valid through December 31, 2011).
27. Texas v. Holder, 888 F.Supp.2d 113 (2012).
Databases 28. “Net Worth and Asset Ownership of Households: 2010,” United States Census Bureau,
retrieved from <http://www.census.gov/people/wealth/files/Wealth_Tables_2010.xls> (accessed 06/24/2014).
29. Google Maps API Database [see Appendix C].
30. Census Bureau American Community Survey, 2010.
31. Department of Justice Matching Data
32. Survey of Income and Program Participation, 2008 Panel, Wave 7.
33. Texas Election Administration Management Database of Registered Voters.
34. “Voting and Registration in the Election of November 2012 – Detailed Tables,” United States Census Bureau, retrieved from <https://www.census.gov/hhes/www/socdemo/voting/publications/p20/2012/tables.html> (accessed 06/24/2014).
Other Sources 35. “SB 14 – Voter Identification Requirements – Key Vote,” Project Vote Smart,
retrieved from <http://votesmart.org/bill/12588/voter-identification-requirements#.U6Nunp3D8TQ> (accessed 06/24/2014).
36. “2010 Census Tallies of Census Tracts, Block Groups & Blocks,” retrieved from <https://www.census.gov/geo/maps-data/data/tallies/tractblock.html> (accessed 06/24/2014).
37. “2010 Texas Child Care Market Rate Survey – Final Report,” Texas Workforce Commission, April 2011, retrieved from <http://www.twc.state.tx.us/svcs/childcare/child-care-market-rate-report.pdf> (accessed 06/24/2014).
38. “Apply for an Identification (ID) Card,” Texas Department of Public Safety, retrieved from <http://www.txdps.state.tx.us/DriverLicense/applyforid.htm> (accessed 06/26/2014).
39. “Birth Certificate for Election Identification,” Texas Department of State Health Services, retrieved from
Case 2:13-cv-00193 Document 671-19 Filed in TXSD on 11/11/14 Page 65 of 207

42 | brattle.com
<http://www.dshs.state.tx.us/Layouts/ContentPage.aspx?PageID=56719&id=8589981487&terms=election+identification> (accessed 06/27/2014).
40. “Certified Copy of a Birth Certificate,” Texas Department of State Health Services, retrieved from <http://www.dshs.state.tx.us/vs/reqproc/certified_copy.shtm> (accessed 06/24/2014).
41. “County Locations Issuing Election Identification Certificates,” Texas Department of Public Safety Driver License Division, retrieved from <http://www.dps.texas.gov/DriverLicense/documents/EICCountyrun.pdf> (accessed 06/24/2014).
42. “DPS Mobile Stations Issuing Election Identification Certificates,” Texas Department of Public Safety Driver License Division, retrieved from <http://www.dps.texas.gov/DriverLicense/documents/EICDPSrun.pdf> (accessed 06/24/2014).
43. “Driver License Division Fees,” Texas Department of Public Safety, retrieved from <http://www.txdps.state.tx.us/DriverLicense/fees.htm> (accessed 06/25/2014).
44. “Election Identification Certificate (EIC),” Texas Department of Public Safety, retrieved from <http://www.dps.texas.gov/DriverLicense/electionID.htm> (accessed 06/24/2014).
45. “Election Identification Certificates (EIC) – Documentation Requirements,” Texas Department of Public Safety, retrieved from <http://www.txdps.state.tx.us/driverlicense/eicdocreqmnts.htm> (accessed 06/24/2014).
46. “How to Obtain a Birth Certificate,” Wyoming Department of Health, retrieved from <http://www.health.wyo.gov/rfhd/vital_records/birthcertificate.html> (accessed 06/24/2014).
47. “N-400, Application for Naturalization,” U.S. Citizenship and Immigration Services, retrieved from <http://www.uscis.gov/n-400> (accessed 06/25/2014).
48. “N-565, Application for Replacement Naturalization/Citizenship Document,” U.S. Citizenship and Immigration Services, retrieved from <http://www.uscis.gov/n-565> (accessed 06/25/2014).
49. “N-600, Application for Certificate of Citizenship,” U.S. Citizenship and Immigration Services, retrieved from <http://www.uscis.gov/n-600> (accessed 06/25/2014).
50. “Our Locations,” Federal Bureau of Prisons, retrieved from <http://www.bop.gov/locations/list.jsp> (accessed 06/27/2014).
Case 2:13-cv-00193 Document 671-19 Filed in TXSD on 11/11/14 Page 66 of 207

43 | brattle.com
51. “Register To Vote,” VoteTexas.gov, retrieved from <http://votetexas.gov/register-to-vote/register-to-vote> (accessed 06/27/2014).
52. “Required Identification for Voting in Person,” VoteTexas.gov, retrieved from <http://votetexas.gov/register-to-vote/need-id/> (accessed 06/24/2014).
53. “Taxicab Rates,” City of Houston Administration and Regulatory Affairs, retrieved from <http://www.houstontx.gov/ara/regaffairs/taxicabs_rates.html> (accessed 06/24/2014).
54. “Taxicab Rates and Approximate Fares,” Fort Worth Municipal Court Administration, retrieved from <http://fortworthtexas.gov/uploadedFiles/Municipal_Court/About_Us/Administration/Taxicab%20Rates%20and%20Approximate%20Fares.pdf> (accessed 06/24/2014).
55. Texas Administrative Code, Title 25, Part 1, Rule §181.28.
56. “Texas Concealed Handgun License (CHL) Fee Table,” Texas Department of Public Safety, retrieved from <http://www.dps.texas.gov/rsd/chl/documents/chlfeeschedule.pdf> (accessed 06/25/2014).
57. “Unit Directory,” Texas Department of Criminal Justice, retrieved from <http://tdcj.state.tx.us/unit_directory/> (accessed 06/27/2014).
58. “United States Passport Fees,” U.S. Department of State, retrieved from <http://travel.state.gov/content/dam/passports/FeeChart/Passport%20Fees%20Chart%202014_TSG.pdf> (accessed 06/25/2014).
59. “Veteran Services: Fee Exemption for Disabled Veterans,” Texas Department of Public Safety, retrieved from <http://www.txdps.state.tx.us/driverlicense/vetservices.htm> (accessed 06/25/2014).
60. VitalChek, retrieved from <https://www.vitalchek.com/> (accessed 06/24/2014).
61. “Vital Records Request Service,” Vermont State Archives and Records Administration, retrieved from <https://secure.vermont.gov/VSARA/vitalrecords/> (accessed 06/24/2014).
62. U.S. Department of Transportation Memorandum entitled “Revised Departmental Guidance on Valuation of Travel Time in Economic Analysis,” September 28, 2011.
Case 2:13-cv-00193 Document 671-19 Filed in TXSD on 11/11/14 Page 67 of 207
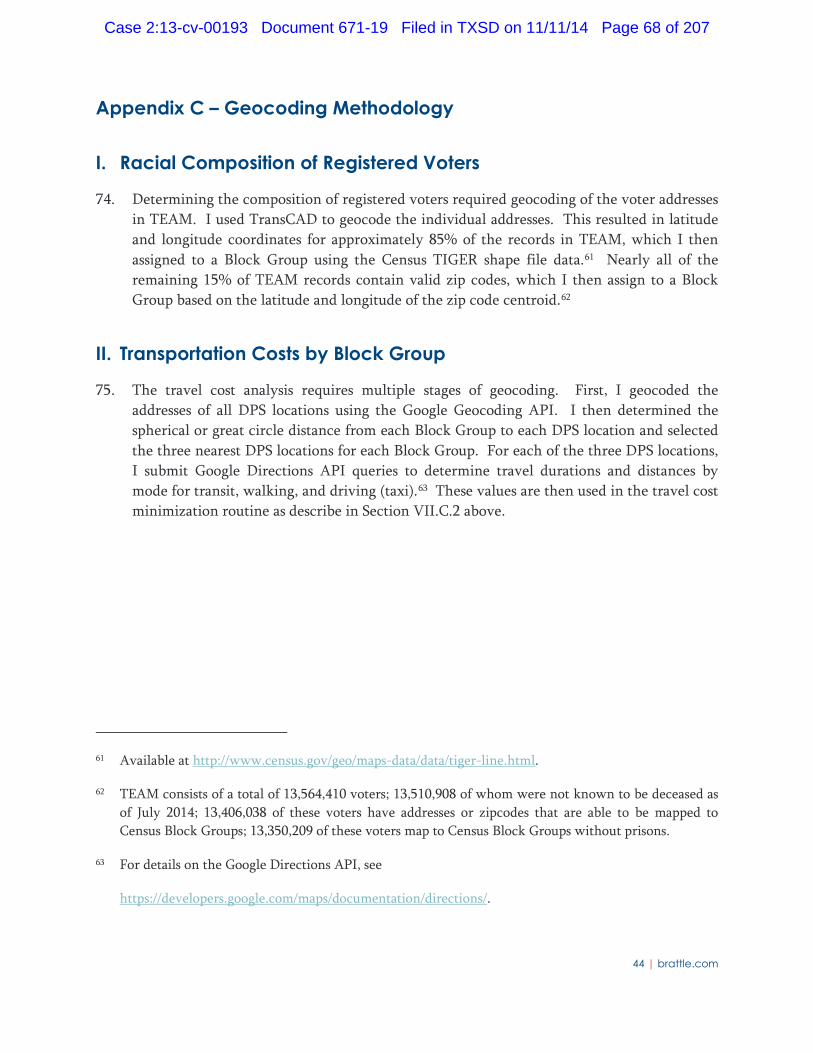
44 | brattle.com
Appendix C – Geocoding Methodology
I. Racial Composition of Registered Voters
74. Determining the composition of registered voters required geocoding of the voter addresses in TEAM. I used TransCAD to geocode the individual addresses. This resulted in latitude and longitude coordinates for approximately 85% of the records in TEAM, which I then assigned to a Block Group using the Census TIGER shape file data.61 Nearly all of the remaining 15% of TEAM records contain valid zip codes, which I then assign to a Block Group based on the latitude and longitude of the zip code centroid.62
II. Transportation Costs by Block Group
75. The travel cost analysis requires multiple stages of geocoding. First, I geocoded the addresses of all DPS locations using the Google Geocoding API. I then determined the spherical or great circle distance from each Block Group to each DPS location and selected the three nearest DPS locations for each Block Group. For each of the three DPS locations, I submit Google Directions API queries to determine travel durations and distances by mode for transit, walking, and driving (taxi).63 These values are then used in the travel cost minimization routine as describe in Section VII.C.2 above.
61 Available at http://www.census.gov/geo/maps-data/data/tiger-line.html.
62 TEAM consists of a total of 13,564,410 voters; 13,510,908 of whom were not known to be deceased as of July 2014; 13,406,038 of these voters have addresses or zipcodes that are able to be mapped to Census Block Groups; 13,350,209 of these voters map to Census Block Groups without prisons.
63 For details on the Google Directions API, see
https://developers.google.com/maps/documentation/directions/.
Case 2:13-cv-00193 Document 671-19 Filed in TXSD on 11/11/14 Page 68 of 207

45 | brattle.com
Appendix D – Determination of Affected Registered Voter Probability by Race
76. Census provides valuable information on the racial and income composition of various geographies. Public data on household income is provided at the Census tract level, while racial information is available at the Block level. I perform my analysis at the Block Group level.
77. The TEAM database records basic information about registered voters, including voter names and addresses for every registered voter in Texas. As explained in Appendix C, I use a geocoding algorithm to identify from the addresses in the TEAM database the Block Group location of registered voters in Texas and an estimate of the number of registered voters in each Block Group.
78. DOJ provided information from federal and state databases on whether each registered voter in the TEAM database held a Required ID.64 After removing voters who are eligible for a disability exemption, I combined this with the geocoding algorithm to then calculate the number of registered voters in each Block Group who must obtain a Required ID in order to vote. This is the number of Affected Registered Voters.
79. These sets of information—racial breakdowns by Census Block Group, registered voters, and Affected Registered Voters—are not conformable between the Census data and the TEAM data. That is, I do not observe the racial identity of specific registered voters in TEAM. In order to determine the share of a racial group’s registered voters that are Affected Registered Voters, I rely on the rules of probability and a couple of simplifying assumptions.
80. Let R denote the random variable for Race (e.g., African American, white, Hispanic), RV the random variable for registered voter status (registered (“1”), unregistered (“0”)), and BG the random variable denoting Block Group (any specific Block Group in Texas). Following Bayes’ Rule,
64 DOJ matching data provides multiple permutations of all primary and secondary matches. I take a
conservative approach and use the union of all potential ID matches across all ID databases to indicate that the registered voter is likely to have a Required ID.
Case 2:13-cv-00193 Document 671-19 Filed in TXSD on 11/11/14 Page 69 of 207

46 | brattle.com
𝑃𝑟(𝑅|𝑅𝑉,𝐵𝐺) =𝑃𝑟(𝑅,𝑅𝑉|𝐵𝐺)𝑃𝑟(𝑅𝑉|𝑅,𝐵𝐺)
= 𝑃𝑟(𝑅𝑉|𝑅,𝐵𝐺)𝑃𝑟(𝑅|𝐵𝐺)
𝑃𝑟(𝑅𝑉|𝑅,𝐵𝐺)
=𝑃𝑟(𝑅𝑉|𝑅,𝐵𝐺)𝑃𝑟(𝑅|𝐵𝐺)
∑ 𝑃𝑟(𝑅𝑉|𝑅 = 𝑘,𝐵𝐺)𝑃𝑟(𝑅 = 𝑘|𝐵𝐺)𝑘.
81. The conditional probability of a Block Group resident being a registered voter given that she is African American is unknown to me. But I do know this conditional probability at the state level for Texas, as described earlier in the report. I assume that the propensity to register to vote is the same for all Texas residents within the same race. That is, an African American’s propensity to register to vote is assumed to be constant across all Block Groups in Texas. The probability of a registered voter in a given Block Group being of a particular race is then
𝑃𝑟(𝑅|𝑅𝑉,𝐵𝐺) =𝑃𝑟(𝑅𝑉|𝑅)𝑃𝑟(𝑅|𝐵𝐺)
∑ 𝑃𝑟(𝑅𝑉|𝑅 = 𝑘)𝑃𝑟(𝑅 = 𝑘|𝐵𝐺)𝑘 .
82. This calculation is a critical input for calculating the share of a racial group’s registered voters that must obtain a Required ID.65 The estimated number of registered voters for a racial group is determined by multiplying this probability by the number of registered voters in the Block Group. The estimated number of registered voters within a racial group that are Affected Registered Voters is determined by multiplying this probability by the number of registered voters needing a Required ID in the Block Group.66 Across Block Groups, the share of a racial group’s registered voters that must obtain a Required ID (“ID” in the formula, with “1” denoting an individual that must obtain a Required ID) is
𝑃𝑟(𝐼𝐷 = 1|𝑅𝑉 = 1,𝑅) =∑ 𝑃𝑟(𝑅|𝑅𝑉 = 1,𝐵𝐺 = 𝑔) ∗ #(𝐼𝐷 = 1,𝑅𝑉 = 1|𝐵𝐺 = 𝑔)𝑔
∑ 𝑃𝑟(𝑅|𝑅𝑉 = 1,𝐵𝐺 = 𝑔) ∗ #(𝑅𝑉 = 1|𝐵𝐺 = 𝑔)𝑔 .
65 The assumption that registered voters status is independent of Block Group location conditional on
race is restrictive, but it has the favorable outcome that the predicted proportion of registered voters by race across Block Groups will precisely match the observed state-wide Census information.
66 This calculation further assumes that Required ID possession is independent of race conditional on registered voter and Block Group status. As with the assumption above that registered voter status is independent of Block Group location conditional on race, better data on the racial group status of individual registered votes would obviate the need to make the assumption.
Case 2:13-cv-00193 Document 671-19 Filed in TXSD on 11/11/14 Page 70 of 207

47 | brattle.com
83. This analysis can be done at any level of Census data aggregation, including state-wide, County, Census Tract, Census Block Group and Census Block. At the state-wide level, the share would collapse into just the share of registered voters state-wide that must obtain a Required ID.67 (This is because the only racial information I use is based on geography, and state-wide there is no variation in geography.) As explained in Section VI.C above, I would expect that increasing levels of aggregation of racial information would tend to bias downward the estimate of the share of African-American voters that must obtain a Required ID. This can be seen in the following table, where exploitation of racial information at the Block Group yields an estimate of the proportion of African-American Affected Registered Voters to be 6.8%. If the geographic distribution of African-American residency is ignored, then the estimate would decrease to the state-wide average of 5.3%. Similar phenomena are observed for each racial group, with shares for each race converging to the state-wide average when geographic racial distributions are ignored.
Table 12: Share of Affected Registered Voters by Geographic Aggregation Level
84. Finally, for calculation of travel time costs, I weighted Block Groups by the predicted number of registered voters within a racial group that are Affected Registered Voters.
67 To see this, BG in the formula would be replaced with State=TX. As the summation would contain
just one summand, the numbers for Texas, the proportion of registered voters by race would cancel out of the numerator and denominator of the equation, leaving just the number of registered voters lacking an ID divided by the total number of registered voters.
Percent of African-
American Affected Voters
Percent of White Affected
Voters
Percent of Hispanic
Affected Voters
Percent of Asian Affected
Voters
Percent of Other Affected
Voters
Block Group 6.82% 4.48% 6.48% 4.06% 5.00%Tract 6.65% 4.54% 6.41% 4.14% 4.98%County 5.31% 5.09% 5.76% 4.90% 5.14%State 5.29% 5.29% 5.29% 5.29% 5.29%
Notes and Sources:U.S. Census Bureau 2010 population counts; U.S. Census Bureau, Current Population Survey, November 2012; TEAM database.
Case 2:13-cv-00193 Document 671-19 Filed in TXSD on 11/11/14 Page 71 of 207
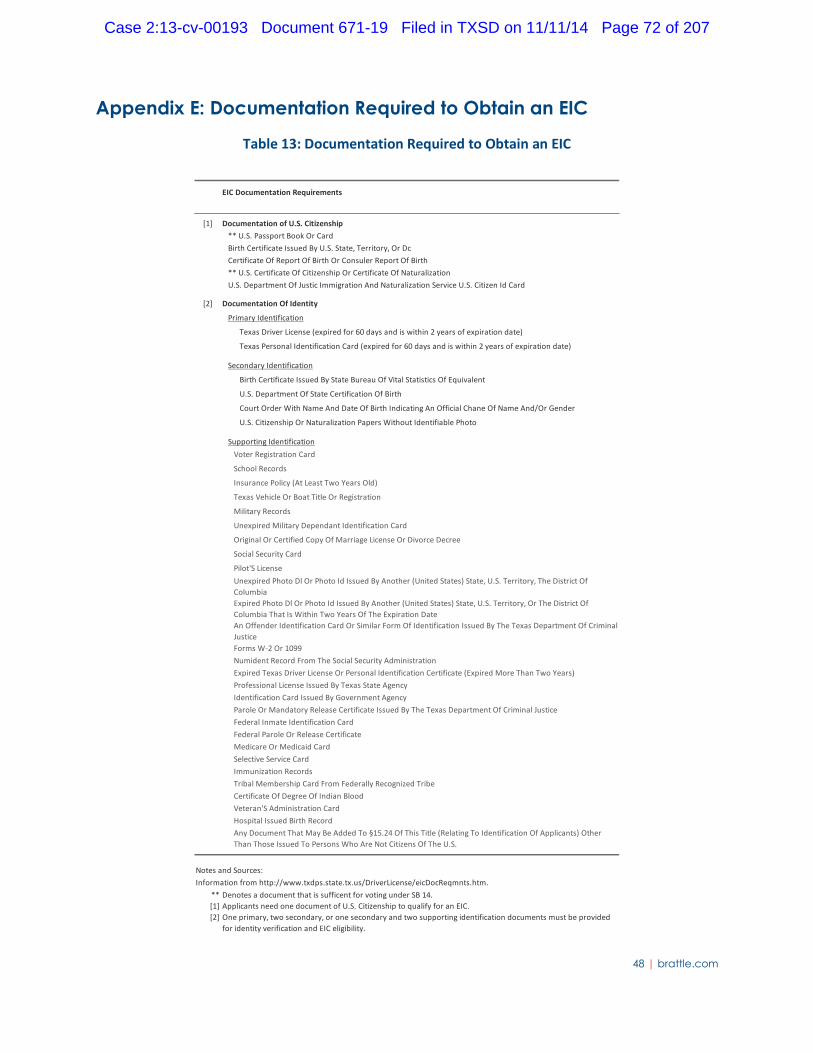
48 | brattle.com
Appendix E: Documentation Required to Obtain an EIC
Table 13: Documentation Required to Obtain an EIC
EIC Documentation Requirements
[1] Documentation of U.S. Citizenship** U.S. Passport Book Or CardBirth Certificate Issued By U.S. State, Territory, Or DcCertificate Of Report Of Birth Or Consuler Report Of Birth** U.S. Certificate Of Citizenship Or Certificate Of NaturalizationU.S. Department Of Justic Immigration And Naturalization Service U.S. Citizen Id Card
[2] Documentation Of Identity
Primary Identification
Texas Driver License (expired for 60 days and is within 2 years of expiration date)
Texas Personal Identification Card (expired for 60 days and is within 2 years of expiration date)
Secondary Identification
Birth Certificate Issued By State Bureau Of Vital Statistics Of Equivalent
U.S. Department Of State Certification Of Birth
Court Order With Name And Date Of Birth Indicating An Official Chane Of Name And/Or Gender
U.S. Citizenship Or Naturalization Papers Without Identifiable Photo
Supporting IdentificationVoter Registration Card
School Records
Insurance Policy (At Least Two Years Old)
Texas Vehicle Or Boat Title Or Registration
Military Records
Unexpired Military Dependant Identification Card
Original Or Certified Copy Of Marriage License Or Divorce Decree
Social Security Card
Pilot'S LicenseUnexpired Photo Dl Or Photo Id Issued By Another (United States) State, U.S. Territory, The District Of ColumbiaExpired Photo Dl Or Photo Id Issued By Another (United States) State, U.S. Territory, Or The District Of Columbia That Is Within Two Years Of The Expiration DateAn Offender Identification Card Or Similar Form Of Identification Issued By The Texas Department Of Criminal JusticeForms W-2 Or 1099Numident Record From The Social Security AdministrationExpired Texas Driver License Or Personal Identification Certificate (Expired More Than Two Years)Professional License Issued By Texas State AgencyIdentification Card Issued By Government AgencyParole Or Mandatory Release Certificate Issued By The Texas Department Of Criminal JusticeFederal Inmate Identification CardFederal Parole Or Release CertificateMedicare Or Medicaid CardSelective Service CardImmunization RecordsTribal Membership Card From Federally Recognized TribeCertificate Of Degree Of Indian BloodVeteran'S Administration CardHospital Issued Birth RecordAny Document That May Be Added To §15.24 Of This Title (Relating To Identification Of Applicants) Other Than Those Issued To Persons Who Are Not Citizens Of The U.S.
Notes and Sources:Information from http://www.txdps.state.tx.us/DriverLicense/eicDocReqmnts.htm.
** Denotes a document that is sufficent for voting under SB 14.[1] Applicants need one document of U.S. Citizenship to qualify for an EIC.[2] One primary, two secondary, or one secondary and two supporting identification documents must be provided
for identity verification and EIC eligibility.
Case 2:13-cv-00193 Document 671-19 Filed in TXSD on 11/11/14 Page 72 of 207
IN THE UNITED STATES DISTRICT COURT
FOR THE SOUTHERN DISTRICT OF TEXAS
CORPUS CHRISTI DIVISION
UNITED STATES OF AMERICA,
Plaintiff, TEXAS LEAGUE OF YOUNG VOTERS EDUCATION FUND and IMANI CLARK,
Plaintiff-Intervenors,
v. STATE OF TEXAS; NANDITA BERRY, in
her official capacity as Texas Secretary of State; and STEVE McCRAW, in his official capacity as Director of the Texas Department of Public Safety,
Defendants.
) ) ) ) ) ) ) ) ) ) ) ) ) ) ) ) ) )
Civ. No. 2:13-cv-00263
Third AMENDED EXPERT REPORT
OF
Coleman Bazelon
ON BEHALF OF PLAINTIFF-INTERVENORS TEXAS LEAGUE OF YOUNG VOTERS
EDUCATION FUND AND IMANI CLARK
September 21, 2014
Case 2:13-cv-00193 Document 614-1 Filed in TXSD on 09/21/14 Page 1 of 72Case 2:13-cv-00193 Document 671-19 Filed in TXSD on 11/11/14 Page 73 of 207
PL757R 9/2/2014 2:13-cv-00193

Table of Contents
I. Summary of Conclusions ............................................................................................................. 1
II. Qualifications ............................................................................................................................... 1
III. Statement of Inquiry ................................................................................................................... 2
III.A. Assignment ......................................................................................................................... 2
III.B. Materials Considered ......................................................................................................... 2
IV. Case Background ......................................................................................................................... 2
V. Outline of Methodology .............................................................................................................. 3
V.A. Methodology for Testing Whether SB 14 Has a Differential Impact By Race ............... 4
V.B. Prevalence: Racial Composition of Affected Registered Voters ...................................... 5
V.C. The Economic Costs Imposed by SB 14 ............................................................................ 6
V.D. The Burden Imposed by SB 14 .......................................................................................... 8
VI. Prevalence: The Racial Composition of Affected Registered Voters ........................................ 8
VI.A. The TEAM Database .......................................................................................................... 9
VI.B. The ID Databases and Identifying Affected Registered Voters ..................................... 10
VI.C. Racial Composition of Affected Registered Voters ........................................................ 11
VII. The Economic Costs Imposed by SB 14 .................................................................................... 15
VII.A. A “Free” EIC Is Not Costless to Obtain .................................................................. 18
VII.B. The Costs of Documents Required to Obtain an EIC ........................................... 19
VII.C. Travel Costs to Obtain an EIC ................................................................................ 22
VII.D. Total Costs to Obtain an EIC by Race.................................................................... 29
VIII. Obtaining the Required IDs is More Burdensome for African Americans ............................ 31
VIII.A. African Americans in Texas have Lower Incomes than White Texans ............... 31
Case 2:13-cv-00193 Document 614-1 Filed in TXSD on 09/21/14 Page 2 of 72Case 2:13-cv-00193 Document 671-19 Filed in TXSD on 11/11/14 Page 74 of 207

VIII.B. African Americans in Texas have Less Wealth than White Texans .................... 33
VIII.C. African Americans in Texas are More Likely to be Poor than White Texans .... 34
VIII.D. African Americans in Texas Score Lower on Other Measures of
Socioeconomic Status than White Texans ...................................................................... 35
VIII.E. SB 14 Creates a Higher Expected Burden for Affected Registered Voters
Who are African American than for those Who are White .......................................... 36
IX. Registered African-American Student Voters in Texas .......................................................... 37
Appendix A – Curriculum Vitae of Coleman Bazelon ...................................................................... 38
Appendix B – Materials Relied Upon ................................................................................................ 39
Appendix C – Geocoding Methodology ............................................................................................ 44
I. Racial Composition of Registered Voters ................................................................................. 44
II. Transportation Costs by Block Group ...................................................................................... 44
Appendix D – Determination of Affected Registered Voter Probability by Race .......................... 45
Appendix E: Documentation Required to Obtain an EIC ................................................................ 48
Case 2:13-cv-00193 Document 614-1 Filed in TXSD on 09/21/14 Page 3 of 72Case 2:13-cv-00193 Document 671-19 Filed in TXSD on 11/11/14 Page 75 of 207
1 | brattle.com
I. Summary of Conclusions
1. I examined the distribution and racial composition of registered voters in Texas who, as a
result of Texas Senate Bill 14 (“SB 14”), will not be able to vote without acquiring a form of
photo ID permitted by SB 14. My analysis leads to three conclusions:
• A disproportionate share of registered voters who will need a new ID to continue to be able to vote are African American.
• Acquiring an ID for the purpose of voting, including a nominally free ID, comes with real economic costs. As an example, I have estimated that the average travel
cost to obtain an Election Identification Certificate (“EIC”) is $36.33.
• The burden of the costs imposed by SB 14 is substantially higher for African-American Texans, who are disproportionately poorer, than for white Texans. For
example, the share of wealth represented by the travel costs needed to acquire an
EIC is more than four times higher for African-American Texans than they are for
white Texans.
II. Qualifications
2. I am a principal in the Washington, DC office of The Brattle Group (“Brattle”), an
economic consulting firm that provides litigation support in a wide variety of areas. Prior
to joining Brattle, I was a vice president with Analysis Group, an economic and strategy
consulting firm. I also served as a Principal Analyst in the Microeconomic and Financial
Studies Division of the Congressional Budget Office.
3. I received a Ph.D. and M.S. in Agricultural and Resource Economics from the University of
California at Berkeley, a Diploma in Economics from the London School of Economics and
Political Science, and a B.A. from Wesleyan University.
4. For the past two decades, I have been a practicing economist applying economic principles
to questions of valuation, regulation, policy and strategy. In doing so, I frequently provide
testimony to federal and state courts and to arbitrators, as well as advise regulatory and
legislative bodies, including the U.S. Federal Communications Commission and the U.S.
Congress. In carrying out economic analysis, I regularly utilize statistical analysis and work
with large datasets.
5. My CV is provided as Appendix A to this Expert Report. I am being compensated at my
customary rate of $550 per hour for my work on this report, including any deposition
Case 2:13-cv-00193 Document 614-1 Filed in TXSD on 09/21/14 Page 4 of 72Case 2:13-cv-00193 Document 671-19 Filed in TXSD on 11/11/14 Page 76 of 207

2 | brattle.com
testimony or testimony in court; however, Brattle has agreed to limit total compensation in
this matter.
III. Statement of Inquiry
III.A. ASSIGNMENT
6. I have been asked to evaluate the economic burden that SB 14 imposes on Texas voters and
to assess whether that burden varies depending on the voter’s race.
III.B. MATERIALS CONSIDERED
7. I relied on numerous documents produced in this matter and data and documents available
from public sources. A full list of materials considered is provided in Appendix B.
IV. Case Background
8. In 2011, SB 14 was signed into law. In relevant part, SB 14 requires voters who vote in
person to show proof of identity through the presentation of one of a specific set of state or
federal issued IDs that include the voter’s picture (“Required IDs”).1 The law requires
would-be voters who do not have a Required ID to obtain one in order to vote. Plaintiff-
Intervenors assert that this burden falls disproportionately and severely on voters in
specific sub-groups, including racial sub-groups, in violation of the Voting Rights Act
(“VRA”) and the U.S. Constitution, and challenge SB 14 on that basis.
9. In 2012, the State of Texas sued the U.S. Department of Justice (“DOJ”) in the United States
District Court for the District of Columbia under Section 5 of the VRA to gain
“preclearance” to allow SB 14 to go into effect. In blocking SB 14 from going into effect,
the court found that Texas failed to meet its burden to show that the law would not be
retrogressive to minority voters.2 In 2013, the U.S. Supreme Court struck down Section
1 These IDs include a Texas driver’s license, Texas personal identification card, United States military
identification card, United States citizenship certificate that contains a photograph, United States
passport, a Texas license to carry a concealed handgun, or a Texas Election Identification Certificate.
See
http://votesmart.org/bill/12588/voter-identification-requirements#.U6Nunp3D8TQ. Except for the
U.S. citizenship certificate, these IDs must either be current or expired for no more than 60 days.
2 Texas v. Holder, 888 F.Supp.2d 113 (D.D.C. 2012).
Case 2:13-cv-00193 Document 614-1 Filed in TXSD on 09/21/14 Page 5 of 72Case 2:13-cv-00193 Document 671-19 Filed in TXSD on 11/11/14 Page 77 of 207

3 | brattle.com
4(b), the provision of the VRA that applied Section 5 to Texas and other jurisdictions
covered by that provision.3 That decision allowed SB 14 to go into effect and led to the
current litigation brought under Section 2 of the VRA.
10. My understanding from counsel is that, unlike Section 5 of the VRA, in which the burden is on the jurisdiction itself to demonstrate that the voting change at issue is not
discriminatory, Section 2 of the VRA requires the party challenging the law at issue to
show that the voting change at issue is discriminatory. In the current case filed under
Section 2 of the VRA, the Plaintiffs are required to make a positive showing of, among
other things, the burden imposed by SB 14. This report explains my analysis of the
economic costs—one type of burden—imposed by SB 14. I find that these costs are
meaningful and fall disproportionately on African Americans. Because African Americans
in Texas generally have lower incomes and less wealth than white Texans, the impact of
these costs is even more disproportionate than are the costs themselves.
V. Outline of Methodology
11. I examine the burden that SB 14 creates on Texans using three complementary analyses. In each case, I find that SB 14 burdens African-American Texans more heavily than white
Texans. I find that:
a. With regard to “Prevalence” — Registered voters in Texas who do not have a Required ID (“Affected Registered Voters”)4 are disproportionately African
American.5
3 Shelby County v. Holder, 570 U.S. __, 133 S. Ct. 2612 (2013).
4 I define “Affected Registered Voters” to be those registered voters whose only option is to obtain a
Required ID in order to vote. Other registered voters may also be affected by SB 14. For example,
individuals with a disability rating of 50% or higher with the U.S. Social Security Administration or
the U.S. Department of Veterans Affairs may apply for exemption status from a Required ID. Until
they apply for and receive the disability exemption, however, they will not be able to vote without a
Required ID. As my analysis is restricted to only those individuals who must obtain a Required ID in
order to vote, I exclude persons eligible for a disability exemption. See
http://votetexas.gov/register-to-vote/need-id/.
5 By focusing on registered voters, I am ignoring some potential avenues that could cause SB 14 to
impact African Americans differently from non-minorities. For example, I do not investigate issues
related to eligible but unregistered voters, including whether or not their costs of acquiring a required
photo ID exhibit disproportionate burdens associated with race. Voter integrity issues have been
Continued on next page
Case 2:13-cv-00193 Document 614-1 Filed in TXSD on 09/21/14 Page 6 of 72Case 2:13-cv-00193 Document 671-19 Filed in TXSD on 11/11/14 Page 78 of 207

4 | brattle.com
b. With regard to “Cost” — Acquiring a Required ID solely for the purpose of voting is costly, including for the nominally free EIC.
c. With regard to “Burden” — The burden of the economic costs imposed by SB 14 is higher for African Americans in Texas because they are disproportionately poor.
V.A. METHODOLOGY FOR TESTING WHETHER SB 14 HAS A DIFFERENTIAL IMPACT BY
RACE
12. I test to see whether the burden created by SB 14 has a disproportionate impact on minorities, specifically African Americans. General reliance on statistical analysis to detect
the disproportionate impact of a government or business practice, process, or policy on
minorities is well established. In response to courts and policymakers, a number of
important and influential articles and books on the topic of differential impacts of various
policies on minorities have been published.6 Since those early studies, disparate treatment
analyses have been applied in a variety of settings including housing, employment, lending,
and education. In all of these settings, statistical analyses are employed to measure
differences in observed outcomes from the application of a particular process or practice
that appeared facially neutral.
Continued from previous page
raised to support SB 14, but most of those issues are addressed by the voter registration process. For
example, issues related to voter eligibility, such as age and citizenship, are directly addressed in the
voter registration process. See
http://votetexas.gov/register-to-vote/register-to-vote.
Other voter eligibility issues, such as felony status, are addressed in the voter registration process and
are not enhanced by voter picture ID requirements because the IDs do not require identification of
felony status. Even residency, which is addressed at the voter registration stage, is only confirmed by
some Required IDs. Even when the Required ID is one that has the voter’s address, however, the
confirmation is weak in that if an individual moves but retains her original voter registration, she may
also easily keep a photo ID with the prior (previously valid) address.
6 David C. Baldus and James W.L. Cole, Statistical Proof of Discrimination, Colorado Springs: Shepard’s
McGraw Hill, 1980; Michael Fix and Raymond J. Struyk editors, Clear and Convincing Evidence
Measurement of Discrimination in America, Washington D.C.: The Urban Institute Press, 1993
(hereinafter “Fix and Struyk”); and Alicia H. Munnell et.al. (1996) “Mortgage Lending in Boston:
Interpreting HMDA Data.” The American Economic Review 86:25-53 (hereinafter “Munnell et al.
1996”).
Case 2:13-cv-00193 Document 614-1 Filed in TXSD on 09/21/14 Page 7 of 72Case 2:13-cv-00193 Document 671-19 Filed in TXSD on 11/11/14 Page 79 of 207

5 | brattle.com
13. The general approach to determining the existence of a differential impact or burden of a policy or practice involves first establishing a benchmark—an expected outcome absent
discrimination.
a. In the case of housing, this may be a distribution of rental agreement outcomes based on the distribution of applicants possibly controlling for decision factors such as
income.7 These outcomes are compared statistically to actual acceptance rates or
expected acceptance rates while controlling for other decision factors.
b. In the case of mortgage lending, statistical analysis is used to establish whether a facially neutral lending decision process results in disparate results for similarly
situated applicants across race and ethnic groups.8 Again, actual rates are compared to
expected rates based on application distributions and decision factors such as income
or credit score.
c. A similar approach is taken in the employment context to review hiring and promotion decisions.9 Actual rates are compared to expected rates controlling for job
qualifications such as education, test scores, and experience.
14. Traditional differential impact analysis that distinguishes between acceptable and unacceptable causes of variation in impacts is not applied here. The current analysis,
however, is analogous to those analyses in that it posits that, absent a difference in impact
based on race, the burden of SB 14 would be the same for African Americans as for all other
Texas voters. Empirical evidence sufficient to reject this hypothesis therefore would imply
a differential impact and that SB 14 imposes a greater burden on African Americans.
V.B. PREVALENCE: RACIAL COMPOSITION OF AFFECTED REGISTERED VOTERS
15. An analysis of differential impact begins with an expectation about what various data would show absent any differential impacts. In the current case, that baseline expectation
regarding the racial composition of Affected Registered Voters is that it is proportional to
the racial composition of all registered voters in Texas. To test this expectation, I examine
whether African-American registered voters are more likely than other Texan registered
7 John Yinger, “Access Denied, Access Constrained: Results and Implications of the 1989 Housing
Discrimination Study,” in Fix and Struyk, 1993, pp. 69-112.
8 Munnell et.al, 1996.
9 Glen Cain (1986), “The Economic Analysis of Labor Market Discrimination,” in O. Ashenfelter and R.
Layards editors, Handbook of Labor Economics 1: 693-785.
Case 2:13-cv-00193 Document 614-1 Filed in TXSD on 09/21/14 Page 8 of 72Case 2:13-cv-00193 Document 671-19 Filed in TXSD on 11/11/14 Page 80 of 207

6 | brattle.com
voters to need to obtain a Required ID in order to vote. For my analysis, the association of
race with Affected Registered Voters relies on two separate algorithms:
a. Matching Texas’ registered voters to various state and federal ID databases to identify the registered voters who would need to obtain a Required ID to retain their ability to
vote.10
b. Assigning these Affected Registered Voters to Census Block Groups based on their geocoded addresses, and inferring racial composition based on the racial composition
of the Census Block Groups. As further explained in Section VI.C, my method is
conservative in that by focusing on geographic variation at the Block Group level, I
do not capture all of the expected racial variation in Affected Registered Voters.
16. I find that the proportion of Affected Registered Voters who are African American is greater than if SB 14 were race neutral. In other words, if all one knows about a registered
voter is her race, then it is more likely that SB 14 imposes a burden on her if she is African
American than if she is not.
V.C. THE ECONOMIC COSTS IMPOSED BY SB 14
17. But for the passage of SB 14, Affected Registered Voters still would be able to vote without incurring any additional expenses.11 Using standard economic and statistical methods, I
estimate the additional economic costs due to the passage of SB 14 that these voters would
face if they wish to vote.12
10 The matching of registered voters with state and federal ID databases was performed by DOJ.
11 Prior to the passage of SB 14, Texas had a voter ID law, but photo IDs were not required. The
previous law allowed voters to establish identity with items such as “official mail addressed to the
person by name from a governmental entity” or “a copy of a current utility bill, bank statement,
government check, paycheck, or other government document that shows the name and address of the
voter,” which would create much less of a burden than a photo ID requirement. Tex. Elec. Code Ann.
§ 63.0101 (valid through December 31, 2011).
12 This approach is consistent with the test set out in Frank v. Walker, 2014 WL 1775432, at *25
(E.D.Wis. Apr. 29, 2014) (hereinafter “Wisconsin Decision”): “Based on the text, then, I conclude that
Section 2 protects against a voting practice that creates a barrier to voting that is more likely to appear
in the path of a voter if that voter is a member of a minority group than if he or she is not.”
The current analysis does not measure burden based on the outcome of voting. There is a rich
literature on the determinants of voting, beginning with Anthony Downs, AN ECONOMIC THEORY OF
DEMOCRACY, (New York: Harper & Brothers, 1957). Recent scholarship finds that, “Under [the
Continued on next page
Case 2:13-cv-00193 Document 614-1 Filed in TXSD on 09/21/14 Page 9 of 72Case 2:13-cv-00193 Document 671-19 Filed in TXSD on 11/11/14 Page 81 of 207

7 | brattle.com
18. This analysis is similar to those I use to estimate economic damages in other matters: I estimate the “compensating variation,” which is the amount of money an individual would
have to be compensated to be economically13 as well off under SB 14 as she would have
been but for the enactment of SB 14. In a damages case, the damages would be this
compensation.
19. Economic damages are actual (sometimes called “out-of-pocket”) cash expenses plus opportunity costs. In the current case, the opportunity cost is the value of time spent
acquiring a Required ID. These costs can be direct—such as the time spent waiting to
acquire an EIC at a Department of Public Safety (“DPS”) office—or indirect—such as the
value of time and monetary costs of acquiring documents needed to acquire an EIC, such as
a birth certificate. For avoidance of doubt, I estimate the economic costs for purposes of
assessing the burden they create, not for purposes of providing compensation.
20. I focus my estimations on the costs of acquiring an EIC because it is the least costly alternative for most Affected Registered Voters who still wish to vote after the passage of
SB 14. Although the DPS does not charge for an EIC, there are still significant economic
costs to obtain one, including travel costs to get to the DPS.14 These costs are the focus of
much of my empirical analysis. In addition to these travel costs, the costs of acquiring
required supporting documents (such as a birth certificate), if needed, and the time
expended to get those supporting documents, as well as other costs such as day care or time
off from work, add to the economic costs associated with acquiring an EIC. I do not
Continued from previous page
‘calculus of voting’], even small increases in the costs of voting can deter a person from voting, since
the benefits of voting are slight.” Wisconsin Decision at *17.
13 I recognize that there may be non-economic harms placed on individuals, such as the social stigma of
society creating a new barrier to voting, that are more analogous to pain and suffering. I do not
attempt to quantify the amount of monetary compensation required to off-set these additional harms.
Rather, I restrict my analysis to the more traditional areas of economic harm.
14 For ease of exposition, I refer to “DPS” locations, although voters may go to fixed and mobile county
EIC issuing locations in order to obtain a Required ID. My analysis accounts for both fixed and mobile
EIC issuing locations. See “County Locations Issuing Election Identification certificates,” available at
http://www.dps.texas.gov/DriverLicense/documents/EICCountyrun.pdf,
and “DPS Mobile Stations Issuing Election Identification Certificates,” available at
http://www.dps.texas.gov/DriverLicense/documents/EICDPSrun.pdf.
Case 2:13-cv-00193 Document 614-1 Filed in TXSD on 09/21/14 Page 10 of 72Case 2:13-cv-00193 Document 671-19 Filed in TXSD on 11/11/14 Page 82 of 207

8 | brattle.com
estimate these additional costs of acquiring an EIC; rather, I focus on the travel costs of
acquiring an EIC that will be borne by almost all Affected Registered Voters. The
additional costs beyond travel costs, however, are among the economic costs created by SB
14. As a result, the costs estimated in this report are conservative; for many Affected
Registered Voters, the total cost of obtaining an EIC will be higher than the costs estimated
in this report.
21. I estimate travel costs separately for African-American and other Texan Affected Registered Voters. I find that the economic costs imposed on both African-American and
other Texan Affected Registered Voters are meaningful, and average $36.33 for all
registered voters in Texas.
V.D. THE BURDEN IMPOSED BY SB 14
22. Beyond the difference in prevalence of these costs for African-American and white Texans, the “burden” that the same economic cost imposes on different individuals varies as their
ability to bear those costs varies: all else equal, a wealthy or high income individual will
find a given economic cost less burdensome than a poor or low income individual.
Economists explain this as stemming from the diminishing marginal utility of wealth. In
layman’s—or common sense—terms it means that an extra $100 to a wealthy individual
adds less to her well-being than does an extra $100 to a poor individual. Similarly, losing
$100 is a greater loss to someone with a low income compared to someone with a high
income. The implication of this is that any cost, whether $25 or $50, impacts the well-
being of lower income individuals more acutely than higher income individuals.
23. I evaluate SB 14’s burden on African-American and other Texans using data on income, wealth, and other social measures. I find that the burden created by SB 14 is higher for
African-American voters than for white voters in Texas because African Americans in
Texas have disproportionately low incomes and are disproportionately poor.
VI. Prevalence: The Racial Composition of Affected Registered Voters
24. I estimate the racial composition of Affected Registered Voters by combining information from three sources.
a. The Texas Election Administration Management (“TEAM”) database lists all registered voters in Texas and provides their addresses, but does not provide
information on race.
b. DOJ has determined which registered voters lack a Required ID by matching individuals in the TEAM database to numerous other databases that list individuals
who hold various Required IDs (the “ID databases”). Individuals in the TEAM
Case 2:13-cv-00193 Document 614-1 Filed in TXSD on 09/21/14 Page 11 of 72Case 2:13-cv-00193 Document 671-19 Filed in TXSD on 11/11/14 Page 83 of 207

9 | brattle.com
database who do not appear (do not “match”) in any of the ID databases are
considered to not possess a Required ID and are the Affected Registered Voters.
c. DOJ has also determined which registered voters may be eligible for disability exemption by matching individuals in the TEAM database to Social Security
Administration and Veterans Affairs databases. Individuals in the TEAM database
who appear in any of the disability exemption databases are considered not to be
Affected Registered Voters.
d. The U.S. Census provides information on the racial composition of various geographical areas; I base my analysis on “Census Block Groups.”15 I estimate the
racial composition of Affected Registered Voters by assigning to each Affected
Registered Voter a probability of being African American or non–African American
based on the racial proportion in that Affected Registered Voter’s Census Block
Group. Note that the use of Census Block Groups instead of Census Blocks biases
downwards any racial differences that I find.
25. I explain each database and how I use it in my analysis below.
VI.A. THE TEAM DATABASE
26. The publicly available TEAM database contains the name, voter ID number, address (residential and mailing), and party affiliation of each registered voter in Texas.
Appendices C & D provide further details on my data manipulations with the TEAM data.
27. The geographic distribution of registered voters in the TEAM database is shown in Figure 1. In subsequent steps of my analysis, I combine the geographic distribution of voters with
information from the U.S. Census on the racial and economic characteristics of
geographical areas to estimate the racial and geographic characteristics of the Affected
Registered Voters.
15 Census Blocks are the smallest geographic unit used for Census data. Blocks are aggregated into
Census Block Groups, which in turn are aggregated into Census Tracts. The state of Texas is divided
into 914,231 Census Blocks, 15,811 Census Block Groups and 5,265 Census Tracts. See
https://www.census.gov/geo/maps-data/data/tallies/tractblock.html.
Case 2:13-cv-00193 Document 614-1 Filed in TXSD on 09/21/14 Page 12 of 72Case 2:13-cv-00193 Document 671-19 Filed in TXSD on 11/11/14 Page 84 of 207

10 | brattle.com
Figure 1: Geographic Distribution of Registered Voters in Texas
VI.B. THE ID DATABASES AND IDENTIFYING AFFECTED REGISTERED VOTERS
28. I used the outputs of DOJ’s database matching analysis to identify the Texas registered voters who must obtain a Required ID. Appendices C & D contain further details on the
integration of this data with the TEAM and U.S. Census data. 4.1% of registered voters in
Texas would need to obtain a Required ID in order to vote.16 Figure 2 is identical to Figure
1 except that it shows the geographic distribution of Affected Registered Voters.
16 The ID Databases indicate that approximately 5% of registered voters in Texas lack a Required ID.
However, just under 100,000 of these individuals, or 1% of the registered voter population, are eligible
for a disability exemption as identified in the DOJ-provided U.S. Social Security Administration and
U.S. Department of Veterans Affairs databases. I conservatively restrict my analysis to just those
registered voters who, strictly speaking, must obtain a Required ID in order to vote and who wouldn’t
be able to avoid the burden of obtaining a Required ID by virtue of applying instead for a disability
Continued on next page
Case 2:13-cv-00193 Document 614-1 Filed in TXSD on 09/21/14 Page 13 of 72Case 2:13-cv-00193 Document 671-19 Filed in TXSD on 11/11/14 Page 85 of 207

11 | brattle.com
Figure 2: Geographic Distribution of Affected Registered Voters in Texas
VI.C. RACIAL COMPOSITION OF AFFECTED REGISTERED VOTERS
29. Minorities are not evenly distributed throughout Texas. The odds that a given Affected Registered Voter is African American vary greatly depending on where that voter resides.
The U.S. Census provides information on the racial composition of the populations living in
various geographical areas. The racial composition of Census Block Groups (i.e., the
Continued from previous page
exemption. Disability-eligible voters likely face additional burdens to vote imposed by SB 14 that I do
not measure. Additionally, there are a variety of reasons for which some disability-eligible voters
might choose to apply for an EIC; such voters would face the same burdens of obtaining an EIC
discussed in this report.
Case 2:13-cv-00193 Document 614-1 Filed in TXSD on 09/21/14 Page 14 of 72Case 2:13-cv-00193 Document 671-19 Filed in TXSD on 11/11/14 Page 86 of 207

12 | brattle.com
fraction of the population in each Census Block Group that is African American) in Texas is
shown in Figure 3.
Figure 3: Racial Composition (Fraction African American) of Census Block Groups in Texas
30. As seen in Figure 3, many African Americans in Texas live in urban areas. The counties
with the highest proportion of African Americans are generally in or very near cities,
especially Dallas, Waco, Houston, and Beaumont. Nearly half of the African-American
population in Texas lives in Dallas or Harris County.17 There is also a significant presence
of African Americans in Census Block Groups that contain prisons. Texas revokes the right
17 Houston is located in Harris County.
Case 2:13-cv-00193 Document 614-1 Filed in TXSD on 09/21/14 Page 15 of 72Case 2:13-cv-00193 Document 671-19 Filed in TXSD on 11/11/14 Page 87 of 207
13 | brattle.com
to vote for convicted felons, and I conservatively remove all Census Block Groups with
federal and state prisons from my analysis.18
31. For the purpose of the current analysis, it is not necessary to identify the race of each voter with precision; it is sufficient to estimate the number of Affected Registered Voters that are
African American or not African American. I do so in three steps:
a. First, I estimate the proportion of registered voters in each Census Block Group that is African American.19
b. Second, I assign each Affected Registered Voter to a Census Block Group based on addresses in the TEAM database using geocoding software.20
c. Third, I assign to each Affected Registered Voter a probability of being African American equal to the proportion of registered voters in each Census Block Group
that is African American (as estimated in step (a)).
32. My method is “conservative” in the sense that, if there is a disparity in prevalence between the races, then I am likely to systematically underestimate it. Given that, as discussed
below, my conservative method shows a significant racial disparity, I would expect a less
aggregated analysis, or one bringing to bear additional information regarding racial
composition, to show a larger racial disparity. Essentially, my method only detects a racial
disparity based on where Affected Registered Voters live. If there is a racial disparity
18 See http://tdcj.state.tx.us/unit_directory/ for a list of all state prisons in Texas.
See http://www.bop.gov/locations/list.jsp for a list of all federal prisons in Texas.
19 I calculate this proportion as the ratio of (i) the number of registered voters in the Census Block Group
who are African American to (ii) all registered voters in the Census Block Group. I calculated (i) as
the number of African Americans in the Census Block Group (taken from Census data) multiplied by
the state-wide fraction of African Americans who are registered to vote. I calculated (ii) as the sum of
the equivalent quantity as in (i) for each race. At a state-wide level, in 2012 the Census reports that
72% of white Texans are registered to vote, about 71% of African-American Texans are registered to
vote, and about 39% of Hispanic Texans are registered to vote.
Source: U.S. Census Bureau, Voting and Registration in the Election of November 2012 – Detailed
Tables, Table 4b, available at
https://www.census.gov/hhes/www/socdemo/voting/publications/p20/2012/tables.html .
20 See Appendix C for details on the geocoding algorithm.
Case 2:13-cv-00193 Document 614-1 Filed in TXSD on 09/21/14 Page 16 of 72Case 2:13-cv-00193 Document 671-19 Filed in TXSD on 11/11/14 Page 88 of 207

14 | brattle.com
beyond controlling for where Affected Registered Voters live, my method will not capture
it. Intuitively, one can see this by imagining a case where all Affected Registered Voters
were actually African American (so 0% were not African American), and considering what
my method would estimate. So long as some Affected Registered Voters lived in Census
Block Groups that were racially mixed, my method would estimate that at least some of
those Affected Registered Voter were not African-American, which necessarily understates
the assumed racial disparity. In other words, by averaging over a Census Block, I lose
granularity of the analysis. In Appendix D, I repeat my estimate using more aggregated
Census regions and verify that the more granular the analysis regarding racial composition,
the greater the number of Affected Registered Voters that are African American. In sum, I
would expect to find greater racial disparity using a more granular analysis.
33. Table 1 provides my calculations of the number and share of Affected Registered Voters by race. Using my conservative method, I find that 5.5% of African-American registered
voters would need to obtain a Required ID in order to vote. This is larger than the overall
population of Affected Registered Voters, where I find that 4.1% of all registered voters
would need to obtain a Required ID.21 It is also larger than the white population of
Affected Registered Voters, where I find that 3.1% of white registered voters in Texas
would need to obtain a Required ID.
21 As noted above, see supra footnote 15, I have restricted my analysis to those registered voters who do
not have the option of applying for a disability exemption and therefore must obtain a Required ID in
order to vote.
Case 2:13-cv-00193 Document 614-1 Filed in TXSD on 09/21/14 Page 17 of 72Case 2:13-cv-00193 Document 671-19 Filed in TXSD on 11/11/14 Page 89 of 207

15 | brattle.com
Table 1: Affected Registered Voters by Race
VII. The Economic Costs Imposed by SB 14
34. Every Required ID has a direct fee, except for Veteran IDs and the EIC, as shown in Table 2.22
22 For full voting requirements in Texas, see “Required Identification for Voting in Person,” available at
http://votetexas.gov/register-to-vote/need-id/ .
All Texans
All Registered
Texan Voters
All Affected
Registered
Texan Voters
Affected
Share of
Registered
Voters
[A] [B] [C] [D]
African American 2,835,493 1,721,682 95,393 5.5%
White 11,311,834 7,686,747 241,812 3.1%
Hispanic 9,389,496 3,385,463 186,654 5.5%
All 24,932,741 13,350,209 EIC required 541,143 4.1%
EIC required, or
disability exempt622,279 4.7%
Notes and Sources:
[C]: Results of DOJ Matching data and Brattle racial coding algorithm.
[D]: [C] / [B].
U.S. Census Bureau 2010 population counts; U.S. Census Bureau, Current Population Survey,
November 2012; TEAM database.
[B]: TEAM consists of a total of 13,564,410 voters; 13,510,908 of whom were not known to be deceased as of July
2014; 13,406,038 of these voters have addresses or zipcodes that are able to be mapped to Census Block Groups;
13,350,209 of these voters map to Census Block Groups without prisons.
Case 2:13-cv-00193 Document 614-1 Filed in TXSD on 09/21/14 Page 18 of 72Case 2:13-cv-00193 Document 671-19 Filed in TXSD on 11/11/14 Page 90 of 207

16 | brattle.com
Table 2: Fees to Issue Required IDs
ID Type
New ID Renewal ID
[1] Texas Driver License
Under 18 $16 $6
18 to 84 $25 $25
Over 85 $9 $9
Disabled Veterans $0
Replacement $11
[2] Texas Election Identification Certificate $0
[3] Texas Personal Identification Card
59 and Younger $16 $16
60 and Older $6 $6
Replacement $11
[4] Concealed Handgun License - Standard $140 $70
[5] Veteran ID card $0
[6] United States Citizenship Certificate
Naturalization Certificate $680 $345
Certificate for Citizenship $600 $345
[7] United States Passport
Book $135 $110
Card $55 $30
Notes and Sources:
[5]: Veteran Services, available at http://www.txdps.state.tx.us/DriverLicense/vetServices.htm.
[6]: Application for Naturalization information, available at http://www.uscis.gov/n-400.
Application for Certificate of Citizenship information, available at http://www.uscis.gov/n-600.
[7]: United States Passport Fees, available at
http://travel.state.gov/content/dam/passports/FeeChart/Passport%20Fees%20Chart%202014_TSG.pdf.
Nominal Cost
All forms of identification, except for US citizenship certificate or certificate of naturalization, need to be
current or expired no longer than 60 days at the time of voting. See
http://www.txdps.state.tx.us/driverlicense/electionid.htm.
[1] & [3]: Texas Driver License and Identification Card Fees, available at
http://www.txdps.state.tx.us/DriverLicense/fees.htm.
[2]: Election Identification Certificate (EIC) information, available at
http://www.txdps.state.tx.us/driverlicense/electionid.htm.
[4]: Texas Concealed Handgun License (CHL) Fee Table, available at
http://www.dps.texas.gov/RSD/CHL/documents/CHLFeeSchedule.pdf.
Application for Replacement Naturalization/Citizenship Document information, available at
http://www.uscis.gov/n-565.
Case 2:13-cv-00193 Document 614-1 Filed in TXSD on 09/21/14 Page 19 of 72Case 2:13-cv-00193 Document 671-19 Filed in TXSD on 11/11/14 Page 91 of 207
17 | brattle.com
35. In addition to the issuance fee, all other Required IDs (except the Texas Personal Identification Card) have eligibility requirements, such as military service or learning to
drive, that make them unreasonable alternatives for the purpose of enabling voting. I focus
on the costs to obtain an EIC because it is the least costly remedy for most Affected
Registered Voters.23
36. Although there is no direct fee associated with acquiring an EIC, a voter without a Required ID bears economic costs in acquiring one. For purposes of my analysis, I
categorize these economic costs as direct or indirect, and as monetary or non-monetary.
a. Direct versus Indirect
i. Direct Economic Costs are costs associated with the narrow act of applying for
and receiving an EIC, such as the time and expense it takes to go to the DPS and
apply for an EIC.
ii. Indirect Economic Costs are costs that are incurred to support applying for and
receiving an EIC, such as the cost of obtaining a birth certificate or securing
childcare while obtaining the EIC.
b. Monetary versus Non-Monetary
i. Monetary Economic Costs include any cash expenditures related to acquiring an
EIC or supporting documents.
ii. Non-Monetary Economic Costs include the non-cash economic costs associated
with acquiring an EIC, such as waiting in line at the DPS or the time spent
acquiring a birth certificate.
37. Note that both direct versus indirect economic costs and monetary versus non-monetary economic costs are independent characteristics, such that both direct and indirect
economic costs can be either monetary or non-monetary. These may include the time and
monetary costs of obtaining supporting documentation (such as a birth certificate), the
costs in time and money of traveling to a DPS or other facility that issues EICs, lost wages,
23 Note that in addition to a fee, the Texas Personal Identification Card requires the same sort of
documentation as the EIC. See
http://www.txdps.state.tx.us/DriverLicense/applyforid.htm.
Case 2:13-cv-00193 Document 614-1 Filed in TXSD on 09/21/14 Page 20 of 72Case 2:13-cv-00193 Document 671-19 Filed in TXSD on 11/11/14 Page 92 of 207

18 | brattle.com
the cost of child care services,24 and the potential risk of job loss. The EIC is valid for 6
years, so some of the costs related to physical renewal of an EIC would be periodically
repeated.
VII.A. A “FREE” EIC IS NOT COSTLESS TO OBTAIN
38. I understand that Texas has claimed that the EIC is “free” and that there is therefore no economic cost imposed by SB 14.25 This claim is incorrect. First, there are indirect
monetary costs involved in obtaining an EIC, such as transportation costs, child care costs
while traveling and waiting at the DPS, and the cost of obtaining supporting documents.
Second, it is widely recognized—in the economics literature,26 in business practice, and in
U.S. government- and state-sponsored studies27—that non-monetary costs, such as wait or
travel times, are economic costs and are an important consideration in the overall cost of a
decision.
24 The Texas Workforce Commission reported that median child-care costs for part-day services range
from $11 for school-age children in registered child-care homes to $26 for infants in licensed child-
care centers. See Texas Workforce Commission (April 2011), “2010 Texas Child Care Market Rate
Survey – Final Report,” at 15. Report available at:
http://www.twc.state.tx.us/svcs/childcare/child-care-market-rate-report.pdf.
25 Defendant’s Motion to Dismiss, ECF No. 52, at 2, 17-18.
26 For example, noted statistician and economist Harold Hotelling and antitrust economist Steven Salop
give equal weight to both travel costs and the direct price of purchasing a good, noting the importance
of distance from a firm in determining whether an individual will buy from the firm or its rival. See
Harold Hotelling (1929) “Stability in Competition” The Economic Journal 39: 41-57 and Steven Salop
(1979) “Monopolistic Competition with Outside Goods” The Bell Journal of Economics 10: 141-156.
27 Empirical studies of the value of time, particularly in travel decisions, play an explicit role in
transportation planning, including highway build out, congestion management, the determination of
tolls, and the setting of transit fares for buses and subway systems. See, for example, Texas A&M
Transportation Institute (December 2012), “TTI’s 2012 Urban Mobility Report”; David Ellis (May
2008), “Technical Memorandum: Cost Per Hour and Value of Time Calculations for Passenger
Vehicles and Commercial Trucks for Use in the Urban Mobility Study”; Maricopa Association of
Governments (February 2012), “Toll Road Modeling Support: Final Report”; and, U.S. Department of
Transportation (September 28, 2011), “Revised Departmental Guidance on Valuation of Travel Time
in Economic Analysis.”
Case 2:13-cv-00193 Document 614-1 Filed in TXSD on 09/21/14 Page 21 of 72Case 2:13-cv-00193 Document 671-19 Filed in TXSD on 11/11/14 Page 93 of 207

19 | brattle.com
VII.B. THE COSTS OF DOCUMENTS REQUIRED TO OBTAIN AN EIC
39. Although I do not directly estimate the costs of acquiring the documents that are required to support an application for an EIC, if needed, they are nevertheless real costs. Individuals
who have to obtain these documents would bear these costs in addition to the travel costs I
estimate.
40. To qualify for an EIC, voters must provide:28
a. documentation of identity, and
b. documentation of U.S. Citizenship, and
c. a valid Texas voter registration card.
41. Documentation of Identity is divided into three categories: primary, secondary, and supporting. One primary, two secondary, or one secondary and two supporting
identification documents must be provided for identity verification and EIC eligibility.29
28 Election Identification Certificate (EIC) information, available at:
http://www.dps.texas.gov/DriverLicense/electionID.htm.
Additionally, one must be a Texas resident and be 17 years and 10 months or older, and not possess
another legitimate form of voting identification.
A summary of the documents required to support an application for an EIC are provided in Table 13
in Appendix E.
29 Primary identification is a Texas driver’s license expired more than 60 days but within two years of
the expiration date. Secondary identification includes original or certified copies of a birth certificate
issued by the appropriate State Bureau of Vital Statistics or equivalent agency, United States
Department of State Certification of Birth, a court order with name and date of birth indicating an
official change of name and/or gender, or U.S. citizenship or naturalization papers without an
identifiable photo. Supporting identification includes twenty eight different categories of documents,
including a voter registration card, Texas vehicle or boat title or registration, Social Security card, a
driver’s license or photo ID issued by DC or another U.S. state or territory, or school records. Election
Identification Certificate (EIC) – Documentation Requirements lists all acceptable forms of
documentation, available at:
http://www.txdps.state.tx.us/DriverLicense/eicDocReqmnts.htm.
Case 2:13-cv-00193 Document 614-1 Filed in TXSD on 09/21/14 Page 22 of 72Case 2:13-cv-00193 Document 671-19 Filed in TXSD on 11/11/14 Page 94 of 207

20 | brattle.com
42. Documentation of U.S. citizenship can be satisfied by several forms of identification.30
Since some such commonly held IDs—U.S. passports or citizenship papers with photo—are
sufficient to vote in their own right, it is generally the various forms of birth certificates
that are relevant for obtaining an EIC.
43. For Texas-born residents, the monetary cost of obtaining a birth certificate is $22. I understand that an individual who obtains a birth certificate in person (as opposed to by
mail) for purposes of obtaining an EIC can have this fee waived.31 However, photo ID
requirements to obtain a birth certificate may lead to additional costs. Applicants must
submit or show a valid photo ID,32 such as a current driver’s license or U.S. Passport in
order to apply for a birth certificate. Alternatively, applicants must provide a number of
secondary identification documents, which also require at least one photo ID.33
44. For residents born outside of Texas, the monetary cost of obtaining a birth certificate varies by state. Every U.S. state offers an option to obtain a birth certificate either online or by
mail.34 Required documentation varies by state, but in general a valid photo ID is required
in order to apply for a birth certificate.
30 These include: a U.S. passport book or card, birth certificate issued by a U.S state, territory, or District
of Columbia, Certificate of Report of Birth, Consular Report of Birth issued by the U.S. Department of
State, U.S. Certificate of Citizenship or Certificate of Naturalization, or U.S. Department of Justice
Immigration and Naturalization Service U.S. Citizen ID card.
31 See
http://www.dshs.state.tx.us/Layouts/ContentPage.aspx?PageID=56719&id=8589981487&terms=electio
n+identification.
32 An application for birth certificate can be submitted online, by mail, or in person. This potentially
eliminates the direct travel costs associated with obtaining a birth certificate. See
http://www.dshs.state.tx.us/vs/reqproc/certified_copy.shtm.
33 For a list of acceptable primary or secondary identification requirements for a Texas birth certificate,
see:
http://info.sos.state.tx.us/pls/pub/readtac$ext.TacPage?sl=R&app=9&p_dir=&p_rloc=&p_tloc=&p_ploc
=&pg=1&p_tac=&ti=25&pt=1&ch=181&rl=28.
34 All states except Wyoming and Vermont allow online application of vital records via the commercial
vendor VitalChek, https://www.vitalchek.com/. Most also host their own online vital records service.
Wyoming has a by-mail application service. See
Continued on next page
Case 2:13-cv-00193 Document 614-1 Filed in TXSD on 09/21/14 Page 23 of 72Case 2:13-cv-00193 Document 671-19 Filed in TXSD on 11/11/14 Page 95 of 207

21 | brattle.com
45. I have not found any analyses considering whether African Americans in Texas have lower possession rates of these supporting documents than white Texans. Indirect evidence,
however, suggests that African Americans in Texas are less likely to possess such
documentation. A 2006 survey by the Brennan Center found that one-quarter of voting-
age African Americans lack a government issued photo ID, versus 8% of white citizens.35
Another study found that 26.7% of African-American 18 to 29 year-olds lacked a birth
certificate, compared to only 15.7% of white youth.36 According to this same study,
African-American “youth reported that the lack of required identification prevented them
from voting at nearly four times the rate of white youth (17.3 percent compared with 4.7
percent).”37 Evidence provided at trial in the recent Wisconsin voter ID case of Frank v.
Walker found that “[m]issing birth certificates are also a common problem for older
African American voters who were born at home in the South because midwives did not
issue birth certificates.”38 Furthermore, significant numbers of Katrina evacuees relocated
to Texas39 and a much higher percentage of African-American evacuees did not return to
their pre-Katrina counties,40 suggesting that a disproportionately high number of African-
Continued from previous page
http://www.health.wyo.gov/rfhd/vital_records/birthcertificate.html. Vermont has an online and by-
mail application service. See
https://secure.vermont.gov/VSARA/vitalrecords/.
35 See “Citizens without Proof: A Survey of Americans’ Possession of Documentary Proof of Citizenship
and Photo Identification,” available at:
http://www.brennancenter.org/sites/default/files/legacy/d/download_file_39242.pdf.
36 Jon Rogowski and Cathy Cohen, “Black and Latino Youth Disproportionately Affected by Voter
Identification Laws in the 2012 Election,” at 5. Report available at:
http://research.blackyouthproject.com/files/2013/03/voter-ID-laws-feb28.pdf.
37 Id. at 1.
38 Wisconsin Decision at *16 n.17; see also id. at *30 n.36.
39 Jeffrey A. Groen and Anne E. Polivka (March 2008), “Hurricane Katrina evacuees: who they are,
where they are, and how they are faring,” BLS Monthly Labor Review, at 40. (Hereinafter, “Groen &
Polivka”.)
40 Groen & Polivka, at 44.
Case 2:13-cv-00193 Document 614-1 Filed in TXSD on 09/21/14 Page 24 of 72Case 2:13-cv-00193 Document 671-19 Filed in TXSD on 11/11/14 Page 96 of 207

22 | brattle.com
American Katrina evacuees settled in Texas. Many of these evacuees lost their IDs in the
storm.41
VII.C. TRAVEL COSTS TO OBTAIN AN EIC
46. Travel costs include monetary costs such as bus or taxi fares, as well as non-monetary costs such as travel time. To estimate travel costs, I assume that potential voters would seek to
obtain an EIC from whichever DPS or other EIC issuing location that minimizes the overall
travel cost of getting to that location.
47. If the only travel option to get to a DPS were walking, then most potential voters would travel to the DPS closest to their home.42 Figure 4 provides an illustrative example of this
selection method for the Houston area. Each DPS is denoted by a black dot, and the
collection of Census Block Groups whose residents would find that DPS to be the nearest
are shown as like-colored dots surrounding the black dot.43 For example, the area of South
Houston has a single DPS, and it is surrounded by magenta dots, which represent all of the
Block Groups (and potential voters) who would choose to walk to that DPS rather than any
other because it is the nearest EIC-granting location. Just east of South Houston is a
collection of grey-colored dots identifying Block Groups that would choose to go to an
alternate DPS location rather than the location in South Houston.
41 Bob Sullivan (September 13, 2005), “Katrina victims face identity crisis,” NBC News, available at:
http://www.nbcnews.com/id/9316512/ns/technology_and_science-security/t/katrina-victims-face-
identity-crisis/#.U58Jq_ldWVM. Last accessed June 16, 2014.
42 It is possible that some people would travel to a DPS from work or while commuting to or from work.
I do not have any information on the work addresses (or times at work) for registered Texas voters, so
I model travel from home.
43 In this particular chart, distance is measured by the Euclidean distance metric, often referred to “as
the crow flies.” It is an approximation of the walking distance, although actual street patterns would
distort the distances somewhat.
Case 2:13-cv-00193 Document 614-1 Filed in TXSD on 09/21/14 Page 25 of 72Case 2:13-cv-00193 Document 671-19 Filed in TXSD on 11/11/14 Page 97 of 207

23 | brattle.com
Figure 4: Block Groups with Shortest Distance to Each DPS Location (Houston)
48. Figure 4 does not account for differences in travel time or costs associated with different travel modes (walking, bus, taxi, or being driven by a friend or family member). For
example, some Block Groups may sit on transit lines that significantly shrink the travel
time to a particular DPS location, suggesting that the preferred DPS location may not be
the nearest one.
49. In this section, I explain how I account for these factors by calculating the total cost of travel, including the economic costs of travel time, for each of three possible modes of
travel—walking, transit, or taxi—and selecting the lowest cost method.44
44 Obviously, driving oneself is not an option—otherwise the individual would already have a valid
photo ID in the form of a driver’s license. The cost of a taxi also stands in for the “cost” of getting a
ride from a friend or relative.
Case 2:13-cv-00193 Document 614-1 Filed in TXSD on 09/21/14 Page 26 of 72Case 2:13-cv-00193 Document 671-19 Filed in TXSD on 11/11/14 Page 98 of 207

24 | brattle.com
VII.C.1. Value of Time
50. The amount of money an individual would be willing to pay to avoid travel time is known as the “Value of Time” in the economics and transportation literature.45 Everyone has a
limited budget of time to allocate towards work and leisure activities, and time spent going
to the DPS reduces the time available for other productive or pleasurable pursuits.
Transportation departments at the state and federal levels have long recognized this fact,
and the value of commuters’ time plays a key role in their decisions regarding road
construction and maintenance, as well as congestion management.
51. The Texas Transportation Institute issued a report in December 2012 that valued the cost of delays while traveling at $16.79 per hour for personal (as opposed to commercial) drivers.46
Other transportation agencies derive similar values for the value of travel time savings.
Many identify a value of time that is approximately equal to 50 percent of average wages.47
This valuation is also recommended by the U.S. Department of Transportation (“USDOT”)
for local personal travel, which notes explicitly that with 2009 nationwide median annual
household income of $49,777, the average value of travel time savings would be $12.00 per
hour.48 The USDOT also notes that “Personal time spent walking or waiting outside
vehicles, as well as time spent standing in vehicles or bicycling [presumably when not for
pleasure], should be evaluated at 100 percent of hourly income.”49 This latter measure
better captures the value of time expended to acquire an ID solely for the purpose of
retaining the ability to vote.
45 See Small, Kenneth A. and Erik T. Verhoef, The Economics of Urban Transportation, New York:
Routledge, 2007, at 45-46.
46 See Texas A&M Transportation Institute (December 2012), “TTI’s 2012 Urban Mobility Report.” For a
description of methodology, see David Ellis (May 2008), “Technical Memorandum: Cost Per Hour and
Value of Time Calculations for Passenger Vehicles and Commercial Trucks for Use in the Urban
Mobility Study.”
47 See Maricopa Association of Governments (February 2012), “Toll Road Modeling Support: Final
Report” for a useful summary of many state and federal transportation agencies’ modeling efforts.
Common methodologies include stated preference surveys, revealed preference analysis using
observed mode choice data, and speed choice models.
48 See U.S. Department of Transportation (September 28, 2011), “Revised Departmental Guidance on
Valuation of Travel Time in Economic Analysis.”
49 Id. at p. 13.
Case 2:13-cv-00193 Document 614-1 Filed in TXSD on 09/21/14 Page 27 of 72Case 2:13-cv-00193 Document 671-19 Filed in TXSD on 11/11/14 Page 99 of 207
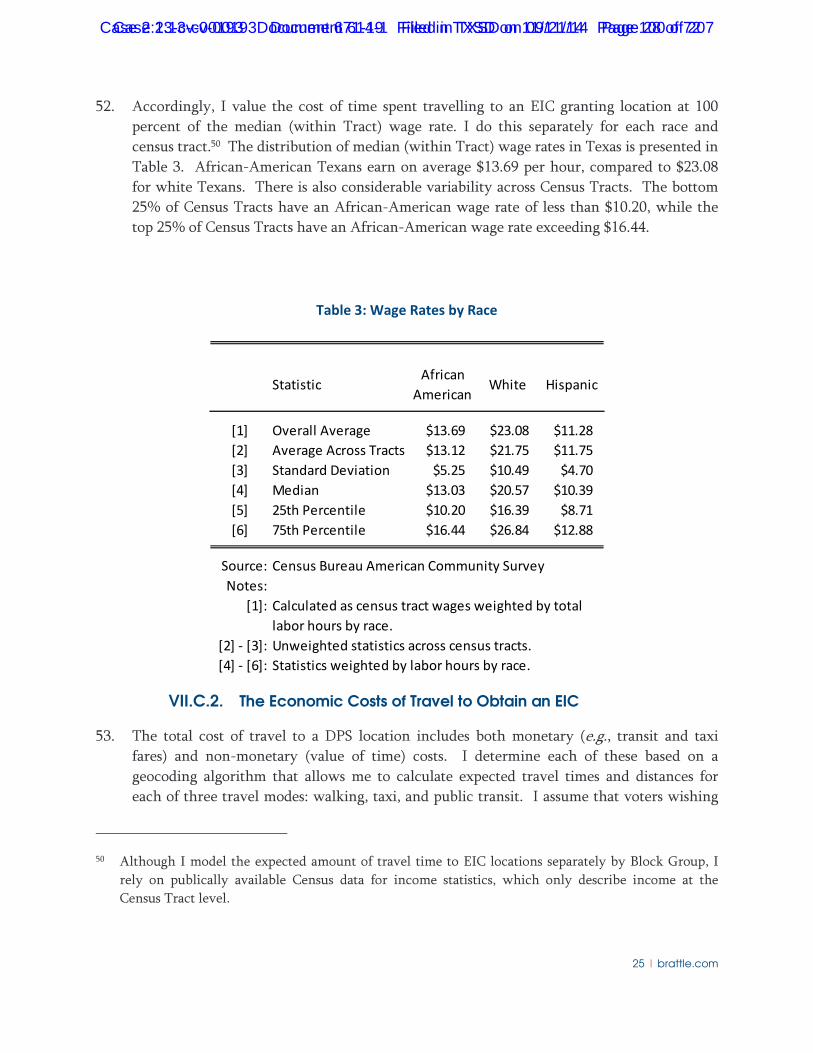
25 | brattle.com
52. Accordingly, I value the cost of time spent travelling to an EIC granting location at 100 percent of the median (within Tract) wage rate. I do this separately for each race and
census tract.50 The distribution of median (within Tract) wage rates in Texas is presented in
Table 3. African-American Texans earn on average $13.69 per hour, compared to $23.08
for white Texans. There is also considerable variability across Census Tracts. The bottom
25% of Census Tracts have an African-American wage rate of less than $10.20, while the
top 25% of Census Tracts have an African-American wage rate exceeding $16.44.
Table 3: Wage Rates by Race
VII.C.2. The Economic Costs of Travel to Obtain an EIC
53. The total cost of travel to a DPS location includes both monetary (e.g., transit and taxi fares) and non-monetary (value of time) costs. I determine each of these based on a
geocoding algorithm that allows me to calculate expected travel times and distances for
each of three travel modes: walking, taxi, and public transit. I assume that voters wishing
50 Although I model the expected amount of travel time to EIC locations separately by Block Group, I
rely on publically available Census data for income statistics, which only describe income at the
Census Tract level.
StatisticAfrican
AmericanWhite Hispanic
[1] Overall Average $13.69 $23.08 $11.28
[2] Average Across Tracts $13.12 $21.75 $11.75
[3] Standard Deviation $5.25 $10.49 $4.70
[4] Median $13.03 $20.57 $10.39
[5] 25th Percentile $10.20 $16.39 $8.71
[6] 75th Percentile $16.44 $26.84 $12.88
Source: Census Bureau American Community Survey
Notes:
[1]: Calculated as census tract wages weighted by total
labor hours by race.
[2] - [3]: Unweighted statistics across census tracts.
[4] - [6]: Statistics weighted by labor hours by race.
Case 2:13-cv-00193 Document 614-1 Filed in TXSD on 09/21/14 Page 28 of 72Case 2:13-cv-00193 Document 671-19 Filed in TXSD on 11/11/14 Page 100 of 207

26 | brattle.com
to obtain an EIC will select the DPS location and travel mode that minimize the total cost
of travel. Appendix C includes specific details on the algorithm.
54. Table 4 provides an illustrative example of the registered voter’s decision process for two different voters living in the same location choosing a DPS location and travel mode to
obtain an EIC. Each hypothetical voter is presented with three potential DPS locations to
visit via any of the three travel mode options. For example, for Voter 1 to travel to DPS
Location 1, she could take a taxi, with a total travel time of 10 minutes and an expected fare
of $14.50.51 If she were to walk instead, she would bear no direct monetary costs, but the
walk would take 150 minutes. Finally, if instead she were to use public transit, the total
trip time in this illustrative example would be 42 minutes and she would pay a fare of
$4.10. Voter 1’s wage rate is equal to the median wage rate for African-American Texans of
$13.03/hour,52 from which I can calculate the value of time across each option. In this
instance, Voter 1 would choose to take public transit to DPS Location 1, at a total one-way
travel cost of $13.22, composed of $4.10 in fare charges and $9.12 in travel time costs.
55. Voter 2 in the illustrative example would make a different decision. Her wage rate is equal to the median wage rate for white Texans of $20.57. As a consequence, two options with
the same travel times and fare expenses can lead Voter 2 to choose a different DPS location.
In this example, the lowest travel cost for Voter 2 is to take a taxi to DPS location 2, which
costs her $3.09 in travel time costs and $13.25 in fare charges, for a total trip cost of $16.34.
If she had chosen the same options as Voter 1, she would bear $14.40 in travel time costs
and $4.10 in transit charges, for a total travel cost of $18.50. Importantly, the main impact
of Voter 2’s higher wage and subsequent value of time is to lead her to make a different
travel choice than Voter 1 when faced with the same expected travel times and fare
charges.
51 For this analysis, I assume that the total taxi fare is the sum of a $2.50 base fare and an additional $2.00
per mile for distance traveled. These numbers were determined by taking the average of the taxi rates
reported by the cities of Houston and Fort Worth. See
http://www.houstontx.gov/ara/regaffairs/taxicabs_rates.html and
http://fortworthtexas.gov/uploadedFiles/Municipal_Court/About_Us/Administration/Taxicab%20Rate
s%20and%20Approximate%20Fares.pdf, last visited June 22, 2014.
52 In the actual travel cost analysis, the wage rate for each Block Group is specific to the Census Tract
within which the Block Group is located. See Table 3.
Case 2:13-cv-00193 Document 614-1 Filed in TXSD on 09/21/14 Page 29 of 72Case 2:13-cv-00193 Document 671-19 Filed in TXSD on 11/11/14 Page 101 of 207
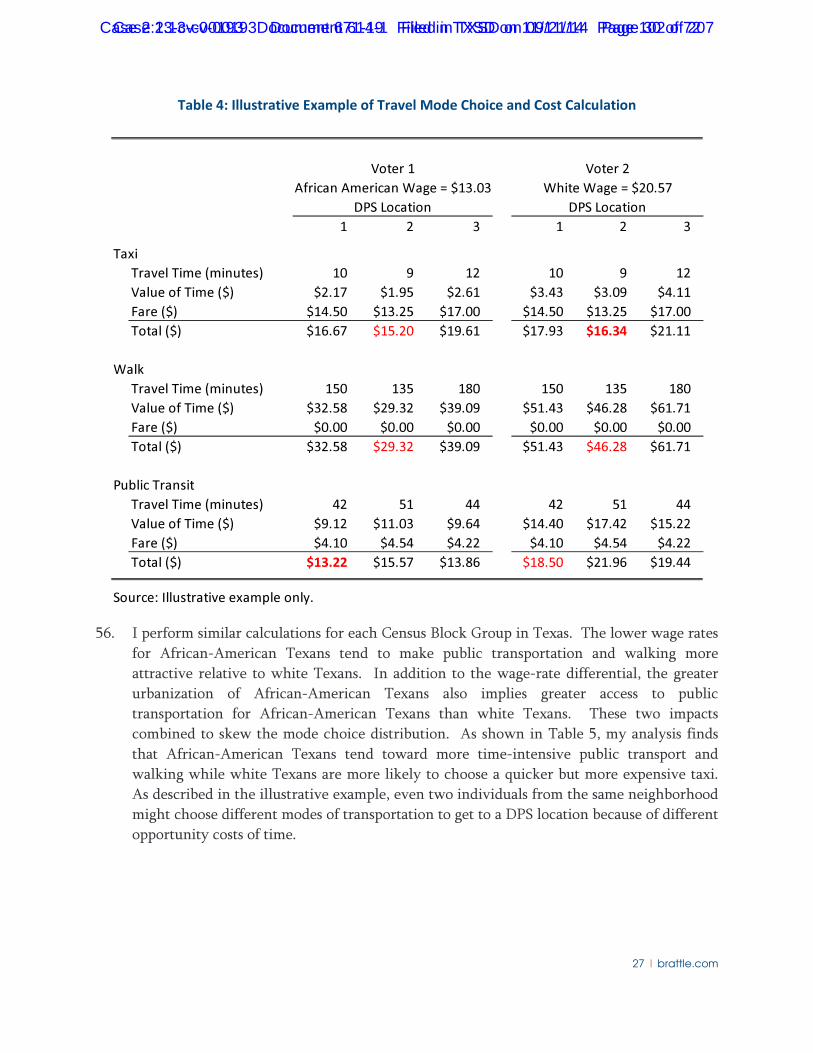
27 | brattle.com
Table 4: Illustrative Example of Travel Mode Choice and Cost Calculation
56. I perform similar calculations for each Census Block Group in Texas. The lower wage rates for African-American Texans tend to make public transportation and walking more
attractive relative to white Texans. In addition to the wage-rate differential, the greater
urbanization of African-American Texans also implies greater access to public
transportation for African-American Texans than white Texans. These two impacts
combined to skew the mode choice distribution. As shown in Table 5, my analysis finds
that African-American Texans tend toward more time-intensive public transport and
walking while white Texans are more likely to choose a quicker but more expensive taxi.
As described in the illustrative example, even two individuals from the same neighborhood
might choose different modes of transportation to get to a DPS location because of different
opportunity costs of time.
Voter 1 Voter 2
African American Wage = $13.03 White Wage = $20.57
DPS Location DPS Location
1 2 3 1 2 3
Taxi
Travel Time (minutes) 10 9 12 10 9 12
Value of Time ($) $2.17 $1.95 $2.61 $3.43 $3.09 $4.11
Fare ($) $14.50 $13.25 $17.00 $14.50 $13.25 $17.00
Total ($) $16.67 $15.20 $19.61 $17.93 $16.34 $21.11
Walk
Travel Time (minutes) 150 135 180 150 135 180
Value of Time ($) $32.58 $29.32 $39.09 $51.43 $46.28 $61.71
Fare ($) $0.00 $0.00 $0.00 $0.00 $0.00 $0.00
Total ($) $32.58 $29.32 $39.09 $51.43 $46.28 $61.71
Public Transit
Travel Time (minutes) 42 51 44 42 51 44
Value of Time ($) $9.12 $11.03 $9.64 $14.40 $17.42 $15.22
Fare ($) $4.10 $4.54 $4.22 $4.10 $4.54 $4.22
Total ($) $13.22 $15.57 $13.86 $18.50 $21.96 $19.44
Source: Illustrative example only.
Case 2:13-cv-00193 Document 614-1 Filed in TXSD on 09/21/14 Page 30 of 72Case 2:13-cv-00193 Document 671-19 Filed in TXSD on 11/11/14 Page 102 of 207

28 | brattle.com
Table 5: Frequency of Travel Mode Choice to DPS Locations by Race
57. Table 6 provides a summary of the expected travel costs associated with these travel mode choices across different segments of the Texas population. Across all Affected Registered
Voters in Texas, the expected travel costs to obtain an EIC are $36.33. Among Affected
Registered Voters, African Americans have an expected average travel cost to a DPS
location of $26.68, composed of an expected average travel time of 85 minutes and $11.80
in expected average fare charges. Among white Affected Registered Voters, the expected
average travel cost to a DPS location is $48.18, composed of an expected average travel time
of 38 minutes and $35.59 in expected average fare charges. These numbers reflect the
different options available and constraints imposed across racial groups in Texas.
ModeAfrican
American White
All Registerd
Voters
[A] [B] [C]
Driving [1] 44% 79% 62%
Transit [2] 41% 14% 26%
Walking [3] 15% 7% 12%
Notes and Sources:
Results from The Brattle Group Google API Analysis.
[1]: Frequency of driving mode by race.
[2]: Frequency of transit mode by race.
[3]: Frequency of walking mode by race.
Case 2:13-cv-00193 Document 614-1 Filed in TXSD on 09/21/14 Page 31 of 72Case 2:13-cv-00193 Document 671-19 Filed in TXSD on 11/11/14 Page 103 of 207

29 | brattle.com
Table 6: Summary of Travel Costs by Race
58. Given that the prevalence of African-American Texans needing to acquire an EIC to retain the right to vote is about twice as high as for white Texans, the expected travel costs for a
random Affected Registered Voter, conditioned on race, are not so different and are
probably higher for African-American Texans. Nevertheless, because these cost differences
are largely driven by differences in earnings, they are not directly comparable for purposes
of evaluating burden. See Section VIII.
VII.D. TOTAL COSTS TO OBTAIN AN EIC BY RACE
59. The total cost to acquire an EIC will depend on many factors, specific to each voter. Some voters will live near a DPS and have a copy of their birth certificate, while others will live
far away, will need to acquire a birth certificate, and possibly will incur other costs as well.
Such costs could include:
• Travel costs. I found that the average cost for an Affected Registered Voter to travel
to a DPS was $36.33. This cost varies by the voter’s location. It also varies, on
Breakdown of Travel
Costs
African-
American
Affected
Voters
White Affected
Voters
All Registered
Voters
[A] [B] [C]
Travel Time (minutes) [1] 85 38 58
Value of Time ($) [2] $14.88 $12.59 $12.49
Fare ($) [3] $11.80 $35.59 $23.84
Total Cost ($) [4] $26.68 $48.18 $36.33
Notes and Sources:
Results from The Brattle Group Google API Analysis, TEAM Data, and
DOJ matching data.
[A] - [C]: Average values across all block groups in Texas by race.
ACS Survey 2010.
taxi and transit rates based.
[1]: Calculated travel times to mimimum-cost DPS location.
[2]: Calculated using wage rates by race by Census tract from the
[3]: Calculated using travel distance to minimum-cost DPS
[4]: Sum of [2] & [3].
Case 2:13-cv-00193 Document 614-1 Filed in TXSD on 09/21/14 Page 32 of 72Case 2:13-cv-00193 Document 671-19 Filed in TXSD on 11/11/14 Page 104 of 207
30 | brattle.com
average, by race, with African-American Affected Registered Voters experiencing
$26.68 in travel costs and white Affected Registered Voters experiencing $48.18 in
travel costs. Additional travel costs could be incurred for individuals who need to
acquire other documentation to support their EIC application.
• Documentation costs. Applying for an EIC requires additional documentation.
These documents usually require payment of fees. Additionally, the requirements
to obtain such documents may lead to additional costs.
• Time spent at DPS applying for EIC. Some Affected Registered Voters are likely to
experience long wait times at the DPS location, increasing the total time costs to
acquire an EIC.53
• Time lost at work. Some Affected Registered Voters are likely to have inflexible
work schedules and either suffer lost vacation time or forego lost wages for time
spent acquiring an EIC. I found that the average African-American Affected Voter
would spend 85 minutes in travel to and from a DPS location in order to obtain an
EIC. DPS wait times could increase the total time spent acquiring an EIC to 2 hours
or more. This would amount to at least $26 in lost wages for a typical working
African American in Texas.
• Child care costs. Some Affected Registered Voters may need to secure child care
services for at least a partial day in order to obtain an EIC. Such costs could range
from $11 up to $26.
60. While these costs are not necessarily additive for all Affected Registered Voters, the total cost to obtaining an EIC for an Affected Registered Voter will likely include some
combination of each of these costs and accumulate to potentially several multiples of the
total travel costs calculated here. So, for example, an African-American Affected
53 These wait times could range from 15-45 minutes, to as much as several hours.
See
http://www.nbcdfw.com/investigations/DPS-Wait-Times-Shorter-at-New-Mega-Center-License-
Offices-200942911.html. Last visited June 26, 2014.
See also
http://www.khou.com/news/local/DPS-wait-times-are-longer-than-ever-161146955.html. Last visited
June 26, 2014.
Case 2:13-cv-00193 Document 614-1 Filed in TXSD on 09/21/14 Page 33 of 72Case 2:13-cv-00193 Document 671-19 Filed in TXSD on 11/11/14 Page 105 of 207

31 | brattle.com
Registered Voter that needs a birth certificate and child care could incur the following
costs:
• travel costs -$26.68,
• one hour spent at DPS - $13.03,
• one hour spent acquiring birth certificate - $13.03,
• birth certificate fees - $22, 54 and
• partial day of child care services - $11.
This hypothetical voter would incur total costs of $85.74, approximately three times the
travel costs alone.
VIII. Obtaining the Required IDs is More Burdensome for African
Americans
61. As demonstrated in the previous sections, African Americans are more likely to need to acquire an ID to vote and acquiring an ID for the purpose of voting comes with a cost. As
noted above, whatever its level, a cost is more burdensome the lower is the socioeconomic
standing of an individual.
62. As I show below, African Americans in Texas tend to be poorer than whites in Texas, making the burden of acquiring an ID to vote higher for African-American voters than for
white voters. Stated slightly differently, if all that is known about a potential Texas voter is
that she is African-American, the data analyzed in this report show that the burden of
acquiring an ID to vote is expected to be higher for her than if she were a white Texan.
VIII.A. AFRICAN AMERICANS IN TEXAS HAVE LOWER INCOMES THAN WHITE TEXANS
63. It is well established that African Americans generally have substantially lower income55
and wealth56 than white Americans. I have examined income and wealth distributions in
54 I assume that this voter would be mailing in his application for a copy of his birth certificate.
55 In a study titled on income and poverty, the U.S. Census reported that “Comparing the 2012 income of
non-Hispanic White households to that of other households shows that […] the ratio of Black to non-
Hispanic white income was .58.” See Carmen DeNavas-Walt, Bernadette D. Proctor, Jessica C. Smith
Continued on next page
Case 2:13-cv-00193 Document 614-1 Filed in TXSD on 09/21/14 Page 34 of 72Case 2:13-cv-00193 Document 671-19 Filed in TXSD on 11/11/14 Page 106 of 207

32 | brattle.com
Texas and find this generally to be true in this state as well, both state-wide and across
households in Texas. As shown in Table 3 above, African Americans in Texas on average
have significantly lower wages (59% lower) than white Texans.
64. As shown in Table 7, in 2010, white Texas residents had an annual median income of $52,392, approximately 68% greater than the median income of $31,104 for African-
American residents of Texas and approximately 36% greater than the median income of
other minority residents. Additionally, approximately 69% of Texas’s African-American
population had an income less than the median income of white residents, while
approximately 66% of Texas’s other minority population had an income less than the
median income of white residents. If the income distribution were random across racial
groups, only 50% of residents would be expected to have an income less than the white
group’s median income.
Continued from previous page
(September 2013) “Income, Poverty, and Health Insurance Coverage in the United States: 2012” (p. 8),
available at:
https://www.census.gov/prod/2013pubs/p60-245.pdf .
56 The U.S. census reports that 2010 median wealth for white (non-Hispanic) households was $110,729.
For African-American households the median net worth was $4,955, or about 22 times less than the
net worth of white households. See U.S. Census “Net Worth and Asset Ownership of Households:
2010,” available at:
http://www.census.gov/people/wealth/files/Wealth_Tables_2010.xls.
Case 2:13-cv-00193 Document 614-1 Filed in TXSD on 09/21/14 Page 35 of 72Case 2:13-cv-00193 Document 671-19 Filed in TXSD on 11/11/14 Page 107 of 207

33 | brattle.com
Table 7: Texas Household Income by Race
VIII.B. AFRICAN AMERICANS IN TEXAS HAVE LESS WEALTH THAN WHITE TEXANS
65. The distribution of wealth across racial groups in Texas is more uneven than income. Table 8 presents the breakdown of wealth by racial group. The wealth measurement is the sum
of equity in homes, vehicles, businesses, interest-earning assets at banks and other
institutions, stocks and mutual fund shares, non-home real estate, other assets, 401K, IRA,
Keogh and thrift savings accounts.57 The median household wealth of the white population
in Texas is $97,800, more than 7 times larger than the median household wealth of $11,961
for the African-American population, and almost twice as large as the median household
wealth of other minority populations.
57 See Peter McHenry, “Does Low Wealth Constrain Long-Distance Migration?”, College of William and
Mary, August 2013, p. 14, available at:
http://wmpeople.wm.edu/asset/index/pmchenry/paperwealthandmigration.
State of Texas 2010African
AmericanWhite Other
[A] [B] [C]
Median Household Income [1] 31,104$ 52,392$ 38,412$
% Difference with White [2] 68.4% 36.4%
Total Number of Households [3] 263 1,087 855
Households below White Median [4] 181 560
Households below White Median (%) [5] 68.8% 65.5%
Notes and Sources:
[1], [3] & [4]: Data from the Survey of Income and Program Participation, 2008 Panel, Wave 7.
[A][2]: [B][1] / [A][1] - 1.
[C][2]: [B][1] / [C][1] - 1.
[A][5]: [A][4] / [A][3].
[C][5]: [C][4] / [C][3].
Case 2:13-cv-00193 Document 614-1 Filed in TXSD on 09/21/14 Page 36 of 72Case 2:13-cv-00193 Document 671-19 Filed in TXSD on 11/11/14 Page 108 of 207

34 | brattle.com
Table 8: Texas Household Wealth by Race
66. The disparity in wealth appears to be at all income levels. Nationally, white Americans increase their wealth more quickly than African Americans do as their income rises. One
study found that over a 25 year period, every dollar increase in income raised white family
wealth by $5.19, whereas over the same period a dollar increase in income raised African-
American family wealth by $0.69.58
VIII.C. AFRICAN AMERICANS IN TEXAS ARE MORE LIKELY TO BE POOR THAN WHITE
TEXANS
67. As shown in Table 9, one-quarter of all African Americans in Texas live below the poverty line. This is a rate that is two-and-a-half times as high as the poverty rate for white Texans,
but similar to other minority Texans.
58 Thomas Shapiro, Tatjana Meschede and Sam Osoro, “The Roots of the Widening Racial Wealth Gap:
Explaining the Black-White Economic Divide” (February 2013), Figure 3, available at:
http://iasp.brandeis.edu/pdfs/Author/shapiro-thomas-m/racialwealthgapbrief.pdf.
State of Texas 2010African
AmericanWhite Other
[A] [B] [C]
Median Household Wealth [1] 11,961$ 97,800$ 34,490$
% Difference with White [2] 717.7% 183.6%
Total Number of Households [3] 263 1,087 855
Households below White Median [4] 217 634
Households below White Median (%) [5] 82.5% 74.2%
Notes and Sources:
[1], [3] & [4]: Data from the Survey of Income and Program Participation, 2008 Panel, Wave 7.
[A][2]: [B][1] / [A][1] - 1.
[C][2]: [B][1] / [C][1] - 1.
[A][5]: [A][4] / [A][3].
[C][5]: [C][4] / [C][3].
Case 2:13-cv-00193 Document 614-1 Filed in TXSD on 09/21/14 Page 37 of 72Case 2:13-cv-00193 Document 671-19 Filed in TXSD on 11/11/14 Page 109 of 207

35 | brattle.com
Table 9: Texas Poverty Status by Race
VIII.D. AFRICAN AMERICANS IN TEXAS SCORE LOWER ON OTHER MEASURES OF
SOCIOECONOMIC STATUS THAN WHITE TEXANS
68. The disparity seen in wage rates is consistent with disparities in unemployment rates. As shown in Table 10, African-American unemployment in Texas is more than twice the rate
of white unemployment in Texas.
Table 10: Texas Employment Status by Race
69. This disparity in income and wealth is also consistent with disparities observed in other measures of social and economic well-being. For example, income and wealth is known to
% Difference
Between
White and
African
American
At or Above the Poverty Line 2,046,954 77% 10,061,576 91% 7,627,095 76% 15%
Below the Poverty Line 627,862 23% 956,513 9% 2,387,679 24% -15%0%
Note: "African American" and "White" race categories do not include individuals that also identify as "Hispanic"
or "Latino."
Source: U.S. Census Bureau, 2006-2010 American Community Survey.
WhiteAfrican American Other
Employed 1,186,242 88% 5,627,211 95% 4,312,163 92%
Unemployed 158,430 12% 317,602 5% 361,199 8%
% Difference Between White and African American Unemployment -6%
Note: "African American" and "White" race categories do not include individuals that also
identify as "Hispanic" or "Latino."
Source: U.S. Census Bureau, 2006-2010 American Community Survey.
WhiteAfrican American Other
Case 2:13-cv-00193 Document 614-1 Filed in TXSD on 09/21/14 Page 38 of 72Case 2:13-cv-00193 Document 671-19 Filed in TXSD on 11/11/14 Page 110 of 207

36 | brattle.com
be strongly correlated to education59 and, as seen in Table 11, the educational achievement
gap between African-Americans and whites is significant.
Table 11: Texas Education Attainment by Race
VIII.E. SB 14 CREATES A HIGHER EXPECTED BURDEN FOR AFFECTED REGISTERED
VOTERS WHO ARE AFRICAN AMERICAN THAN FOR THOSE WHO ARE WHITE
70. Of the Affected Registered Voters in Texas, those who are African American are expected to experience a higher burden of acquiring an EIC to vote than the Affected Registered
Voters who are white. The higher expected burden comes from the non-trivial costs of
acquiring an EIC and the greater impact any cost has on lower income voters, as African-
American Texans are more likely to be. The cost of acquiring an EIC, whether $25, $50, or
$100, will have a much bigger impact on individuals who, on average, earn $31,104 and
have household wealth of $11,961 than on individuals who, on average, earn $52,392 and
have household wealth of $97,800.
71. To put my findings in perspective, the travel costs for an African-American Affected Registered Voter of $26.68 represents approximately 26% of a day’s earnings, but the
typical African-American Texan only has 115 days of earnings stored as wealth. In
comparison, the travel costs for an white Affected Registered Voter of $48.18 represents
59 See, for example, Steven Strauss, “The Connection Between Education, Income Inequality, and
Unemployment,” available at:
http://www.huffingtonpost.com/steven-strauss/the-connection-between-ed_b_1066401.html.
African American 260,738 16% 977,674 58%
White 688,064 9% 4,011,559 51%
Other 2,072,196 38% 2,257,395 41%
-7% -8%
Source: U.S. Census Bureau, 2006-2010 American Community Survey.
Less than
High School Diploma
Less than
Undergraduate Degree
% Difference Between White and African
American Educational Attainment
Note: "African American" and "White" race categories do not include individuals that also
identify as "Hispanic" or "Latino."
Case 2:13-cv-00193 Document 614-1 Filed in TXSD on 09/21/14 Page 39 of 72Case 2:13-cv-00193 Document 671-19 Filed in TXSD on 11/11/14 Page 111 of 207

37 | brattle.com
approximately 29% of a day’s earnings, but the typical white Texan has 594 days of
earnings stored as wealth. For only the travel-cost portion of the burden created by SB 14,
an African-American Affected Registered Voter is required to expend a share of their
wealth that is more than four times higher than the share required for a white Texan.
72. When combined with the prevalence analysis above of who is more likely to need to
acquire an EIC to retain their right to vote, the burden imposed on African Americans in
Texas to acquire an EIC will tend to be much greater than the burden imposed on white
Texans to acquire an EIC.
IX. Registered African-American Student Voters in Texas
73. I identified nine Historically Black Colleges and Universities (HBCUs) in Texas.60 As
expected, the Census Block Groups that these HBCUs reside in have high numbers of
African-American residents—60% in the HBCU Census Block Groups versus 12% overall
in Texas. Voter registration, however, was significantly higher on HBCU Census Block
Groups than average voter registration rates per Census Block Groups in these areas. The
nine Census Block Groups with HBCUs had an average of 86% voter registration compared
with the 54% state-wide average. These same Block Groups also have a higher percentage
of Affected Registered Voters, 14% versus 4% state-wide. Student IDs—even those from
public institutions—are not an allowable form of photo ID under SB 14. The data thus
suggests that the student population at HBCUs is disproportionately affected by SB 14 as
compared to the registered voter population state-wide.
Respectfully submitted,
Date: September 21, 2014
Coleman Bazelon, Ph.D.
60 The nine HBCUs are Huston-Tillotson University; Paul Quinn College; Southwestern Christian
College; Texas College; Wiley College; Jarvis Christian College; Prairie View A&M University; St.
Philips College; and Texas Southern University.
Case 2:13-cv-00193 Document 614-1 Filed in TXSD on 09/21/14 Page 40 of 72Case 2:13-cv-00193 Document 671-19 Filed in TXSD on 11/11/14 Page 112 of 207

38 | brattle.com
Appendix A – Curriculum Vitae of Coleman Bazelon
Case 2:13-cv-00193 Document 614-1 Filed in TXSD on 09/21/14 Page 41 of 72Case 2:13-cv-00193 Document 671-19 Filed in TXSD on 11/11/14 Page 113 of 207

Coleman Bazelon Principal
Washington, D.C. +1.202.955.5050 [email protected]
1
Dr. Coleman Bazelon is a principal in the Washington, DC office of The Brattle Group. He is an expert in regulation and strategy in the wireless, wireline, and video sectors. He has consulted and testified on behalf of clients in numerous telecommunications matters, ranging from wireless license auctions, spectrum management, and competition policy, to patent infringement, business valuation, and broadband deployment.
Dr. Bazelon frequently advises regulatory and legislative bodies, including the U.S. Federal Communications Commission and the U.S. Congress. He also has expertise in the federal government’s use of discount rates for policy and regulatory analysis, intellectual property valuation, economic impact analysis, and antitrust and damages analysis.
Throughout his career, Dr. Bazelon has had extensive experience with spectrum license auctions. He advises on and evaluates numerous auction designs and regularly serves as an auction advisor for bidders in spectrum license auctions.
Prior to joining Brattle, Dr. Bazelon was a vice president with Analysis Group, an economic and strategy consulting firm. During that time, he expanded the firm’s telecommunications practice area. He also served as a principal analyst in the Microeconomic and Financial Studies Division of the Congressional Budget Office where he researched reforms of radio spectrum management; estimated the budgetary and private sector impacts of spectrum-related legislative proposals; and advised on auction design and privatization issues for all research at the CBO.
SELECTED CONSULTING PROJECTS Litigation
• Evaluated damages in the applications market. • Assessed allocation theories in an international bankruptcy. • Evaluated damages from a programming contract termination. • Evaluated damages from allegations of reputational harm. • Evaluated damages from non-working wireless network equipment. • Assessed Domestic Industry requirement in ITC 337 case involving wireless equipment
patents. • Assessed commercial viability of full text searching of books business model. • Assessed Domestic Industry requirement in ITC 337 case involving portable storage
device patents. • Estimated value of satellite assets in bankruptcy. • Estimated damages from denial of pole attachments.
Case 2:13-cv-00193 Document 614-1 Filed in TXSD on 09/21/14 Page 42 of 72Case 2:13-cv-00193 Document 671-19 Filed in TXSD on 11/11/14 Page 114 of 207

Coleman Bazelon
2
• Provided written testimony evaluating the performance of a numbering resource administrator.
• Provided written testimony on the ability to estimate damages for a class of satellite phone users.
• Provided written testimony on the economic value of Rights-of-Ways in Massachusetts. • Estimated damages for a broadcast tower permit revocation. • Provided oral testimony on the proprietary nature of specific information contained in a
statewide public safety network bid. • Provided written testimony on economic value associated with items provided in a labor
neutrality agreement. • Estimated damages associated with USF and other telephone taxes paid by a calling card
reseller. • Assessed the damages associated with the infringement of patents related to VoIP
technology and the likely impact of a permanent injunction. • Estimated recoverable data costs for two pesticides. • Estimated cost of delay in granting local cable franchise. • Analyzed the economic underpinnings of an exclusivity clause of a mobile phone
affiliation agreement. • Assessed commonality issues of physicians for class certification of RICO action against a
set of health insurance companies. • Estimated “Loss of Use” damages for a severed fibre optic cable. • Provided written testimony estimating the value of a surety bond in a contract dispute
involving toll free phone numbers used in an enhanced service application. • Assessed damages associated with infringement of patents used to provide Voice over
Internet Protocol (VoIP). • Assessed basis for guidance of a large telecommunications firm in a 10-b securities
litigation. • Valued digital television radio spectrum in St. Louis in the pre-litigation phase of a breach
of contract dispute. • Estimated damages in a breach of contract case involving the sale of a fibre optic network. • Researched the basis for generally optimistic forecasts of broadband deployment in the
later 1990s and early 2000s in an anti-trust litigation. • Researched the basis for generally optimistic beliefs about the telecommunications sector
.in the late 1990s in a 10-b securities litigation. • Assessed the market for Competitive Local Exchange Carriers in an SEC fraud case. • Assessed a bankruptcy sale proposal for a national tier 1 broadband backbone provider. • Examined the business case asserted for a small wireless reseller in a breach of contract
litigation. • Assessed damages associated with infringement of patents used in DNA fingerprinting
applications. • Assessed changes in contributions to the Cable Royalty Fund on behalf of Sports
Claimants in a Copyright Arbitration Royalty Panel (CARP) proceeding.
Case 2:13-cv-00193 Document 614-1 Filed in TXSD on 09/21/14 Page 43 of 72Case 2:13-cv-00193 Document 671-19 Filed in TXSD on 11/11/14 Page 115 of 207

Coleman Bazelon
3
• Assessed the capital adequacy of the U.S. branch of a foreign bank.
Regulatory Proceedings • Provided testimony in prison phone rate proceeding. • Estimated economic impact of LNP on RLECs. • Assessed relevance of U.S. UNE-L experience for New Zealand benchmarking
proceeding. • Authored analysis of harm from revoking LightSquared’s ATC authorization. • Estimated value of pairing Upper 700 MHz A Block with public safety. • Estimated impact of increased regulatory uncertainty on spectrum value. • Estimated value of government provision of GPS service to private industry. • Coauthored analysis of feasibility of reallocating broadcast television through the use of
incentive auctions. • Analyzed impact on spectrum value of pairing AWS III spectrum. • Coauthored analysis of the merits of licensed versus unlicensed allocation of the TV
White Spaces. • Estimated the value of TV White Spaces. • Provided written testimony on the economic harm of using proprietary information in
retention marketing. • Provided written testimony on the economics of pole attachment rates. • Estimated the value of the PCS H-Block spectrum band. • Estimated the economic impact of ITC Exclusion Order on cell phone handsets. • Authored several reports on the 700 MHz auction rules. • Analyzed the relationship between the size of cable systems and the economics of the
programming market. • Presented analysis on pricing differentials in overlapping cable markets. • Assessed proposed regulation of mobile phone roaming rates. • Analyzed impact of local franchise requirements on competition in the video
marketplace. • Developed and assessed Indian spectrum management proposals. • Analyzed economic ramifications of à la carte cable channel pricing on consumers and
the cable and television programming industries. • Examined the relative merits of licensed versus unlicensed radio spectrum and the effects
of “underlay” licenses on existing commercial licensees. • Examined federalism issues related to mobile telephony regulation. • Examined and refuted arguments suggesting that the California Telecommunications
Consumer Bill of Rights was an appropriate response to market failures. • Assessed the impact on consumers of California’s Telecommunications Consumer Bill of
Rights proposal. • Provided written testimony refuting analysis purporting to show a positive relationship
between UNE-P and telecom network investment.
Case 2:13-cv-00193 Document 614-1 Filed in TXSD on 09/21/14 Page 44 of 72Case 2:13-cv-00193 Document 671-19 Filed in TXSD on 11/11/14 Page 116 of 207

Coleman Bazelon
4
• Provided written testimony examining the effects of unbundling regulations on capital spending in the telecommunications sector.
• Estimated the adjustment to the TELRIC pricing formula to account for irreversible investment in the local telephone network.
• Examined the impact of irreversible investments in the local telephone network on the TELRIC pricing methodology.
• Assessed the degree of market overlap of two food service firms for purposes of merger review.
• Provided written testimony that assessed the validity of an analysis of the costs of a DTV tuner mandate.
• Provided written testimony of a forecast of toll free number demand for the toll free number administrator, SMS/800, in a rate case proceeding.
Other • Advised bidder in Canadian 700 MHz auction. • Evaluated performance of TV stations when repacked in an Incentive Auction. • Analyzed differences in U.S. and European wireless markets. • Assessed business case and value of HF license holder. • Analyzed likely auction outcomes for TV broadcaster participating in incentive auction. • Assessed value of commercial mobile spectrum bands. • Analyzed economic impacts of the commercial casino industry. • Evaluated impact of digitization on copyright industries. • Analyzed economic and employment effects of Dutch gas hub. • Advised bidder in Indian 3G spectrum license auction. • Estimated economic and employment effects of network neutrality regulation. • Analyzed relative costs of wireless and wireline deployments in rural areas. • Analyzed potential harms from Internet gambling. • Estimated economic value of reallocating TV spectrum for wireless broadband. • Estimated economic and employment effects of electric power transmission construction
in support of new wind generation facilities. • Estimated economic and employment effects of broadband stimulus grant applications. • Estimated employment effects of an ATC-mobile satellite network deployment. • Analyzed the impact of reducing international mobile phone roaming charges. • Developed an auction platform for an electricity procurement auction. • Analyzed the economic impacts of reduced mobile phone taxes in Africa and the Middle
East. • Evaluated the impact of reducing ethanol requirements on gasoline prices. • Analyzed FRAND licensing requirements for intellectual property in the DTV standard. • Advised bidder in Canadian AWS spectrum license auction. • Advised bidder in FCC 700 MHz spectrum license auction. • Evaluated a business plan for proposed dam removals. • Assessed a business plan involving the WiMAX market.
Case 2:13-cv-00193 Document 614-1 Filed in TXSD on 09/21/14 Page 45 of 72Case 2:13-cv-00193 Document 671-19 Filed in TXSD on 11/11/14 Page 117 of 207
Coleman Bazelon
5
• Estimated the value of a portfolio of spectrum licenses. • Assessed the budgetary impacts of legislation to license TV white spaces. • Analyzed the economics of the military’s build versus buy decision for broadband satellite
communications capacity. • Advised bidder in FCC AWS spectrum license auction. • Provided framework to estimate impact of the effect of designation of TV white spaces as
unlicensed on 700 MHz auction receipts. • Analyzed Universal Service Fund expenditures. • Analyzed cable franchising requirements. • Valued proposals to re-band the Upper 700 MHz Band of radio spectrum. • Analyzed proposed accelerated digital television transition impacts on society and the
federal budget. • Coauthored a report on the value of a portfolio of patents used to provide Voice over
Internet Protocol (VoIP). • Coauthored a report to the U.S. Chamber of Commerce on the economic effects of
telecommunications deregulation. • Assessed the business cases for IRU swaps of a large international fibre optic network
owner. • Examined the effects of unbundling regulations on broadband penetration
internationally.
Case 2:13-cv-00193 Document 614-1 Filed in TXSD on 09/21/14 Page 46 of 72Case 2:13-cv-00193 Document 671-19 Filed in TXSD on 11/11/14 Page 118 of 207

Coleman Bazelon
6
TESTIMONY AND DECLARATIONS
“Rebuttal Expert Report of Coleman Bazelon, Ph.D.,” In the Matter of the Companies’ Creditors Arrangement Act, R.S.C. 1985, c. C-36, As Amended, and in the Matter of a Plan of Compromise or Arrangement of Nortel Networks Corporation, Nortel Networks Limited, Nortel Networks Global Corporation, Nortel Networks International Corporation and Nortel Networks Technology Corporation United States Bankruptcy Court for the District of Delaware, Case No. 09-10138 (KG), February 28, 2014.
“Supplemental Expert Report of Coleman Bazelon, Ph.D.,” In the Matter of Sky Angel U.S., LLC, against Discovery Communications, LLC, Animal Planet, LLC, United States District Court for the District of Maryland, Case No. 8:13-cv-00031-DKC, January 31, 2014.
“Expert Report of Coleman Bazelon, Ph.D.,” In the Matter of the Companies’ Creditors Arrangement Act, R.S.C. 1985, c. C-36, As Amended, and in the Matter of a Plan of Compromise or Arrangement of Nortel Networks Corporation, Nortel Networks Limited, Nortel Networks Global Corporation, Nortel Networks International Corporation and Nortel Networks Technology Corporation United States Bankruptcy Court for the District of Delaware, Case No. 09-10138 (KG), January 24, 2014.
“Expert Report of Coleman Bazelon, Ph.D.,” In the Matter of Sky Angel U.S., LLC, against Discovery Communications, LLC, Animal Planet, LLC, United States District Court for the District of Maryland, Case No. 8:13-cv-00031-DKC, December 6, 2013.
“Expert Report of Coleman Bazelon, Ph.D. and Armando Levy, Ph.D,” In the Matter of LT Game International Ltd., against Shuffle Master, Inc., United States District Court for the District of Nevada, Case No. 2:12-cv-01216-JAD-GWF, October 4, 2013.
“Expert Report of Coleman Bazelon, Ph.D.,” In the Matter of Certain Electronic Devices, Including Wireless Communications Devices, Tablet Computers, Media Players, and Televisions, and Components Thereof, United States International Trade Commission, Investigation No. 337-TA-862 (Judge Shaw), July 5, 2013.
“Declaration of Coleman Bazelon” In the Matter of PTA-FLA, Inc, Daredevil, Inc., NTCH-WEST TENN., Inc., NTCH-WA, Inc., and Eric Steinmann against ZTE Corporation, and ZTE USA, Inc. Florida Arbitration, Case No.: 50-494-T-00665-11, February 26, 2013.
“Rebuttal Testimony of Coleman Bazelon,” In re: Petition for Suspension or Modification of Application of the Requirements of 47 U.S.C. § 251(b) and (c), pursuant to 47 U.S.C. § 251(f)(2) regarding Time Warner Cable Information Services (Maine) LLC’s Request, State of Maine Public Utilities Commission, Docket No. 2012-198, Docket No. 2012-218, Docket No. 2012-219, Docket No. 2012-220, Docket No. 2012-221, October 12, 2012.
Case 2:13-cv-00193 Document 614-1 Filed in TXSD on 09/21/14 Page 47 of 72Case 2:13-cv-00193 Document 671-19 Filed in TXSD on 11/11/14 Page 119 of 207
Coleman Bazelon
7
“Testimony of Coleman Bazelon, Ph.D.,” In re: Petition for Suspension or Modification of Application of the Requirements of 47 U.S.C. § 251(b) and (c), pursuant to 47 U.S.C. § 251(f)(2) regarding Time Warner Cable Information Services (Maine) LLC’s Request, State of Maine Public Utilities Commission, Docket No. 2012-198, Docket No. 2012-218, Docket No. 2012-219, Docket No. 2012-220, Docket No. 2012-221, August 20, 2012.
“Expert Report of Dr. Coleman Bazelon,” Salsgiver Communications, Inc., Salsgiver Telecom, Inc., and Salsgiver Inc. v. Consolidated Communications Holdings, Inc., North Pittsburgh Systems, Inc., and North Pittsburgh Telephone Company, Inc., Court of Common Pleas, Allegheny County, Pennsylvania, Civil Division, No. GD 08-7616, May 10, 2012.
“Oral Testimony of Coleman Bazelon, The Brattle Group, Inc. before the U.S. House of Representatives, Committee on Energy and Commerce Subcommittee on Communication and Technology,” April 12, 2011. (spectrum)
“Testimony of Coleman Bazelon, Principal, The Brattle Group, before the U.S. House of Representatives, Committee on Energy and Commerce, Subcommittee on Communications, Technology, and the Internet,” June 17, 2010 (spectrum valuation).
“Supplemental Expert Report of Coleman Bazelon,” Gemalto PTE LTD and Gemplus S.A. v. Telecommunications Industry Association, United States District Court for the Eastern District of Virginia, Alexandria Division, Case 1:08-cv-00776-LMB-TRJ, December 16, 2008.
“Expert Report of Coleman Bazelon,” Gemalto PTE LTD and Gemplus S.A. v. Telecommunications Industry Association, United States District Court for the Eastern District of Virginia, Alexandria Division, Case 1:08-cv-00776-LMB-TRJ, November 6, 2008.
“Prefiled Rebuttal Testimony of Coleman D. Bazelon,” In re: Complaint and Request for Emergency Relief Against Verizon Florida LLC for anticompetitive behavior in violation of Sections 364.01(4), 364.3381, and 364.10, F.S., and for failure to facilitate transfer of customers’ numbers to Bright House Networks Information Services (Florida) LLC, and its affiliate, Bright House Networks, LLC, Florida Public Service Commission, Docket No. 070691-TP, July 25, 2008.
“Prefiled Direct Testimony of Coleman D. Bazelon,” In re: Complaint and Request for Emergency Relief Against Verizon Florida LLC for anticompetitive behavior in violation of Sections 364.01(4), 364.3381, and 364.10, F.S., and for failure to facilitate transfer of customers’ numbers to Bright House Networks Information Services (Florida) LLC, and its affiliate, Bright House Networks, LLC, Florida Public Service Commission, Docket No. 070691-TP, May 30, 2008.
“Declaration of Coleman Bazelon in Support of Plaintiffs’ Motion for Class Certification,” Kenneth Stickrath, et al v. Globalstar, Inc., United States District Court for the Northern District of California, San Francisco Division, Case No. 07-CV-01941 TEH, April 25, 2008.
Case 2:13-cv-00193 Document 614-1 Filed in TXSD on 09/21/14 Page 48 of 72Case 2:13-cv-00193 Document 671-19 Filed in TXSD on 11/11/14 Page 120 of 207
Coleman Bazelon
8
“Testimony of Coleman Bazelon, Principal, The Brattle Group, before the U.S. House of Representatives, Committee on Energy and Commerce, Subcommittee on Telecommunications and the Internet,” April 15, 2008 (reviewing the 700 MHz auction).
“Concerning the Meaning of ‘Fair and Reasonable Compensation’ in Section 253(c) of the Telecommunications Act of 1996 and the Comparability of the Rights-of-Way Fees Paid by Level 3 in Massachusetts and Elsewhere,” The Massachusetts Turnpike Authority v. Level 3 Communications, LLC, et al., The United States District Court for the District of Massachusetts, Civ. Act. No. 06-11816, December 17, 2007.
“Concerning the Effects of the Fixed Rent Charged for Access to the Massachusetts Turnpike,” The Massachusetts Turnpike Authority v. Level 3 Communications, LLC, et al., The United States District Court for the District of Massachusetts, Civ. Act. No. 06-11816, November 12, 2007.
“Affidavit of Dr. Coleman Bazelon,” Gulfside Casino Partnership v. Mississippi Riverboat Council, et al., United States District Court for the Southern District of Mississippi, Southern Division, Cause No. 1:07-CV-110-LG-JMR, May 4, 2007.
“Rebuttal Report of Dr. Coleman Bazelon,” Level 3 Communications, LLC, v. City of St. Louis, Missouri, United States District Court for the Eastern District of Missouri, Eastern Division, Consolidated Case No. 4:04-CV-871 CAS, June 17, 2005.
“Affidavit of Dr. Coleman Bazelon,” Informed Communications Systems, Inc. v. Intelogistics Corp., d/b/a Prosodie Interactive, United States District Court, Southern District of Florida, Miami Division, Case No.: 04-61245 CIV Huck/Turnoff (October 12, 2004).
EXPERT DESIGNATIONS
• Touch America, Inc. v. Qwest Communications International, Inc.
o Designated as an expert in Arbitration (June 2003)
• Informed Communications Systems, Inc. v. Intelogistics Corp., d/b/a Prosodie Interactive, United States District Court, Southern District of Florida, Miami Division, Case No.: 04-61245 CIV Huck/Turnoff
o Filed affidavit (October 12, 2004)
• Level 3 Communications, LLC v. City of St. Louis, Missouri, United States District Court for the Eastern District of Missouri, Eastern Division, Consolidated Case No. 4:04-CV-871 CAS
o Filed Rebuttal Report (June 17, 2005)
o Deposition (July 14, 2005)
Case 2:13-cv-00193 Document 614-1 Filed in TXSD on 09/21/14 Page 49 of 72Case 2:13-cv-00193 Document 671-19 Filed in TXSD on 11/11/14 Page 121 of 207

Coleman Bazelon
9
• Cable Merger before the FTC
o Presented analysis to FTC staff (March 20, 2007)
• Gulfside Casino Partnership v. Mississippi Riverboat Council, et al., United States District Court for the Southern District of Mississippi, Southern Division, Cause No. 1:07-CV-110-LG-JMR
o Filed affidavit (May 4, 2007)
• Motorola, Inc. v. State of Mississippi Department of Information Technology Services and M/ACom, Inc., Chancery Court of Hinds County, Mississippi, Cause No. G2006-2179 S/2
o Testified (May 23, 2007)
• American Towers, Inc. v. Jackson & Campbell, P.C., et al., DC Superior Court, No. 003277-06
o Deposition (March 19, 2009)
o Filed Affidavit (May 22, 2009)
• The Massachusetts Turnpike Authority v. Level 3 Communications, LLC, et al., The United States District Court for the District of Massachusetts, Civ. Act. No. 06-11816
o Filed Expert Report (November 12, 2007)
o Filed Rebuttal Report (December 17, 2007)
o Deposition (January 21, 2008)
• Kenneth Stickrath, et al v. Globalstar, Inc., United States District Court for the Northern District of California, San Francisco Division, Case No. 07-CV-01941 THE
o Filed Declaration (April 25, 2008)
o Deposition (June 11, 2008)
• In re: Complaint and request for emergency relief against Verizon Florida LLC for anticompetitive behavior in violation of Sections 364.01(4), 364.3381, and 364.10, F.S., and for failure to facilitate transfer of customers’ numbers to Bright House Networks Information Services (Florida) LLC, and its affiliate, Bright House Networks, LLC, Florida Public Service Commission, Docket No. 070691-TP
o Filed Direct Testimony (May 30, 2008)
o Filed Rebuttal Testimony (July 25, 2008)
o Deposition (August 13, 2008)
• Gemalto PTE LTD and Gemplus S.A. v. Telecommunications Industry Association, United States District Court for the Eastern District of Virginia, Alexandria Division, Case 1:08-cv-00776- LMB-TRJ
o Filed Expert Report (November 6, 2008)
Case 2:13-cv-00193 Document 614-1 Filed in TXSD on 09/21/14 Page 50 of 72Case 2:13-cv-00193 Document 671-19 Filed in TXSD on 11/11/14 Page 122 of 207

Coleman Bazelon
10
o Deposition (December 2, 2008)
o Filed Supplemental Expert Report (December 16, 2008)
• Salsgiver Communications, Inc., Salsgiver Telecom, Inc., and Salsgiver Inc. v. Consolidated Communications Holdings, Inc., North Pittsburgh Systems, Inc., and North Pittsburgh Telephone Company, Inc., Court of Common Pleas, Allegheny County, Pennsylvania, Civil Division, No. GD 08-7616
o Filed Damages Analysis (February 27, 2009)
o Deposition (April 3, 2012)
o Filed Expert Report (May 10, 2012)
• Certain Products Containing Interactive Program Guide and Parental Control Technology United States International Trade Commission, Investigation No. 337-TA-820
o Designated as an expert (June 8, 2012)
• In re: Petition for Suspension or Modification of Application of the Requirements of 47 U.S.C. § 251(b) and (c), pursuant to 47 U.S.C. § 251(f)(2) regarding Time Warner Cable Information Services (Maine) LLC’s Request, State of Maine Public Utilities Commission, Docket No. 2012-198, Docket No. 2012-218, Docket No. 2012-219, Docket No. 2012-220, Docket No. 2012-221
o Filed Direct Testimony (August 20, 2012)
o Filed Rebuttal Testimony (October 12, 2012)
o Testified (October 23, 2012)
• In the matter of PTA-FLA, Inc , Daredevil, Inc., NTCH-WEST TENN., Inc., NTCH-WA, Inc., and Eric Steinmann against ZTE Corporation, and ZTE USA, Inc. Florida Arbitration, Case No.: 50-494-T-00665-11
o Filed Expert Report (February 26, 2013)
o Deposed (March 15, 2013)
o Testified (August 30, 2013)
• Certain Electronic Devices, Including Wireless Communications Devices, Tablet Computers, Media Players, and Televisions, and Components Thereof, United States International Trade Commission, Investigation No. 337-TA-862 (Judge Shaw)
o Filed Rebuttal Testimony (July 5, 2013)
• In the matter of LT Game International Ltd., against Shuffle Master, Inc., United States
District Court for the District of Nevada, Case No. 2:12-cv-01216-JAD-GWF
o Filed Expert Report (October 4, 2013)
Case 2:13-cv-00193 Document 614-1 Filed in TXSD on 09/21/14 Page 51 of 72Case 2:13-cv-00193 Document 671-19 Filed in TXSD on 11/11/14 Page 123 of 207

Coleman Bazelon
11
o Deposed (November 12, 2013)
• In the Matter of Sky Angel U.S., LLC, against Discovery Communications, LLC, Animal
Planet, LLC, United States District Court for the District of Maryland, Case No. 8:13-cv-
00031-DKC
o Filed Expert Report (December 6, 2013)
o Filed Supplemental Report (January 31, 2014)
o Deposed (February 14, 2014)
• In the Matter of the Companies’ Creditors Arrangement Act, R.S.C. 1985, c. C-36, As
Amended, and in the Matter of a Plan of Compromise or Arrangement of Nortel
Networks Corporation, Nortel Networks Limited, Nortel Networks Global Corporation,
Nortel Networks International Corporation and Nortel Networks Technology
Corporation United States Bankruptcy Court for the District of Delaware, Case No. 09-
10138 (KG)
o Filed Expert Report (January 24, 2014)
o Filed Rebuttal Expert Report (February 28, 2014)
o Deposed (April 3, 2014; May 30, 2014)
o Testified (June 2, 2014; June 5, 2014)
• State of Texas v. Eric H. Holder, Jr., in his Official Capacity as Attorney General of the United States, United States District Court for the District of Columbia, Case No. 1:12-CV-00128
• Certain Wireless Devices, Including Mobile Phones And Tablets II, United States International Trade Commission, Investigation No. 337-TA-905 (Judge Pender)
PUBLICATIONS
Articles and Book Chapters
Coleman Bazelon and Giulia McHenry, “Spectrum Value,” Telecommunications Policy, Forthcoming.
John Jarosz, Robin Heider, Coleman Bazelon, Christine Bieri and Peter Hess, “Patent Auctions: How Far Have We Come?” les Nouvelles, March 2010, pp. 11-30.
Case 2:13-cv-00193 Document 614-1 Filed in TXSD on 09/21/14 Page 52 of 72Case 2:13-cv-00193 Document 671-19 Filed in TXSD on 11/11/14 Page 124 of 207
Coleman Bazelon
12
“Too Many Goals: Problems with the 700 MHz Auction,” Information Economics and Policy, June 2009, pp. 115-127.
“Licensed or Unlicensed: The Economic Considerations in Incremental Spectrum Allocations,” IEEE Communications Magazine, March 2009, pp. 110-116.
Michael H. Rothkopf and Coleman Bazelon, “Interlicense Competition: Spectrum Deregulation Without Confiscation or Giveaways,” OBTAINING THE BEST FROM REGULATION AND COMPETITION, Michael A. Crew and Menahem Spiegel, eds., Kluwer Academic Publishers (2005), pp. 135-159.
“Next Generation Frequency Coordinator,” Telecommunications Policy 27 (2003), pp. 517-525.
Coleman Bazelon and Kent Smetters, “Discounting in the Long Term,” Loyola of Los Angeles Law Review, Vol. 35, Issue 1, November 2002.
Coleman Bazelon and Kent Smetters, “Discounting Inside the Washington DC Beltway,” Journal of Economic Perspectives, Fall 1999.
“The Movement of Markets,” Wesleyan Economic Journal, Spring 1986.
“Is the Psychogenic Theory of History Scientific?” Journal of Psychohistory, Fall 1985.
White Papers, Reports, Studies, and Reviews
Kevin Hearle, Giulia McHenry, James Reitzes, Jeremy Verlinda and Coleman Bazelon, “Canadian Wireless Market Performance and the Potential Effect of an Additional Nationwide Carrier,” Prepared for the Canadian Competition Bureau, May 12, 2014.
Coleman Bazelon and Giulia McHenry, “Spectrum Sharing: Taxonomy and Economics,” Office of Science and Technology Policy, filed comment March 18, 2014.
Coleman Bazelon and Giulia McHenry, “Spectrum Sharing: Taxonomy and Economics,” sponsored by Verizon, February 6, 2014.
Coleman Bazelon and Giulia McHenry, “The Economics of Spectrum Sharing,” Telecommunications Policy Research Conference, 2013.
Coleman Bazelon and Giulia McHenry, “Violating Your Privacy: An Economic Perspective,” Telecommunications Policy Research Conference, September 24, 2013.
Coleman Bazelon and Giulia McHenry, “The Economics of Spectrum Sharing,” Global Media and Communications Quarterly, Autumn 2013, pp. 47-51.
Robert Shapiro, Douglas Holtz-Eakin and Coleman Bazelon, “The Economic Implications of Restricting Spectrum Purchases in the Incentive Auctions,” Georgetown University Center for Business & Public Policy, April 2013.
Case 2:13-cv-00193 Document 614-1 Filed in TXSD on 09/21/14 Page 53 of 72Case 2:13-cv-00193 Document 671-19 Filed in TXSD on 11/11/14 Page 125 of 207
Coleman Bazelon
13
Lisa Cameron and Coleman Bazelon, “The Impact of Digitization on Business Models in Copyright-Driven Industries: A Review of the Economic Issues,” National Research Council (NRC) Committee on the Impact of Copyright Policy on Innovation in the Digital Era, February 26, 2013.
Robert A. Rogowsky, Pallavi Seth, and Coleman D. Bazelon, "An Economic View of ITC 337 Cases and the Public Interest," Law360, November 21, 2012.
Coleman Bazelon and Giulia McHenry, “Spectrum Value,” Telecommunications Policy Research Conference, 2012.
Robert A. Rogowsky, Pallavi Seth, and Coleman D. Bazelon, "An Economic View Of The ITC's Domestic Industry," Law360, June 18, 2012.
Coleman Bazelon and Greg Duncan, “The Status of UNE-L in the United States,” Prepared for the Commerce Commission of New Zealand, April 12, 2012.
“Implications of Regulatory Inefficiency for Innovative Wireless Investments,” Sponsored by LightSquared, March 15, 2012.
Coleman Bazelon, Kevin Neels and Pallavi Seth, “Beyond the Casino Floor: Economic Impacts of the Commercial Casino Industry,” sponsored by the American Gaming Association, 2012.
Coleman Bazelon, Charles Jackson and Giulia McHenry, “An Engineering and Economic Analysis of the Prospects of Reallocating Radio Spectrum from the Broadcast Band through the Use of Voluntary Incentive Auctions,” Telecommunications Policy Research Conference, 2011.
“Cost of Regulatory Risk for Wireless Spectrum Values,” sponsored by LightSquared, August 23, 2011.
“Expected Receipts from Proposed Spectrum Auctions,” sponsored by the Wireless Broadband Coalition, July 28, 2011.
“GPS Interference: Implicit Subsidy to the GPS Industry and Cost to LightSquared of Accommodation,” sponsored by LightSquared, June 22, 2011.
Lisa Cameron and Coleman Bazelon, “The Impact of Digitization on Business Models in Copyright-Driven Industries: A Review of the Economic Issues,” National Research Council (NRC) Committee on the Impact of Copyright Policy on Innovation in the Digital Era, June 7, 2011.
“The Economic Basis of Spectrum Value: Pairing AWS-3 with the 1755 MHz Band is More Valuable than Pairing it with Frequencies from the 1690 MHz Band,” sponsored by T-Mobile and CTIA, April 11, 2011.
“Economists Letter to Obama Regarding Incentive Auctions,” April 6, 2011.
“The Indian 3G and BWA Auctions,” Telecommunications Policy Research Conference, 2010.
Case 2:13-cv-00193 Document 614-1 Filed in TXSD on 09/21/14 Page 54 of 72Case 2:13-cv-00193 Document 671-19 Filed in TXSD on 11/11/14 Page 126 of 207

Coleman Bazelon
14
“Economic Impact of the Dutch Gas Hub Strategy on the Netherlands,” by Dan Harris, Coleman D. Bazelon, Brad Humphreys, and Penelope Dickson, Netherlands Ministry of Economic Affairs, Agriculture and Innovation, September 2010.
“The Employment and Economic Impacts of Network Neutrality Regulation: An Empirical Analysis,” sponsored by Mobile Future, 2010.
“The Benefits of Wireless Broadband for Rural Deployments,” sponsored by Qualcomm, Inc, 2010.
Malcolm K. Sparrow, Coleman Bazelon and Charles Jackson, “Can Internet Gambling Be Effectively Regulated? Managing the Risks,” sponsored by Wired Safety, 2009.
“The Need for Additional Spectrum for Wireless Broadband: The Economic Benefits and Costs of Reallocations,” sponsored by Consumer Electronics Association, 2009.
Coleman Bazelon and William Zarakas, “Measuring Concentration in Radio Spectrum License Holdings,” Telecommunications Policy Research Conference, 2009.
“Licensed or Unlicensed: The Economic Considerations in Incremental Spectrum Allocations,” in New Frontiers in Dynamic Spectrum Access Networks, 2008, DySPAN 2008.
“Overreaching: The Policy Failures of the 700 MHz Auction,” Telecommunications Policy Research Conference, 2008.
“Cream Skimming,” Telecommunications Policy Research Conference, 2007.
Thomas W. Hazlett and Coleman Bazelon, “Market Allocation for Radio Spectrum,” prepared for the International Telecommunications Union Workshop on Market Mechanisms for Spectrum Management, Geneva, Switzerland, January, 2007.
“Licensed or Unlicensed: The Economics of Incremental Spectrum Allocations,” Telecommunications Policy Research Conference, 2006.
“Analysis of an Accelerated Digital Television Transition,” sponsored by Intel Corporation, 2005.
Thomas W. Hazlett and Coleman Bazelon, “Regulated Unbundling of Telecommunications Networks: A Stepping Stone to Facilities-Based Competition?” Telecommunications Policy Research Conference, 2005.
Thomas W. Hazlett, Coleman Bazelon, John Rutledge, and Deborah Allen Hewitt, Sending the Right Signals: Promoting Competition Through Telecommunications Reform: A Report to the U.S. Chamber of Commerce, September 22, 2004.
Thomas W. Hazlett, Arthur M. Havenner, and Coleman Bazelon, “Regulation and Investment in Local Telecommunications Networks,” Working Paper, January 2004.
Case 2:13-cv-00193 Document 614-1 Filed in TXSD on 09/21/14 Page 55 of 72Case 2:13-cv-00193 Document 671-19 Filed in TXSD on 11/11/14 Page 127 of 207
Coleman Bazelon
15
Michael H. Rothkopf and Coleman Bazelon, “Interlicense Competition: Spectrum Deregulation Without Confiscation or Giveaways,” New America Foundation, Spectrum Series Working Paper #8, August, 2003.
“Review of Discounting and Intergenerational Equity,” by Paul Portney and John Weyant, Resources for the Future (1999), in the Society of Government Economists Newsletter, Volume 34, No. 10, November 2002.
“Completing the Transition to Digital Television,” Congressional Budget Office, September 1999.*
“Two Approaches for Increasing Spectrum Fees,” Congressional Budget Office, November 1998 (Coauthored with David Moore*).
“Where Do We Go From Here? The FCC Auctions and the Future of Radio Spectrum Management,” Congressional Budget Office, April 1997 (Coauthored with Perry Beider and David Moore*).
* CBO publications do not cite authors’ names.
Federal Communications Commission Filings
“Declaration of Coleman Bazelon,” Comments of Martha Wright, et. al., Exhibit C, WC Docket No. 12-375, March 25, 2013 (prison payphone rates).
“Unlicensed Use of the TV White Spaces: Wasteful and Harmful,” FCC Filling, with Charles L. Jackson and Dorothy Robyn, Ex Parte Comments, ET Docket No. 04-186, ET Docket No. 02-380, August 20, 2008 (benefits of licensed over unlicensed allocation of the TV White Spaces).
“Comments of Charles L. Jackson, Dorothy Robyn and Coleman Bazelon,” Comments, WC Docket No. 06-150, PS Docket No. 06-229, June 20, 2008 (value of TV White Spaces).
“Comments of Coleman Bazelon,” Comments, WC Docket No. 06-150, PS Docket No. 06-229, WT Docket No. 96-86, June 20, 2008 (700 MHz D Block).
“Declaration of Coleman Bazelon,” Reply Comments, WC Docket No. 07-245, April 22, 2008 (economics of pole attachment rates).
“Why the Exclusive Use of Large Licenses in the Upper or Lower 700 MHz Bands Would Reduce the Efficiency of the 700 MHz Auction,” Comments, WT Docket No. 06-150, April 20, 2007.
“Principles for Choosing 700 MHz Block License Sizes,” Ex Parte Comments, WT Docket No. 06-150, March 6, 2007.
“The Economics of License Sizes in the FCC’s 700 MHz Band Auction,” Ex Parte Comments, WT Docket No. 06-150, January 2007.
Case 2:13-cv-00193 Document 614-1 Filed in TXSD on 09/21/14 Page 56 of 72Case 2:13-cv-00193 Document 671-19 Filed in TXSD on 11/11/14 Page 128 of 207
Coleman Bazelon
16
“Declaration of Thomas W. Hazlett, Ph.D., Prof. Arthur M. Havenner, and Coleman Bazelon, Ph.D.,” Comments, WC Docket No. 03-173, December 16, 2003. (Wireline investment, UNE-P)
“Declaration of Thomas W. Hazlett, Ph.D., Arthur M. Havenner, Ph.D., and Coleman Bazelon, Ph.D.,” Comments, WC Docket No. 03-157, September 2, 2003. (Wireline investment, UNE-P)
“Spectrum Deregulation Without Confiscation or Giveaways,” with Michael Rothkopf, Comment, ET Docket No. 02-135, January 9, 2003.
Thomas W. Hazlett, Coleman Bazelon and Arthur Havenner, “Forecast of Toll Free Number Demand: 2002-2004,” Attachment A, SMS/800 Transmittal No. 22, F.C.C. Tariff No. 1, November 15, 2002.
“Comments of Coleman D. Bazelon and T. Christopher Borek Relating to Arthur D. Little, Inc.’s Assessment of the Impact of DTV on the Cost of Consumer Television Receivers,” Ex Parte Comments MM Docket 00-39, August 1, 2002.
“Use Administrative Law Judges to Adjudicate Interference Disputes Between Licensees,” Comment, ET Docket No. 02-135, July 8, 2002.
SEMINARS AND PRESENTATIONS
Ferrum College Forum: “Internet Privacy, Civil Liberties, National Security, Law, and Economics: In Search of a Coherent Policy Path Forward,” March 19, 2014.
Bloomberg BNA Webinar: “Spectrum Auctions Are Back: What you need to know”, February 19, 2014.
Violating Your Privacy: An Economic Perspective, 41st Annual Telecommunications Policy Research Conference (TPRC), Arlington, VA, September 28, 2013.
Other Recent and Planned Spectrum Auctions: What They Portend for the Future: Economic Perspectives on the Auctions, Law Seminars International, Washington, D.C., July 22, 2013.
Spectrum Auction Policy: Potential Outcomes for Economic Growth and Public Safety, Georgetown University McDonough School of Business, Rayburn House Office Building, Washington, D.C., May 14, 2013.
Markets in Wireless Spectrum, Towards Dynamic Markets in Electric Power, Water, and Wireless Spectrum Seminar, University of Colorado Law School, Boulder, CO, April 23, 2013.
Annual College of Social Studies Spring Banquet/ the Underwood Memorial Lecture and Hoggendorn lecture for the Economic Department, Wesleyan University, Middletown, CT, April 17 – 18, 2013.
SNL Knowledge Center Webinar: “FCC Incentive Auction Rules: Estimating Clearing Prices and Policy Impacts", February 27, 2013.
Case 2:13-cv-00193 Document 614-1 Filed in TXSD on 09/21/14 Page 57 of 72Case 2:13-cv-00193 Document 671-19 Filed in TXSD on 11/11/14 Page 129 of 207

Coleman Bazelon
17
Reverse Auction Design: Dynamic or Sealed, Algorithmic Issues, Market Power, Reserves, Reference Prices, Conference on the FCC Incentive Auction, Stanford Institute for Economic Policy Research, Stanford, CA, February 26, 2013.
Mobile Impact on Economic Growth and Job Creation, Consumer Electronics Show, LIT Program Innovation Policy Summit, Las Vegas, NV, January 8, 2013.
Incentive Auctions: What Broadcasters Need to Know, Crossfire Media Webinar, December 19, 2012.
Spectrum Value, 40th Annual Telecommunications Policy Research Conference (TPRC), Arlington, VA, September 22, 2012.
FCBA Seminar: Getting from Here to There: The Road Ahead for Spectrum Auctions, Washington, DC, June 6, 2012.
Incentive Auctions, 39th Annual Telecommunications Policy Research Conference (TPRC), Arlington, VA, September 24, 2011.
Competition in the Wireless Environment: How to Get More Handsets or More Networks, Broadband Breakfast Club, Washington, DC, February 15, 2011.
Introducing TV White Spaces, Spectrum Bridge webinar, October 28, 2010.
The Indian 3G and BWA Auctions, 38th Annual Telecommunications Policy Research Conference (TPRC), Arlington, VA, October 2, 2010.
How Smart Public Policies Can Drive the Mobile Broadband Transformation, Information Technology and Innovation Foundation’s The Emerging Mobile Broadband Economy and its New Business Models, Washington, DC, September 14, 2010.
Community Broadband-A Blessing or Curse?, K&L Gates LLP Municipal Broadband Webcast, July 29, 2010.
Towards A Sustainable Spectrum Policy: Rethinking Federal Spectrum, Public Knowledge, Washington, DC, June 3, 2010.
Unraveling Net Neutrality: Should the FCC Regulate Broadband, Independence Institute, Denver, CO, May 26, 2010.
CQ-Roll Call Policy Breakfast on the Future of Wireless Broadband, Washington, DC, May 20, 2010.
Congressional Staff Briefings on “The Need for Additional Spectrum for Wireless Broadband: The Economic Benefit and Costs of Reallocations,” Washington, DC, December 8, 2009.
Case 2:13-cv-00193 Document 614-1 Filed in TXSD on 09/21/14 Page 58 of 72Case 2:13-cv-00193 Document 671-19 Filed in TXSD on 11/11/14 Page 130 of 207

Coleman Bazelon
18
The Progress and Freedom Foundation’s “Let’s Make a Deal: Broadcasters, Mobile Broadband, and a Market in Spectrum,” Washington, DC, December 1, 2009.
FCBA’s Intellectual Property Practice Committee Brown Bag Lunch, Washington, DC, November 30, 2009.
FCC Broadband Spectrum Workshop, Washington, DC, September 17, 2009.
Measuring Concentration in Radio Spectrum License Holdings, 37th Annual Telecommunications Policy Research Conference (TPRC), Arlington, VA, September 26, 2009.
Broadband Stimulus Plan, 2009 FLATOA-FCBA Conference, Tampa, FL, June 26, 2009.
Leveraging the Broadband Stimulus and Licensed Spectrum, Webinar, April 29, 2009.
Keynote Address, Enterprise Wireless08, Scottsdale, AZ, November 6, 2008.
Licensed or Unlicensed: The Economic Considerations in Incremental Spectrum Allocations, DySPAN, Chicago, IL, October 16, 2008.
Overreaching: The Policy Failures of the 700 MHz Auction, 36th Annual Telecommunications Policy Research Conference (TPRC), Arlington, VA, September 27, 2008.
Cream Skimming, 35th Annual Telecommunications Policy Research Conference (TPRC), Arlington, VA, September 29, 2007.
Auction Revenues are not the Only Revenues that Should Drive Spectrum Policy, Law Seminars International: Spectrum Management, Washington, DC, September 17, 2007.
Market Allocation for Radio Spectrum, International Telecommunications Union Workshop on Market Mechanisms for Spectrum Management, Geneva, Switzerland, January 2007.
Licensed vs. Unlicensed Spectrum: A New Economic Model for Determining the Trade-offs, 34th Annual Telecommunications Policy Research Conference (TPRC), Arlington, VA, September 30, 2006.
Decoding the Future of IP-TV, Northern California Chapter of the Federal Communications Bar Association, San Francisco, February 2006.
Accelerating the Digital Television Transition, COMPTEL Executive Business & Policy Summit, Washington, DC, December 2005.
Regulated Unbundling of Telecommunications Networks: A Stepping Stone to Facilities Based Competition? Telecommunications Policy Research Conference, Arlington, VA, September 2005.
Case 2:13-cv-00193 Document 614-1 Filed in TXSD on 09/21/14 Page 59 of 72Case 2:13-cv-00193 Document 671-19 Filed in TXSD on 11/11/14 Page 131 of 207

Coleman Bazelon
19
Sending the Right Signals: Promoting Competition Through Telecommunications Reform: A Report to the U.S. Chamber of Commerce, presentation of report to the US Chamber of Commerce, October 6, 2004.
Telecommunications Reform, presentation to the U.S. Chamber of Commerce’s Technology Policy Committee, April 29, 2004.
Interlicense Competition, Telecommunications Policy Research Conference, Arlington, VA, September 2003.
Marketing & Legal Strategies: Hope, Hype & Crash Landings, WCAI 2003, Washington, DC, July 10, 2003.
Spectrum Policy Task Force Interference Recommendations, Manhattan Institute Conference, Washington, DC, February 13, 2002.
FCC License Auctions, Society of Government Economists Conference, Washington, DC, November 22, 2002.
Spectrum Management Panel, CTIA Wireless 2002, Orlando, FL, March 18, 2002.
A Note on Correlation, ASSA Annual Meetings, Atlanta, GA, January 6, 2002.
Regulatory Forbearance, Powerline Communications Conference, Washington, DC, December 13, 2001. Spectrum License Valuations, CTIA Wireless Agenda 2001, Dallas, TX, May 2001.
Old Spectrum in the New Economy, with David Moore, invited paper, Society of Government Economists Conference “The New ‘Economy’: What Has Changed and Challenges for Economic Policy,” Washington, DC, November 2000.
Discounting Inside the Washington DC Beltway, Energy Information Agency Seminar Series, Washington, DC, March 2000.
Discounting Inside the Washington DC Beltway, Congressional Budget Office Seminar Series, Washington, DC, November 1999.
Completing the Transition to Digital Television, Telecommunications Policy Research Conference, Arlington, VA, September 1999.
Digital Television Transition, Congressional Budget Office Seminar Series, Washington, DC, April 1999.
The Budgetary Treatment of Asset Sales, briefing for the staff of the Senate Budget Committee, Washington, DC, February 1997.
Case 2:13-cv-00193 Document 614-1 Filed in TXSD on 09/21/14 Page 60 of 72Case 2:13-cv-00193 Document 671-19 Filed in TXSD on 11/11/14 Page 132 of 207
Coleman Bazelon
20
The Value Added from Multilateral Bargaining Theory for Applied Research, with Greg Adams, Selected Paper, AAEA Annual Meeting, Baltimore, MD, August 1992.
The Importance of Political Markets in Formulating Economic Policy Recommendations, Selected Paper, AAEA Annual Meeting, Manhattan, KS, August 1991.
L.D.C. Debt and Policy Linkages in the Determination of World Commodity Prices, with Gordon Rausser, Selected Paper, AAEA Annual Meeting, Vancouver, B.C., Canada, August 1990.
REVIEWER • American Journal of Agricultural Economics (1989 – 1994)
• Congressional Budget Office Reports
• Telecommunications Policy
• Telecommunications Policy Research Conference Program Committee (2011-2013)
• George Mason University
PROFESSIONAL AFFILIATIONS
• American Bar Association
• American Economic Association
• Federal Communications Bar Association
• National Research Council - Committee on a Survey of the Active Scientific Use of the
Radio Spectrum
Case 2:13-cv-00193 Document 614-1 Filed in TXSD on 09/21/14 Page 61 of 72Case 2:13-cv-00193 Document 671-19 Filed in TXSD on 11/11/14 Page 133 of 207
Coleman Bazelon
21
EDUCATION
Dr. Bazelon received his Ph.D. and M.S. in Agricultural and Resource Economics from the University of California at Berkeley. He also holds a Diploma in Economics from the London School of Economics and Political Science and a B.A. from Wesleyan University.
June 18, 2014
Case 2:13-cv-00193 Document 614-1 Filed in TXSD on 09/21/14 Page 62 of 72Case 2:13-cv-00193 Document 671-19 Filed in TXSD on 11/11/14 Page 134 of 207

39 | brattle.com
Appendix B – Materials Relied Upon
Books
1. Baldus, David C., and James W.L. Cole, Statistical Proof of Discrimination, Colorado Springs: Shepard’s McGraw Hill, 1980.
2. Downs, Anthony, An Economic Theory of Democracy, New York: Harper & Brothers, 1957.
3. Fix, Michael, and Raymond J. Struyk, Clear and Convincing Evidence: Measurement of Discrimination in America, Washington D.C.: The Urban Institute Press, 1993.
4. Small, Kenneth A. and Erik T. Verhoef, The Economics of Urban Transportation, New York: Routledge, 2007.
Articles and Book Chapters
5. Brennan Center for Justice, “Citizens Without Proof: A Survey of Americans’ Possession of Documentary Proof of Citizenship and Photo Identification,” November
2006.
6. Cain, Glen, “The Economic Analysis of Labor Market Discrimination”; in O. Ashenfelter and R. Layards, The Handbook of Labor Economics, Vol. 1, 1986, pp.
693-785.
7. DeNavas-Walt, Carmen, et al., “Income, Poverty, and Health Insurance Coverage in the United States: 2012,” United States Census Bureau, September 2013.
8. Ellis, David, “Cost Per Hour and Value of Time Calculations for Passenger Vehicles and Commercial Trucks for Use in the Urban Mobility Study,” Technical
Memorandum, Texas Transportation Institute, May 2008.
9. Groen, Jeffrey A., and Anne E. Polivka, “Hurricane Katrina evacuees: who they are, where they are, and how they are faring,” Monthly Labor Review, March 2008, pp.
40-44.
10. Hotelling, Harold, “Stability in Competition,” Economic Journal 39, 1929, pp. 41-57.
11. McHenry, Peter, “Does Low Wealth Constrain Long-Distance Migration?” College of William and Mary, August 2013, retrieved from
<http://wmpeople.wm.edu/asset/index/pmchenry/paperwealthandmigration>
(accessed 06/24/2014).
12. Munnell, Alicia H., et al., “Mortgage Lending in Boston: Interpreting HMDA Data,” American Economic Review, 86 (1), March 1996, pp. 25-53.
Case 2:13-cv-00193 Document 614-1 Filed in TXSD on 09/21/14 Page 63 of 72Case 2:13-cv-00193 Document 671-19 Filed in TXSD on 11/11/14 Page 135 of 207

40 | brattle.com
13. Rogowski, Jon and Cathy Cohen, “Black and Latino Youth Disproportionately Affected by Voter Identification Laws in the 2012 Election.”
14. Salop, Steven, “Monopolistic Competition with Outside Goods,” Bell Journal of Economics 10, 1979, pp. 141-156.
15. Schrank, David, et al., “TTI’s 2012 Urban Mobility Report,” Texas A&M Transportation Institute, December 2012.
16. Shapiro, Thomas, et al., “The Roots of the Widening Racial Wealth Gap: Explaining the Black-White Economic Divide,” February 2013.
17. “Toll Road Modeling Support: Final Report,” Maricopa Association of Governments, February 2012.
18. Yinger, John, “Access Denied, Access Constrained: Results and Implications of the 1989 Housing Discrimination Study”; in Fix and Struyk, Clear and Convincing
Evidence: Measurement of Discrimination in America, Washington D.C.: The Urban
Institute Press, 1993, pp. 69-112.
News Articles
19. Friedman, Scott, “DPS Wait Times Shorter at New Mega Center License Offices,” NBC News, April 2, 2013, retrieved from
<http://www.nbcdfw.com/investigations/DPS-Wait-Times-Shorter-at-New-Mega-
Center-License-Offices-200942911.html> (accessed 06/26/2014).
20. Strauss, Steven, “The Connection Between Education, Income Inequality, and Unemployment,” Huffington Post, November 2, 2011, retrieved from
<http://www.huffingtonpost.com/steven-strauss/the-connection-between-
ed_b_1066401.html> (accessed 06/26/2014).
21. Sullivan, Bob, “Katrina Victims face identity crisis,” NBC News, September 13, 2005, retrieved from <http://www.nbcnews.com/id/9316512/ns/technology_and_science-
security/t/katrina-victims-face-identity-crisis/#.U6oESfldUt5> (accessed 06/24/2014).
22. Woodard, Brad, “DPS Wait Times are Longer than Ever,” KHOU News, July 3, 2012, retrieved from <http://www.khou.com/news/local/DPS-wait-times-are-longer-than-
ever-161146955.html> (accessed 06/26/2014).
Court Documents
23. Decision and Order by the United States District Court Eastern District of Wisconsin, Case No. 11-CV-01128, filed April 29, 2014.
24. Defendant’s Motion to Dismiss, ECF No. 52.
Case 2:13-cv-00193 Document 614-1 Filed in TXSD on 09/21/14 Page 64 of 72Case 2:13-cv-00193 Document 671-19 Filed in TXSD on 11/11/14 Page 136 of 207

41 | brattle.com
25. Syllabus of the Supreme Court of the United States in Shelby County, Alabama v. Holder, Attorney General, et al., decided June 25, 2013.
26. Tex. Elec. Code Ann. § 63.0101 (valid through December 31, 2011).
27. Texas v. Holder, 888 F.Supp.2d 113 (2012).
Databases
28. “Net Worth and Asset Ownership of Households: 2010,” United States Census Bureau, retrieved from <http://www.census.gov/people/wealth/files/Wealth_Tables_2010.xls>
(accessed 06/24/2014).
29. Google Maps API Database [see Appendix C].
30. Census Bureau American Community Survey, 2010.
31. Department of Justice Matching Data
32. Survey of Income and Program Participation, 2008 Panel, Wave 7.
33. Texas Election Administration Management Database of Registered Voters.
34. “Voting and Registration in the Election of November 2012 – Detailed Tables,” United States Census Bureau, retrieved from
<https://www.census.gov/hhes/www/socdemo/voting/publications/p20/2012/tables.ht
ml> (accessed 06/24/2014).
Other Sources
35. “SB 14 – Voter Identification Requirements – Key Vote,” Project Vote Smart, retrieved from <http://votesmart.org/bill/12588/voter-identification-
requirements#.U6Nunp3D8TQ> (accessed 06/24/2014).
36. “2010 Census Tallies of Census Tracts, Block Groups & Blocks,” retrieved from <https://www.census.gov/geo/maps-data/data/tallies/tractblock.html> (accessed
06/24/2014).
37. “2010 Texas Child Care Market Rate Survey – Final Report,” Texas Workforce Commission, April 2011, retrieved from
<http://www.twc.state.tx.us/svcs/childcare/child-care-market-rate-report.pdf>
(accessed 06/24/2014).
38. “Apply for an Identification (ID) Card,” Texas Department of Public Safety, retrieved from <http://www.txdps.state.tx.us/DriverLicense/applyforid.htm> (accessed
06/26/2014).
39. “Birth Certificate for Election Identification,” Texas Department of State Health Services, retrieved from
Case 2:13-cv-00193 Document 614-1 Filed in TXSD on 09/21/14 Page 65 of 72Case 2:13-cv-00193 Document 671-19 Filed in TXSD on 11/11/14 Page 137 of 207

42 | brattle.com
<http://www.dshs.state.tx.us/Layouts/ContentPage.aspx?PageID=56719&id=85899814
87&terms=election+identification> (accessed 06/27/2014).
40. “Certified Copy of a Birth Certificate,” Texas Department of State Health Services, retrieved from <http://www.dshs.state.tx.us/vs/reqproc/certified_copy.shtm>
(accessed 06/24/2014).
41. “County Locations Issuing Election Identification Certificates,” Texas Department of Public Safety Driver License Division, retrieved from
<http://www.dps.texas.gov/DriverLicense/documents/EICCountyrun.pdf> (accessed
06/24/2014).
42. “DPS Mobile Stations Issuing Election Identification Certificates,” Texas Department of Public Safety Driver License Division, retrieved from
<http://www.dps.texas.gov/DriverLicense/documents/EICDPSrun.pdf> (accessed
06/24/2014).
43. “Driver License Division Fees,” Texas Department of Public Safety, retrieved from <http://www.txdps.state.tx.us/DriverLicense/fees.htm> (accessed 06/25/2014).
44. “Election Identification Certificate (EIC),” Texas Department of Public Safety, retrieved from <http://www.dps.texas.gov/DriverLicense/electionID.htm> (accessed
06/24/2014).
45. “Election Identification Certificates (EIC) – Documentation Requirements,” Texas Department of Public Safety, retrieved from
<http://www.txdps.state.tx.us/driverlicense/eicdocreqmnts.htm> (accessed
06/24/2014).
46. “How to Obtain a Birth Certificate,” Wyoming Department of Health, retrieved from <http://www.health.wyo.gov/rfhd/vital_records/birthcertificate.html> (accessed
06/24/2014).
47. “N-400, Application for Naturalization,” U.S. Citizenship and Immigration Services, retrieved from <http://www.uscis.gov/n-400> (accessed 06/25/2014).
48. “N-565, Application for Replacement Naturalization/Citizenship Document,” U.S. Citizenship and Immigration Services, retrieved from <http://www.uscis.gov/n-565>
(accessed 06/25/2014).
49. “N-600, Application for Certificate of Citizenship,” U.S. Citizenship and Immigration Services, retrieved from <http://www.uscis.gov/n-600> (accessed 06/25/2014).
50. “Our Locations,” Federal Bureau of Prisons, retrieved from <http://www.bop.gov/locations/list.jsp> (accessed 06/27/2014).
Case 2:13-cv-00193 Document 614-1 Filed in TXSD on 09/21/14 Page 66 of 72Case 2:13-cv-00193 Document 671-19 Filed in TXSD on 11/11/14 Page 138 of 207
43 | brattle.com
51. “Register To Vote,” VoteTexas.gov, retrieved from <http://votetexas.gov/register-to-vote/register-to-vote> (accessed 06/27/2014).
52. “Required Identification for Voting in Person,” VoteTexas.gov, retrieved from <http://votetexas.gov/register-to-vote/need-id/> (accessed 06/24/2014).
53. “Taxicab Rates,” City of Houston Administration and Regulatory Affairs, retrieved from <http://www.houstontx.gov/ara/regaffairs/taxicabs_rates.html> (accessed
06/24/2014).
54. “Taxicab Rates and Approximate Fares,” Fort Worth Municipal Court Administration, retrieved from
<http://fortworthtexas.gov/uploadedFiles/Municipal_Court/About_Us/Administration
/Taxicab%20Rates%20and%20Approximate%20Fares.pdf> (accessed 06/24/2014).
55. Texas Administrative Code, Title 25, Part 1, Rule §181.28.
56. “Texas Concealed Handgun License (CHL) Fee Table,” Texas Department of Public Safety, retrieved from
<http://www.dps.texas.gov/rsd/chl/documents/chlfeeschedule.pdf> (accessed
06/25/2014).
57. “Unit Directory,” Texas Department of Criminal Justice, retrieved from <http://tdcj.state.tx.us/unit_directory/> (accessed 06/27/2014).
58. “United States Passport Fees,” U.S. Department of State, retrieved from <http://travel.state.gov/content/dam/passports/FeeChart/Passport%20Fees%20Chart%
202014_TSG.pdf> (accessed 06/25/2014).
59. “Veteran Services: Fee Exemption for Disabled Veterans,” Texas Department of Public Safety, retrieved from <http://www.txdps.state.tx.us/driverlicense/vetservices.htm>
(accessed 06/25/2014).
60. VitalChek, retrieved from <https://www.vitalchek.com/> (accessed 06/24/2014).
61. “Vital Records Request Service,” Vermont State Archives and Records Administration, retrieved from <https://secure.vermont.gov/VSARA/vitalrecords/>
(accessed 06/24/2014).
62. U.S. Department of Transportation Memorandum entitled “Revised Departmental Guidance on Valuation of Travel Time in Economic Analysis,” September 28, 2011.
Case 2:13-cv-00193 Document 614-1 Filed in TXSD on 09/21/14 Page 67 of 72Case 2:13-cv-00193 Document 671-19 Filed in TXSD on 11/11/14 Page 139 of 207

44 | brattle.com
Appendix C – Geocoding Methodology
I. Racial Composition of Registered Voters
74. Determining the composition of registered voters required geocoding of the voter addresses in TEAM. I used TransCAD to geocode the individual addresses. This resulted in latitude
and longitude coordinates for approximately 85% of the records in TEAM, which I then
assigned to a Block Group using the Census TIGER shape file data.61 Nearly all of the
remaining 15% of TEAM records contain valid zip codes, which I then assign to a Block
Group based on the latitude and longitude of the zip code centroid.62
II. Transportation Costs by Block Group
75. The travel cost analysis requires multiple stages of geocoding. First, I geocoded the addresses of all DPS locations using the Google Geocoding API. I then determined the
spherical or great circle distance from each Block Group to each DPS location and selected
the three nearest DPS locations for each Block Group. For each of the three DPS locations,
I submit Google Directions API queries to determine travel durations and distances by
mode for transit, walking, and driving (taxi).63 These values are then used in the travel cost
minimization routine as describe in Section VII.C.2 above.
61 Available at http://www.census.gov/geo/maps-data/data/tiger-line.html.
62 TEAM consists of a total of 13,564,410 voters; 13,510,908 of whom were not known to be deceased as
of August 2014; 13,406,038 of these voters have addresses or zipcodes that are able to be mapped to
Census Block Groups; 13,350,209 of these voters map to Census Block Groups without prisons.
63 For details on the Google Directions API, see
https://developers.google.com/maps/documentation/directions/.
Case 2:13-cv-00193 Document 614-1 Filed in TXSD on 09/21/14 Page 68 of 72Case 2:13-cv-00193 Document 671-19 Filed in TXSD on 11/11/14 Page 140 of 207

45 | brattle.com
Appendix D – Determination of Affected Registered Voter Probability
by Race
76. Census provides valuable information on the racial and income composition of various geographies. Public data on household income is provided at the Census tract level, while
racial information is available at the Block level. I perform my analysis at the Block Group
level.
77. The TEAM database records basic information about registered voters, including voter names and addresses for every registered voter in Texas. As explained in Appendix C, I use
a geocoding algorithm to identify from the addresses in the TEAM database the Block
Group location of registered voters in Texas and an estimate of the number of registered
voters in each Block Group.
78. DOJ provided information from federal and state databases on whether each registered voter in the TEAM database held a Required ID.64 After removing voters who are eligible
for a disability exemption, I combined this with the geocoding algorithm to then calculate
the number of registered voters in each Block Group who must obtain a Required ID in
order to vote. This is the number of Affected Registered Voters.
79. These sets of information—racial breakdowns by Census Block Group, registered voters, and Affected Registered Voters—are not conformable between the Census data and the
TEAM data. That is, I do not observe the racial identity of specific registered voters in
TEAM. In order to determine the share of a racial group’s registered voters that are
Affected Registered Voters, I rely on the rules of probability and a couple of simplifying
assumptions.
80. Let R denote the random variable for Race (e.g., African American, white, Hispanic), RV the random variable for registered voter status (registered (“1”), unregistered (“0”)), and BG
the random variable denoting Block Group (any specific Block Group in Texas). Following
Bayes’ Rule,
64 DOJ matching data provides multiple permutations of all primary and secondary matches. I take a
conservative approach and use the union of all potential ID matches across all ID databases to indicate
that the registered voter is likely to have a Required ID.
Case 2:13-cv-00193 Document 614-1 Filed in TXSD on 09/21/14 Page 69 of 72Case 2:13-cv-00193 Document 671-19 Filed in TXSD on 11/11/14 Page 141 of 207

46 | brattle.com
����|��,�� =����,��|��
�����|�,��
= �����|�,������|��
�����|�,��
=�����|�,������|��
∑ �����|� = �,������ = �|���
.
81. The conditional probability of a Block Group resident being a registered voter given that she is African American is unknown to me. But I do know this conditional probability at
the state level for Texas, as described earlier in the report. I assume that the propensity to
register to vote is the same for all Texas residents within the same race. That is, an African
American’s propensity to register to vote is assumed to be constant across all Block Groups
in Texas. The probability of a registered voter in a given Block Group being of a particular
race is then
����|��,�� =�����|�����|��
∑ �����|� = ����� = �|���
.
82. This calculation is a critical input for calculating the share of a racial group’s registered voters that must obtain a Required ID.65 The estimated number of registered voters for a
racial group is determined by multiplying this probability by the number of registered
voters in the Block Group. The estimated number of registered voters within a racial group
that are Affected Registered Voters is determined by multiplying this probability by the
number of registered voters needing a Required ID in the Block Group.66 Across Block
Groups, the share of a racial group’s registered voters that must obtain a Required ID (“ID”
in the formula, with “1” denoting an individual that must obtain a Required ID) is
��� � = 1|�� = 1,� =∑ ����|�� = 1,�� = � ∗ #� � = 1,�� = 1|�� = ��
∑ ����|�� = 1,�� = � ∗ #��� = 1|�� = ��
.
65 The assumption that registered voters status is independent of Block Group location conditional on
race is restrictive, but it has the favorable outcome that the predicted proportion of registered voters
by race across Block Groups will precisely match the observed state-wide Census information.
66 This calculation further assumes that Required ID possession is independent of race conditional on
registered voter and Block Group status. As with the assumption above that registered voter status is
independent of Block Group location conditional on race, better data on the racial group status of
individual registered votes would obviate the need to make the assumption.
Case 2:13-cv-00193 Document 614-1 Filed in TXSD on 09/21/14 Page 70 of 72Case 2:13-cv-00193 Document 671-19 Filed in TXSD on 11/11/14 Page 142 of 207
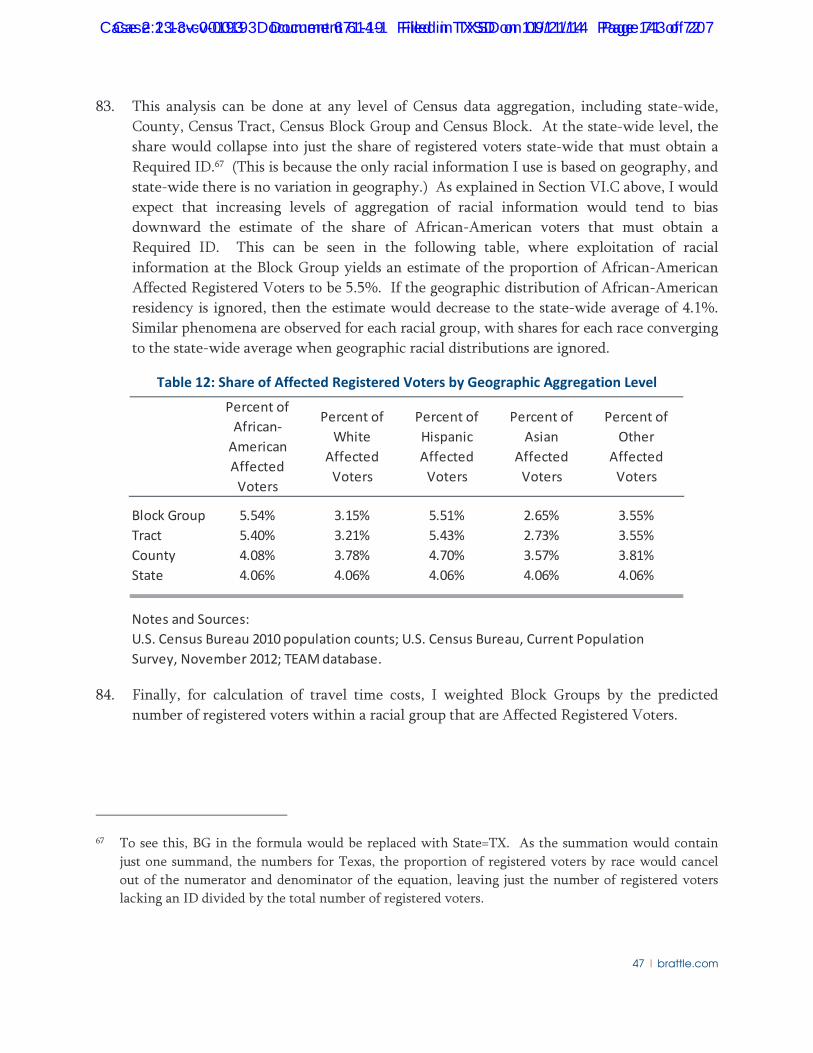
47 | brattle.com
83. This analysis can be done at any level of Census data aggregation, including state-wide, County, Census Tract, Census Block Group and Census Block. At the state-wide level, the
share would collapse into just the share of registered voters state-wide that must obtain a
Required ID.67 (This is because the only racial information I use is based on geography, and
state-wide there is no variation in geography.) As explained in Section VI.C above, I would
expect that increasing levels of aggregation of racial information would tend to bias
downward the estimate of the share of African-American voters that must obtain a
Required ID. This can be seen in the following table, where exploitation of racial
information at the Block Group yields an estimate of the proportion of African-American
Affected Registered Voters to be 5.5%. If the geographic distribution of African-American
residency is ignored, then the estimate would decrease to the state-wide average of 4.1%.
Similar phenomena are observed for each racial group, with shares for each race converging
to the state-wide average when geographic racial distributions are ignored.
Table 12: Share of Affected Registered Voters by Geographic Aggregation Level
84. Finally, for calculation of travel time costs, I weighted Block Groups by the predicted number of registered voters within a racial group that are Affected Registered Voters.
67 To see this, BG in the formula would be replaced with State=TX. As the summation would contain
just one summand, the numbers for Texas, the proportion of registered voters by race would cancel
out of the numerator and denominator of the equation, leaving just the number of registered voters
lacking an ID divided by the total number of registered voters.
Percent of
African-
American
Affected
Voters
Percent of
White
Affected
Voters
Percent of
Hispanic
Affected
Voters
Percent of
Asian
Affected
Voters
Percent of
Other
Affected
Voters
Block Group 5.54% 3.15% 5.51% 2.65% 3.55%
Tract 5.40% 3.21% 5.43% 2.73% 3.55%
County 4.08% 3.78% 4.70% 3.57% 3.81%
State 4.06% 4.06% 4.06% 4.06% 4.06%
Notes and Sources:
U.S. Census Bureau 2010 population counts; U.S. Census Bureau, Current Population
Survey, November 2012; TEAM database.
Case 2:13-cv-00193 Document 614-1 Filed in TXSD on 09/21/14 Page 71 of 72Case 2:13-cv-00193 Document 671-19 Filed in TXSD on 11/11/14 Page 143 of 207

48 | brattle.com
Appendix E: Documentation Required to Obtain an EIC
Table 13: Documentation Required to Obtain an EIC
EIC Documentation Requirements
[1] Documentation of U.S. Citizenship
** U.S. Passport Book Or Card
Birth Certificate Issued By U.S. State, Territory, Or Dc
Certificate Of Report Of Birth Or Consuler Report Of Birth
** U.S. Certificate Of Citizenship Or Certificate Of Naturalization
U.S. Department Of Justic Immigration And Naturalization Service U.S. Citizen Id Card
[2] Documentation Of Identity
Primary Identification
Texas Driver License (expired for 60 days and is within 2 years of expiration date)
Texas Personal Identification Card (expired for 60 days and is within 2 years of expiration date)
Secondary Identification
Birth Certificate Issued By State Bureau Of Vital Statistics Of Equivalent
U.S. Department Of State Certification Of Birth
Court Order With Name And Date Of Birth Indicating An Official Chane Of Name And/Or Gender
U.S. Citizenship Or Naturalization Papers Without Identifiable Photo
Supporting Identification
Voter Registration Card
School Records
Insurance Policy (At Least Two Years Old)
Texas Vehicle Or Boat Title Or Registration
Military Records
Unexpired Military Dependant Identification Card
Original Or Certified Copy Of Marriage License Or Divorce Decree
Social Security Card
Pilot'S License
Unexpired Photo Dl Or Photo Id Issued By Another (United States) State, U.S. Territory, The District Of
Columbia
Expired Photo Dl Or Photo Id Issued By Another (United States) State, U.S. Territory, Or The District Of
Columbia That Is Within Two Years Of The Expiration Date
An Offender Identification Card Or Similar Form Of Identification Issued By The Texas Department Of Criminal
Justice
Forms W-2 Or 1099
Numident Record From The Social Security Administration
Expired Texas Driver License Or Personal Identification Certificate (Expired More Than Two Years)
Professional License Issued By Texas State Agency
Identification Card Issued By Government Agency
Parole Or Mandatory Release Certificate Issued By The Texas Department Of Criminal Justice
Federal Inmate Identification Card
Federal Parole Or Release Certificate
Medicare Or Medicaid Card
Selective Service Card
Immunization Records
Tribal Membership Card From Federally Recognized Tribe
Certificate Of Degree Of Indian Blood
Veteran'S Administration Card
Hospital Issued Birth Record
Any Document That May Be Added To §15.24 Of This Title (Relating To Identification Of Applicants) Other
Than Those Issued To Persons Who Are Not Citizens Of The U.S.
Notes and Sources:
Information from http://www.txdps.state.tx.us/DriverLicense/eicDocReqmnts.htm.
** Denotes a document that is sufficent for voting under SB 14.
[1] Applicants need one document of U.S. Citizenship to qualify for an EIC.
[2] One primary, two secondary, or one secondary and two supporting identification documents must be provided
for identity verification and EIC eligibility.
Case 2:13-cv-00193 Document 614-1 Filed in TXSD on 09/21/14 Page 72 of 72Case 2:13-cv-00193 Document 671-19 Filed in TXSD on 11/11/14 Page 144 of 207

IN THE UNITED STATES DISTRICT COURT FOR THE SOUTHERN DISTRICT OF TEXAS
CORPUS CHRISTI DIVISION MARC VEASEY, et al., Plaintiffs, v. RICK PERRY, et al., Defendants.
Civil Actions No. 2:13-cv-193 (NGR) [Lead Case]
UNITED STATES’ NOTICE OF FILING OF THE CORRECTED
EXPERT REPORT OF DR. BARRY C. BURDEN
The United States hereby files the corrected expert report of Dr. Barry C. Burden, which
is attached hereto. The correction solely concerns Paragraph 83, in which Dr. Burden substitutes
revised figures from the corrected report of Dr. Stephen Ansolabehere. Dr. Ansolabehere’s
corrected report was served on all parties on July 1, 2014.
Date: July 7, 2014 Respectfully submitted, KENNETH MAGIDSON JOCELYN SAMUELS United States Attorney Acting Assistant Attorney General Southern District of Texas Civil Rights Division
/s/ Daniel J. Freeman T. CHRISTIAN HERREN, JR. MEREDITH BELL-PLATTS ELIZABETH S. WESTFALL BRUCE I. GEAR JENNIFER L. MARANZANO ANNA M. BALDWIN DANIEL J. FREEMAN Attorneys, Voting Section Civil Rights Division, U.S. Department of Justice 950 Pennsylvania Avenue, N.W. Washington, D.C. 20530
Case 2:13-cv-00193 Document 391 Filed in TXSD on 07/07/14 Page 1 of 4PL7589/2/20142:13-cv-00193
Case 2:13-cv-00193 Document 671-19 Filed in TXSD on 11/11/14 Page 145 of 207

CERTIFICATE OF SERVICE
I hereby certify that on July 7, 2014, I served a true and correct copy of the foregoing via the Court’s ECF system on the following counsel of record:
John B. Scott John Reed Clay, Jr. Gregory David Whitley Jonathan F. Mitchell Sean Flammer Stephen Ronald Keister Arthur D’Andrea Jennifer Marie Roscetii Lindsey Elizabeth Wolf Office of the Texas Attorney General [email protected] [email protected] [email protected] [email protected] [email protected] [email protected] [email protected] [email protected] [email protected] Ben Addison Donnell Donnell Abernethy & Kieschnick [email protected] Counsel for Defendants
Chad W. Dunn Kembel Scott Brazil Brazil & Dunn [email protected] [email protected] J. Gerald Hebert Emma Simson Campaign Legal Center [email protected] [email protected] Neil G. Baron Law Offices of Neil G. Baron [email protected] Armand Derfner Derfner, Altman, & Wilborn [email protected] Luiz Roberto Vera, Jr. [email protected] Counsel for Veasey Plaintiffs
Case 2:13-cv-00193 Document 391 Filed in TXSD on 07/07/14 Page 2 of 4Case 2:13-cv-00193 Document 671-19 Filed in TXSD on 11/11/14 Page 146 of 207

Christina Swarns Ryan P. Haygood Natasha M. Korgaonkar Leah C. Aden Deuel Ross NAACP Legal Defense and Educational Fund, Inc. [email protected] [email protected] [email protected] [email protected] [email protected] Danielle Conley Jonathan Paikin Kelly P. Dunbar Sonya L. Lebsack Gerald J. Sinzdak Lynn Eisenberg Richard F. Shordt WilmerHale LLP [email protected] [email protected] [email protected] [email protected] [email protected] [email protected] [email protected] Counsel for Texas League of Young Voters Plaintiff-Intervenors
Ezra D. Rosenberg Amy L. Rudd Lindsey Cohan Dechert LLP [email protected] [email protected] [email protected] Wendy Weiser Jennifer Clark Myrna Pérez Vishal Agraharkar Brennan Center for Justice at NYU School of Law [email protected] [email protected] [email protected] [email protected] Mark A. Posner Sonia Kaur Gill Erandi Zamora Lawyers’ Committee for Civil Rights [email protected] [email protected] [email protected] Counsel for Texas State Conference of NAACP Branches Plaintiffs
Case 2:13-cv-00193 Document 391 Filed in TXSD on 07/07/14 Page 3 of 4Case 2:13-cv-00193 Document 671-19 Filed in TXSD on 11/11/14 Page 147 of 207

Jose Garza Marinda van Dalen Robert W. Doggett Peter McGraw Kathryn Newell Priscilla Noriega Texas Rio Grande Legal Aid, Inc. [email protected] [email protected] [email protected] [email protected] [email protected] [email protected] Counsel for Ortiz Plaintiffs
Rolando L. Rios Law Offices of Rolando L. Rios [email protected] Counsel for Texas Association of Hispanic County Judges Plaintiff-Intervenors /s/ Daniel J. Freeman Daniel J. Freeman Voting Section Civil Rights Division U.S. Department of Justice [email protected]
Case 2:13-cv-00193 Document 391 Filed in TXSD on 07/07/14 Page 4 of 4Case 2:13-cv-00193 Document 671-19 Filed in TXSD on 11/11/14 Page 148 of 207

IN THE UNITED STATES DISTRICT COURT FOR THE SOUTHERN DISTRICT OF TEXAS
CORPUS CHRISTI DIVISION MARC VEASEY, et al., Plaintiffs, v. RICK PERRY, et al., Defendants.
Civil Actions No. 2:13-cv-193 (NGR)
UNITED STATES OF AMERICA, Plaintiff, TEXAS LEAGUE OF YOUNG VOTERS EDUCATION FUND, et al., Plaintiff-Intervenors, TEXAS ASSOCIATION OF HISPANIC COUNTY JUDGES AND COUNTY COMMISSIONERS, et al., Plaintiff-Intervenors, v. STATE OF TEXAS, et al., Defendants.
Civil Action No. 2:13-cv-263 (NGR)
Case 2:13-cv-00193 Document 391-1 Filed in TXSD on 07/07/14 Page 1 of 45Case 2:13-cv-00193 Document 671-19 Filed in TXSD on 11/11/14 Page 149 of 207

2
TEXAS STATE CONFERENCE OF NAACP BRANCHES, et al., Plaintiffs, v. NANDITA BERRY, et al., Defendants.
Civil Action No. 2:13-cv-291 (NGR)
BELINDA ORTIZ, et al., Plaintiffs, v. STATE OF TEXAS, et al., Defendants
Civil Action No. 2:13-cv-348 (NGR)
DECLARATION OF DR. BARRY C. BURDEN
Pursuant to 28 U.S.C. § 1746, I, Barry C. Burden, make the following declaration: Background and Qualifications
1. My name is Barry C. Burden. I am a Professor of Political Science at the University of Wisconsin-Madison. I earned my Ph.D. at The Ohio State University in 1998. From 1999 to 2006 I was a faculty member in the Department of Government at Harvard University. I have been a full professor at the University of Wisconsin-Madison since 2006. A copy of my curriculum vitae is attached.
2. My expertise is in American politics with a focus on elections and voting, public opinion,
representation, partisanship, and research methodology. I teach courses on these topics at both the undergraduate and graduate levels. I am author of the book Personal Roots of Representation (2007 Princeton University Press), co-author of Why Americans Split Their Tickets (2002 University of Michigan Press), and co-editor of The Measure of American Elections (2014 Cambridge University Press). I have also published approximately 40 articles in scholarly peer-reviewed journals such as the American Political Science Review, American Journal of Political Science, Electoral Studies, Public Opinion Quarterly, Legislative Studies Quarterly, Public Administration Review, Election Law Journal, and Political Analysis. I have served as a manuscript reviewer for
Case 2:13-cv-00193 Document 391-1 Filed in TXSD on 07/07/14 Page 2 of 45Case 2:13-cv-00193 Document 671-19 Filed in TXSD on 11/11/14 Page 150 of 207

3
these and other academic journals. I am a member of the American Political Science Association and have been active in the profession, giving presentations at many conferences and universities. My research has been supported by grants won from sources including the Pew Charitable Trusts, the National Science Foundation, and the Dirksen Congressional Center.
3. My scholarly research has focused on elections and election administration. I am co-
founder of the Election Administration Project at the University of Wisconsin-Madison. This project has produced research on election administration around the country. I have testified before state officials and the bipartisan Presidential Commission on Election Administration. I co-conducted the first independent evaluation of the Electronic Registration Information Center (ERIC), an initiative launched by seven states to modernize voter registration systems. Working with the Pew Center on the States, I am on the advisory board for the Election Performance Index. I serve on the editorial boards of Electoral Studies and Election Law Journal, and I am frequently contacted by civic organizations and journalists to speak about U.S. politics generally and election administration in particular. I have been quoted as a source in media outlets including USA Today, The Wall Street Journal, and The New York Times.
4. I testified as an expert witness on behalf of plaintiffs in the case of League of United
Latin American Citizens of Wisconsin v. Deininger, No. 12-cv-185 (E.D. Wis.). I also serve as an expert witness in the ongoing case of North Carolina State Conference of the NAACP v. McCrory, No. 1:13-CV-658 (M.D.N.C.). I am being compensated by the United States at my standard rate of $250 per hour for my work in this case.
Summary of Opinion
5. I have been asked to review SB 14, the voter identification (ID) law adopted by the State of Texas in 2011, as it relates to certain factors identified by the United States Senate as particularly relevant to assessing a claim brought under Section 2 of the Voting Rights Act. In this report, I consider evidence relating to these “Senate factors.” I believe that applying a social scientific lens provides a richer understanding of how SB 14 operates within the larger set of historical and demographic conditions in Texas. As part of my analysis of the Senate factors, I also evaluate how SB 14 compares to strict voter ID laws adopted by other states and how well it is grounded the State’s asserted interests.
6. Based on the review that follows, it is my considered opinion that SB 14 is likely to deter,
or in some cases even prevent, black and Latino voters from casting effective ballots.1
1 Throughout this report I use the terms “Latino” and “Hispanic” interchangeably. In general Latinos may also identify as white, black, or another racial category. Unless otherwise stated, blacks are assumed to be non-Hispanic. I use the term “Anglo” to refer to non-Hispanic whites. I make this distinction in the analysis that I conduct and attempt to verify that the same definitions are used in data I reference from other organizations. In some cases it is possible that other organizations use somewhat different definitions, allowing Latinos to be counted among whites. Following common parlance, I also use the term “minorities” to refer to blacks and Latinos jointly, even though in combination with other traditional minority groups they have technically become a majority of the Texas population.
The law operates against a historical, socioeconomic, and political backdrop in ways that
Case 2:13-cv-00193 Document 391-1 Filed in TXSD on 07/07/14 Page 3 of 45Case 2:13-cv-00193 Document 671-19 Filed in TXSD on 11/11/14 Page 151 of 207

4
will unduly burden minority voters relative to Anglos. Moreover, the law is not designed to address stated needs and does not include certain ameliorative provisions common in other state voter ID laws. The harmful effects of the law could have been avoided while better serving the State’s purported interest in reducing vote fraud.
SB 14 and the Calculus of Voting
7. Generally speaking, SB 14 requires in-person voters in Texas to provide one of seven specific categories of photo identification. The accepted types of identification are a Texas driver license, Texas Election Identification Certificate (EIC), Texas Department of Public Safety personal identification (ID) card, U.S. military ID, U.S. citizenship certificate, U.S. passport, or a Texas Department of Public Safety license to carry a concealed handgun. The ID must include a photo of the voter and (with the exception of the citizenship certificate) must be current or expired no more than 60 days before voting. The name on the ID must be “substantially similar” to the name on the list of registered voters.
8. A voter who does not present acceptable identification may cast a provisional ballot. The
voter then has until the sixth day after the election to provide acceptable identification to the voter registrar. There are only three narrow exceptions to the general requirement that the voter present one of seven prescribed forms of ID.2
9. The likely effects of SB 14 may be best understood using the theory of the “calculus of voting.” The “calculus of voting” is the dominant theoretical framework used by scholars to study voter turnout. Dating back at least to Anthony Downs’ seminal 1957 book, An Economic Theory of Democracy, researchers typically view the likelihood of voting as the result of a formula: a person is likely to vote when the probability of one’s vote affecting the outcome of the election multiplied by the net psychological benefit of seeing one’s preferred candidate is large. However, the objective likelihood of affecting the outcomes of most elections is exceedingly small.3
Accordingly, researchers often emphasize two other factors that affect whether a person votes.
2 First, a voter may demonstrate at least a 50% disability rating from the Social Security Administration or Department of Veterans Affairs, declare that they lack a valid ID, and present a voter registration certificate showing the exemption for disability. According to the expert report of Professor Stephen Ansolabehere, as of January 15, 2014, only 18 disability applications had been processed. Second, a voter may cast a provisional ballot and then appear at the voter registrar’s office within six days of the election to swear by affidavit that they have a religious objection to being photographed. Third, a voter may cast a provisional ballot and then appear at the voter registrar’s office within six days of the election to swear by affidavit that they lack ID due to a natural disaster that occurred within the last 45 days of the election and was declared so by the Governor of Texas or President of the United States. 3 For an example see Andrew Gelman, Gary King, and John Boscardin (1998), “Estimating the Probability of Events That Have Never Occurred: When is Your Vote Decisive?,” Journal of the American Statistical Association 93(441):1-9.
Case 2:13-cv-00193 Document 391-1 Filed in TXSD on 07/07/14 Page 4 of 45Case 2:13-cv-00193 Document 671-19 Filed in TXSD on 11/11/14 Page 152 of 207

5
10. The first additional factor represents the “consumptive” benefits of voting. These include factors such as expressing one’s identity, supporting the democratic system, and fulfilling a sense of civic duty.4
These are positive factors that make voting more likely.
11. The second additional factor represents the “costs” associated with voting. These include the effort needed to become informed about the candidates and issues. Such costs are affected by a variety of factors such as the intensity of political campaigns that are largely outside the control of policy makers. But costs also include the time, skill, financial resources, and effort required to overcome the administrative requirements and other barriers to registering to vote and successfully casting a ballot. Although they are not the only factors determining whether a person votes, this latter set of costs are unique in that they are controlled by the state.
12. This “calculus of voting” framework suggests that for many individuals the decision to
vote is made “on the margins.” This is because the decision is viewed as a “low cost, low benefit” calculation.5 Small changes in costs may alter the likelihood of voting dramatically. This means that disruptions to voting practices raise costs and deter participation. Changes to election procedures such as the location of polling places and the dates and hours of their operation have been shown to deter voting.6
Costs are especially consequential for people who suffer sociodemographic disadvantages and for non-habitual voters.
13. The expert report of Professor Stephen Ansolabehere in this case finds that over 1.2 million registered voters in Texas do not have acceptable ID to vote under SB 14. Both black and Latinos are substantially less likely than Anglos to possess acceptable ID.
The Voting Rights Act Amendments of 1982 and the Senate Factors
14. Section 2 of the Voting Rights Act was amended in 1982 as a direct response to the Supreme Court’s decision in City of Mobile v. Bolden (1980).7
4 See David Campbell (2006), Why We Vote: How Schools and Communities Shape Our Civic Life, Princeton, NJ: Princeton University Press. Benny Geys (2006), “‘Rational’ Theories of Voter Turnout: A Review,” Political Studies Review 4(1):16-35. William H. Riker and Peter C. Ordeshook (1968), “A Theory of the Calculus of Voting,” American Political Science Review 62(1):25-42.
The core purpose of the amendments was to clarify that Section 2 does not require proof of discriminatory purposes. Instead, proof that under the “totality of circumstances” the challenged practice “results” in minority citizens having “less opportunity than other members of the electorate to participate in the political process” is sufficient to establish a violation of the law.
5 John H. Aldrich (1993), “Rational Choice and Turnout,” American Journal of Political Science 37(1):246-78. 6 Henry E. Brady and John E. McNulty (2011), “Turnout Out to Vote: The Costs of Finding and Getting to the Polling Place,” American Political Science Review 105(1):1-20. John E. McNulty, Conor M. Dowling, and Margaret H. Ariotti (2009), “Driving Saints to Sin: How Increasing the Difficulty of Voting Dissuades Even the Most Motivated Voters,” Political Analysis 17(4):435-55. Moshe Haspel and H. Gibbs Knotts (2005), “Location, Location, Location: Precinct Placement and the Costs of Voting,” Journal of Politics 67(2):560-73. 7 City of Mobile v. Bolden, 446 U.S. 44 (1980).
Case 2:13-cv-00193 Document 391-1 Filed in TXSD on 07/07/14 Page 5 of 45Case 2:13-cv-00193 Document 671-19 Filed in TXSD on 11/11/14 Page 153 of 207
6
15. The Senate report accompanying the 1982 amendments set out an illustrative list of seven
enumerated factors and two additional (unenumerated) factors that are relevant to consider when evaluating the “totality of the circumstances.” These are often denoted as the Senate factors.
16. The Senate factors include:
1. the extent of any history of official discrimination in the state or political subdivision that touched the right of the members of the minority group to register, to vote, or otherwise to participate in the democratic process; 2. the extent to which voting in the elections of the state or political subdivision is racially polarized; 3. the extent to which the state or political subdivision has used unusually large election districts, majority vote requirements, anti-single shot provisions, or other voting practices or procedures that may enhance the opportunity for discrimination against the minority group; 4. if there is a candidate slating process, whether the members of the minority group have been denied access to that process; 5. the extent to which members of the minority group in the state or political subdivision bear the effects of discrimination in such areas as education, employment and health, which hinder their ability to participate effectively in the political process; 6. whether political campaigns have been characterized by overt or subtle racial appeals; 7. the extent to which members of the minority group have been elected to public office in the jurisdiction.8
17. The Senate also recognized the following “[a]dditional factors that in some cases have had probative value as part of plaintiffs’ evidence to establish a violation”:
• whether there is a significant lack of responsiveness on the part of elected officials to the particularized needs of the members of the minority group [and] • whether the policy underlying the state or political subdivision’s use of such voting qualification, prerequisite to voting, or standard, practice or procedure is tenuous.9
8 Pages 28-29 of Senate Committee on the Judiciary, S. Rep. 97-417, 97th Congress, 2nd Sess. (1982). 9 Page 29 of Senate Committee on the Judiciary, S. Rep. 97-417, 97th Congress, 2nd Sess. (1982).
Case 2:13-cv-00193 Document 391-1 Filed in TXSD on 07/07/14 Page 6 of 45Case 2:13-cv-00193 Document 671-19 Filed in TXSD on 11/11/14 Page 154 of 207

7
18. I have spent considerable time examining the Senate factors, drawing upon my training as a scholar of electoral politics. These factors are important parts of the context in which SB 14 operates. Understanding them is consistent with the widely shared social scientific view that assessing a policy’s effects must take account of the environment in which it is implemented. It is my opinion that the presence of relevant Senate factors in Texas helps to show how and why SB 14 makes it harder for the state’s black and Latino voters to participate equally in the electoral process.
Background on Voter Participation in Texas
19. Before addressing specific Senate factors, I first document patterns of voter turnout in Texas. It is important to understand that the state has a poor record of overall voter participation. Moreover, Latino voter turnout in particular has long lagged behind that of Anglos. In the 2008, 2010, and 2012 elections, Texas ranked 48th, 49th, and 48th out of the 50 states and the District of Columbia in terms of voter turnout.10
In recent presidential and gubernatorial elections, Latino turnout has generally been 15 to 20 percentage points lower than that of Anglos.
20. To be more precise about turnout among racial and ethnic groups is difficult because of data limitations. The State of Texas does not record the races and ethnicities of its voters. Here I present the most common measures, which are drawn from the Census Bureau’s Current Population Survey (CPS). Then I explain why CPS data make racial and ethnic disparities in turnout appear smaller than they really are.
21. CPS turnout rates for the five most recent federal general elections are reported in Table
1.11
These data suggests that black turnout actually matched or surpassed Anglo turnout in 2008 and 2012, but fell below it in 2004, 2006, and 2010. Latino turnout lagged both black and Anglo turnout by a substantial amount all five elections.
10 These rankings are based on data in the Pew Election Performance Index drawn from voter turnout data provided by Professor Michael McDonald, available at http://elections.gmu.edu (last visited June 9, 2014). See http://www.pewstates.org/uploadedFiles/Flash_Library/PCS/Interactives/ElectionsPerformanceIndex/template.html#indicator (last visited May 31, 2014). 11 Non-citizens are excluded from the calculations. Anglos are defined as “white non-Hispanic alone” and blacks are defined as “black alone.” The Census Bureau’s summary report on the 2012 election using CPS data follows this practice but also notes that “Use of the single-race populations does not imply that it is the preferred method of presenting or analyzing data.” See footnote 2 of Thom File (2013), “The Diversifying Electorate—Voting Rates by Race and Hispanic Origins in 2012 (and Other Recent Elections),” Current Population Survey Reports, P20-569, U.S. Census Bureau.
Case 2:13-cv-00193 Document 391-1 Filed in TXSD on 07/07/14 Page 7 of 45Case 2:13-cv-00193 Document 671-19 Filed in TXSD on 11/11/14 Page 155 of 207
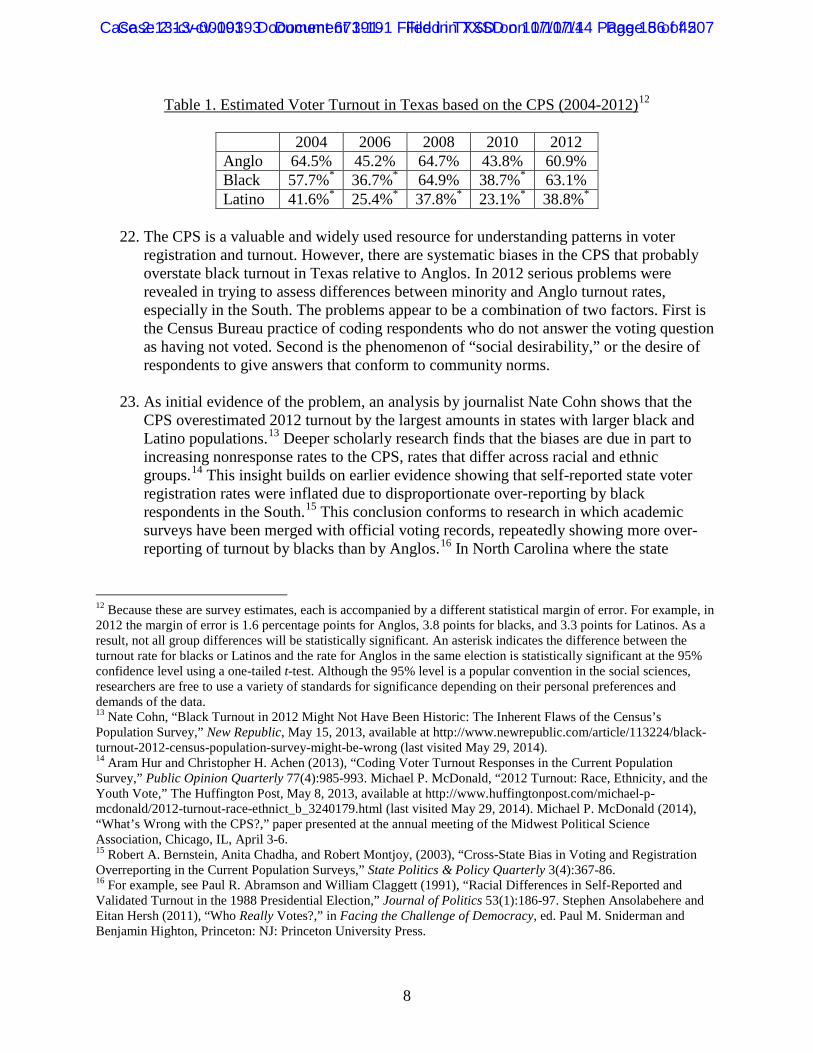
8
Table 1. Estimated Voter Turnout in Texas based on the CPS (2004-2012)12
2004 2006 2008 2010 2012 Anglo 64.5% 45.2% 64.7% 43.8% 60.9% Black 57.7%* 36.7%* 64.9% 38.7%* 63.1% Latino 41.6%* 25.4%* 37.8%* 23.1%* 38.8%*
22. The CPS is a valuable and widely used resource for understanding patterns in voter
registration and turnout. However, there are systematic biases in the CPS that probably overstate black turnout in Texas relative to Anglos. In 2012 serious problems were revealed in trying to assess differences between minority and Anglo turnout rates, especially in the South. The problems appear to be a combination of two factors. First is the Census Bureau practice of coding respondents who do not answer the voting question as having not voted. Second is the phenomenon of “social desirability,” or the desire of respondents to give answers that conform to community norms.
23. As initial evidence of the problem, an analysis by journalist Nate Cohn shows that the
CPS overestimated 2012 turnout by the largest amounts in states with larger black and Latino populations.13 Deeper scholarly research finds that the biases are due in part to increasing nonresponse rates to the CPS, rates that differ across racial and ethnic groups.14 This insight builds on earlier evidence showing that self-reported state voter registration rates were inflated due to disproportionate over-reporting by black respondents in the South.15 This conclusion conforms to research in which academic surveys have been merged with official voting records, repeatedly showing more over-reporting of turnout by blacks than by Anglos.16
12 Because these are survey estimates, each is accompanied by a different statistical margin of error. For example, in 2012 the margin of error is 1.6 percentage points for Anglos, 3.8 points for blacks, and 3.3 points for Latinos. As a result, not all group differences will be statistically significant. An asterisk indicates the difference between the turnout rate for blacks or Latinos and the rate for Anglos in the same election is statistically significant at the 95% confidence level using a one-tailed t-test. Although the 95% level is a popular convention in the social sciences, researchers are free to use a variety of standards for significance depending on their personal preferences and demands of the data.
In North Carolina where the state
13 Nate Cohn, “Black Turnout in 2012 Might Not Have Been Historic: The Inherent Flaws of the Census’s Population Survey,” New Republic, May 15, 2013, available at http://www.newrepublic.com/article/113224/black-turnout-2012-census-population-survey-might-be-wrong (last visited May 29, 2014). 14 Aram Hur and Christopher H. Achen (2013), “Coding Voter Turnout Responses in the Current Population Survey,” Public Opinion Quarterly 77(4):985-993. Michael P. McDonald, “2012 Turnout: Race, Ethnicity, and the Youth Vote,” The Huffington Post, May 8, 2013, available at http://www.huffingtonpost.com/michael-p-mcdonald/2012-turnout-race-ethnict_b_3240179.html (last visited May 29, 2014). Michael P. McDonald (2014), “What’s Wrong with the CPS?,” paper presented at the annual meeting of the Midwest Political Science Association, Chicago, IL, April 3-6. 15 Robert A. Bernstein, Anita Chadha, and Robert Montjoy, (2003), “Cross-State Bias in Voting and Registration Overreporting in the Current Population Surveys,” State Politics & Policy Quarterly 3(4):367-86. 16 For example, see Paul R. Abramson and William Claggett (1991), “Racial Differences in Self-Reported and Validated Turnout in the 1988 Presidential Election,” Journal of Politics 53(1):186-97. Stephen Ansolabehere and Eitan Hersh (2011), “Who Really Votes?,” in Facing the Challenge of Democracy, ed. Paul M. Sniderman and Benjamin Highton, Princeton: NJ: Princeton University Press.
Case 2:13-cv-00193 Document 391-1 Filed in TXSD on 07/07/14 Page 8 of 45Case 2:13-cv-00193 Document 671-19 Filed in TXSD on 11/11/14 Page 156 of 207

9
records the races of voters, I have shown that the CPS overestimated turnout in the 2012 election by only 0.8 percentage points for Anglos but 10.9 percentage points for blacks.17
24. These tendencies were exaggerated in 2012 due to the presence of Barack Obama’s name on the ballot. Enthusiasm in the black community about Obama’s candidacy would have heightened the over-reporting problem as a result of the social desirability of supporting his candidacy.18 Research indicates that over-reporting increases when a black respondent is represented by a black office holder19 or when a black candidate is running.20
25. In summary, the CPS data portray Latino turnout as substantially lower than Anglo turnout in the last five general elections. The CPS portray black turnout as lower in three of the elections and equal to or higher than Anglo turnout only in 2008 and 2012. Yet scholarly research shows that black turnout is generally overstated and would be even more so in 2008 and 2012. It is thus plausible that black and Latino turnout levels have never surpassed those of Anglos in contemporary Texas elections. Even if black turnout did manage to reach parity with Anglo turnout in two elections, it would be a fragile plateau susceptible to disruption by changes in election law.
Senate Factor One
26. Senate Factor One considers whether there is history in the jurisdiction of “official voting-related discrimination.”
27. There is a long history of discrimination against black and Latino voters in Texas. As the
Texas State Historical Association summarizes,
Racial conflict is a basic feature of Texas history. From 1865 onward its primary political manifestation has been the struggle of African Americans to vote, have their ballots fairly counted, elect their preferred candidates, develop effective coalitions with other groups, and thereby achieve equality of opportunity in a white-dominated society that, from its beginning, relegated people of color to the state of an inferior caste.21
17 Sur-rebuttal expert report of Barry C. Burden, May 2, 2014, North Carolina State Conference of the NAACP v. McCrory, No. 1:13-CV-658 (M.D.N.C.).
18 Seth C. McKee, M.V. Hood III, and David Hill (2012), “Achieving Validation: Barack Obama and Black Turnout in 2008,” State Politics and Policy Quarterly 12(1):3-22. 19 McKee, Hood, and Hill (2012). 20 Benjamin J. Deufel and Orit Kedar (2010), “Race and Turnout in U.S. Elections: Exposing Hidden Effects,” Public Opinion Quarterly 74(2):286-318. McKee, Hood, and Hill (2012). Stephen Ansolabehere and Eitan Hersh (2013), “Gender, Race, Age, and Voting: A Research Note,” Politics and Governance 1(2):132-7. 21 Professor Chandler Davidson, “African Americans and Politics,” Handbook of Texas Online, Texas State Historical Association, available at https://www.tshaonline.org/handbook/online/articles/wmafr (last visited June 24, 2014). This statement is based on an extensive bibliography of historical and academic books on race in Texas politics.
Case 2:13-cv-00193 Document 391-1 Filed in TXSD on 07/07/14 Page 9 of 45Case 2:13-cv-00193 Document 671-19 Filed in TXSD on 11/11/14 Page 157 of 207

10
28. These discriminatory activities are undeniable. They include tactics such as voter
intimidation, threats of violence, and even lynching. The conflict also played out in election laws. Rather than reiterate the lengthy history of vote discrimination in Texas, I briefly highlight some key legal examples to put recent developments in perspective.
29. For much of the state’s history, Texas public officials and major party leaders were
openly discriminatory toward black and Latino voters. For minority voters seeking relief in their efforts to be involved in electoral politics, federal legislation and federal courts were often the only recourse.
30. One tool used to exclude minority voters was the “white primary.” Established by state
law in 1923, it banned non-whites from voting in Democratic primary elections. Because Democrats were the dominant political party at the time, the party could essentially dictate who would win the general election via the primary. When the law was invalidated by the U.S. Supreme Court in Nixon. v. Herndon (1927), the state parties adopted rules to ban non-whites.22 The party’s rules were struck down in Nixon v. Condon (1932).23 Not easily deterred, the Democratic state convention adopted a rule to keep non-whites from participating in primaries, a decision initially upheld by the Texas Attorney General and the courts.24 The practice was eventually overturned by Smith v. Allwright (1944).25 Party leaders turned to yet another alternative called the “Jaybird primary” in which a non-party association would initially screen candidates for nomination without allowing non-white voters to participate. This final gimmick was not eliminated until the case of Terry v. Adams (1953).26
Thus ended a 30-year battle in which Texas officials invented a series of mechanisms for excluding minority voters, whose rights were repeatedly protected by federal courts.
31. The other tool used to disenfranchise minority voters in Texas was the poll tax. The tax was added to the Texas constitution in 1902. Under the poll tax, voters were required to pay a fee to register to vote and to present a poll tax receipt in order to cast a ballot, although even that system exempted elderly voters and permitted voters to complete an affidavit at the polling place establishing that they had paid the tax but misplaced the receipt.27
22 Nixon v. Herndon, 273 U.S. 536 (1927).
That cost fell harder on blacks and Latinos, who had fewer financial resources than Anglos. In the midst of the civil rights era, the poll tax was nonetheless reaffirmed by Texas voters, who in a 1963 rejected a constitutional amendment to forbid it. Even after the passage of the VRA, the tax remained in place in state elections until adoption of the 24th Amendment to the U.S. Constitution and the decision in Harper v. Virginia State
23 Nixon v. Condon, 286 U.S. 73 (1932). 24 Grovey v. Townsend, 295 U.S. 45 (1935). 25 Smith v. Allwright, 321 U.S. 649 (1944). 26 Terry v. Adams, 345 U.S. 461 (1953). For a historical review of these cases, see Robert Brischetto, David R. Richards, Chandler Davidson, and Bernard Grofman (1994), “Texas,” in Quiet Revolution in the South: The Impact of the Voting Rights Act 1965-1990, eds. Chandler Davidson and Bernard Grofman, Princeton, NJ: Princeton University Press. 27 Donald S. Strong (1944), “The Poll Tax: The Case of Texas,” American Political Science Review 38(4):693-709.
Case 2:13-cv-00193 Document 391-1 Filed in TXSD on 07/07/14 Page 10 of 45Case 2:13-cv-00193 Document 671-19 Filed in TXSD on 11/11/14 Page 158 of 207
11
Board of Elections (1966).28 Research shows that the lingering effects of the poll tax depressed non-white turnout until at least 1980.29
32. Even when the poll tax was finally eradicated, Texas lawmakers “promptly replaced the tax with an almost equally onerous annual voter registration system.”30 The system, which was eventually ended by Beare v. Smith (1971), required registration during a four-month window that ended almost eight months before the general election.31
A system adopted by the state four years later would have required essentially every Texas resident to re-register, but it was halted under Section 5 of the Voting Rights Act.
33. Finally, federal courts have frequently intervened to correct discriminatory legislative redistricting efforts in Texas. As a review of voting rights litigation by Robert Brischetto and colleagues explains,
The elimination of barriers to voting and registration in Texas did not often result in the election of minority candidates [because of] structural roadblocks, the most notable of which were multimember districts (including at-large elections), racial gerrymandering, and malapportionment.32
34. Following the 1970 reapportionment, the case of White v. Regester (1973) upheld a federal court decision finding intentional discrimination in redistricting through the use of multimember districts.33 After the next round of redistricting, the Attorney General objected to the configurations of two congressional districts under Sections 5 of the VRA.34 More recently, in LULAC v. Perry (2006) the Supreme Court rejected a congressional district for violating Section 2 of the VRA because the legislature had reduced the percentage of Latinos in the district once they were “becoming increasingly politically active and cohesive,” which the Court found to “bear[] the mark of intentional discrimination.”35 Only two years ago, a three-judge federal court found in Texas v. United States (2012) that congressional and state legislative redistricting maps reflected intentional discrimination.36
35. Brief histories of the white primary, the poll tax, voter registration, and redistricting show the inventive ways in which Texas party and public officials have operated to deter
28 Harper v. Virginia State Board of Elections, 383 U.S. 663 (1966). 29 John E. Filer, Lawrence W. Kenny, and Rebecca B. Morton (1991), “Voting Laws, Educational Policies, and Minority Turnout,” Journal of Law and Economics 34(2):371-393. 30 Brischetto et al. (1994), p. 240. 31 Beare v. Smith, 321 F. Supp. 1100 (S.D. Tex. 1971) (three-judge court), aff’d, Beare v. Briscoe, 498 F.2d 244 (5th Cir. 1974) (per curiam). 32 Brischetto et al. (1994), p. 244. 33 White v. Regester, 412 U.S. 755 (1973). 34 Upham v. Seamon, 456 U.S. 37 (1982). 35 LULAC v. Perry, 548 U. S. 399 (2006). 36 Texas. v. United States, 887 F. Supp. 2d 133 (D.D.C. 2012) (three-judge court), vacated on other grounds, 133 S. Ct. 2885 (2013).
Case 2:13-cv-00193 Document 391-1 Filed in TXSD on 07/07/14 Page 11 of 45Case 2:13-cv-00193 Document 671-19 Filed in TXSD on 11/11/14 Page 159 of 207

12
voting by blacks and Latinos. Policy makers in Texas engaged in repeated, purposefully discriminatory devices to deter minority participation and to dilute minority voting strength. Texas fought stubbornly to protect and sustain these practices, even in the face of federal legislation and judgments from federal courts.
Senate Factor Two
36. Senate Factor Two addresses whether voting is “racially polarized.” Following the standard established by the U.S. Supreme Court in Thornburg v. Gingles (1986), racial polarization may be defined as a “consistent relationship between [the] race of the voter and the way in which the voter votes.”37
37. Ethnic and racial polarization in voting patterns is an essential feature of elections in Texas. Exit polls provide insight into the substantial differences in voting preferences across racial and ethnic groups. Since 2002 exit polls have been conducted by the National Election Poll (NEP), a consortium of major television networks and the Associated Press.38 The NEP combines surveys of voters as they leave polling places in combination with select pre-election surveys of early voters. The results are then weighted to match the actual election outcome. Despite their imperfections, exit polls are useful for academic researchers comparing demographic groups. Exit polls reduce problems associated with surveys that take place in the days following an election: misreporting of turnout by nonvoters, faulty memories by respondents, and social desirability effects that appear once it is known who won the election.39
38. Table 2 shows the breakdown of the votes cast for Republican candidates for President or Texas Governor by Anglos, Latinos, and blacks in recent Texas elections. The difference in partisan voting rates between Anglos and Latinos ranges from a low of 13 percentage points in the unusual 2006 election to 38 points in the 2008 election. The gap between Anglos and blacks is more severe, ranging from 28 percentage points in 2006 to a remarkable 71 points in 2008.
37 Thornburg v. Gingles, 478 U.S. 30, 47 (1986). 38 Before 2003 the organization was known as Voter News Services. 39 See Samuel J. Best and Brian S. Krueger (2012), Exit Polls: Surveying the American Electorate, 1972-2010, Thousand Oaks, CA: CQ Press.
Case 2:13-cv-00193 Document 391-1 Filed in TXSD on 07/07/14 Page 12 of 45Case 2:13-cv-00193 Document 671-19 Filed in TXSD on 11/11/14 Page 160 of 207
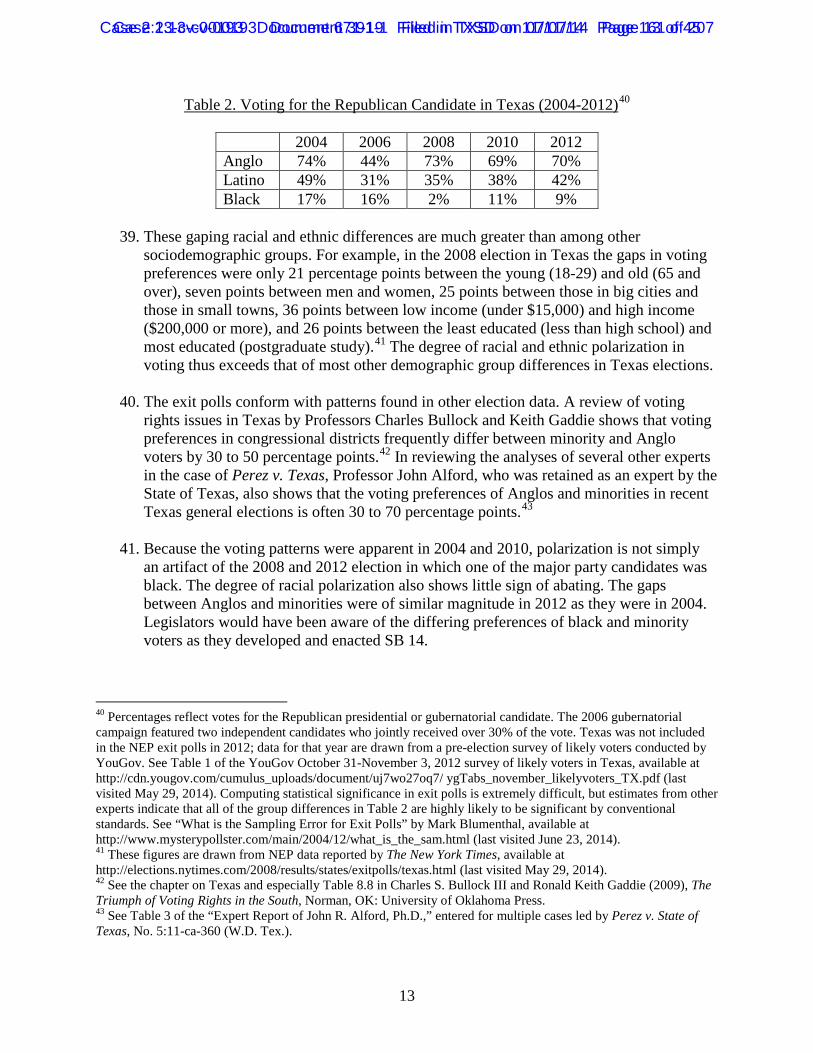
13
Table 2. Voting for the Republican Candidate in Texas (2004-2012)40
2004 2006 2008 2010 2012 Anglo 74% 44% 73% 69% 70% Latino 49% 31% 35% 38% 42% Black 17% 16% 2% 11% 9%
39. These gaping racial and ethnic differences are much greater than among other
sociodemographic groups. For example, in the 2008 election in Texas the gaps in voting preferences were only 21 percentage points between the young (18-29) and old (65 and over), seven points between men and women, 25 points between those in big cities and those in small towns, 36 points between low income (under $15,000) and high income ($200,000 or more), and 26 points between the least educated (less than high school) and most educated (postgraduate study).41
The degree of racial and ethnic polarization in voting thus exceeds that of most other demographic group differences in Texas elections.
40. The exit polls conform with patterns found in other election data. A review of voting rights issues in Texas by Professors Charles Bullock and Keith Gaddie shows that voting preferences in congressional districts frequently differ between minority and Anglo voters by 30 to 50 percentage points.42 In reviewing the analyses of several other experts in the case of Perez v. Texas, Professor John Alford, who was retained as an expert by the State of Texas, also shows that the voting preferences of Anglos and minorities in recent Texas general elections is often 30 to 70 percentage points.43
41. Because the voting patterns were apparent in 2004 and 2010, polarization is not simply an artifact of the 2008 and 2012 election in which one of the major party candidates was black. The degree of racial polarization also shows little sign of abating. The gaps between Anglos and minorities were of similar magnitude in 2012 as they were in 2004. Legislators would have been aware of the differing preferences of black and minority voters as they developed and enacted SB 14.
40 Percentages reflect votes for the Republican presidential or gubernatorial candidate. The 2006 gubernatorial campaign featured two independent candidates who jointly received over 30% of the vote. Texas was not included in the NEP exit polls in 2012; data for that year are drawn from a pre-election survey of likely voters conducted by YouGov. See Table 1 of the YouGov October 31-November 3, 2012 survey of likely voters in Texas, available at http://cdn.yougov.com/cumulus_uploads/document/uj7wo27oq7/ ygTabs_november_likelyvoters_TX.pdf (last visited May 29, 2014). Computing statistical significance in exit polls is extremely difficult, but estimates from other experts indicate that all of the group differences in Table 2 are highly likely to be significant by conventional standards. See “What is the Sampling Error for Exit Polls” by Mark Blumenthal, available at http://www.mysterypollster.com/main/2004/12/what_is_the_sam.html (last visited June 23, 2014). 41 These figures are drawn from NEP data reported by The New York Times, available at http://elections.nytimes.com/2008/results/states/exitpolls/texas.html (last visited May 29, 2014). 42 See the chapter on Texas and especially Table 8.8 in Charles S. Bullock III and Ronald Keith Gaddie (2009), The Triumph of Voting Rights in the South, Norman, OK: University of Oklahoma Press. 43 See Table 3 of the “Expert Report of John R. Alford, Ph.D.,” entered for multiple cases led by Perez v. State of Texas, No. 5:11-ca-360 (W.D. Tex.).
Case 2:13-cv-00193 Document 391-1 Filed in TXSD on 07/07/14 Page 13 of 45Case 2:13-cv-00193 Document 671-19 Filed in TXSD on 11/11/14 Page 161 of 207

14
Senate Factor Five
42. Senate Factor Five assesses the extent to which “minority group members bear effects of discrimination in areas such as education, employment, and health, which hinder their ability to participate effectively in the political process.”
43. Blacks and Latinos suffer severe and enduring disparities in education, health,
employment, income, and transportation in part due to state policies that have done little to remedy glaring inequalities. Stemming in large part from historic legacies of unequal treatment, segregation, and discrimination, Anglos, blacks, and Latinos experience markedly different outcomes in these areas. The state’s history of racial discrimination and disparities bears directly on the impact that voting practices have on the ability of minority voters to participate in the political process and influence the outcomes of elections. I consider a few of the key disparities in education, income, and employment, and explain how they relate to the “calculus of voting.”
44. Anglos and minorities in Texas display enduring gaps in educational attainment. Data
from the U.S. Department of Education show that the high school completion rate among 25 year olds was 91.7% for Anglos, 85.4% for blacks, and 58.6% for Latinos.44
The same data show that rates of bachelor’s degree completion were 33.7% for Anglos, 19.2% for blacks, and 11.4% for Latinos.
45. Numerous studies have shown that educational attainment is usually the single best predictor of whether an individual votes.45 This is largely because education lowers the “costs” of voting by providing a host of benefits. These include the skills to understand public affairs, direct information about the electoral process, access to social networks that facilitate political engagement, and a sense of confidence or efficacy that facilitates participation even when the rules are changed.46
46. There are glaring differences between Anglos and minorities in Texas when it comes to basic income and employment markers.47 For example, Census Bureau data show that while only 12% of Anglos live below the poverty line, 29% of blacks and 33% of Latinos do.48
44 National Center for Education Statistics, Digest of Education Statistics, “Percent of Persons Age 25 and Over with High School Completion or Higher and a Bachelor’s or Higher Degree, by Race/Ethnicity and State: 2008-2010,” available at http://nces.ed.gov/programs/digest/d12/tables/dt12_015.asp (last visited June 3, 2014).
Median household income in Texas is estimated at $63,393 for Anglos but only
45 Steven J. Rosenstone and John Mark Hansen (1993), Mobilization, Participation and Democracy in America, Macmillan. Sidney Verba, Kay Lehman Schlozman, and Henry E. Brady (1995), Voice and Equality: Civic Volunteerism in American Politics, Harvard University Press. Rachel Milstein Sondheimer and Donald P. Green (2010), “Using Experiments to Estimate the Effects of Education on Voter Turnout,” American Journal of Political Science 54(1):174-89. 46 For example, see Sidney Verba, Kay Lehman Schlozman, and Henry E. Brady (1995), Voice and Equality: Civic Volunteerism in American Politics, Cambridge, MA: Harvard University Press. 47 These data are based on the Census Bureau’s American Community Survey 5-year estimates for 2012. 48 The Henry J. Kaiser Family Foundation, “Poverty Rate by Race/Ethnicity,” available at http://kff.org/other/state-indicator/poverty-rate-by-raceethnicity/ (last visited June 3, 2014).
Case 2:13-cv-00193 Document 391-1 Filed in TXSD on 07/07/14 Page 14 of 45Case 2:13-cv-00193 Document 671-19 Filed in TXSD on 11/11/14 Page 162 of 207

15
$37,906 for blacks and $38,848 for Latinos. The unemployment rate is 6.1% for Anglos, 12.8% for blacks, and 8.5% for Latinos. These are stark economic inequalities.
47. Income sharply influences voter participation. Individuals with lower household incomes
are significantly less likely to vote, in part because it is more costly for them to make time to do so.49 Education and income are predictive in large part because they lower the “costs” of voting when the voting habit is interrupted. In part because of other disadvantages they suffer, the unemployed find it much more difficult to overcome the costs of voting.50
48. Individuals with lower incomes are also less likely to own an automobile. Recent Census Bureau data show that the share of households lacking at least one vehicle for transportation is 3.9% for Anglos, 7.0% for Latinos, and 12.9% for blacks.51 Other Census data show that, among workers at least 16 years of age, Anglos are 49% of the population in Texas, they constitute only 28% of those taking public transportation to work.52
In contrast, Latinos comprise 34% of the population but 37% of public transportation users. Blacks are only 11% of the population but 27% of public transportation users. Because they are less likely to drive and own automobiles, minority populations in Texas would have less incentive to hold valid driver licenses. According to the analysis conducted by Professor Ansolabehere, the driver license is the form of SB 14 ID most commonly held by registered voters in Texas.
49. There are significant health disparities between Anglos and minorities in Texas. Based on survey data from the U.S. Centers for Disease Control, blacks and Latinos are much more likely to report being in only “fair” or “poor” health, to lack a personal doctor, to lack health insurance, to have not visited a doctor in the past year due to the cost.53
Many of these disparities are approximately on the order of a ratio of two to one.
50. Scholarly research shows that health influences voter participation in part because it raises costs associated with voting. Research by Professors Lisa Schur, Douglas Kruse, and colleagues shows that having an illness or disability makes the typical person approximately 20 percentage points less likely to vote. Disability often isolates people from social networks that would otherwise draw them into politics, in addition to increasing the direct costs associated with the voting process.54
49 See references in previous footnotes. 50 Kay Lehman Schlozman and Sidney Verba (1979), Injury to Insult: Unemployment, Class, and Political Response, Cambridge, MA: Harvard University Press. 51 2010-2012 American Community Survey 3-year estimates. 52 2008-2012 American Community Survey 5-year estimates. 53 See tables provided by The Henry J. Kaiser Family Foundation, “Texas: Minority Health,” available at http://kff.org/state-category/minority-health/?state=TX (last visited June 3, 2014). 54 Lisa Schur, Todd Shields, Douglas Kruse, and Kay Schriner (2002), “Enabling Democracy: Disability and Voter Turnout,” Political Research Quarterly 55(1):167-90. Lisa Schur, Douglas Kruse, and Peter Blanck (2013), People with Disabilities: Sidelined or Mainstreamed?, New York, NY: Cambridge University Press.
Case 2:13-cv-00193 Document 391-1 Filed in TXSD on 07/07/14 Page 15 of 45Case 2:13-cv-00193 Document 671-19 Filed in TXSD on 11/11/14 Page 163 of 207

16
51. These glaring disparities in life outcomes have a direct bearing on the impact of state election laws on minority voting rates. Decades of political science research demonstrate that voter participation is significantly affected by the same demographic characteristics that so strongly separate Anglos from minorities in Texas. Stated in a different way, there is a strong overlap between the socioeconomic markers that separate Anglos from minorities in Texas and the markers that that allow citizens to bear the costs of voting. As a result, despite the fact that the voter ID requirements imposed by SB 14 appear to be uniform, the law is in fact more burdensome for black and Latino residents because they interact with longstanding and significant disparities in areas such as education, employment, and health.
Senate Factor Seven
52. Senate Factor Seven evaluates “the extent to which members of the minority group have been elected to public office in the jurisdiction.” Blacks and Latinos have long been underrepresented in public life in Texas. Progress has been slow in the wake of the tremendous discrimination that minorities experienced for decades in their effort to be represented in public office. While many of those overt barriers have fallen, minorities generally remain underrepresented.
53. According to 2013 data, blacks hold 11.1% of seats in the Texas state legislature.55
Latinos hold 21.1% of seats in the state legislature. This figures fall below the groups’ shares of the population. Census data from 2012 show that blacks are 13.3% and Latinos are 30.3% of the citizen population in Texas.56 Even these achievements are recent and result largely from four decades of successful redistricting litigation and administrative enforcement under the Voting Rights Act.57
54. The disparities are more severe outside the state legislature. Expanding beyond the state legislature shows that minority groups remain underrepresented in public office. Taking a wide range of federal, state, and local offices into account, one analysis finds that in 2000 only 1.7% of Texas elected officials were black.58 A similar analysis of Latinos in 2003 finds that they comprise approximately 7.1% of Texas elected officials.59
55 The Texas state legislature has a total of 181 seats. The source for these data report only 180 filled seats in 2013, which might be due to a vacancy caused by the death of State Senator Mario Gallegos. “Race and Ethnicity in the Texas Legislature, 1937-2013,” available at http://www.laits.utexas.edu/txp_media/html/leg/features/0304_02/race.html (last visited May 30, 2014). 56 See Table 4b from the 2012 CPS voting and registration report, available at http://www.census.gov/hhes/www/socdemo/voting/publications/p20/2012/tables.html (last visited May 30, 2014). 57 Brischetto et al. (1994), p. 240. 58 “Number of Black Elected Officials in Texas, 1970-2000,” available at http://www.laits.utexas.edu/txp_media/html/vce/features/0503_03/blacks.html (last visited May 30, 2014). 59 “Number of Latino Elected Officials in Texas, 1974-2003,” available at http://www.laits.utexas.edu/txp_media/html/vce/features/0503_04/latinos.html (last visited June 12, 2014). More recent data provided by the National Association of Latino Elected Officials suggests that the percentage has increased to about 9% in recent years: http://www.naleo.org/downloads/NALEO_Ed_Fund_TX_2011.pdf (last visited June 12, 2014).
Case 2:13-cv-00193 Document 391-1 Filed in TXSD on 07/07/14 Page 16 of 45Case 2:13-cv-00193 Document 671-19 Filed in TXSD on 11/11/14 Page 164 of 207

17
55. This underrepresentation matters to minority voters. Political science research has identified underrepresentation as an important condition among the totality of circumstances under which voting laws operate. Such research often finds that minority representation in elective office reduces political alienation among minority constituents and increases minority turnout.60
Second Unenumerated Senate Factor
56. The second unenumerated factor identified in the Senate report is whether the policy is “tenuous.” As the Senate report explains,
If the procedure markedly departs from past practices or from practices elsewhere in the jurisdiction, that bears on the fairness of its impact. But even a consistently applied practice premised on a racially neutral policy would not negate a plaintiff’s showing through other factors that the challenged practice denies minorities fair access to the process.61
57. A substantial discussion is necessary to address this factor. SB 14 is not justified by basic facts about the Texas electorate, is not well designed to improve Texas election processes, and is an abrupt change to voting practices in Texas. Following the calculus of voting theory, the law will impact Texas residents most who have a less-established voting habit and are disadvantaged by demographic characteristics that make it more difficult for them to bear the newly-imposed and unevenly-experienced costs of voting.
58. In addition, the law applies only to in-person voting, which is used more by minority
voters. SB 14 does not apply at all to mail balloting,62
which is used more often by Anglo voters. As such, the law counterintuitively imposes new burdens on voters in the domain where fraud is less likely and racial and ethnic disparities are greater.
60 Lawrence Bobo and Franklin D. Gilliam, Jr. (1990), “Race, Sociopolitical Participation, and Black Empowerment,” American Political Science Review 84(2):377-383. Claudine Gay (2001), “The Effect of Black Congressional Representation on Political Participation,” American Political Science Review 95(3):589-602. Danny Hayes and Seth C. McKee (2012), “The Intersection of Redistricting, Race, and Participation,” American Journal of Political Science 56(1):115-130. Adrian D. Pantoja and Gary M. Segura (2003), “Does Ethnicity Matter? Descriptive Representation in Legislatures and Political Alienation Among Latinos,” Social Science Quarterly 84(2):441-460. Rene R. Rocha, Caroline J. Tolbert, Daniel C. Bowen, and Christopher J. Clark (2010), “Race and Turnout: Does Descriptive Representation in State Legislatures Increase Minority Voting?,” Political Research Quarterly 63(4):890-907. Kenny J. Whitby (2007), “The Effect of Black Descriptive Representation on Black Electoral Turnout in the 2004 Elections,” Social Science Quarterly 88(4):1010-1023. 61 Footnote 177 of Senate Committee on the Judiciary, S. Rep. 417, 97th Cong., 2nd Sess. (1982). 62 I use the terms “mail” and “absentee” interchangeably to indicate ballots that voters return by mail. The practice is also sometimes called “early voting by mail.” In-person voters include those voting on election day and those voting at early voting locations.
Case 2:13-cv-00193 Document 391-1 Filed in TXSD on 07/07/14 Page 17 of 45Case 2:13-cv-00193 Document 671-19 Filed in TXSD on 11/11/14 Page 165 of 207
18
SB 14 Is a Sharp Break with Existing Practices
59. A brief history of recent voter ID requirements demonstrates how quickly and dramatically Texas has ratcheted up the demands on voters. SB 14 goes well beyond the minimum identification requirements in the federal Help America Vote Act of 2002 (HAVA) and lacks most of the ameliorative provisions available even in other states with strict voter ID laws.
60. In 1997, Texas adopted HB 331. This law placed additional demands on voters to
establish their identities. Under HB 331, in addition to executing and affidavit, a registered voter who lacked a registration certificate had to show an acceptable form of ID. The law allowed a wide range of documents to satisfy the ID requirement: Texas driver license, Texas personal ID card, a photo ID that “establishes the person’s identity,” a birth certificate, citizenship papers, U.S. passport, pre-printed checks, mail from a government entity, two other forms of personal identity, or any other ID permitted by the Texas Secretary of State.63
Alternatively, a poll worker could vouch for the voter’s identity.
61. Before SB 331, a Texas voter whose name appeared on the registration list was required to present a voter registration certificate (a non-photo ID mailing from the county elections registrar) or to execute an affidavit stating that he or she does not have the certificate at the polling place when attempting to vote.
62. In 2003, Texas further modified its ID requirements. HB 1549 made minor modifications
to voter identification requirements, mainly to create a class of provisional ballots in compliance with HAVA. Section 303(b) of HAVA requires states to verify the identities of in-person voters who have registered by mail and either (1) have not previously voted in a federal election in the state of registration or (2) have not previously voted a federal election in the specific jurisdiction of registration if the state does not have a HAVA-compliant computerized voter registration list. For this limited set of voters, acceptable identification is defined as a current and valid photo identification (not necessarily a driver license or state ID), utility bill, bank statement, government check, paycheck, or other government document showing the voter’s name and address. Repeat voters or those who registered in person are not required under HAVA to present identification to vote.
63. As of May 2014, 19 states and the District of Columbia still operate with the minimum
HAVA requirements and thus do not require most voters to produce ID to vote.64
63 Texas Election Code § 63.0101.
States that do not require ID cover a wide range of regions and demographics, including states such as New Mexico, Minnesota, Nebraska, and West Virginia. There is no evidence that vote fraud or even public belief in vote fraud is more common in these states. I return to this point later in the report.
64 National Conference of State Legislatures, “Voter Identification Requirements,” available at http://www.ncsl.org/research/elections-and-campaigns/voter-id.aspx (last visited May 27, 2014).
Case 2:13-cv-00193 Document 391-1 Filed in TXSD on 07/07/14 Page 18 of 45Case 2:13-cv-00193 Document 671-19 Filed in TXSD on 11/11/14 Page 166 of 207

19
64. In contrast, SB 14 represents a sharp escalation to voter ID requirements in Texas and
replaces existing laws, even though they were not shown to be inadequate. SB 14 imposed substantially stricter requirements than the only two strict photo voter ID laws in place at the time that Texas enacted it: Indiana and Georgia. Even among the small set of states with strict voter ID laws now in place, Texas stands out as especially stringent.
65. The National Conference of State Legislatures (NCSL) lists seven other states as having
“strict photo ID” laws and three other states as having “strict non-photo ID laws.”65
The NCSL listing also suggests that Alabama could be labeled as a “strict photo ID” state. To this list I add South Carolina because it enumerates a limited set of acceptable photo IDs for voting. This results in a set of 12 state voter ID laws that might be seen to as appropriate comparators to SB 14.
66. Reviewing the details of the laws in these 12 states reveals that a number of them have adopted a variety of provisions to mitigate the harsh impact that a strict ID law might otherwise have on voters. These states demonstrate that it is possible to have a strict voter ID regime that is much more accommodating of the costs of voting. Texas legislators were well aware of these ameliorative options and chose to exclude nearly all of them.
67. SB 14 enumerates seven specific forms of ID that may be used for voting. Some states
with strict photo voter ID laws and strict non-photo ID laws instead prescribe requirements for acceptable IDs, rather than limiting voter to a small enumerated set. For example, Arizona, Indiana, Mississippi, Ohio, and Virginia require only that the photo ID be issued by the federal government or the state government. Georgia allows any photo ID card issued by the state or the federal government or an employee ID with a photograph issued by the federal government, the State, or any county, municipality, board, authority or other entity of the state. Alabama, Kansas, and Tennessee go further and allow voters to present IDs issued by other states. Arizona allows for use of two non-photo IDs with the name and address of the voter instead of a photo ID. SB 14 allows none of these options.
68. SB 14 does not permit student IDs for purposes of voting, even those issued by public
colleges and universities in the state. This prohibits use of IDs certain to be held a large group of residents enrolled in postsecondary institutions. In contrast, several other strict ID states allow student IDs. Strict ID states such as Georgia, Indiana, and Mississippi allow ID from state colleges and universities. Alabama, Arkansas, Kansas, and Virginia allow student IDs from both public and private universities. SB 14 omits all of these forms of ID.
65 National Conference of State Legislatures, “Voter Identification Requirements,” available at http://www.ncsl.org/research/elections-and-campaigns/voter-id.aspx (last visited May 27, 2014). Virginia is included because its voter ID law is effective on July 1, 2014. New Hampshire and North Carolina are not included because their voter ID laws do not go into effect until 2015 and 2016, respectively.
Case 2:13-cv-00193 Document 391-1 Filed in TXSD on 07/07/14 Page 19 of 45Case 2:13-cv-00193 Document 671-19 Filed in TXSD on 11/11/14 Page 167 of 207

20
69. SB 14 requires that IDs have not expired more than 60 days before the election (allowing only the narrow exceptions described above). Other strict ID states tend to be more forgiving. Alabama only requires that IDs have not expired more than four years before the election. Mississippi allows IDs to be expired up to 10 years. Georgia and Tennessee allow IDs to be indefinitely expired. Kansas does not require that IDs include expiration dates at all. SB 14 does not allow for any of these alternatives.
70. It is notable that SB 14 permits use of a citizenship certificate, which lacks an expiration
date. Other strict voter ID states allow for IDs that are either expired or lack expiration dates. For purposes of establishing a voter’s identity, there is not a consistent rationale for requiring that the ID not be expired.
71. SB 14 does not permit use of tribal IDs. This is despite the fact that there are three
federally recognized tribes in Texas, as well as one tribe recognized only by the State.66
Tribal IDs may be used for voting in strict ID states including Alabama, Arizona, Georgia, Mississippi, and North Dakota. SB 14 excludes this option.
72. Several strict ID states permit an even wider range of IDs for voting. Virginia allows use of employee ID cards from private employers. In Kansas, a voter may present a public school district employee ID, public high school student ID, city library card, emergency management card, or municipal pool pass.67
Missouri and Ohio permit a voter to show a utility bill, bank statement, or government paycheck. SB 14 prohibits all of these alternative means to establish identity.
73. South Carolina allows a voter who faced a “reasonable impediment” to obtaining an acceptable photo ID to vote after signing an affidavit.68 Indiana and Tennessee also have exemptions for voters who cannot obtain ID because they are indigent.69
SB 14 does not allow for these options.
74. Alabama permits a voter to cast a regular ballot if two election officials can sign sworn statements saying that they know the voter. SB 14 does not permit poll workers to vouch for a voter who lacks ID, even if the poll workers can establish a voter’s identity through personal knowledge.
75. Strict voter ID states generally have a location to obtain a free state ID for the purposes of voting in every county. For example, in Alabama, residents may generally register to vote, apply for free voter IDs, and cast early ballots at a county clerk’s office. Every
66 The Alabama-Coushatta, Kickapoo Traditional, and Yseta Del Sur Pueblo are recognized by the United States. The Lipan Apache tribe is recognized only by Texas. See http://www.ncsl.org/research/state-tribal-institute/list-of-federal-and-state-recognized-tribes.aspx (last visited June 19, 2014). 67 “Photographic Identification Frequently Asked Questions,” available at http://www.gotvoterid.com/pdf/FAQs_for_PhotoID.pdf (last visited June 10, 2014). 68 The voter technically casts a provisional ballot, but the ballot will be counted with regular ballots as long as the voter presents a registration card and the county election commission does not deem the affidavit as false. 69 In both states, the voter casts a provisional ballot, but the ballot will be counted if the voter returns to the election board and executes an affidavit to this effect.
Case 2:13-cv-00193 Document 391-1 Filed in TXSD on 07/07/14 Page 20 of 45Case 2:13-cv-00193 Document 671-19 Filed in TXSD on 11/11/14 Page 168 of 207
21
county in Arkansas has a county clerk. In Georgia, free voter ID cards are issued by both the Department of Driver Services and county registrars. Every county has a registrar. Moreover, early voting generally takes place at the registrar’s office. In Indiana, free state ID cards are distributed by the Indiana Bureau of Motor Vehicles, which has an office in every county. In Mississippi, voter ID cards are available for free at the offices of circuit clerks, where they can also verify birth certificate information from multiple states free of charge, and where absentee voters may also cast their ballots. Every county has at least one circuit clerk. SB 14 does not guarantee that each county provides access to free state IDs.
76. At present, only 189 out of 254 Texas counties have TxDPS locations. That is, more than
25% of counties lack the office that distributes state IDs for purposes of voting.70 Sixty-one counties have voluntarily agreed to process EIC applications through other offices such as the county clerk, sheriff, or judge.71 Affidavits from representatives in 44 of these counties indicates that they have delivered few EICs and their future participation remains voluntary.72
77. A somewhat unique feature of SB 14 compared to other strict voter ID laws is that it allows a voter to use citizenship papers as ID to vote. However, this accommodation is of limited value because few residents are likely to carry citizenship documentation with them in the way that other IDs are routinely carried. The U.S. Certificate of Naturalization (Form N-550) and Certificate of Citizenship (Form N-560) are printed on 8.5 by 11 inch paper, making them much larger than other IDs. This makes the forms inconvenient to carry in a pocket, wallet, or purse. In addition, the certificate is valuable and a replacement is difficult to obtain. The replacement fee is $345, and obtaining a replacement may require an interview with the Department of Homeland Security.73
As a result, holders of these documents have an incentive to keep them secure but not necessarily easily accessible locations.
78. When SB 14 was being crafted, the legislature had the opportunity to incorporate ameliorative provisions available in other strict voter ID states. Figure 1 lists ameliorative provisions that were either omitted from SB 14 or rejected from inclusion in SB 14. Legislators tabled or rejected a series of amendments to include many of these provisions. These amendments would have waived fees for people unable to afford documents needed to acquire an EIC, funded the expenses of Texans who must travel to obtain an EIC, included student IDs and Medicare IDs as acceptable forms of ID, required TxDPS locations to be open in the evenings and on weekends, and allowed poor voters to cast
70 Texas Department of Public Safety, Search for Driver License Offices, available at http://www.txdps.state.tx.us/administration/driver_licensing_control/rolodex/search.asp (last visited June 10, 2014). 71 TxDPS, “County Locations Issuing Election Identification Certificates,” available at http://www.txdps.state.tx.us/DriverLicense/documents/EICCountyrun.pdf (last visited June 19, 2014). 72 These declarations have been included in an appendix to the report of Professor Gerald Webster in this case. 73 Form N-565 Instructions, available at http://www.uscis.gov/sites/default/files/files/form/n-565instr.pdf (last visited June 24, 2014).
Case 2:13-cv-00193 Document 391-1 Filed in TXSD on 07/07/14 Page 21 of 45Case 2:13-cv-00193 Document 671-19 Filed in TXSD on 11/11/14 Page 169 of 207
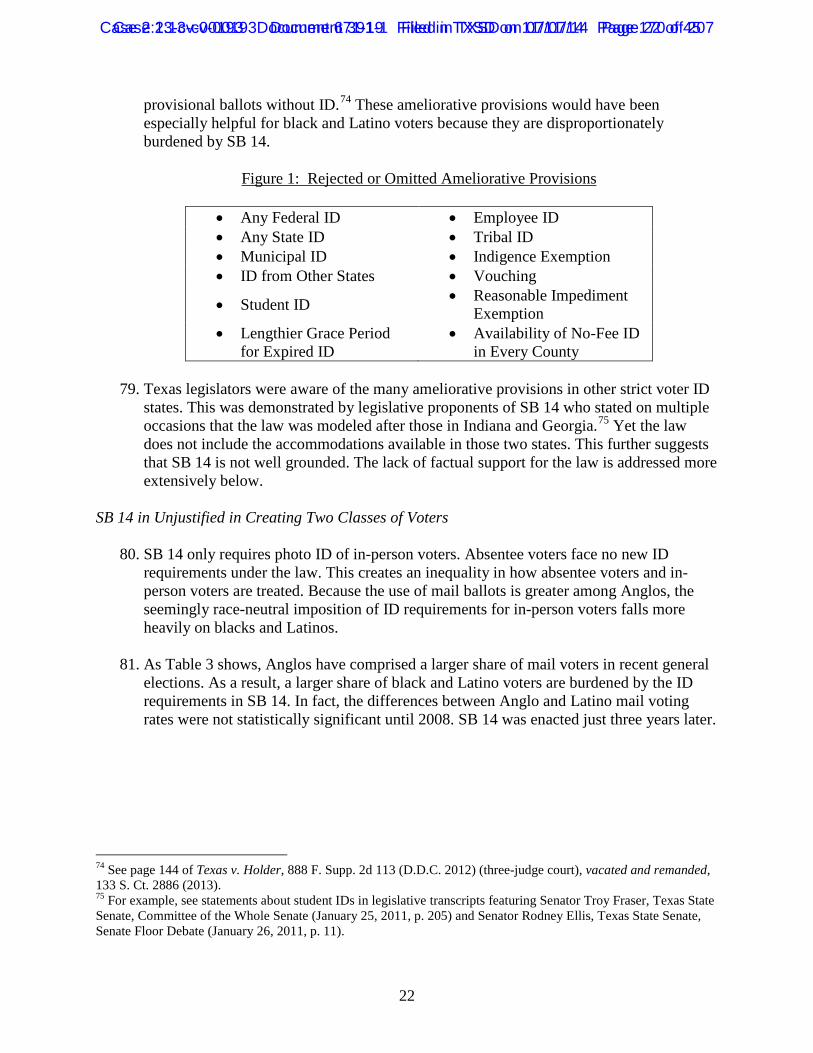
22
provisional ballots without ID.74
These ameliorative provisions would have been especially helpful for black and Latino voters because they are disproportionately burdened by SB 14.
Figure 1: Rejected or Omitted Ameliorative Provisions
• Any Federal ID • Employee ID • Any State ID • Tribal ID • Municipal ID • Indigence Exemption • ID from Other States • Vouching
• Student ID • Reasonable Impediment Exemption
• Lengthier Grace Period for Expired ID
• Availability of No-Fee ID in Every County
79. Texas legislators were aware of the many ameliorative provisions in other strict voter ID
states. This was demonstrated by legislative proponents of SB 14 who stated on multiple occasions that the law was modeled after those in Indiana and Georgia.75
Yet the law does not include the accommodations available in those two states. This further suggests that SB 14 is not well grounded. The lack of factual support for the law is addressed more extensively below.
SB 14 in Unjustified in Creating Two Classes of Voters
80. SB 14 only requires photo ID of in-person voters. Absentee voters face no new ID requirements under the law. This creates an inequality in how absentee voters and in-person voters are treated. Because the use of mail ballots is greater among Anglos, the seemingly race-neutral imposition of ID requirements for in-person voters falls more heavily on blacks and Latinos.
81. As Table 3 shows, Anglos have comprised a larger share of mail voters in recent general
elections. As a result, a larger share of black and Latino voters are burdened by the ID requirements in SB 14. In fact, the differences between Anglo and Latino mail voting rates were not statistically significant until 2008. SB 14 was enacted just three years later.
74 See page 144 of Texas v. Holder, 888 F. Supp. 2d 113 (D.D.C. 2012) (three-judge court), vacated and remanded, 133 S. Ct. 2886 (2013). 75 For example, see statements about student IDs in legislative transcripts featuring Senator Troy Fraser, Texas State Senate, Committee of the Whole Senate (January 25, 2011, p. 205) and Senator Rodney Ellis, Texas State Senate, Senate Floor Debate (January 26, 2011, p. 11).
Case 2:13-cv-00193 Document 391-1 Filed in TXSD on 07/07/14 Page 22 of 45Case 2:13-cv-00193 Document 671-19 Filed in TXSD on 11/11/14 Page 170 of 207

23
Table 3. Voters Voting by Mail in Texas (2004-2012)76
2004 2006 2008 2010 2012 Anglo 5.2% 3.9% 6.3% 6.1% 6.2% Black 4.7% 5.5% 2.9%** 4.7% 5.2% Latino 3.7% 5.9% 2.0%** 3.9%* 3.5%**
82. The unequal treatment of in-person and mail voters under SB 14 thus compounds
differences in the degree to which minority voters hold the IDs needed to vote in person. A larger share of black and Latino voters will need to secure ID under SB 14, despite the fact that they have fewer of the resources needed to do so.
83. Professor Stephen Ansolabehere’s expert report shows that blacks and Latinos are less
likely to possess acceptable ID under SB 14. Applying ecological regression to data from the Texas Election Administration Management (TEAM) database maintained by the State of Texas, he found that the share lacking ID was 5.3% for Anglos, 8.8% for Latinos, and 13.2% for Blacks. Applying the racial categorization algorithm used by Catalist to the TEAM database yielded similar rates of 7.3% for Anglos, 11.1% for Latinos, and 15.0% for blacks. Creating two classes of voters thus places a greater burden on minority voters because they are more likely to lack ID to vote under SB 14 and are more likely to vote in person rather than by mail.
84. Black and Latino voters are less likely than Anglo voters to possess the identification
necessary to cast a regular in-person ballot. As a result, they will be more likely than Anglos to be required to apply for Election Identification Certificates (EICs). As with driver licenses and personal ID cards, EICs are distributed through the Department of Public Safety (TxDPS). To be eligible for an EIC, a person must be eligible to vote, a U.S. citizen, at least 17 years and 10 months old, and a resident of Texas. To demonstrate citizenship a person must provide a U.S. passport, birth certificate, or certification of citizenship (although possession of a valid passport or a citizenship certificate with a photograph would eliminate the need for an EIC). To demonstrate identity, a person must present (1) an expired Texas driver license or ID card, (2) two of the following: birth certificate or citizenship papers, or (3) a birth certificate or citizenship papers without a photograph along with one of 28 other supporting documents.77
85. These transactions must be conducted in person at a TxDPS office. The availability of
these offices and the cost of documents are crucial in determining how much SB 14 76 Data are drawn from the Current Population Survey (CPS) November voting and registration supplements. Percentages are weighted by the variable PWSSWGT. This “basic CPS weight” adjusts for respondent selection probabilities affected by nonresponse and demographic factors including age, race, sex, and state of residence. See “Current Population Survey, November 2012 Voting and Registration Supplement File, Technical Documentation, CPS—12.” Asterisks indicate differences between the mail voting rate for blacks or Latinos and the rate for Anglos in the same election are statistically significant at either the 90% (*) or 95% (**) confidence level using a one-tailed t-test. 77 A detailed list is available at http://www.txdps.state.tx.us/DriverLicense/eicDocReqmnts.htm (last visited May 30, 2014).
Case 2:13-cv-00193 Document 391-1 Filed in TXSD on 07/07/14 Page 23 of 45Case 2:13-cv-00193 Document 671-19 Filed in TXSD on 11/11/14 Page 171 of 207

24
deters minority voter participation. As noted above, roughly one in four counties lacks a TxDPS office. Those that do have offices may have limited availability. For example, Culberson County, which is more than 75% Latino, has one DPS location, which is only open on Wednesdays 9:00 a.m. to 1:00 p.m. and 2:00 p.m. to 5:00 p.m., or seven hours per week. The Secretary of State and TxDPS have offered mobile stations in a number of counties to provide greater access to EICs. However, many of the stations are present in a county only for one day, which appears insufficient for servicing a county population that lacks ready access to a TxDPS office.
86. A common form of documentation needed to obtain ID for voting under SB 14 is the
birth certificate. The State of Texas generally charges $22.00 for a birth certificate. Texas Administrative Code, Title 25, § 181.22(t) states that non-statutory birth certificate fees shall be waived for the purpose of obtaining an EIC, although a surcharge of $2.00 may still be imposed. It thus appears that birth certificate might be available at below the $22.00 standard, but neither the state nor local officials have adopted specific provisions to publicize this option.78 For example, the state’s web sites describing how to obtain birth certificates79 and EICs80
fail to provide information about the partial fee waiver.
87. The applicant for a Texas birth certificate must also provide ID. Acceptable identification includes a “primary” source such as an unexpired driver license, government ID card, or military ID or two “secondary” sources such as student ID, a primary source that is expired, a signed Social Security card, passport, Medicare or Medicaid card, or employee ID card.81 This circular set of rules will create a “Catch-22” for many people. If a voter is applying for an EIC because he or she lacks the other forms of ID needed to vote under SB 14, then the voter will also lack of many of the forms of ID need to obtain the EIC. For example, one form of acceptable secondary ID is a Social Security card. To obtain a replacement Social Security card, a person must present a form of identification that includes a name, birthdate or age, and preferably a recent photograph. Examples include a driver license, passport, medical card, medical record, employee ID, student ID, and life insurance policy.82
It would not be easy for many of the voters who lack the documentation needed to obtain a birth certificate to muster the documentation needed to obtain an EIC and vice versa.
88. Even if Texas distributed birth certificates for free, a large share of the state’s population would not benefit because they were born elsewhere. Approximately 40% of Texas residents were born out of state.83
78 Deposition of Victor Farinelli, Electronic Registration Manager, Texas Department of State Health Services Vital Statistics Unit, May 9, 2014, p. 116.
In addition, more than 1.3 million Texans are both U.S.
79 See http://www.dshs.state.tx.us/vs/reqproc/certified_copy.shtm (last visited June 13, 2014). 80 See http://www.dps.texas.gov/DriverLicense/electionID.htm (last visited June 13, 2014). 81 Texas Administrative Code, Title 25, § 181.1. 82 Social Security Administration, available at https://faq.ssa.gov/ics/support/kbanswer.asp?deptID=34019&task=knowledge&questionID=3609 (last visited June 5, 2014). 83 U.S. Census Bureau, “Lifetime Mobility in the United States: 2010.”
Case 2:13-cv-00193 Document 391-1 Filed in TXSD on 07/07/14 Page 24 of 45Case 2:13-cv-00193 Document 671-19 Filed in TXSD on 11/11/14 Page 172 of 207

25
citizens and were born in another country.84
Acquiring a birth certificate from another state or country—if the certificate even exists—could well be more difficult and expensive than buying one from the State of Texas. Because of their greater mobility, lower rates of ID holding, and few resources, it is likely that blacks and Latinos in particular will find themselves in a sort of “revolving door” in which they lack the documentation and resources needed to procure one of the limited forms of ID to vote under SB 14.
89. Professor Ansolabehere’s expert report calculates that 1.1 million registered voters in Texas lack accepted ID to vote under SB 14. That figure is even larger if one includes the additional 2.5 million people estimated to be eligible but not yet registered to vote.85
These people not only must devote time and effort to become informed about the process. They must also pay literal financial costs to obtain necessary documentation required by SB 14.
SB 14 is Not Well Reasoned and Will Have Little Effect on Voter Fraud
90. SB 14 is not well-designed if its aim is to address the state’s purported interest in reducing voter fraud or to boost public confidence in elections. By limiting the law’s application to in-person votes, it counter-intuitively imposes new burdens on the form of voting that is least susceptible to fraud.
91. In-person voter fraud is extremely rare in Texas elections. A thorough analysis of voter
fraud allegations by News21, an investigative reporting project based at Arizona State University, shows little evidence of in person voter impersonation. For the period from 2000 to 2012, the database lists only one conviction of a voter and two other pending cases.86 Similarly, a report by Texas Attorney General Gregory Abbott listed 66 cases of “voting irregularities” investigated by his office between 2004 and 2012, but at most only six cases involved charges of in-person voter impersonation or related crimes.87 Based on the testimony of Major Forest Mitchell from the Special Investigations Office of the Texas Attorney General’s office, it is not apparent that any of those would have been prevented by SB 14.88
84 Data are from the American Community Survey 2012. The 1-year, 3-year, and 5-year estimates range between 1.34 and 1.44 million people. Many such individuals will possess a citizenship certificate, but some may have lost the certificate and lack the resources to obtain a duplicate.
85 Professor Michael McDonald estimates the 2012 voting eligible population to be 16,100,196 (see http://elections.gmu.edu/Turnout_2012G.html, last visited June 25, 2014). Professor Ansolabehere’s expert report in this case estimates there are 13,515,671 registered voters in Texas. This leaves approximately 2.5 million people who are eligible to vote but not registered. 86 This is based on the Texas cases listed in the “Election Fraud in America” database, available http://votingrights.news21.com/interactive/election-fraud-database/ (last visited May 29, 2014). 87 Wayne Slater, “Few Texas Voter-Fraud Cases Would Have Been Prevented by Photo ID Law, Review Shows,” The Dallas Morning News, September 8, 2013, available at http://www.dallasnews.com/news/politics/headlines/20130908-few-texas-voter-fraud-cases-would-have-been-prevented-by-photo-id-law-review-shows.ece (last visited May 28, 2014). 88 Trial Testimony of Forest Mitchell, Special Investigations Office, Office of the Texas Attorney General, July 9, 2012, pp. 49-69.
Case 2:13-cv-00193 Document 391-1 Filed in TXSD on 07/07/14 Page 25 of 45Case 2:13-cv-00193 Document 671-19 Filed in TXSD on 11/11/14 Page 173 of 207

26
92. To put these numbers in perspective, in the seven general elections in Texas between
2000 and 2012 there were over 43,000,000 ballots cast.89
Even setting aside the millions of ballots cast in primary, municipal, and special elections, the frequency of crimes that SB 14 would address is miniscule.
93. Several elected officials who played central roles in the passage and implementation of SB 14 appear either to be misinformed about the nature of the law or to be purposely spreading false information. Misportrayals of the law by its advocates provide further evidence that its purported justifications are “tenuous” within the meaning of the Senate Factor.
94. Attorney General Gregory Abbott has misstated the effects of the law. To defend SB 14,
he highlighted that federal officials “arrested a Texas woman for illegally voting five times in a state election.”90
But SB 14 would have done nothing to prevent that behavior: the person was accused of mailing multiple absentee ballots and nothing in SB 14 would prevent her from doing so again because SB 14 does not require ID to cast an absentee ballot.
95. SB 14 focuses on a rare form of election crime while ignoring where vote fraud more frequently occurs: through absentee ballots. Political scientist John Fortier, now at the Bipartisan Policy Center, summarizes the prevailing view among political scientists and policy analysts. His treatment of this issue is worth quoting at length:
While there will always be disagreement over the seriousness of election fraud in general, both sides to this argument agree on one important matter: The most likely avenue for voter fraud is absentee balloting, which offers more opportunities for it than the traditional polling place. . . . At a polling place today, the ballot is secure. Voters must present themselves and at least declare who they are in person. In many states, they may have to show a form of identification. The ballot is not to be handled by poll workers, other voters, party officials, spouses, relatives, or companions of the voter. The voter casts or deposits the ballot without assistance, in a privacy booth or curtained stall that allows him or her to do so in complete secrecy. No one can influence the voter while voting, not see the completed ballot. . . . Absentee ballots have none of these protections. 91
89 See data provided by Professor Michael McDonald’s United States Elections Project, available at http://elections.gmu.edu/voter_turnout.htm (last visited May 28, 2014). 90 “Attorney General Abbott Statement on DOJ Lawsuits Challenging Texas Voter ID and Redistricting Laws,” available at https://www.texasattorneygeneral.gov/oagNews/release.php?id=4507 (last visited June 9, 2014). 91 John C. Fortier (2006), Absentee and Early Voting: Trends, Promises, and Perils, Washington, DC: The AEI Press.
Case 2:13-cv-00193 Document 391-1 Filed in TXSD on 07/07/14 Page 26 of 45Case 2:13-cv-00193 Document 671-19 Filed in TXSD on 11/11/14 Page 174 of 207
27
96. Senator Troy Fraser, the chief sponsor of SB 14, appeared unaware of the effect of existing provisions in Texas law for addressing voter fraud. During the Senate debate, Fraser was asked several questions by Senator Juan Hinojosa. Sen. Hinojosa: Do you know how many people are registered to vote here in the State
of Texas? Sen. Fraser: Oh, I do—I’m sorry. I do not know. Sen. Hinojosa: Approximately, 13 million. . . . And do you know how many voted in
the last election? Sen. Fraser: No. I’m not advised on that either. I’m sorry. Sen. Hinojosa: Close to 5 million voters voted this last election. And do you know how
many people were arrested or prosecuted or indicted for trying to use somebody else’s voter registration card?
Sen. Fraser: I’m sorry, not—no. I do not have that number. Sen. Hinojosa: None? Sen. Fraser: I don’t—I don’t have the number, I’m sorry. I’m not advised. (p. 240).92
It is probable that more knowledge about the efficacy of existing election law would have steered the legislature toward a rather different law than is represented in SB 14.
97. The stated purposes of SB 14 are unsupported by evidence. State Representative Patricia Harless, the lead House sponsor of SB 14, asserted in her opening statement in favor of the bill that “this is about restoring confidence in election process” (p. 911). She further explained that “This [bill] will increase turnout of all voters because of the restored confidence that their vote counts” (p. 919).93
These statements are contrary to scholarly research on the relationship between strict voter ID laws and public confidence.
98. Even if public confidence in Texas elections needed to be “restored,” political science research shows that there is no relationship between the strictness of state voter ID laws and voter confidence. Based on analysis of national surveys conducted in 2006, 2007, and 2008, Professor Stephen Ansolabehere concludes that:
ID laws will have little or no effect on the confidence in the electoral system or the belief in the incidence of fraud. Those beliefs, wherever they come from, are no different when a stricter ID law in in place and enforced than when less invasive voter-authentication methods are used.
92 Senate Committee of the Whole Transcript, January 25, 2011. 93 Texas House of Representatives Journal, 82nd Legislature.
Case 2:13-cv-00193 Document 391-1 Filed in TXSD on 07/07/14 Page 27 of 45Case 2:13-cv-00193 Document 671-19 Filed in TXSD on 11/11/14 Page 175 of 207

28
(p. 130).94
He summarizes that an individual’s “Belief in the frequency of election fraud is uncorrelated with the propensity to vote” (p. 129). Related research Ansolabehere conducted with law Professor Nathaniel Persily similarly finds that:
[T]here is little or no relationship between beliefs about the frequency of fraud and electoral participation. . . . Nor does it appear to be the case that universal voter identification requirements will raise levels of trust in the electoral process.
(p. 1759).95
99. Voter confidence is affected by factors other than ID laws. The most relevant of these is whether a person voters by mail or in person. Research by Professor Paul Gronke shows that rather than being influenced by voter ID laws, voter confidence is improved when a voter’s preferred candidate won the election, when polling places appear to be well-run, and—importantly for SB 14—when a voter votes in person rather than by mail.96 Research by Professors Michael Alvarez, Thad Hall, and Morgan Llewellyn also finds that mail voters are less confident than polling place voters that their ballots are counted properly.97
100. Counter-intuitively, SB 14 creates two classes of voters by imposing ID requirements on in-person voters but not on those who vote by mail, even though mail voters report less confidence in the election system. This inequality runs counter to professional understandings of where vote fraud is mostly likely to occur and imposes heavier burdens on black and Latinos voters.
101. SB 14 is lacking in a factual basis because it imposes new burdens on in-person voters
but not those who vote by mail. This is despite the clear evidence that mail ballots are less secure and that mail ballot voters are less confident about the election system. This detachment from the facts about vote fraud imposes greater burdens on in-person voters who are disproportionately black and Latino.
94 Stephen Ansolabehere (2009), “Effects of Identification Requirements on Voting: Evidence from the Experiences of Voters on Election Day,” PS: Political Science & Politics 42(1):127-130. 95 Stephen Ansolabehere and Nathaniel Persily (2008), “Vote Fraud in the Eye of the Beholder: The Role of Public Opinion in the Challenge to Voter Identification Requirements,” Harvard Law Review 121(7):1737-1774. 96 Paul Gronke (forthcoming August 2014), “Voter Confidence as a Metric of Election Performance,” in Barry C. Burden and Charles Stewart III, eds., The Measure of American Elections, New York, NY: Cambridge University Press. 97 R. Michael Alvarez, Thad E. Hall, and Morgan H. Llewellyn (2008), “Are Americans Confident Their Ballots Are Counted?,” Journal of Politics 70(3):754-766.
Case 2:13-cv-00193 Document 391-1 Filed in TXSD on 07/07/14 Page 28 of 45Case 2:13-cv-00193 Document 671-19 Filed in TXSD on 11/11/14 Page 176 of 207

29
Conclusion
102. I conclude that the implementation of SB 14 will likely have a differential impact on voting participation by blacks and Latinos in Texas. The law disproportionately increases the costs of voting on minority voters for whom voting is already significantly more costly. The law is not well reasoned and lacks a basis in fact. SB 14 does not include the ameliorative provisions that exist in strict voter ID laws in other states after which the law is presumably modeled. SB 14 is not designed to confront the most common forms of voter fraud and will not raise public confidence in the system. It creates two classes of voters, requiring more of in-person voters who are disproportionately black and Latino. The law thus is not realistically linked to a valid state interest and imposes unequal burdens on minorities to comply. This is precisely the kind of action that Section 2 of the Voting Rights Act was designed to prevent. For all of the reasons outlined above, it is my opinion that the law will result in minority voters being denied an equal opportunity to participate in, and influence the outcome of, elections in Texas.
Case 2:13-cv-00193 Document 391-1 Filed in TXSD on 07/07/14 Page 29 of 45Case 2:13-cv-00193 Document 671-19 Filed in TXSD on 11/11/14 Page 177 of 207

I declare under penalty of perjury the foregoing is true and correct. Executed this 5{A day ofJuIy,2014.
Case 2:13-cv-00193 Document 391-1 Filed in TXSD on 07/07/14 Page 30 of 45Case 2:13-cv-00193 Document 671-19 Filed in TXSD on 11/11/14 Page 178 of 207
APPENDIX A Curriculum Vitae
Barry C. Burden
Contact University of Wisconsin-Madison [email protected] Department of Political Science http://faculty.polisci.wisc.edu/bburden 1050 Bascom Mall phone: 608-263-6351 301 North Hall fax: 608-265-2663 Madison, WI 53706-1316 Academic Positions Professor of Political Science, University of Wisconsin-Madison (2006-present)
Associate Chair/Director of Graduate Studies (2007-2012)
Associate Professor of Government, Harvard University (2003-2006)
Assistant Professor of Government, Harvard University (1999-2003)
Assistant Professor of Political Science, Louisiana State University (1998-1999) Education Ph.D. The Ohio State University (1998)
B.A. Wittenberg University (1993) Authored or Co-Authored Books Burden, Barry C. 2007. Personal Roots of Representation. Princeton, NJ: Princeton University
Press. [Reviewed in Choice, Democratization, Journal of Politics, Legislative Studies Section Newsletter, Political Studies Review, & Polity]
Burden, Barry C., and David C. Kimball. 2002. Why Americans Split Their Tickets: Campaigns, Competition, and Divided Government. Ann Arbor, MI: The University of Michigan Press. [Reviewed in Campaigns & Elections Magazine, Choice, Journal of Politics, Legislative Studies Section Newsletter, National Journal, Party Politics, Perspectives on Politics, Political Science Quarterly, Public Choice, & VOX POP.]
Case 2:13-cv-00193 Document 391-1 Filed in TXSD on 07/07/14 Page 31 of 45Case 2:13-cv-00193 Document 671-19 Filed in TXSD on 11/11/14 Page 179 of 207

2
Edited Books Burden, Barry C., and Stewart, Charles III, eds. Forthcoming. The Measure of American
Elections. New York, NY: Cambridge University Press.
Hershey, Marjorie Randon (editor), Barry C. Burden (associate editor), and Christina Wolbrecht (associate editor). Forthcoming. CQ Guide to Political Parties. Thousand Oaks, CA: Sage Publications.
Burden, Barry C., editor. 2003. Uncertainty in American Politics. New York, NY: Cambridge University Press. [Reviewed in Choice, Perspectives on Political Science, Political Studies Review, & Public Choice.]
Refereed Journal Articles
Burden, Barry C., and Amber Wichowsky. Forthcoming. “Economic Discontent as a Mobilizer: Unemployment and Voter Turnout.” Journal of Politics.
Burden, Barry C., Bradley Jones, and Michael S. Kang. Forthcoming. “Nominations and the Supply of Candidates: The Connection between Sore Loser Laws and Congressional Polarization.” Legislative Studies Quarterly.
Burden, Barry C. David T. Canon, Kenneth R. Mayer, and Donald P. Moynihan. 2014. “Election Laws, Mobilization, and Turnout: The Unanticipated Consequences of Election Reform.” American Journal of Political Science 58:95-109. [Featured in a variety of outlets including The Atlantic Wire, The New York Times. Pew Research Center FactTank, The Huffington Post, The Deseret News, National Review Online, The Baltimore Sun, Orlando Sentinel, and elsewhere]
Burden, Barry C. Forthcoming. “Economic Accountability and Strategic Calibration in Japan’s Liberal Democratic Party.” Party Politics.
Burden, Barry C. David T. Canon, Stéphane Lavertu, Kenneth R. Mayer, and Donald P. Moynihan. 2013. “Selection Methods, Partisanship, and the Administration of Elections.” American Politics Research 41:903-36.
Burden, Barry C., and Jacob R. Neiheisel. 2013. “Election Administration and the Pure Effect of Voter Registration on Turnout.” Political Research Quarterly 66:77-90.
Burden, Barry C. David T. Canon, Kenneth R. Mayer, Donald P. Moynihan. 2012. “The Effect of Administrative Burden on Bureaucratic Perception of Politics: Evidence from Election Administration.” Public Administration Review 72:741-51.
Neiheisel, Jacob R., and Barry C. Burden. 2012. “The Effect of Election Day Registration on Voter Turnout and Election Outcomes.” American Politics Research 40:636-64. [Featured on the Wall Street Journal’s Ideas Market blog]
Case 2:13-cv-00193 Document 391-1 Filed in TXSD on 07/07/14 Page 32 of 45Case 2:13-cv-00193 Document 671-19 Filed in TXSD on 11/11/14 Page 180 of 207

3
Burden, Barry C. David T. Canon, Kenneth R. Mayer, Donald P. Moynihan. 2011. “Early Voting and Election Day Registration in the Trenches: Local Officials’ Perceptions of Election Reform.” Election Law Journal 10:89-102.
Berry, Christopher R., Barry C. Burden, and William G. Howell. 2010. “The President and the Distribution of Federal Spending.” American Political Science Review 104:783-99.
Berry, Christopher R., Barry C. Burden, and William G. Howell. 2010. “After Enactment: The Lives and Deaths of Discretionary Programs.” American Journal of Political Science 54:1-14.
Burden, Barry C. 2009. “The Dynamic Effects of Education on Voter Turnout.” Electoral Studies 28:540-9.
Burden, Barry C., and D. Sunshine Hillygus. 2009. “Opinion Formation, Polarization, and Presidential Reelection.” Presidential Studies Quarterly 39:619-35.
Burden, Barry C. 2009. “Candidate-Driven Ticket Splitting in the 2000 Japanese Elections.” Electoral Studies 28:33-40.
Burden, Barry C., and Gretchen Helmke. 2009. “The Comparative Study of Split-Ticket Voting.” Electoral Studies 28:1-7. [Introduction to a Special Issue co-edited with Gretchen Helmke.]
Burden, Barry C. 2008. “The Social Roots of the Partisan Gender Gap.” Public Opinion Quarterly 72:55-75.
Burden, Barry C. 2007. “Ballot Regulations and Multiparty Politics in the States.” PS: Political Science & Politics 40:669-73.
Burden, Barry C. 2006. “A Tale of Two Campaigns: Ralph Nader’s Strategy in the 2004 Presidential Election.” PS: Political Science and Politics 39:871-4.
Burden, Barry C., and Casey A. Klofstad. 2005. “Affect and Cognition in Party Identification.” Political Psychology 26:869-86.
Burden, Barry C. 2005. “Institutions and Policy Representation in the States.” State Politics and Policy Quarterly 5:373-93.
Burden, Barry C. 2005. “Minor Parties and Strategic Voting in Recent U.S. Presidential Elections.” Electoral Studies 24:603-18.
Burden, Barry C. 2005. “Ralph Nader’s Campaign Strategy in the 2000 U.S. Presidential Election.” American Politics Research 33:672-99.
Burden, Barry C., and Tammy M. Frisby. 2004. “Preferences, Partisanship, and Whip Activity in the House of Representatives.” Legislative Studies Quarterly 29:569-90.
Burden, Barry C. 2004. “A Technique for Estimating Candidate and Voter Positions.” Electoral Studies 23:623-39.
Case 2:13-cv-00193 Document 391-1 Filed in TXSD on 07/07/14 Page 33 of 45Case 2:13-cv-00193 Document 671-19 Filed in TXSD on 11/11/14 Page 181 of 207

4
Burden, Barry C. 2004. “Candidate Positioning in U.S. Congressional Elections.” British Journal of Political Science 34:211-27.
Burden, Barry C., and Anthony Mughan. 2003. “The International Economy and Presidential Approval.” Public Opinion Quarterly 67:555-78.
Burden, Barry C., and Joseph Neal Rice Sanberg. 2003. “Budget Rhetoric in Presidential Campaigns from 1952 to 2000.” Political Behavior 25:97-118.
Burden, Barry C. 2003. “Internal and External Effects on the Accuracy of NES Turnout.” Political Analysis 11:193-5.
Burden, Barry C. 2002. “When Bad Press is Good News: The Surprising Benefits of Negative Campaign Coverage.” Harvard International Journal of Press/Politics 7:76-89.
Burden, Barry C. 2002. “United States Senators as Presidential Candidates.” Political Science Quarterly 117:81-102. [Featured in David S. Broder’s Washington Post column.]
Burden, Barry C. 2000. “Voter Turnout and the National Election Studies.” Political Analysis 8:389-98.
Burden, Barry C., Gregory A. Caldeira, and Tim Groseclose. 2000. “Measuring the Ideologies of U.S. Senators: The Song Remains the Same.” Legislative Studies Quarterly 25:237-58. [Reprinted in Carl Grafton and Anne Permaloff, ed. 2005. The Behavioral Study of Political Ideology and Public Policy Formation, Lanham, MD: University Press of America.]
Burden, Barry C., and Steven Greene. 2000. “Party Attachments and State Election Laws.” Political Research Quarterly 53:57-70.
Burden, Barry C., and Anthony Mughan. 1999. “Public Opinion and Hillary Rodham Clinton.” Public Opinion Quarterly 63:237-50. [Featured in The Chronicle of Higher Education and Richard Morin’s Washington Post National Weekly Edition column.]
Burden, Barry C., and Marni Ezra. 1999. “Calculating Voter Turnout in U.S. House Primary Elections.” Electoral Studies 18:89-99.
Lacy, Dean, and Barry C. Burden. 1999. “The Vote-Stealing and Turnout Effects of Ross Perot in the 1992 U.S. Presidential Election.” American Journal of Political Science 43:233-55.
Burden, Barry C., and David C. Kimball. 1998. “A New Approach to the Study of Ticket Splitting.” American Political Science Review 92:533-44. [Reprinted in Richard G. Niemi and Herbert F. Weisberg, ed. 2001. Controversies in Voting Behavior, 4th ed. Washington, DC: CQ Press.]
Burden, Barry C. 1997. “Deterministic and Probabilistic Voting Models.” American Journal of Political Science 41:1150-69.
Book Chapters
Case 2:13-cv-00193 Document 391-1 Filed in TXSD on 07/07/14 Page 34 of 45Case 2:13-cv-00193 Document 671-19 Filed in TXSD on 11/11/14 Page 182 of 207

5
Vidal, Logan, and Barry C. Burden. Forthcoming. “Voter Registration.” In American Governance, ed. Stephen L. Schechter. Farmington Hills, MI: Cengage Learning.
Burden, Barry C., and Charles Stewart III. Forthcoming. “Introduction to the Measure of American Elections.” In The Measure of American Elections, eds. Barry C. Burden and Charles Stewart III. New York, NY: Cambridge University Press.
Burden, Barry C. Forthcoming. “Registration and Voting: A View from the Top.” In The Measure of American Elections, eds. Barry C. Burden and Charles Stewart III. New York, NY: Cambridge University Press.
Hillygus, D. Sunshine, and Barry C. Burden. 2013. “Mass Polarization During the Bush Presidency.” In Taking the Measure: The Presidency of George W. Bush, ed. Donald R. Kelley and Todd G. Shields. College Station, TX: Texas A&M University Press.
Burden, Barry C. 2013. “The Nominations: Ideology, Timing, and Organization.” In The Elections of 2012, ed. Michael Nelson. Washington, DC: CQ Press.
Berry, Christopher R., Barry C. Burden, and William G. Howell. 2012. “The Lives and Deaths of Federal Programs, 1971-2003.” In Living Legislation: Political Development and Contemporary American Politics, ed. Jeffrey A. Jenkins and Eric M. Patashnik. Chicago, IL: University of Chicago Press.
Burden, Barry C., and Amber Wichowsky. 2010. “Local and National Forces in Congressional Elections.” In The Oxford Handbook of American Elections and Political Behavior, ed. Jan E. Leighley. New York, NY: Oxford University Press.
Burden, Barry C. 2009. “The Puzzle of the Japanese Gender Gap in LDP Support.” In Political Changes in Japan: Electoral Behavior, Party Realignment, and the Koizumi Reforms, ed. Steven Reed, Kenneth Mori McElwain, and Kay Shimizu. Stanford, CA: Shorenstein Asia-Pacific Research Center.
Burden, Barry C., and Philip Edward Jones. 2009. “Strategic Voting in the USA.” In Duverger’s Law of Plurality Voting: The Logic of Party Competition in Canada, India, the United Kingdom, and the United States, ed. Bernard Grofman, André Blais, and Shaun Bowler. New York, NY: Springer.
Burden, Barry C. 2009. “The Nominations: Rules, Strategy, and Uncertainty.” In The Elections of 2008, ed. Michael Nelson. Washington, DC: CQ Press.
Burden, Barry C. 2008. “Multiple Parties and Ballot Regulations.” In Democracy in the States: Experiments in Elections Reform, ed. Bruce E. Cain, Todd Donovan, and Caroline J. Tolbert. Washington, DC: Brookings Institution Press.
Burden, Barry C. 2005. “Laws Governing Suffrage.” In Guide to Political Campaigns in America, ed. Paul S. Herrnson. Washington, DC: CQ Press.
Case 2:13-cv-00193 Document 391-1 Filed in TXSD on 07/07/14 Page 35 of 45Case 2:13-cv-00193 Document 671-19 Filed in TXSD on 11/11/14 Page 183 of 207

6
Burden, Barry C. 2005. “Family Feud in Massachusetts: How Intraparty Dynamics Influence Redistricting.” In Redistricting in the New Millennium, ed. Peter F. Galderisi. Lanham, MD: Lexington Books.
Burden, Barry C. 2005. “The Nominations: Technology, Money, and Transferable Momentum.” In The Elections of 2004, ed. Michael Nelson. Washington, DC: CQ Press.
Burden, Barry C. 2003. “Minor Parties in the 2000 Presidential Election” In Models of Voting in Presidential Elections: The 2000 U.S. Election, ed. Herbert F. Weisberg and Clyde Wilcox. Stanford, CA: Stanford University Press.
Burden, Barry C. 2003. “Everything but Death and Taxes: Uncertainty and American Politics.” In Uncertainty in American Politics, ed. Barry C. Burden. New York, NY: Cambridge University Press.
Burden, Barry C. 2001. “The Polarizing Effects of Congressional Primaries.” In Congressional Primaries in the Politics of Representation, ed. Peter F. Galderisi, Michael Lyons, and Marni Ezra. Lanham, MD: Rowman and Littlefield.
Mughan, Anthony, and Barry C. Burden. 1998. “Hillary Clinton and the President’s Reelection.” In Reelection 1996: How Americans Voted, ed. Herbert F. Weisberg and Janet M. Box-Steffensmeier. Chatham, NJ: Chatham House Publishers.
Burden, Barry C., and Aage R. Clausen. 1998. “The Unfolding Drama: Party and Ideology in the 104th House.” In Great Theatre: The American Congress in the 1990s, ed. Herbert F. Weisberg and Samuel C. Patterson. New York, NY: Cambridge University Press.
Mughan, Anthony, and Barry C. Burden. 1995. “The Candidates’ Wives.” In Democracy’s Feast: Elections in America, ed. Herbert F. Weisberg. Chatham, NJ: Chatham House Publishers.
Book Reviews Burden, Barry C. 2014. Review of Getting Primaried: The Changing Politics of Congressional
Primary Challenges by Robert G. Boatright. Ann Arbor, MI: University of Michigan Press. Congress & the Presidency 41:132-4.
Burden, Barry C. 2009. Review of Minority Report: Evaluating Political Equality in America by John D. Griffin and Brian Newman. Chicago, IL: University of Chicago Press. Public Opinion Quarterly 73:590-2.
Burden, Barry C. 2009. Review of The American Voter Revisited, ed. Michael S. Lewis-Beck, William G. Jacoby, Helmut Norpoth, and Herbert F. Weisberg. Ann Arbor, MI: University of Michigan Press. Political Science Quarterly 124:344-6.
Case 2:13-cv-00193 Document 391-1 Filed in TXSD on 07/07/14 Page 36 of 45Case 2:13-cv-00193 Document 671-19 Filed in TXSD on 11/11/14 Page 184 of 207

7
Burden, Barry C. 2003. Review of Learning by Voting: Sequential Choices in Presidential Primaries and Other Elections by Rebecca B. Morton and Kenneth C. Williams. Public Choice 114:248-51.
Burden, Barry C. 2002. Review of Elements of Reason: Cognition, Choice, and the Bounds of Rationality, ed. Arthur Lupia, Mathew D. McCubbins, and Samuel L. Popkin. Journal of Economic Literature 40:928-9.
Reports Burden, Barry C., and Brian J. Gaines. 2013. “Administration of Absentee Ballot Programs.”
Testimony and report to the Presidential Commission on Election Administration. Hearing in Denver, CO. August 8.
Burden, Barry C., and Jeffrey Milyo. 2013. “The Recruitment and Training of Poll Workers.” Testimony and report to the Presidential Commission on Election Administration. Hearing in Cincinnati, OH. September 20.
Burden, Barry C. 2010. Polling Place Incidents in the November 2008 General Election. Report to the Wisconsin Government Accountability Board.
Burden, Barry C., David T. Canon, Stéphane Lavertu, Kenneth R. Mayer, and Donald P. Moynihan. 2009. 2008 Wisconsin Election Data Collection Grant Program Evaluation Report. Report to the Wisconsin Government Accountability Board.
Burden, Barry C., and Janet M. Box-Steffensmeier. 1998. “Vote Likelihood and Institutional Trait Questions in the 1997 NES Pilot Study.” Report to American National Election Study Board of Overseers.
Other Publications Burden, Barry C. 2014. “How Political Scientists Informed the President about Election
Reform.” The Monkey Cage blog. Posted January 23.
Burden, Barry C., and Kevin J. Kennedy. 2013. “State Ranks High on Election Performance.” Milwaukee Journal Sentinel. February 7.
Burden, Barry C., David T. Canon, Kenneth R. Mayer, and Donald P. Moynihan. 2012. “Election-Day Registration Works Here.” Milwaukee Journal Sentinel. December 26.
Burden, Barry C. 2012. “A Portrait of the Wisconsin Municipal Clerk.” The Municipality. Volume 106, Number 5.
Case 2:13-cv-00193 Document 391-1 Filed in TXSD on 07/07/14 Page 37 of 45Case 2:13-cv-00193 Document 671-19 Filed in TXSD on 11/11/14 Page 185 of 207

8
Burden, Barry C. 2011. “Polarization, Obstruction, and Governing in the Senate.” The Forum. Volume 9, Issue 4.
Burden, Barry C., and Kenneth R. Mayer. 2010. “Voting Early, but Not So Often.” The New York Times, October 25.
Burden, Barry C. 2009. “Representation as a Field of Study.” In The Future of Political Science: 100 Perspectives, ed. Gary King, Kay Lehman Schlozman, and Norman Nie. New York, NY: Routledge.
Burden, Barry C. 2004. “An Alternative Account of the 2004 Presidential Election.” The Forum. Volume 2, Issue 4.
Burden, Barry C. 2003. “Chronology of the 2000 Presidential Campaign.” In Models of Voting in Presidential Elections: The 2000 U.S. Election, ed. Herbert F. Weisberg and Clyde Wilcox. Stanford, CA: Stanford University Press.
Burden, Barry C. 1998. “Chronology of the 1996 Presidential Campaign.” In Reelection 1996: How Americans Voted, ed. Herbert F. Weisberg and Janet M. Box-Steffensmeier. Chatham, NJ: Chatham House Publishers.
Burden, Barry C. 1995. “Chronology of the 1992 Presidential Campaign.” In Democracy’s Feast: Elections in America, ed. Herbert F. Weisberg. Chatham, NJ: Chatham House Publishers.
Honors and Awards Robert H. Durr Award – given by the Midwest Political Science Association for the best paper
applying quantitative methods to a substantive problem in political science – “Election Laws and Partisan Gains: The Effects of Early Voting and Same Day Registration on the Parties’ Vote Shares,” with David Canon, Kenneth Mayer, and Donald Moynihan (2014)
H. I. Romnes Faculty Fellow, UW Graduate School (2010-2015)
Licking Valley Schools “Wall of Pride” Award (2009) – given annually to alumni who distinguished themselves professionally or made notable contributions to society
Hamel Family Faculty Fellow, UW College of Letters and Science (2008-2013)
University Residence Hall Favorite Instructor Award (2007)
Nominated for Harvard University Everett Mendelsohn Excellence in Graduate Mentoring Award (2006)
Emerging Scholar Award (2005) – given by the Political Organizations and Parties section of APSA for significant research by a scholar receiving her or his doctorate within the past seven years
Case 2:13-cv-00193 Document 391-1 Filed in TXSD on 07/07/14 Page 38 of 45Case 2:13-cv-00193 Document 671-19 Filed in TXSD on 11/11/14 Page 186 of 207

9
Wittenberg University Outstanding Young Alumnus Award (2002) – given to a graduate of the last decade to recognize professional achievement
Council of Graduate Schools/University Microfilms International Distinguished Dissertation Award (2000) – given to recognize best dissertation completed nationwide in the social sciences between 1998 and 2000
Nominated for Harvard University Joseph R. Levenson Memorial Teaching Prize (2000)
ΑΛ∆ Award for superior instruction of freshman students (1999) OSU Presidential Fellow (1998)
Francis R. Aumann Award for best OSU graduate student conference paper (1996 & 1997)
Malcolm Jewell Award (1996) – best graduate student paper presented at the 1995 Southern Political Science Association meeting
Ohio Board of Regents Fellow (1993-1995)
ΦΒΚ (1993)
Wittenberg University Student Leader of the Year (1992-1993)
Jeffrey Y. Mao Alumni Award in Political Science (1992) Grants UW Graduate School Research Committee, “Political Participation among Older Americans”
(2014-2015, co-PI with Moynihan)
Center for Demography of Health and Aging, “Political Participation of Older Americans: The Role of Social and Genetic Factors” (co-PI with Jason M. Fletcher and Donald P. Moynihan, 2013-2014)
Pew Charitable Trusts, $46,400 for “Measuring Elections Performance Project,” (with head PI Charles Stewart III, 2012-2013)
Wisconsin Government Accountability Board, $43,234 for “Analysis of Polling Place Incident Logs” (head PI with Canon, Mayer, and Moynihan, 2011-2012)
UW Graduate School Research Committee, “The Consequences of Electing Election Officials” (2009-2010)
Pew Center on the States, Making Voting Work: $49,400 for “Early Voting and Same Day Registration in Wisconsin and Beyond” (head PI with Canon, Mayer, and Moynihan, 2008-2009)
Case 2:13-cv-00193 Document 391-1 Filed in TXSD on 07/07/14 Page 39 of 45Case 2:13-cv-00193 Document 671-19 Filed in TXSD on 11/11/14 Page 187 of 207

10
U.S. Election Assistance Commission, Election Data Collection Grant Program: responsible for $212,442 of $2,000,000 grant to the Wisconsin Government Accountability Board (head PI with Canon, Mayer, and Moynihan, 2008-2010)
UW Graduate School Research Committee: “The Puzzling Geography of Federal Spending,” (2007-2008)
UW Graduate School Research Committee: “The Political Economy of the Japanese Gender Gap” (2006-2007)
CAPS faculty research conference: $36,500 for “Democracy, Divided Government, and Split-Ticket Voting” (2006)
Joseph H. Clark fund award: “The Limits of Representation” (2004-2006)
Reischauer Institute of Japanese Studies: “Accountability, Economics, and Party Politics in Japan” (2004-2006)
Time-sharing Experiments in the Social Sciences: “Affect and Cognition in Party Identification” (with Casey A. Klofstad, 2004)
Harvard Faculty of Arts & Sciences Course Innovation Funds: “The Practice of Political Science” (2003)
Dirksen Congressional Center Congressional Research Award: “The Discharge Rule and Majoritarian Politics in the House of Representatives” (2002-2003)
Reischauer Institute of Japanese Studies Curriculum Enrichment Grant: “Electoral Politics in America and Japan” (2002)
CBRSS research program grant: “Affect and Cognition in Party Identification” (2001)
Joseph H. Clark fund award: “Affect and Cognition in Party Identification” (2001-2002)
Joseph H. Clark fund award: “Ideology in Congressional Elections” (2000-2001)
National Science Foundation Doctoral Dissertation Improvement Grant: “Candidates’ Positions in Congressional Elections” (1997)
Teaching and Advising Undergraduate courses:
Introduction to American Politics Elections and Voting Behavior Political Behavior American Public Opinion Election Reform in America The Politics of Congress/The Legislative Process Techniques of Political Analysis
Case 2:13-cv-00193 Document 391-1 Filed in TXSD on 07/07/14 Page 40 of 45Case 2:13-cv-00193 Document 671-19 Filed in TXSD on 11/11/14 Page 188 of 207
11
Electoral Politics in America and Japan The Practice of Political Science Research
Graduate courses:
American Politics Field Seminar Mass Political Behavior Congress and Legislative Politics American Electoral Politics Readings on Advanced Statistical Methods Quantitative Research Design American Political Institutions Readings on Interest Group Politics Research Workshop in American Politics
Political Science as a Discipline and Profession Harvard Ph.D. advising (year and placement):
Benjamin Deufel (2006 Greenberg Quinlan Rosner Research) Tammy M. Frisby (2006 Stanford University-Lane Center) Michael Kang (2009 Emory University-School of Law) Andrew Karch (2003 University of Texas & University of Minnesota) Casey A. Klofstad (2005 University of Miami) Robert Van Houweling (2003 University of Michigan & UC-Berkeley) Carl Albert Dissertation Award for best dissertation in legislative studies
Wisconsin Ph.D. advising (year and placement): Danna Basson (2007 Mathematica Policy Research)
Amy Bree Becker, Journalism & Mass Communication (2010 Towson University & Loyola University Maryland)
Deven Carlson (2012 University of Oklahoma) Amnon Cavari (2011 Interdisciplinary Center–IDC Israel) George C. Edwards III Dissertation Award for best dissertation in presidency research Meghan Condon (2012 Loyola University Chicago) APSA section on Experimental Research best dissertation award William Egar (ABD)
Erika Franklin Fowler (2006 RWJ Scholar in Health Policy & Wesleyan University) Hannah Goble (2009 Texas Christian University)
Matthew Holleque, chair (2012 Obama for America) Bradley Jones, chair (ABD) Dimitri Kelly, chair (2013 Linfield College) Yujin Kim, chair (ABD)
Paul Lachelier, Sociology (2007 Stetson University) Ruoxi Li (ABD)
Case 2:13-cv-00193 Document 391-1 Filed in TXSD on 07/07/14 Page 41 of 45Case 2:13-cv-00193 Document 671-19 Filed in TXSD on 11/11/14 Page 189 of 207

12
Jeremy Menchik (2011 Stanford Shorenstein Center post-doc & Boston University) Daniel Metcalf Jacob Neiheisel, chair (2013 Denison University & University of Buffalo)
Joel Rivlin (ABD MSHC Partners & Pivot) Rajen Subramanian (2008 Abt Associates) Amber Wichowsky, chair (2010 Yale CSAP Fellowship & Marquette University) Carl Albert Dissertation Award for best dissertation in legislative studies
Reviewing Activities Journal manuscript reviews:
Acta Politica, American Journal of Political Science, American Political Science Review, American Politics Quarterly, American Politics Research, American Review of Politics, British Journal of Political Science, Comparative Political Studies, Congress & the Presidency, Election Law Journal, Electoral Studies, European Journal of Political Research, International Journal of Forecasting, International Organization, Journal of Law, Economics, and Organization, Journal of Politics, Journal of Theoretical Politics, Journal of Women, Politics, & Policy, Legislative Studies Quarterly, Party Politics, Perspectives on Politics, Political Analysis, Political Behavior, Political Communication, Political Psychology, Political Research Quarterly, Political Science Quarterly, Politics & Gender, Politics and Policy, Presidential Studies Quarterly, Public Choice, Public Opinion Quarterly, Rationality and Society, Research and Politics, Quarterly Journal of Political Science, Social Science Quarterly, Sociological Forum, Sociological Methods and Research, State Politics & Policy Quarterly, Statistical Science, & World Politics
Book manuscript reviews:
Addison Wesley Longman, Atomic Dog Publishing, Brookings Institution Press, Cambridge University Press, CQ Press, Oxford University Press, and University of Chicago Press
Tenure and promotion reviews:
Dartmouth College, Florida State University, Fordham University, Louisiana State University, Temple University, Texas Tech University, Tulane University, University of British Columbia, University of California-Berkeley, University of California-Riverside (twice), University of Chicago (public policy), University of Houston, University of Massachusetts-Dartmouth, University of Maryland (twice), University of Missouri-Columbia, University of Missouri-St. Louis, University of North Carolina at Charlotte, University of Notre Dame, University of Pennsylvania, University of Texas-Dallas, & Washington State University
External review committee, Union College Department of Political Science (chair, 2010)
Case 2:13-cv-00193 Document 391-1 Filed in TXSD on 07/07/14 Page 42 of 45Case 2:13-cv-00193 Document 671-19 Filed in TXSD on 11/11/14 Page 190 of 207

13
Other reviews:
Canada Research Chair College of Reviewers, Radcliffe Institute Fellows, National Science Foundation, Robert Wood Johnson Scholars in Health Policy, Time-sharing Experiments in the Social Sciences (TESS)
Professional and University Service Journal editorial boards:
Election Law Journal editorial board (2013-present) Electoral Studies editorial board (2011-present) Political Research Quarterly (2014-present) Legislative Studies Quarterly editorial board (2011-2013)
Other boards and councils:
Election Performance Index Advisory Board, Pew Center on the States (2010-2014) Elections, Public Opinion, and Voting Behavior section Communications Director (2012-
2015) Legislative Studies section council (2009-2011) Political Organizations and Parties section council (2005-2007) Ad Hoc Committee on Member Communications (2013) Project Vote Smart Advisory Board (2007-)
Conference program organizer:
Political Organizations and Parties, APSA annual meeting (2006) Political Methodology, SPSA annual meeting (2001)
Award committees: Political Organizations and Parties/Party Politics award committee for the best paper
presented at the 2006 APSA annual meeting (chair, 2007) Political Organizations and Parties Emerging Scholar Award committee (chair, 2013) Campus presentations: Dartmouth College, Northwestern University, Stanford University, SUNY-Stony Brook,
University of Houston, University of Minnesota, University of Missouri-Columbia, University of Notre Dame, University of Rochester, University of Texas at Austin, Utah State University (twice), Wittenberg University, & Yale University (twice)
Public and community presentations:
Boston Museum of Science, Brookings Institution, Civitas, National Legislative Program Evaluation Society, Newton Center for Lifetime Learning, Reach Out Wisconsin, Senior
Case 2:13-cv-00193 Document 391-1 Filed in TXSD on 07/07/14 Page 43 of 45Case 2:13-cv-00193 Document 671-19 Filed in TXSD on 11/11/14 Page 191 of 207

14
Summer School, UW-Extension College Days, Vantage Point, Wisconsin Academy of Sciences, Arts, and Letters, Wisconsin Department of Revenue, and alumni events in Wisconsin and New York City
Affiliations: Election Administration Project (co-founder, 2008-present) Wisconsin Advertising Project team (2008-present) La Follette School of Public Affairs, Faculty Associate (2007-present) Center for Demography of Health and Aging (2013-present) Political Behavior Research Group (2006-present) Institute for Quantitative Social Science, Faculty Associate (1999-2006) Political Psychology and Behavior Workshop (co-founder, 2000-2006) Center for American Political Studies, Executive Committee (2001-2006) & Steering
Committee (2003-2004) Program on US-Japan Relations, Faculty Affiliate (2004-2006) Weatherhead Center for International Affairs, Faculty Associate (2005-2006) Harvard Kennedy School, Mid-Career MPA Summer Program (2001-2005 & 2007-2012) Summer Institute in Political Psychology (1995 & 1997)
Harvard committee service:
American Politics Faculty Search (1998-1999, 2001-2002, 2002-2003, & 2005-2006) Graduate Admissions (1999-2000) Government Concentration/Board of Senior Examiners (2000-2001 & 2004)
Teaching Fellow Coordinator (2003-2004) American Politics Field Coordinator (2005-2006) Center for Government and International Studies, Subcommittee on Teaching and
Conference Spaces (2003) Truman Scholarship Nomination (2000-2001) Eben Fiske Studentship Nomination (2004-2005) Political Communication Faculty Search, Kennedy School of Government (2004-2005)
Wisconsin committee service:
Faculty Senate (2006-2007) Associate Chair/Director of Graduate Studies (2007-2012)
Graduate Admissions and Fellowships, chair Graduate Program Committee, chair Teaching Assistant Evaluation Committee, chair
L&S Teaching Fellow Anniversary Symposium Planning Committee (2009-2010) L&S C-GRS Faculty Executive Committee (2009-2010) Graduate School Social Studies Fellowships Committee (2010-2013)
Social Studies Divisional Executive Committee (2013-2014) Faculty Recruitment Committee (2013-2014)
Case 2:13-cv-00193 Document 391-1 Filed in TXSD on 07/07/14 Page 44 of 45Case 2:13-cv-00193 Document 671-19 Filed in TXSD on 11/11/14 Page 192 of 207

15
American Politics Search Committee, chair Preliminary Examination Appeals Committee (2013-2014)
Occasional source for media coverage of politics including abcnews.com, Atlanta Journal-
Constitution, Associated Press, The Baltimore Sun, The Baton Rouge Advocate, Bloomberg News, The Boston Herald, cbsnews.com, Campaigns & Elections Magazine, Chicago Tribune, Christian Science Monitor, Cleveland Plain Dealer, Congressional Quarterly Weekly Report, The Daily Caller, Dallas Morning News, Des Moines Register, forbes.com, Fox News, Glamour, The Globe and Mail (Canada), The Guardian (UK), The Harvard Crimson, Harvard Political Review, The Hill, International Herald Tribune, Kansas City Star, Los Angeles Times, The London Times, Le Monde, The New Orleans Times-Picayune, National Journal, The New Republic, New Scientist, New York Post, The New York Times, Newsday, Newsweek, el Nuevo Herald, Omaha World Herald, PBS NewsHour, Pittsburgh Post-Gazette, Politico.com, Reuters, Salon.com, States News Service, USA Today, Veja (Brazil), The Wall Street Journal, The Washington Post, The Washington Times, Wisconsin Law Journal, Yomiuri Shimbun, Greater Boston on WGBH, NECN, Nitebeat with Barry Nolan, Odyssey on Chicago Public Radio, and many local television, radio, and newspaper outlets
Featured in An Unreasonable Man, an independent documentary film about the life and career of
Ralph Nader (2006) Consulting Research consultant, via Research Triangle International Institute and the Pew Charitable Trusts,
for evaluation of the Electronic Registration Information Center (2012-2014)
Expert witness, League of United Latin American Citizens of Wisconsin et al. v. Judge David G. Deininger et al., case 12-CV-00185, U.S. District Court, Eastern District of Wisconsin (2013)
Expert witness, North Carolina State Conference of the NAACP et al. v. Patrick Lloyd McCrory et al., case 13-CV-658, U.S. District Court, Middle District of North Carolina (2014)
Academic researcher, Presidential Commission on Election Administration, established by presidential Executive Order 13639 (2013)
Case 2:13-cv-00193 Document 391-1 Filed in TXSD on 07/07/14 Page 45 of 45Case 2:13-cv-00193 Document 671-19 Filed in TXSD on 11/11/14 Page 193 of 207

IN THE UNITED STATES DISTRICT COURT FOR THE SOUTHERN DISTRICT OF TEXAS
CORPUS CHRISTI DIVISION MARC VEASEY, et al., Plaintiffs, v. RICK PERRY, et al., Defendants.
Civil Actions No. 2:13-cv-193 (NGR) (Consolidated Case)
UNITED STATES’ NOTICE OF FILING OF THE SUPPLEMENTAL EXPERT REPORT OF DR. BARRY BURDEN
Case 2:13-cv-00193 Document 478 Filed in TXSD on 08/15/14 Page 1 of 5PL7599/2/20142:13-cv-00193
Case 2:13-cv-00193 Document 671-19 Filed in TXSD on 11/11/14 Page 194 of 207

At the Court’s direction, the United States hereby files the supplemental expert report of
Dr. Barry Burden, which is attached hereto.
Date: August 15, 2014 Respectfully submitted,
KENNETH MAGIDSON MOLLY J. MORAN United States Attorney Acting Assistant Attorney General Southern District of Texas Civil Rights Division
/s/ Daniel J. Freeman T. CHRISTIAN HERREN, JR. MEREDITH BELL-PLATTS ELIZABETH S. WESTFALL BRUCE I. GEAR JENNIFER L. MARANZANO ANNA M. BALDWIN DANIEL J. FREEMAN Attorneys, Voting Section Civil Rights Division, U.S. Department of Justice 950 Pennsylvania Avenue, N.W. Washington, D.C. 20530
Case 2:13-cv-00193 Document 478 Filed in TXSD on 08/15/14 Page 2 of 5Case 2:13-cv-00193 Document 671-19 Filed in TXSD on 11/11/14 Page 195 of 207
CERTIFICATE OF SERVICE
I hereby certify that on August 15, 2014, I served a true and correct copy of the foregoing via the Court’s ECF system on the following counsel of record:
John B. Scott John Reed Clay, Jr. Gregory David Whitley Jonathan F. Mitchell Sean Flammer Stephen Ronald Keister Arthur D’Andrea Jennifer Marie Roscetii Lindsey Elizabeth Wolf Office of the Texas Attorney General [email protected] [email protected] [email protected] [email protected] [email protected] [email protected] [email protected] [email protected] [email protected] Ben Addison Donnell Donnell Abernethy & Kieschnick [email protected] Counsel for Defendants
Chad W. Dunn Kembel Scott Brazil Brazil & Dunn [email protected] [email protected] J. Gerald Hebert Emma Simson Campaign Legal Center [email protected] [email protected] Neil G. Baron Law Offices of Neil G. Baron [email protected] Armand Derfner Derfner, Altman, & Wilborn [email protected] Luiz Roberto Vera, Jr. [email protected] Counsel for Veasey Plaintiffs
Case 2:13-cv-00193 Document 478 Filed in TXSD on 08/15/14 Page 3 of 5Case 2:13-cv-00193 Document 671-19 Filed in TXSD on 11/11/14 Page 196 of 207
Christina Swarns Ryan P. Haygood Natasha M. Korgaonkar Leah C. Aden Deuel Ross NAACP Legal Defense and Educational Fund, Inc. [email protected] [email protected] [email protected] [email protected] [email protected] Danielle Conley Jonathan Paikin Kelly P. Dunbar Sonya L. Lebsack Gerald J. Sinzdak Lynn Eisenberg Richard F. Shordt WilmerHale LLP [email protected] [email protected] [email protected] [email protected] [email protected] [email protected] [email protected] Counsel for Texas League of Young Voters Plaintiff-Intervenors
Ezra D. Rosenberg Amy L. Rudd Lindsey Cohan Dechert LLP [email protected] [email protected] [email protected] Wendy Weiser Jennifer Clark Myrna Pérez Vishal Agraharkar Brennan Center for Justice at NYU School of Law [email protected] [email protected] [email protected] [email protected] Mark A. Posner Sonia Kaur Gill Erandi Zamora Lawyers’ Committee for Civil Rights [email protected] [email protected] [email protected] Counsel for Texas State Conference of NAACP Branches Plaintiffs
Case 2:13-cv-00193 Document 478 Filed in TXSD on 08/15/14 Page 4 of 5Case 2:13-cv-00193 Document 671-19 Filed in TXSD on 11/11/14 Page 197 of 207

Jose Garza Marinda van Dalen Robert W. Doggett Peter McGraw Kathryn Newell Priscilla Noriega Texas Rio Grande Legal Aid, Inc. [email protected] [email protected] [email protected] [email protected] [email protected] [email protected] Counsel for Ortiz Plaintiffs
Rolando L. Rios Law Offices of Rolando L. Rios [email protected] Preston Edward Henrichson Law Offices of Preston Henrichson [email protected] Counsel for Texas Association of Hispanic County Judges and County Commissioners Plaintiff-Intervenors /s/ Anna M. Baldwin Anna M. Baldwin Voting Section Civil Rights Division U.S. Department of Justice [email protected]
Case 2:13-cv-00193 Document 478 Filed in TXSD on 08/15/14 Page 5 of 5Case 2:13-cv-00193 Document 671-19 Filed in TXSD on 11/11/14 Page 198 of 207

1
IN THE UNITED STATES DISTRICT COURT FOR THE SOUTHERN DISTRICT OF TEXAS
CORPUS CHRISTI DIVISION MARC VEASEY, et al., Plaintiffs, v. RICK PERRY, et al., Defendants.
Civil Actions No. 2:13-cv-193 (NGR)
SUPPLEMENTAL DECLARATION OF DR. BARRY C. BURDEN
Pursuant to 28 U.S.C. § 1746, I, Barry C. Burden, make the following declaration:
1. The purpose of this reply report is to respond to the reports of defense experts M.V. Hood III
and Jeffrey Milyo and to reflect new analysis conducted by Stephen Ansolabehere based on corrected data provided by the State of Texas. I limit my response to areas of their reports that touch upon my expert report submitted to the court on June 27, 2014, and amended on July 1, 2014. I address five areas of disagreement.
Dr. Ansolabehere’s Analysis 2. Dr. Milyo observes that I refer to Dr. Ansolabehere’s estimates of the number of registered
voters who lack ID to vote under SB 14 “without caveats or concerns” (¶¶ 50-51). It was not within the scope of my report to analyze those data directly or to engage in comprehensive scrutiny of the analyses. Dr. Ansolabehere’s estimate that approximately 9% of registered voters in Texas lack suitable ID did not appear out of line with estimates from expert analyses conducted in other states.1 Likewise, I was aware of other research by Dr. Ansolabehere reporting that “deadwood” on registration rolls was quite low in Texas.2
3. After my report was submitted, the State of Texas revealed that it had delivered incomplete data to Dr. Ansolabehere.3
1 For example, Frank v. Walker, No. 11-cv-1128, 2014 WL 1775432, at *12 (E.D. Wis. 2014), observed that approximately 9% of registered voters in the state lacked suitable ID.
Dr. Ansolabehere’s updated estimates based on corrected data from the state produce lower “no match” rates between the state voter registration file and
2 See Figure 3.6 of Stephen Ansolabehere and Eitan Hersh (2014), “Registration and Voting: A View from the Top,” in The Measure of American Elections, eds. Barry C. Burden and Charles Stewart III, New York, NY: Cambridge University Press. Dr. Milyo cites an older, working paper version of what became the Ansolabehere and Hersh publication (Milyo footnote 28). 3 Declaration of John W. Crawford, July 22, 2014.
Case 2:13-cv-00193 Document 478-1 Filed in TXSD on 08/15/14 Page 1 of 9Case 2:13-cv-00193 Document 671-19 Filed in TXSD on 11/11/14 Page 199 of 207

2
DMV records. But in every analysis he conducts using the new data—whether using Catalist racial classifications, ecological regression, or homogeneous Census blocks—blacks and Latinos remain significantly less likely than Anglos to possess ID for voting. Indeed, racial and ethnic disparities persist even after applying the many weights and adjustments introduced by Dr. Hood and Dr. Milyo.
4. As I explained in my initial report, matching of DPS and voter registration files is a
conservative methodology for estimating how many Texas residents lack ID (¶ 89). Approximately 2.5 million citizens in Texas who would otherwise be eligible to vote do not even appear in the voter file because they are currently not registered to vote. Unregistered individuals are almost certainly much more likely to lack ID than registered individuals. Dr. Hood’s reanalysis of the Barreto-Sanchez survey verifies this. Generalizing across the many estimates that Dr. Hood provides indicates that the share of the electorate without ID is roughly twice as high when the population is expanded from registered voters to all eligible citizens.4
Dr. Milyo’s Dismissal of Costs 5. Dr. Milyo is correct in his suggestion that voter turnout is affected by each of the factors
included in the calculus of voting model. Dr. Milyo has rightly set out the model as predicting that an individual will vote when (p×B – C) + D > 0, where p is the probability that a voter casts a decisive vote, B is the benefit to the voter of having his or her preferred candidate win, C is the cost of voting for the individual, and D is the non-instrumental value of voting (including factors such as expressing one’s identity and fulfilling a sense of civic duty) (¶ 133). This formulation is widely used in political science and is a common way for scholars to understand the turnout decision. As the Aldrich article Dr. Milyo discusses explains, “This model has been tested extensively, all tests find that the C, D, and B terms are strong predictors of turnout” (p. 252).5
6. That field experiments Dr. Milyo describes show some effects on turnout when people are given messages about civic duty (D), but this does not render the cost term irrelevant. One of the early studies of this type found that a “civic duty” message has an effect of 9.1% on turnout. A message that the “election is close” (p) found an even larger 12.1% effect.6 This suggests that the p×B combination is not necessarily “extremely small” or that the “theory is falsified,” as Dr. Milyo asserts (¶ 132). Moreover, the civic duty term does not necessary dominate cost considerations or other factors in the model. In more recent field experiments, a civic duty message had a mere 1.8% effect and was less impactful than three other messages.7
4 See Hood Report tables 10A, 10B, 10C, 10D, 11A, and 11B.
But the question in this case is not where cost ranks relative to the many other factors.
5 John H. Aldrich (1993), “Rational Choice and Turnout,” American Journal of Political Science 37:246-278. 6 Alan S. Gerber and Donald P. Green (2000), “The Effects of Canvassing, Telephone Calls, and Direct Mail on Voter Turnout: A Field Experiment,” American Political Science Review 94:653-663. 7 Alan S Gerber, Donald P. Green, and Christopher W. Larimer (2008), “Social Pressure and Voter Turnout: Evidence from a Large-Scale Field Experiment,” American Political Science Review 102:33-48.
Case 2:13-cv-00193 Document 478-1 Filed in TXSD on 08/15/14 Page 2 of 9Case 2:13-cv-00193 Document 671-19 Filed in TXSD on 11/11/14 Page 200 of 207
3
7. The decision to vote is sensitive enough to costs that even Election Day weather has been
shown to depress turnout, as demonstrated in a study by Gomez and Hansford.8
The authors of the study reference the Aldrich article and point out that while many observers believe costs of voting to be low, “we find that voters seem to be rather sensitive to what is presumably a minor increase in participation costs—the weather” (p. 659). It would thus not be surprising that more direct costs imposed on voters by the state would also have sizable effects on participation.
8. Many recent studies have demonstrated the effects of state-imposed costs on turnout, particularly with regard to travel costs. Haspel and Knotts show that increasing the distance from one’s residence to the polling place by just two-thirds of a mile decreased turnout in an Atlanta mayoral election by five percentage points for those with a vehicle available and 25 points for those without a car available.9 Dyck and Gimpel’s study of Clark County, Nevada in 2002 finds that an increase in distance from one’s residence to the precinct polling place dropped turnout by between 1.4 and 4.5 percentage points.10 Brady and McNulty show that relocating polling places in California in 2003 reduced overall turnout by a net of 1.85 percentage points.11 McNulty, Dowling, and Ariotti show that consolidating polling places for a voter in a school district election in upstate New York reduced participation by about seven percentage points.12 As another example, the burden of voter registration has been shown to decrease overall voter turnout by anywhere from two to 14 percentage points.13 Leighley and Nagler’s analysis shows that state laws that allow Election Day registration or absentee voting may reduce costs and increase turnout in nontrivial ways.14
9. Given these studies and other contemporary scholarship, Dr. Milyo’s assertion that simply by “referencing” Aldrich’s landmark article I am “reaching backward into the past and skipping over the fundamental lessons from much more recent empirical scholarship on the determinants of voting” (¶ 140) is baseless. In summary, this research, which Dr. Milyo largely omits from his rebuttal report, shows that while the precise effects vary by the
8 Thomas G. Hansford and Brad T. Gomez (2010), “Estimating the Electoral Effects of Voter Turnout,” American Political Science Review 104:268-88. 9 Moshe Haspel and H. Gibbs Knotts (2005), “Location, Location, Location: Precinct Placement and the Costs of Voting,” Journal of Politics 67:560-73. 10 Joshua J. Dyck and James G. Gimpel (2005), “Distance, Turnout, and the Convenience of Voting,” Social Science Quarterly 86:531-548. 11 Henry E. Brady and John E. McNulty (2011), “Turnout Out to Vote: The Costs of Finding and Getting to the Polling Place,” American Political Science Review 105:1-20. 12 John E. McNulty, Conor M. Dowling, and Margaret H. Ariotti (2009), “Driving Saints to Sin: How Increasing the Difficulty of Voting Dissuades Even the Most Motivated Voters,” Political Analysis 17:435-55. 13 For example, see Barry C. Burden and Jacob R. Neiheisel (2013), “Election Administration and the Pure Effect of Voter Registration on Turnout,” Political Research Quarterly 66:77-90; Raymond E. Wolfinger and Steven J. Rosenstone (1980), Who Votes? Yale University Press; G. Bingham Powell Jr. (1986), “American Voter Turnout in Comparative Perspective,” American Political Science Review 80:17-43. 14 Jan E. Leighley and Jonathan Nagler (2014), Who Votes Now? Demographics, Inequality, and Turnout in the United States, Princeton, NJ: Princeton University Press.
Case 2:13-cv-00193 Document 478-1 Filed in TXSD on 08/15/14 Page 3 of 9Case 2:13-cv-00193 Document 671-19 Filed in TXSD on 11/11/14 Page 201 of 207
4
electoral context, the election parameters controlled by the government do in fact shape the costs of voting in significant ways. Dr. Milyo does not dispute these studies.
10. In the face of this research, Dr. Milyo asserts that “post-registration election procedures . . .
have fairly modest, insignificant or even perverse effect on voter turnout” (¶ 14). Even if this statement were true, it does not bear on the relevant question in this case: whether SB 14 imposes a heavier burden on minority voters. Indeed, research by Wolfinger, Highton, and Mullen establishes that an array of “post-registration” procedures impose costs on voters that translate into disparate effects on their participation. The authors’ analysis of the 2000 election showed that increasing the costs of voting by shortening polling hours and not mailing sample ballots decreased turnout by 4 percentage points among whites, but by 4.8 points among blacks and 6.8 points among Latinos.15 Dr. Milyo is certainly aware of this research, as he participated in a reanalysis of the underlying data, but he failed to address these findings in his report. Moreover, Dr. Milyo’s reanalysis of the Wolfinger, Highton, and Mullen data in a later article does not investigate the critical racial and ethnic differences.16
11. In general, disruptions to voting habits also raise costs and deter participation. It is little surprise, then, that changes to election procedures can deter voting. SB14 is likely to exacerbate differences in political participation by Anglos on the one hand and by blacks and Latinos on the other because blacks and Latinos have fewer of the socioeconomic resources necessary to pay the costs imposed on the voting process by SB 14.
12. Of the four terms in the calculus of voting model, cost is the only one that is set by law and
controlled by the state. Both classic and contemporary research has shown that government-controlled costs affect electoral participation once other factors are taken into account. But turnout is not the determinative consideration for judging the impact of SB 14. As my initial report contended, the law imposes a disproportionate burden on blacks and Latinos because the ability to meet costs varies by race and ethnicity. As I discuss further below, turnout cannot measure the impact of SB 14 unless a researcher is able to control for the other terms in the calculus of voting. None have been able to do so thus far.
Dr. Hood’s Comparison of State ID Laws 13. Dr. Hood contends that SB 14 is “very similar” to the voter ID laws in Georgia and South
Carolina (p. 6). In rating the relative strictness of the laws, he describes Texas as being “in the middle” of the other two states (p. 9). Table 1 is offered as summary evidence of this assertion. Dr. Hood’s portrayal of the laws is misleading in important ways.
14. Dr. Hood describes the exception for absentee voters as an “accommodation” (p. 5). My
initial report showed that the absentee exception, in combination with limitations on who may vote absentee, in fact inappropriately creates two classes of voters (¶¶ 83and 100). Without a factual justification, SB 14 imposes a heavier burden on in-person voters, who are
15 Raymond E. Wolfinger, Benjamin Highton, and Megan Mullin (2005), “How Postregistration Laws Affect the Turnout of Citizens Registered to Vote,” State Politics & Policy Quarterly 5:1-23 16 David Primo, Matthew L. Jacobsmeier, and Jeffrey Milyo (2007), “Estimating the Impact of State Policies and Institutions with Mixed-Level Data,” State Politics & Policy Quarterly 7:446-459.
Case 2:13-cv-00193 Document 478-1 Filed in TXSD on 08/15/14 Page 4 of 9Case 2:13-cv-00193 Document 671-19 Filed in TXSD on 11/11/14 Page 202 of 207
5
disproportionately black and Latino, than on absentee voters, who are disproportionately Anglo (¶¶ 80-82 and Table 3).
15. Not imposing the ID requirement on those 65 and over may be seen as a courtesy to senior
citizens, but it also imposes a disproportionate burden on minority voters. Anglos in Texas are twice as likely as blacks to be 65 or older and nearly three times as likely as Latinos to be 65 or older.17
Likewise, the allowance for a select group of people with disabilities or who have recently experienced a natural disaster may technically be accommodations, but these two exceptions are narrowly defined and seldom used. Such narrow exceptions will have little ameliorative effect on the disproportionate burden of SB 14.
16. Dr. Hood’s Table 1 suggests that a free ID is as easy to get in Texas as in South Carolina. That is not so. Registered voters in South Carolina who lack one of the approved forms of ID may get one for free at the voter registration and elections office in every county. In Texas counties, the office may be a DPS office, a county office, or a temporary mobile unit, and Texas counties are far larger than those in South Carolina. In South Carolina, all one needs to do to obtain a voter ID is to provide date of birth and the last four digits of his or her Social Security Number. Unlike in Texas, no documents are needed.
17. Dr. Hood’s Table 1 also suggests that Georgia and Texas allow about the same number of
IDs for voting; each of the states’ columns has the same number of Xs. But the final row conceals a great number of options that are allowed in Georgia under the heading of “Federal/State/Local Government Employee ID,” including forms of ID that have nothing to do with employment. As Dr. Hood acknowledges (p. 7), this includes “any ‘valid photo ID from any branch, department, agency, or entity of the U.S Government, Georgia, or any county, municipality, authority or other entity of this state” including state universities and colleges. Acceptable sources thus include a wide range of federal employee IDs, Georgia employee IDs, county employee IDs, municipal employee IDs, and 62 state universities and colleges’ IDs.18
Thus, Table 1 would more accurately contain many Xs to indicate the various IDs that are accepted in Georgia but are not allowed in Texas. In addition, unlike in Texas, in Georgia a voter’s driver’s license may be used regardless of how long it has been expired.
18. Dr. Hood’s Table 1 also omits the critical failsafe created by South Carolina’s “reasonable impediment” provision. In South Carolina a voter without ID may bring a non-photo registration card to the polling place and sign an affidavit explaining that he or she faced a “reasonable impediment” to procuring ID. Valid impediments include such things as illness, work, transportation, lack of a birth certificate, family duties, or “any other obstacle you find reasonable.”19
17 According to 2010 Census data, 15.4% of Anglos in Texas are 65 or older, whereas only 5.6% of Hispanics and 7.6% of non-Hispanic blacks are 65 or older. Notably, these data do not distinguish between citizens and non-citizens.
As the opinion of a federal court addressing the South Carolina ID law explains, “Any reason that the voter subjectively deems reasonable will suffice, so long as it is not false” and allowing “the sweeping reasonable impediment provision in Act R54
18 http://sos.ga.gov/admin/files/acceptableID.pdf 19 South Carolina State Election Commission, http://www.scvotes.org/2012/09/24/photo_id_requirements.
Case 2:13-cv-00193 Document 478-1 Filed in TXSD on 08/15/14 Page 5 of 9Case 2:13-cv-00193 Document 671-19 Filed in TXSD on 11/11/14 Page 203 of 207
6
eliminates any disproportionate effect or material burden that South Carolina’s voter ID law otherwise might have caused.” Therefore, “all voters in South Carolina who previously voted with (or want to vote with) a non-photo voter registration card may still do so, as long as they state the reason that they have not obtained a photo ID.”20
Relevance of Scholarly Literature 19. Dr. Hood and Dr. Milyo refer to a scholarly literature examining the effects of voter ID laws,
but the research they cite is not a reliable guide in this case. They contend that studies of voter ID laws find their overall effects on turnout to be near zero. However, the studies in question are limited by the short time period and the small and non-comparable set of states being analyzed. The studies they cite rely on data collected from elections mostly conducted between 2000 and 2010. Most of those studies do not differentiate between strict voter ID laws such as SB 14 and less strict versions, such as those in many states that allow use of non-photo ID or permit a voter without an ID to cast a valid ballot after signing an affidavit affirming his or her identity. Lumping these heterogeneous types of ID requirements together obscures the potential for rather different effects.
20. Few states had strict voter ID laws in the 2000s. Georgia and Indiana enacted strict photo
voter ID laws in 2005.21 The next wave of adoptions did not take place until Kansas, Mississippi, and Tennessee were added in 2011.22
Having only two states provides little statistical “leverage” because of the sizable generalizations that must be made from a small number of unusual cases to the much larger set of hypothetical cases. Furthermore, many of the studies of voter ID effects that Dr. Milyo cites predate the recent expansion and do not account for the significant differences among ID laws across the states. SB 14 is stricter than the Georgia and Indiana laws that were the focus of those studies and has more potential to depress voter turnout.
21. The best scholarly guide to this literature is by Erikson and Minnite.23
20 South Carolina v. United States, 898 F. Supp. 2d 30, 34, 36, 40 (D.D.C. 2012) (three-judge court).
Erikson and Minnite’s article demonstrates that the inability to establish the statistical significance of voter ID laws is largely an artifact of limited statistical power. In particular, they remind researchers that there are simply too few states with comparable laws to produce reliable estimates. As they warn, “Until we have more experience with restrictive voter ID laws that are already on the books, and therefore, more data to analyze, survey findings and database matching showing thousands, perhaps millions of citizens lacking government-issued photo ID should raise red flags for policy-makers and voting rights advocates alike that these laws could prevent eligible voters from voting” (p. 98). They go on to recommend relying instead on survey and
21 Georgia’s implementation was delayed until a federal court injunction was removed in 2007. 22 See the NCSL’s compilation of voter ID laws (http://www.ncsl.org/research/elections-and-campaigns/voter-id.aspx) and Rene R. Rocha and Tesuya Matsubayashi (2014), “Politics of Race and Voter ID Laws in the States: The Return of Jim Crow?” Political Research Quarterly 67:666-679 (cited as a 2013 article by Dr. Hood in footnote 34). 23 Robert S. Erikson and Lorraine C. Minnite (2009), “Modeling Problems in the Voter Identification-Voter Turnout Debate,” Election Law Journal 8:85-101.
Case 2:13-cv-00193 Document 478-1 Filed in TXSD on 08/15/14 Page 6 of 9Case 2:13-cv-00193 Document 671-19 Filed in TXSD on 11/11/14 Page 204 of 207
7
database matching methodologies, precisely the sort of evidence plaintiffs have placed before the court in this case (p. 98).
Analyses of Voter Turnout 22. Perhaps realizing the limitations of existing studies, Dr. Hood attempts to analyze the effects
of SB 14 on voter turnout by examining recent elections in Georgia, Mississippi, and Texas that took place before and after implementation of voter ID laws. At first blush, this seems like a useful approach. However, familiarity with research on different types of elections and voters shows that it is not. Even setting aside the point in the previous paragraph about the noncomparability of voter ID laws in these three states, and even if turnout were a useful standard for judging the result of SB 14 on minority voters, Dr. Hood’s approach is uninformative. The reason is that the elections he examines are the ones least likely to be influenced by a voter ID law.
23. The elections Dr. Hood analyzes are the 2013 special primary, special primary run-off, and
special general elections in South Carolina’s first congressional district; the 2014 primary election and primary election run-off in Mississippi; and the 2013 constitutional amendment election and 2014 primary in Texas. These elections involve highly selective participation by a small number of voters relative to a federal general election, let alone a presidential election. By my rough calculations, none of these elections saw turnout higher than 20% among eligible voters and several were below 10%. It is risky to generalize about how SB 14 will operate in a statewide general election based on several elections in three states where 80% to 90% of voters did not participate.
24. Dr. Hood’s comparison is not productive for assessing the effects of the law because it could
easily result in faulty conclusions. Voters who participate in a primary election or a low salience constitutional referendum vote are unrepresentative of the general electorate and are the voters least likely to be affected significantly by a voter ID law. The voting habits of primary voters should not be generalized to other elections because these elections differ from general elections in several important ways. Primary voters are a select set of motivated individuals who wish to participate in an intra-party nomination contest. Political science research shows that—compared to general election voters—primary election voters are often more partisan, more educated, have higher incomes, have a greater sense of efficacy, and have more consistent histories of voter participation.24
24 For a brief summary of research on presidential primaries, see the following reviews of research: Brian F. Schaffner (2011), Politics, Parties, and Elections in America, 7th ed., Boston, MA: Cengage Learning. p. 174; Karen M. Kaufmann, John R. Petrocik, and Daron R. Shaw (2008), Unconventional Wisdom: Facts and Myths about American Voters, New York, NY: Oxford University Press, p. 197. State and congressional primaries are likely to be even less representative and typically generate lower levels of voter turnout.
The same skew is true in other low turnout elections such as the 2013 constitutional amendment election in Texas, but is even evident in midterm elections when they are compared to presidential elections. Voters in lower profile elections tend to possess the traits that make them least likely to have their voting habits interrupted by a change in the law. Put in terms of the calculus of voting, voters in low turnout elections have more of the resources needed to overcome the “costs” of voting
Case 2:13-cv-00193 Document 478-1 Filed in TXSD on 08/15/14 Page 7 of 9Case 2:13-cv-00193 Document 671-19 Filed in TXSD on 11/11/14 Page 205 of 207
8
and see more benefit from participating. In contrast, the electorate in a presidential contest includes voters who do not participate in other elections, who are by definition marginal and more likely to be influenced by costs imposed by election laws.
25. In addition, most of the electoral activity in this select set of elections was focused on
Republican candidates and the Republican Party. Latino voters are more likely to vote in Democratic primaries; this is even truer for black voters.25
They are unlikely to comprise many of the participants that Dr. Hood examines. In all three states, the primaries either saw higher participation in the Republican balloting or were exclusively for Republicans. Participants in these unrepresentative, idiosyncratic, low-turnout races involve mostly highly resourced Anglos. They thus have little to say about the burdens of SB 14 or its likely effects on turnout in a general election.
26. Dr. Hood also investigates the effects of Georgia’s voter ID law by comparing the 2004 and 2008 elections (Figure 1). This initially seems like a reasonable approach because 2004 and 2008 are the two presidential elections that bracketed the adoption of the law. Similarly, an unpublished report by Dr. Milyo attempts to estimate the effects of Indiana’s law on turnout by comparing the 2002 and 2006 midterm elections.26 However, this simple method suffers from what social scientists called a “confound,” specifically the problem of history.27
This makes the analysis unreliable for determining the causal effects of the law.
27. In the case of Dr. Hood’s study, the 2008 election differed from 2004 in two important ways that do not involve the presence or absence of a voter ID law. First, Barack Obama was on the ballot in 2008, but not in 2004. As the first black candidate to be nominated by a major party, he generated unusually high levels of enthusiasm and participation among black voters. Second, Georgia was more politically competitive in 2008 than in 2004. The final vote share margin between the two parties fell from 16.6 percentage points in 2004 to 5.2 percentage points in 2008. This made Georgia the seventh most competitive of the 50 states and was connected to increased campaign activity and voter participation. Due to Obama’s presence on the ballot and a more competitive campaign environment, it is unsurprising that black registration and turnout rates in Georgia increased between 2004 and 2008, notwithstanding the introduction of Georgia’s voter ID law. Dr. Hood’s inference from these data that voter ID did not impose a significant barrier to participation is unwarranted.
28. Dr. Milyo contends that the 2002 and 2006 elections “offer a nearly ideal natural experiment
for identifying the effects of photo ID on turnout. This is because there were no other major changes in Indiana election laws during this time period, so the impact of photo ID will not
25 As but one reminder of the overall preference among these groups for Democratic candidates, the 2012 national election exit polls indicate that the share voting Democratic for president was 41% among Anglos, 71% among Latinos, and 93% among blacks. 26 Jeffrey Milyo (December 2007), “The Effect of Photographic Identification on Voter Turnout in Indiana: A County-Level Analysis,” Institute of Public Policy Report 10-2007. 27 Concerns about the “history” threat to causal inference and related confounds are standard topics covered in courses on empirical research design. The classic statement appears in the textbook, Donald T. Campbell and Julian Stanley (1963), Experimental and Quasi-Experimental Designs for Research, Chicago, IL: Rand McNally.
Case 2:13-cv-00193 Document 478-1 Filed in TXSD on 08/15/14 Page 8 of 9Case 2:13-cv-00193 Document 671-19 Filed in TXSD on 11/11/14 Page 206 of 207

9
be confounded with other changes in state election administration” (p. 4). While it is true that there were no other major changes in Indiana’s elections laws in this period, Dr. Milyo overlooks any number of other confounding historical factors that bias the estimates. Among the many confounding factors he ignores are changes in the candidates, issues, and competitiveness of races between the two elections. In 2006, three incumbent members of Indiana’s congressional delegation were defeated, and a U.S. Senate seat was on the ballot, albeit in a weakly contested race. By contrast, in 2002 no House incumbent was successfully challenged and there was no U.S. Senate seat on the ballot, although there was one congressional contest for an open seat. Dr. Milyo’s simple before-and-after analysis in a single state cannot distinguish between the effects of voter ID and those due to other changes in the state’s electoral environment.
29. Beyond the methodological flaws in the approach used by Dr. Hood and Dr. Milyo is the
broader question of whether turnout analysis is the correct way to measure the burden that SB 14 places on minority voters. Voter turnout is affected by many factors, so a focus on that metric obscures the differential burden imposed by the law that must blacks and Latinos must overcome to participate in the electoral process. Putting the discussion in terms of the calculus of voting, the appropriate analysis should not simply count up what share of each racial and ethnic group paid the costs of voting. Rather, the questions are whether the state effectively charged each group a different rate and whether groups are equally able to pay the rate charged. Dr. Hood’s statement that “ID disparity only matters, however, if it ultimately causes a disparity in voter turnout” is a misguided standard for assessing the impact of SB 14 on blacks and Latinos.
I declare under penalty of perjury the foregoing is true and correct. Executed this 15th day of August, 2014.
_____________________________
Barry C. Burden
Case 2:13-cv-00193 Document 478-1 Filed in TXSD on 08/15/14 Page 9 of 9Case 2:13-cv-00193 Document 671-19 Filed in TXSD on 11/11/14 Page 207 of 207